
Abstract
Convection induced by repetitive compression of porous tissue scaffolds enhances solute transport inside the scaffold. Our previous experiments have shown that pore size, shape, and orientation with respect to strain direction greatly influence loading-induced solute transport. The objective of this study was to develop a computational model of deformation-induced solute transport in porous tissue scaffolds, which included the pore geometry of the scaffold. This geometry consisted of a cubic scaffold with single channel in the middle of the scaffold, immersed in a fluid reservoir. Cylindrical pores with circular or elliptic cross section, and spheroid pores were modeled. The scaffold was cyclically compressed from one side, causing fluid motion and dispersion of solute inside the scaffold pore. Scaffold deformation was solved using the finite element method, and fluid flow and solute transport were solved using the finite volume method. The distortion of the scaffold–fluid interface was transferred as a boundary condition to the fluid flow solver. Both convection and diffusion were included in the computations. The solute transport rates in the different scaffold pore geometries agreed well with our previous experimental results obtained with X-ray microimaging. This model will be used to explore transport properties of a spectrum of novel scaffold designs.
Introduction
A potential solution to the mass transport problem is to generate mechanically deformable scaffolds, in which pores are distorted upon application of mechanical strain to the scaffold. 9 Most tissues in the human body are continuously undergoing cyclic mechanical strain: longitudinal strains as large as 20% were measured in the interventricular septum of the heart during peak systole, 10 peak deformations in knee cartilage during single-leg lunges were found to range from 22% to 30%, 11 and strains of up to 25% were measured in the wall of the human left anterior descending coronary artery. 12 Strains of these magnitudes could induce significant solute convection in scaffolds replacing such tissues, provided that the scaffold pore geometry allows for solute convection. Application of cyclic loading has been proven to promote tissue ingrowth and improve the mechanical properties of cartilage constructs,13,14 cardiovascular constructs,15–17 smooth muscle tissue, 18 bone, 19 and fibroblast scaffolds for tendon and ligament engineering. 20
A growing number of studies are linking aspects of porous structure to mass transport and biological performance of the tissue scaffold, thereby mainly focusing on pore size. For example, in vitro cellular infiltration rates in electrospun scaffolds for cardiovascular tissue engineering were shown to vary significantly with fiber diameter and, hence, pore size. 21 Optimal pore size for scaffolds manufactured with particulate leaching is thought to lie between 100 and 500 μm, 22 depending on cell type. Increased pore size and porosity in mechanically deformable, salt-leached scaffolds enhanced cell attachment and proliferation, most likely due to increased mass transport. 23 On the other hand, a study using solid freeform fabrication (SFF) scaffolds has shown limited influence of pore size in the range of 350–800 μm on bone regeneration in vivo, 24 suggesting that it may be advantageous to explore the effects of, for example, pore shape and interconnectivity to enhance tissue ingrowth.
Since both structural deformation and fluid flow are intimately connected to geometry, the question is how is mass transport affected by pore size and shape upon mechanical deformation of the scaffold? X-ray microimaging and micro-CT have become widely used imaging modalities in biomedical research, 25 enabling imaging within opaque specimens at micrometer spatial resolution without the need to destroy the sample. Various studies have used the accurate scaffold pore geometry as obtained with micro-CT in combination with computational fluid dynamics to predict fluid transport.26–28 Gössl et al. 29 used an X-ray absorbing tracer as a surrogate for nonradiopaque nutritional solutes to quantify transendothelial transport. To measure mass transport in mechanically deforming scaffolds and investigate the effect of pore geometry, we have developed an X-ray microimaging technique 30 and showed that pore size, shape, and the orientation of the pore cross section with respect to the strain direction greatly influence mass transport. 9
Our previously published experimental tests 9 were challenging and time consuming, because they required special technologies, such as SFF, X-ray microimaging using an in-house-built X-ray scanner with custom-made compression device, and fluids and X-ray contrast agents with similar densities and viscosities. To accelerate the design of scaffolds with programmable pores, the experimental work can be reduced and guided by using validated computational models describing solute transport in porous scaffolds undergoing cyclic mechanical strain. Previously, Mauck et al. 31 developed a model of solute transport in dynamically loaded porous gels, which predicted that cyclic mechanical loading indeed enhances solute transport in gel-like materials such as natural or tissue-engineered cartilage. In this and other models of porous media,32,33 the mixture of solid matrix and fluid in the pores is described at a macroscopic scale, with representative elementary volumes that are large enough to be considered homogenous. Although these models have been instrumental in understanding the effect of cyclic deformation on global mass transport in porous media, the detailed pore geometry itself is not described in these models and distributions of solutes at the pore level cannot be determined. Yet, particularly in scaffolds for tissue engineering, it is the local distribution of nutrients that determines where cells can or cannot survive. Further, the difficulty of imaging solute distributions inside opaque porous tissue scaffolds has hindered the validation of these models against experimental data.
To overcome these limitations, we aimed in this study to develop and validate a computational model of solute transport in deforming tissue scaffolds, which includes pore geometry. The model consists of a finite element formulation of the deformation of the scaffold material, coupled to a finite volume description of fluid flow and solute transport inside the scaffold pores and surrounding fluid reservoir. The modeling approach was validated based on our previous X-ray microimaging experiments.
Materials and Methods
Summary of X-ray experiments
Experiments were described in detail elsewhere. 9 In brief, flexible cubic scaffolds were fabricated from a biodegradable polymer blend (75% polycaprolactone fumarate and 25% polypropylene fumarate) using a combined 3D printing and injection molding technique. Cubic injection molds were printed, such that scaffolds with pores consisting of a single channel through the middle of the specimen could be generated. Pores with the following cross-sectional and longitudinal shapes were designed: circular cylinder, elliptic cylinder, and spheroid (five specimens per shape). After fabrication, the scaffolds were scanned with micro-CT at 20 μm isotropic voxel resolution, to obtain their final dimensions. The imaging phantoms were attached to the bottom of a fluid reservoir placed underneath the loading platen of a custom-made compression device. The specimens were loaded with a solution of the radiopaque solute sodium iodide dissolved in glycerin (31 mg/mL). The solute distribution was quantified by recording 20 μm pixel-resolution images in an X-ray microimaging scanner at selected time points after intervals of dynamic straining with a mean strain of 8.6% ± 1.6% at 1.0 Hz.
General considerations for the computational model
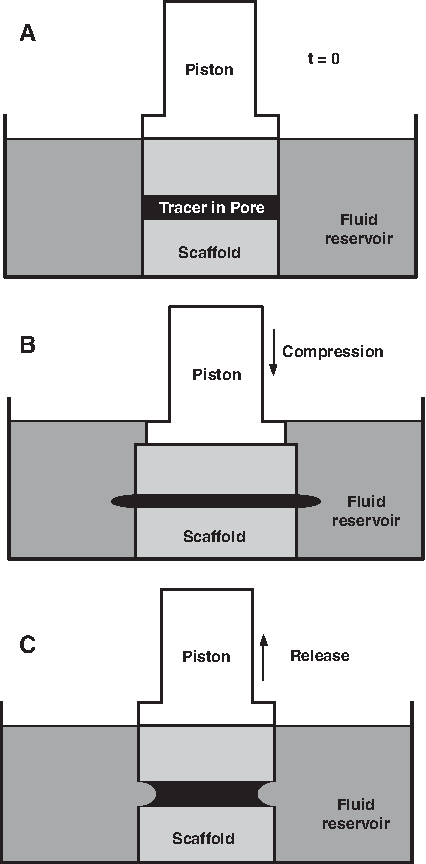
The aim of the computational model was to represent the experiment depicted in Figure 1. The model domain consisted of a solid phase (i.e., the scaffold material) and a fluid phase (i.e., the fluid inside the pore system of the scaffold and the surrounding fluid reservoir). The pore system of the scaffold was initially filled with a fluid containing the X-ray tracer (used in the experiments a surrogate for nutrients and waste products). The scaffold was then cyclically compressed, resulting in a deformation of the scaffold and movement of the fluid inside the scaffold: fluid flows out of the pores upon compression and back into the pores upon release of the scaffold. This pumping effect inside the scaffold aimed to augment removal of the X-ray contrast agent inside the scaffold as compared to diffusive transport alone. The model did not take into account the presence of cells in the pores that deplete nutrients and may influence fluid flow. Any changes in the pore geometry due to biodegradability of the scaffold material were neglected. Further, it was assumed that the scaffold material did not absorb any of the solute; that is, mass transport was only described in the pores of the scaffolds.
Schematic diagram of the model. (
Model equations
The model equations are partial differential equations, describing the physical problem in temporal and 3D spatial dimensions, where t is time and x, y, and z are the spatial coordinates.
Scaffold deformation
To describe the deformation of the scaffold, we considered a dynamic small-strain problem with a linear Hooke's law as constitutive equation. Neglecting external body forces on the scaffold material, the equation describing change in momentum for the scaffold material was given by
where σx, σy, and σz are the normal stresses, and τxy, τxz, and τyz are the shear stresses. Further, ρs is the density of the scaffold material, and us, vs, and ws are the displacements of a material point in the deforming scaffold. We considered small deformations and described the relation between the strains and the displacements using the linear relationships
Here ɛx, ɛy, and ɛz are the normal strains, and γxy, γxz, and γyz are the engineering shear strains. Assuming linear, isotropic elastic behavior, the relation between stress and strain in the scaffold was described by Hooke's law:
where E is the Young's modulus and v is the Poisson's ratio of the scaffold material.
Fluid motion
Fluid pressure and velocity of the fluid phase were described by the Navier–Stokes equations. The continuity equation was given by
where ρf is the fluid density, and uf, vf, and wf are the fluid velocity components. It should be noted that, although the fluid was assumed to be incompressible, density differences in time and space could occur due to mixing of the fluid with the X-ray contrast agent. Further, we described laminar flow of a Newtonian fluid with viscosity μ including a buoyancy source term to model density differences due to mixing with the X-ray absorbing contrast agent, which has a higher density. The momentum balance of the Navier–Stokes equation was given by
where p is the fluid pressure, ρf,0 is the density of the fluid without contrast agent and g is the gravitation constant.
Solute transport
Finally, solute transport was governed by the scalar convection–diffusion equation:
where C is the concentration of X-ray contrast agent in the fluid and D is the diffusion coefficient. The fluid density was dependent on the concentration of contrast agent (in density units [g/cm3]):
Model geometry and mesh
Consistent with the scaffold geometries obtained by micro-CT, 9 cubic scaffolds with dimensions 4.5 × 4.5 × 4.5 mm3 containing single channels in the middle were modeled. Three different types of channels were modeled (Fig. 2). The first type was a cylindrical channel with circular cross section. The influence of channel diameter was examined by modeling four different diameters. The second channel type was a cylindrical channel with elliptical cross section. Scaffolds with this channel type were compressed along the minor axis and the major axis of the elliptical cross section. The third channel type consisted of an oblong spheroid. An overview of the channel dimensions is given in Table 1.

The modeled scaffold pore geometries. (
To reduce computational time, model symmetry was used. One symmetry plane was in the middle of the scaffold and perpendicular to the channel axis, and one symmetry plane was in the middle of the scaffold and parallel to the channel axis. Hence, only a quarter of the scaffold was modeled. To take into account the fluid surrounding the scaffold, a box was modeled with an interface to the channel domain. The model dimensions of this fluid reservoir were 4.5 × 2.25 × 2.25 mm3 (height × width × depth).
Both solid and fluid phases were meshed with tetrahedral elements. In the solid mesh, a refinement toward the fluid–solid interface was included to obtain more accuracy in displacements near the channel wall. The two fluid domains (channel and reservoir) were separately meshed to allow for different initial conditions in these domains. In the reservoir, the elements were increased in size away from the channel into the fluid reservoir. Typical solid and fluid meshes are shown in Figure 3. Information about geometrical dimensions of the scaffolds and mesh statistics can be found in Table 1.
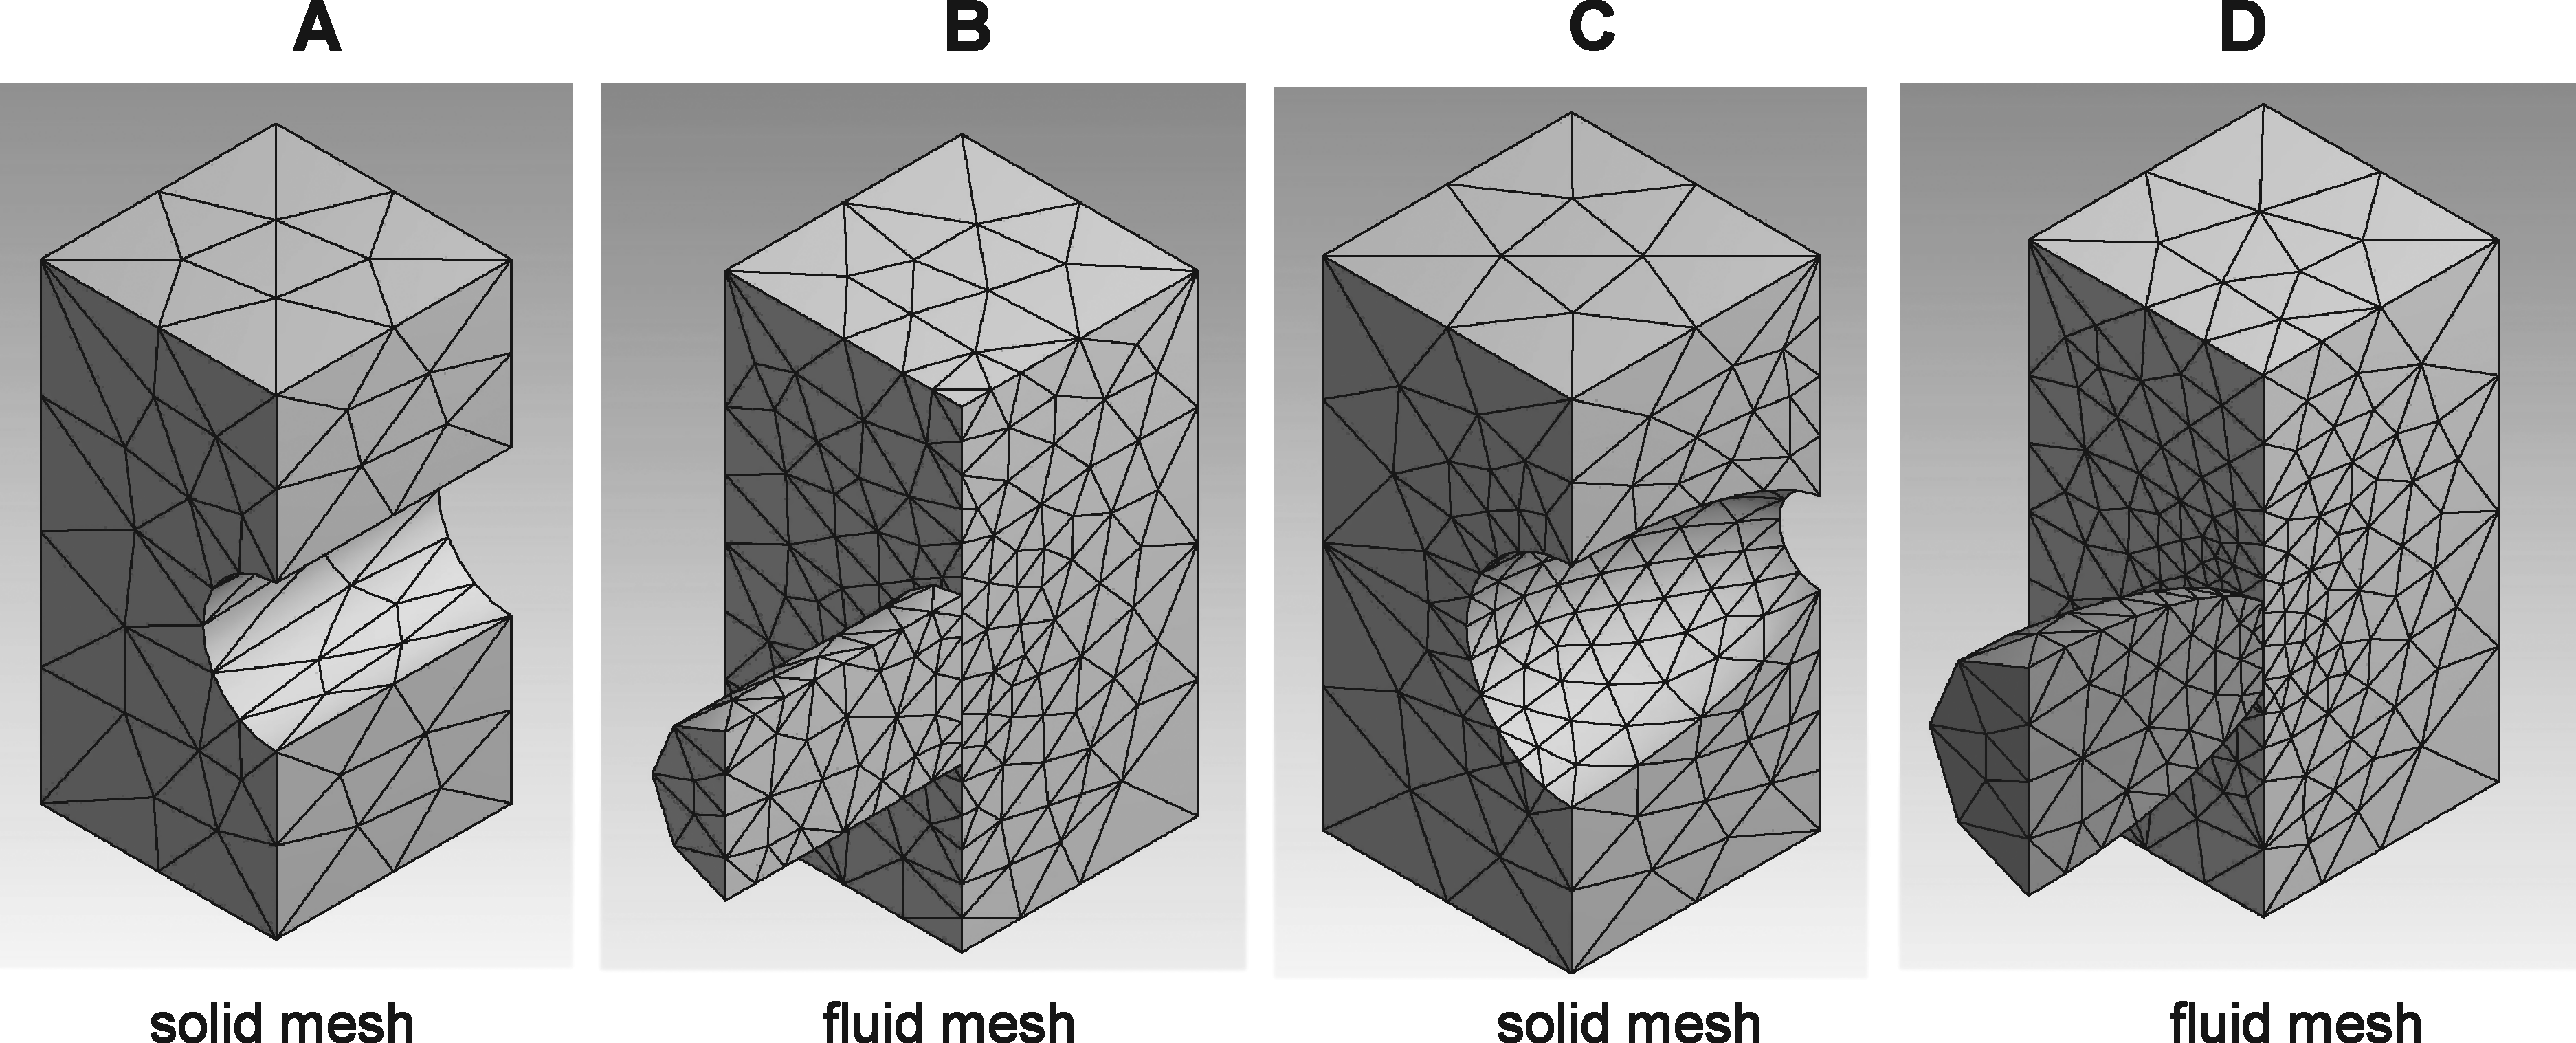
Discretization of the solid and fluid domains for numerical solution of the model partial differential equations using the finite element and finite volume methods. (
Boundary conditions
An overview of boundary conditions can be found in Figure 4. The solid phase (scaffold) was subjected to the following boundary conditions:
The displacement of the bottom face of the scaffold was set to zero in all directions (i.e., us = vs = ws = 0) The top face of the scaffold was cyclically compressed such that the vertical displacement ws followed a cosine wave:
where A is the compression amplitude and f is the compression frequency. At the two symmetry planes, the displacement perpendicular to the symmetry plane was set to zero The displacement at the interface between the scaffold and the fluid channel was used as a boundary condition in the fluid model. One-way coupling was used; that is, it was assumed that the fluid pressure and shear acting at the scaffold–channel interface during compression was negligible compared to the stresses in the scaffold material as a result of the deformation. The side faces of the scaffold were unconfined. Any fluid motion in the surrounding fluid reservoir due to deformation of the side faces was neglected.
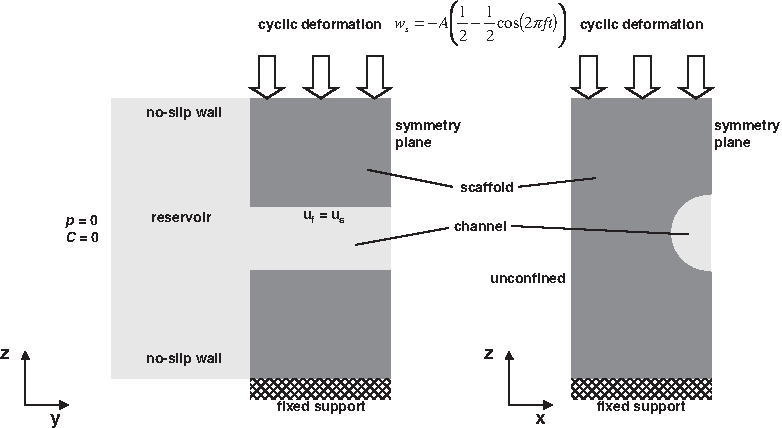
Schematic diagram of the boundary conditions used in the model.
The fluid phase (pores and fluid reservoir) was subjected to the following boundary conditions:
At the (deforming) walls of the channel, no-slip boundary conditions were implemented, meaning that the fluid velocity at the wall equals the time derivative of the scaffold material displacement at the wall, that is, solid wall velocity. It was assumed that the scaffold material did not absorb any of the contrast agent. Therefore, the solute flux through the solid channel wall was set to zero (n · ∇C = 0, where n is the vector normal to the channel wall). The side of the fluid reservoir farthest from the channel opening was set to a zero gauge pressure boundary condition, that is, p = 0. The solute concentration was also set to zero at this boundary (C = 0). At the upper and lower faces of the fluid reservoir, no-slip wall boundary conditions were implemented. At the two symmetry planes, the fluid velocity and the solute gradient normal to the symmetry plane were assumed to be zero (n · uf = 0 and n · ∇C = 0, where n is the vector normal to the symmetry plane).
Initial conditions and model parameters
At t = 0, the scaffold was assumed to be at rest and the fluid pressure and velocity were set to zero in the entire fluid domain. The concentration of solute was set to zero in the fluid reservoir and to C0 inside the channel. Model parameters are summarized in Table 2. The diffusion coefficient of the contrast agent was determined as describe in Appendix I.
Numerical implementation
Commercial software ANSYS Workbench 11.0 (ANSYS Inc., Canonsburg, PA) was used to obtain numerical solutions. In this software, the dynamic solid deformation problem was solved using the finite element method, whereas the Navier–Stokes and scalar transport equations were solved using the finite volume method. At each time step, the solid deformation problem was solved first, and the mesh displacement at the fluid–solid interface was then transferred to the fluid solver as a boundary condition in the fluid flow problem. A fixed time step of t = 0.025 s was found to be sufficiently small to obtain stable numerical results. Transient simulations were conducted until 100 s (simulation time) during cyclic compression or until 300 s without cyclic compression. The simulations were carried out on a 2.4 GHz AMD Opteron server with 16 GB memory running SUSE Linux 9. Computation time per run was approximately 5 h.
Results
Passive removal
Without application of compression, natural convection as a result of gravitation, more so than diffusion, slowly removes some of the denser contrast agent at the openings of the channel into the surrounding fluid reservoir. This effect is captured in the model by including the gravitational term in the momentum equation (Eq. 5). Figure 5A compares X-ray images with model simulations of the change in contrast agent distribution due to this passive removal. Quantification of the image data shows that model simulations and experimental data agree well (Fig. 5B).

X-ray data and computational fluid dynamics model results compared during passive (gravitation induced) removal of contrast agent from the scaffold channel. (
Compression-induced removal
Upon application of 8.6% cyclic compression to the scaffolds at 1.0 Hz, the contrast agent inside the scaffold channel is dispersed into the surrounding fluid reservoir. Figure 6 shows X-ray and computed images of the spatial distributions of the contrast agent inside different channels at t = 0 (i.e., right after injection of the contrast agent into the channel) and after 100 cycles of compression at 1.0 Hz. The distributions obtained by the model are compared to the X-ray data.
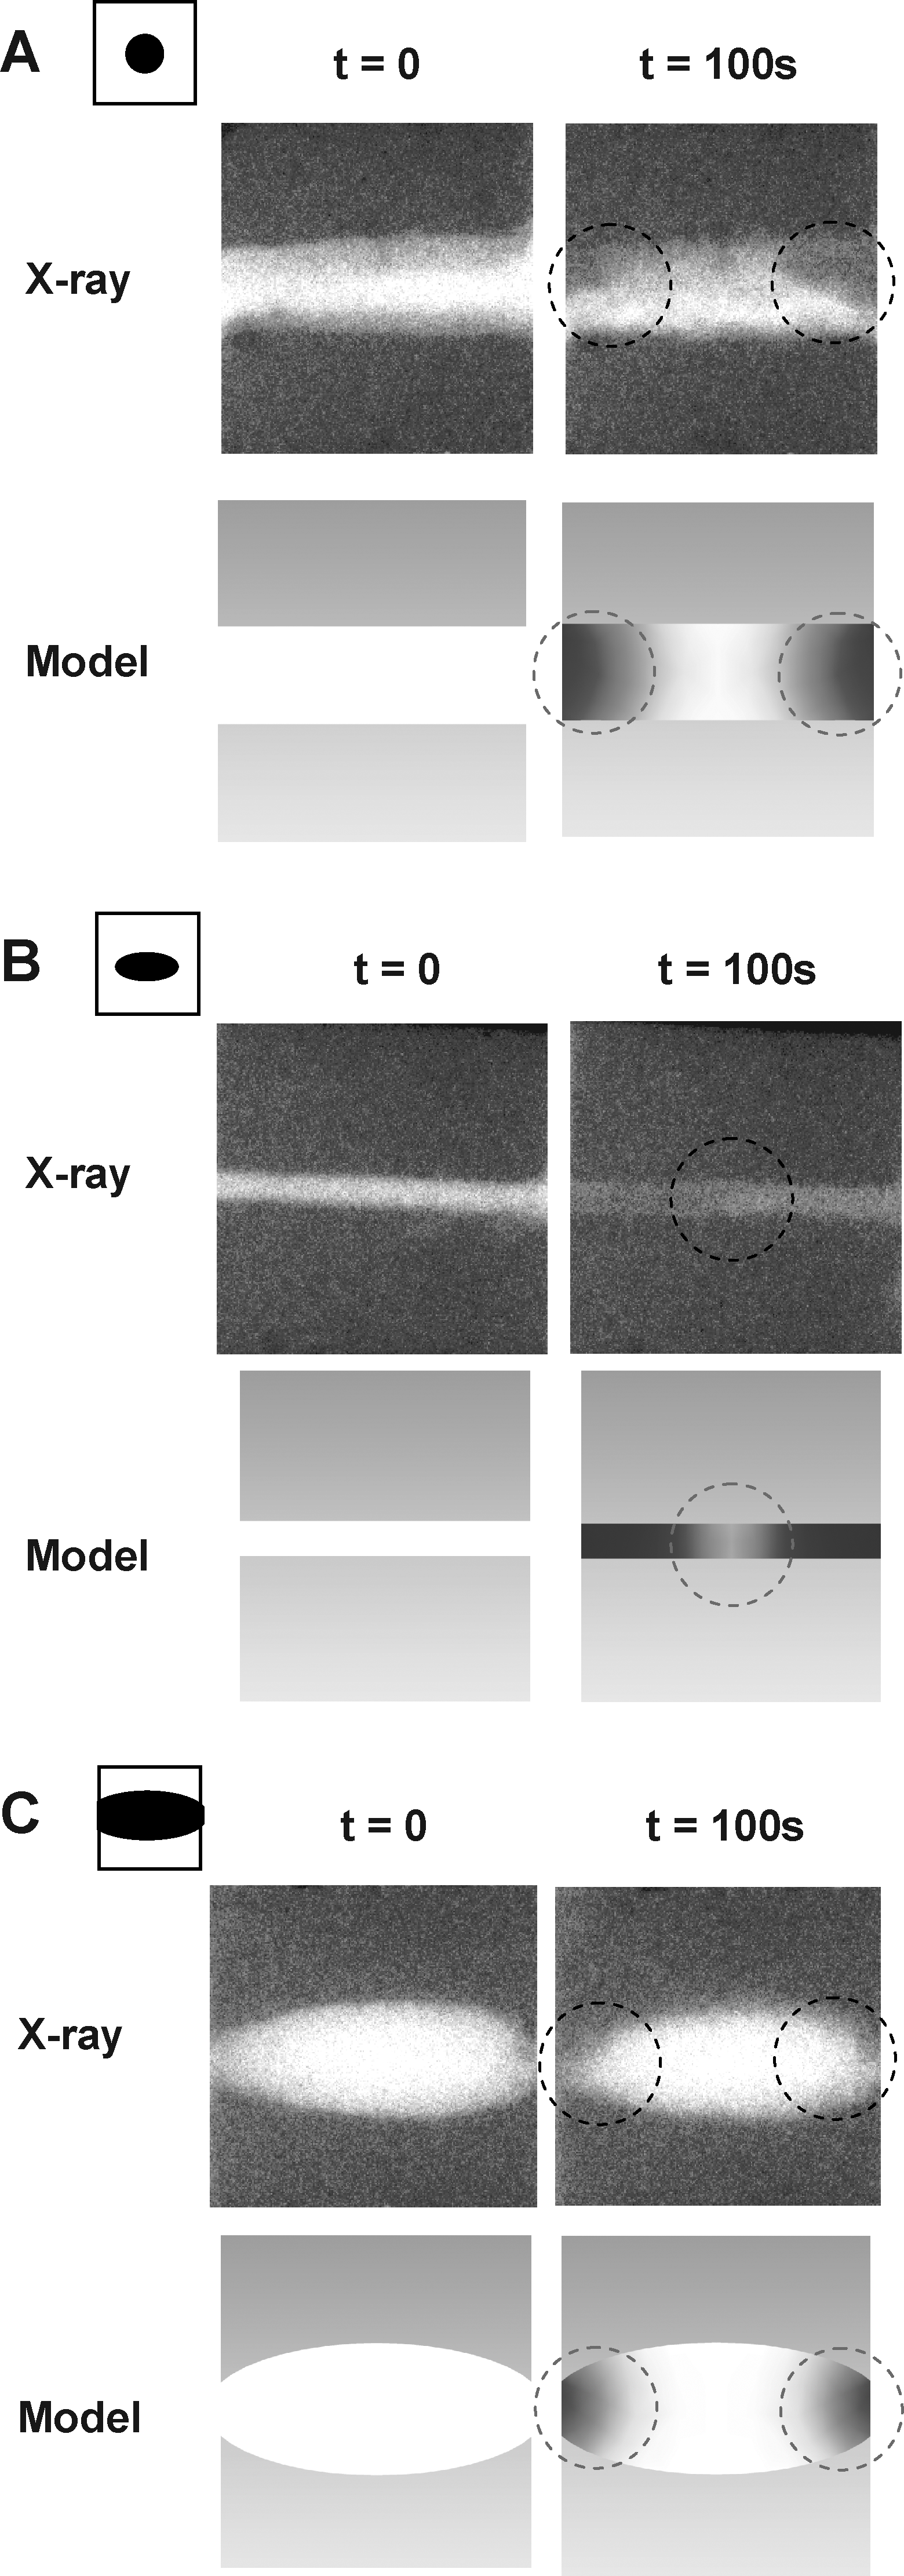
X-ray data and computational fluid dynamics model results compared during compression-induced removal of contrast agent from the scaffold channel. (
The model simulations were quantitatively compared to the experimental data by computing the average iodine concentration inside the pores. Figure 7A shows very good agreement of the model simulations with the data for the pore with elliptic cross section, as compressed along its minor and major axis. Note that changing the direction of cyclic strain yields very different transport rates for this scaffold. Figure 7B compares the model simulations to the experimental data for the spheroid pore, the circular pores with d = 0.37 mm and d = 1.38 mm. The model slightly overestimates the compression-induced removal for the scaffold with the spheroidal pore. Figure 7C illustrates the excellent agreement of model and data for the percentage of iodine removed after 100 s for the different channels. The different pore geometries show very different rates of solute transport under cyclic compression, indicating the absolute importance of incorporating the pore geometry in the computational model.
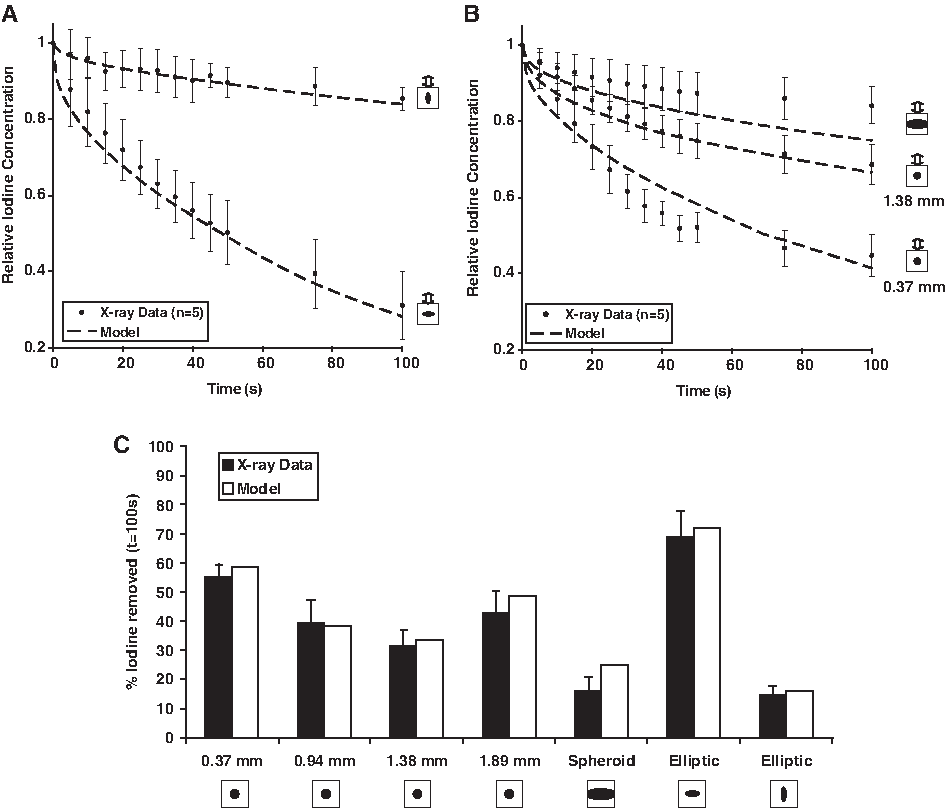
Model-predicted relative iodine concentration in (
We used the validated model to explore the effect of altering the diffusion coefficient D, the fluid viscosity μ and density ρf, and the maximum solute concentration C0 (Table 3). These simulations were carried out for the scaffold with the 1.0 mm circular pore with a compression of 8.6% at 1.0 Hz. For the diffusion coefficient, we explored values that are typical for physiologically relevant solutes such as albumin, glucose, and oxygen. As expected, higher diffusion coefficients resulted in lower solute concentrations at t = 100 s, although this effect was found to be minimal. For the viscosity, we explored a range of values, among which those for plasma and blood. The solute removal did not appear to be sensitive to the viscosity for the range of values simulated. The model also appeared to be insensitive to neglecting the density difference caused by the initial solute concentration C0 as a result of the heavier X-ray tracer, and to reducing the fluid density to a value representative for water (instead of glycerol). Taken together, these simulations increase our confidence that the results obtained under the experimental conditions (using iodine in glycerol) are also relevant for physiological conditions (e.g., involving albumin, glucose, or oxygen in water, plasma, or blood).
Discussion
A fluid–structure interaction model of solute transport in deformable scaffolds with pores of different shapes and dimensions was developed and validated. The model yielded good agreement with experimentally obtained X-ray imaging data of a contrast agent inside the pores of cyclically deformed biodegradable scaffolds. The significant impact of pore shape and orientation of the pore cross section with respect to the direction of strain demonstrated that pore geometry is an important factor in a computational model of solute transport in the pores of deformable scaffolds. Considering the increasing use of rapid prototyping technologies to manufacture scaffolds with pre-designed pore architectures, 34 a geometry-based computational model of solute transport can accelerate iterative design processes of novel scaffolds by rapidly evaluating a number of designs in silica, thereby limiting the costly and time-consuming experimental evaluation to only the most promising candidate pore architectures.
Previous models of cyclically compressed porous media31–33
that use the biphasic mixture theory generally incorporate the pore geometry into Darcy's permeability constant, which is a statistical average. Darcy's law can be used to relate the average fluid velocity uf through the scaffold to the pressure difference across the scaffold ΔP via the permeability constant K and the fluid viscosity μ:
The permeability K is a function of the scaffold pore architecture and porosity, 35 and has proven a useful predictor for biological outcomes such as tissue ingrowth. For example, it was shown in cancellous bone grafts implanted in rabbits that a threshold permeability exists, below which revascularization and the formation of osteoblasts and fibrous tissues could not be attained. 36 High scaffold permeability as provided by well-interconnected pores is suggested to be essential to provide the space for vascular tissue ingrowth followed by new tissue formation.37,38 The use of a lumped parameter for permeability is computationally efficient, especially when dealing with scaffold pore geometries that are difficult to model, which is often the case in hydrogels or scaffolds fabricated using a particulate-leaching or gas-foaming method. However, with the emerging availability of solid freeform fabrication methods, it becomes possible to program the scaffold pore geometry with computer-aided design software,39,40 such that the scaffold mass transport properties are reproducible and more accurately predictable at the pore level before actual fabrication of the scaffold. These accurate predictions require a thoroughly validated, 3D numerical model of mass transport in the scaffold pores, incorporating the precise pore geometry from the initial computer-aided design data. Such a model will allow for the rapid exploration of transport properties of a wide range of pore architectures before actual fabrication and experimental testing.
Potential limitations
We used scaffolds with single straight pores with various shapes, whereas more realistic scaffolds would have pore labyrinths comprised of interconnected channels in three dimensions. It is unknown if pore geometry itself will play an important role in whole scaffolds, as interconnectivity and fenestration size are likely key parameters when entire pore networks are considered. The first goal of our study, however, was to develop a thoroughly validated computational model of fluid and mass transport in cyclically deforming scaffold pores. Since the experiments require a rather complicated imaging setup, we have initially restricted ourselves to scaffolds with simple pores. Future work will move into the direction of imaging and modeling mass transport in scaffolds with more complicate pore networks. Dynamic imaging of the distribution of a contrast agent in opaque samples in three dimensions requires fast tomographic imaging techniques, which may be possible in the near future with high-speed X-ray microimaging, 41 or using a cryostatic micro-CT method 42 in which specimens are snap-frozen during the solute transport process and scanned while frozen. In addition, our modeling approach possesses the capability to describe more complex 3D pore networks, as it is based on the exact geometry of the scaffold design. Figure 8 demonstrates the feasibility to model transport in dynamically deforming interconnected channels. Describing more complex pore systems with the present model is limited by the available computational hardware.
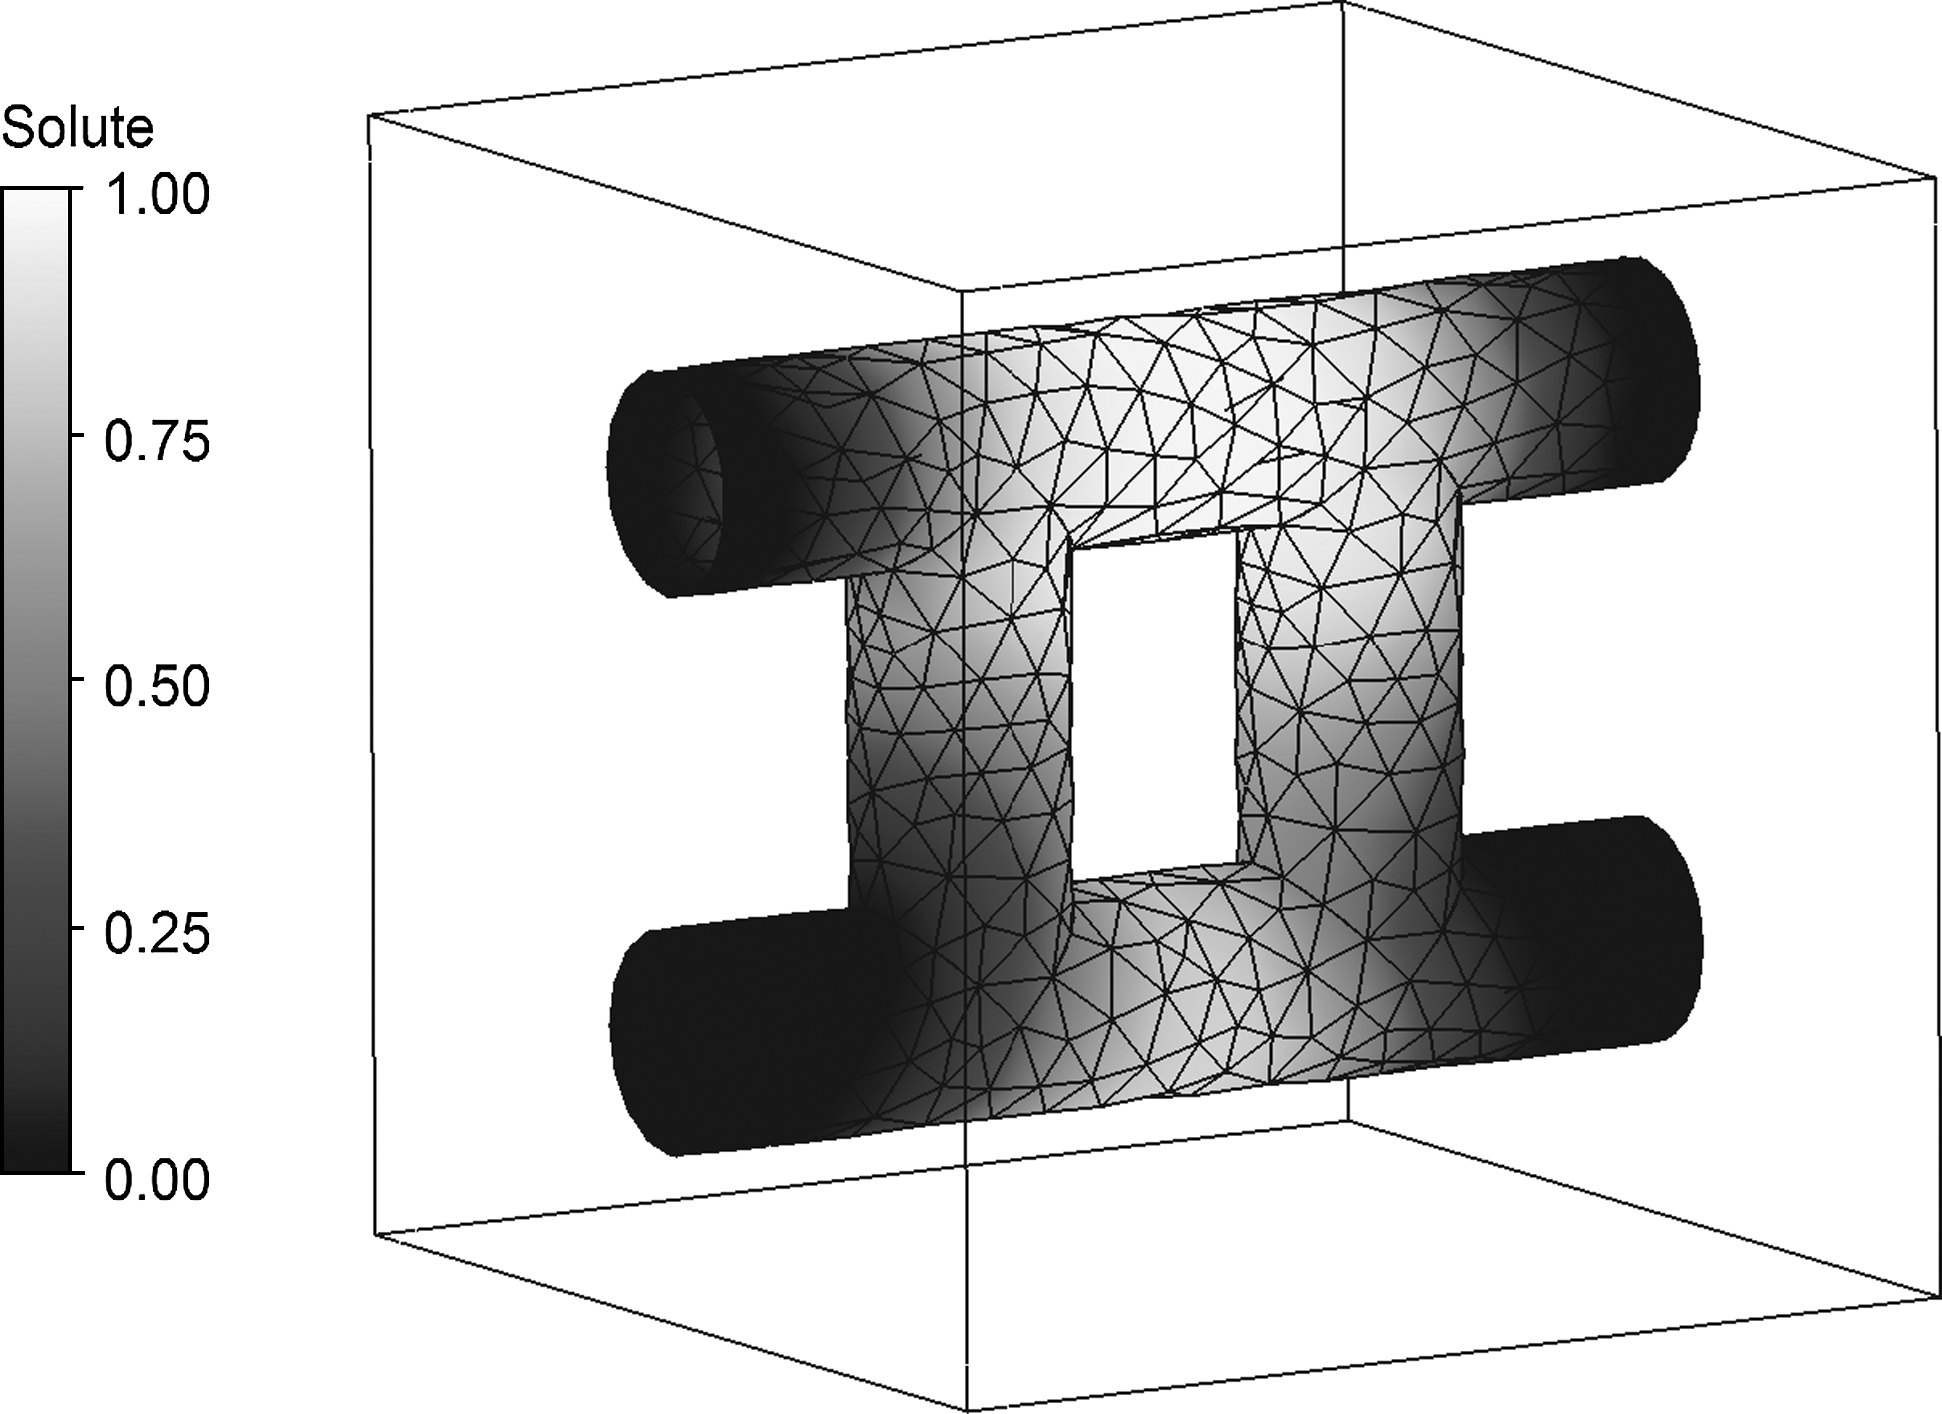
Model predicted distribution of solute at t = 100 s inside a scaffold with interconnected circular channels (d = 1.0 mm) upon compression-induced cyclic deformation with 15% strain at 1.0 Hz.
In addition, in whole scaffolds with more complex pore networks, cyclic loading will not result in uniform deformation of the pores. Pores deep inside the scaffold, where enhancing mass transport is most important, are likely to experience less strain. Therefore, a scaffold that possesses optimal mass transport properties under cyclic loading is expected to have a nonuniform pore design. Techniques exist to achieve scaffolds with anisotropic pore architecture and have been used to mimic the complex zonal organization of cartilage with promising results. 43 Since our modeling approach is based on the exact pore geometry of the scaffold, a nonuniform pore design could be included in the computations. We expect that once our model is further developed and validated for whole scaffolds with more realistic pore networks, it could prove valuable in the design optimization of nonuniform scaffold-pore architectures, which preferentially enhance transport in the deeper layers of the scaffolds where it is most needed.
The current model contains several simplifications, which were made to reduce computation time and/or because additional parameters were lacking. First, the scaffold deformation model pushes the limits of the small strain theory at the ∼10% strain used here. In addition, the scaffold material characteristics were assumed to be linear and isotropic, whereas a nonlinear stress–strain curve is often observed in polymers. 44 If a more elaborate description of the mechanical behavior of the scaffold is desired, these limitations can be addressed by including large deflection theory and/or a more complex material model. Considering the coupling of solid and fluid, the model assumed one-way coupling; that is, the pressure of the fluid acting on the scaffold wall was neglected. Two-way coupling, that is, including the force of the fluid acting on the scaffold material, may need to be included when scaffolds of higher porosity with thinner membranes of scaffold material are modeled. In this case, the fluid pressure and shear stresses may have a significant impact on the scaffold matrix deformation.
With respect to the fluid model, we assumed laminar flow, which seems a reasonable assumption considering the small pore dimensions. The Reynolds's number (Re) is given by:
where d is the channel diameter.
Assuming water as the fluid (ρf = 1.0 × 10³ kg/m3 and μ = 1.0 × 10⁻³ Pa.s), a fluid velocity of uf = 5 mm/s, and a channel diameter of 1.0 mm, we found that Re = 5. This is well below the Reynolds number at which a flow typically changes to turbulence (Re = 2000). Still, turbulence may occur at sharp transitions in the geometry or at higher compression frequencies and amplitudes. Turbulence could increase solute mixing and dispersion, and may be included in the model by, for example, the empirical k-ɛ model. 45 At the scaffold–fluid interface, no-slip wall boundary conditions were assumed. Roughness of the scaffold surface was not taken into account, which may alter the fluid flow in regions near the scaffold wall. The fluid flow at the wall may have an impact on the distribution of solutes near the wall, and hence the nutrient supply of cells attached to the scaffold surface. Additionally, an improved fluid mesh in the model near the scaffold wall will yield a more accurate prediction of fluid shear stress, which, in addition to nutrient supply, could have an important effect on the proliferation, distribution, and differentiation of cells. 46 Despite these limitations, the current model yielded a good quantitative prediction of the average solute transport rate in scaffolds with different pore geometries, and could be further improved if more accurate quantitative information on, for example, scaffold mechanical behavior, turbulence, and wall shear stress is desired.
In conclusion, cyclic compression increases solute convection by cyclic fluid motion and subsequent spreading of solutes dissolved in the fluid. The efficiency of the cyclic pumping can be increased by considering the strain direction and manufacturing pores with highly deformable cross-sectional geometries. Thus, careful design and fabrication of deformable porous tissue scaffolds may be a strategy through which solutes can be transported beyond the diffusion limit after implantation of constructs with clinically relevant thicknesses. Our proposed computational model will aid such scaffold design.
Footnotes
Acknowledgments
This work was funded in part by Mayo Graduate School and NIH Grant EB000305. The authors thank the Division of Engineering of Mayo Clinic for software and hardware support for the model simulations.
Disclosure Statement
No competing financial interests exist.
Appendix I. Measurement of the Diffusion Constant of Sodium Iodide
The diffusion coefficient of sodium iodide (NaI) in glycerol was measured by carefully pouring a layer of the NaI–glycerin solution in a vial containing glycerin only. This created a two-layer system, with NaI–glycerin at the bottom. The upward diffusion of NaI from the bottom layer into the top layer was imaged using projection X-ray over a period of 7 h (Fig. A1). To quantify the diffusion coefficient, a line profile of the density values along the longitudinal axis of the vial was measured after 7 h. The following analytical solution of the 1D-diffusion equation was then be fitted to this line-profile:
where C/C0 is the NaI concentration relative to the initial concentration in the bottom layer, x is the absolute position, and x0 is the position of the two-layer interface. Further, D is the diffusion coefficient, t is the time, and erf is the error-function. D was calculated (8.0 × 10⁻⁸ cm2/s) using the Levenberg–Marquardt nonlinear least-squares curve fitting algorithm with both x0 and D as adjustable parameters (Fig. A1).
This work was performed at Mayo Clinic, Rochester, Minnesota.