
Abstract
Vascularization strategies in cell-based bone tissue engineering depend on optimal culture conditions. The present study aimed to determine optimal cell culture medium and cell ratio for cocultures of human marrow stromal cells (HMSCs) and human umbilical vein endothelial cells (HUVECs) in view of both osteogenic and angiogenic outcome parameters upon two-dimensional and three-dimensional culture conditions. Cultures were performed in four different media: osteoblastic cell proliferation medium, osteogenic medium (OM), endothelial medium, and a 1:1 mixture of the latter two media. Mineralization within the cocultures was observed only in OM. Subsequent experiments in OM showed that alkaline phosphatase activity, mineralization, and CD31+ staining were highest for cocultures at a 50:50 HMSC/HUVEC ratio. Therefore, the results from the present study show that a HMSC/HUVEC coculture ratio of 50:50 in OM is the best combination to obtain both osteogenic and angiogenic differentiation.
Introduction
In view of the available literature on coculture systems of OBs and ECs, it is remarkable that no consensus exists on the optimal conditions for such a culture. All reports dealing with this topic describe different experimental setups regarding cell ratio and culture medium (see Table 1). Generally, these setups compared cocultures with monocultures in terms of either osteogenesis or angiogenesis, and only a limited number of studies focused on both. It is commonly assumed that osteogenesis and angiogenesis benefit from coculture compared with monoculture in both in vitro6,8,10,11 and in vivo settings.7,16–21 However, data on the optimal culture conditions for such cocultures are lacking, and more specifically data that take both osteogenic and angiogenic outcome parameters into account. The few studies that reported data on cocultures used a single type of culture medium in combination with either only osteogenic or angiogenic outcome parameters. For instance, Villars et al. cocultured different cell ratios (4:1–1:4) of human marrow stromal cells (HMSCs)/ECs in proliferation medium (PM) for OBs. The results demonstrated that higher ALP activity could be achieved with the ratios of 2:1–1:2. 6 Kaigler et al. also cocultured various ratios (1:1–10:1) of HMSCs/ECs in 1:1 mixture of PM/EC medium (EM) and found higher ALP activity in the ratio of 1:1. 7 Rouwkema et al. cultured cell pellets of HMSCs/ECs at different cell ratios (99:1–50:50) in osteogenic medium (OM) and found an optimal CD31 staining in the 50:50 coculture, although they assumed that the ratios of 98:2 and 95:5 would be beneficial for the formation of vessel-like structures. 11
OBs, osteoblasts; ECs, endothelial cells; MSCs, mesenchymal stromal/stem cells; EPCs, endothelial progenitor cells; PM, proliferation medium (for OBs); OM, osteogenic medium; EM, endothelial cell medium; MIX-1, 1:1 mixture of OM/EM; MIX-2, 1:1 mixture of PM/EM.
Based on the aforementioned, we aim to structurally evaluate both osteogenic and angiogenic outcome parameters for cocultures of OBs/ECs using different cell ratios and culture media, to elucidate optimal coculture conditions for OBs and ECs. Therefore, the experimental setup involved coculture of HMSCs and human umbilical vein ECs (HUVECs) at different cell ratios (98:2–10:90) in different culture media in both two-dimensional (2D) (well plates) and three-dimensional (3D) (cell pellets) cultures. For comparison, monocultures of HMSCs (100:0) and HUVECs (0:100) were enrolled. Outcome parameters were cell differentiation and mineralization for osteogenesis and immunological staining of endothelial marker for angiogenesis.
Materials and Methods
Isolation, expansion, and characterization of HMSCs
HMSCs were isolated from bone blocks of human iliac crest biopsies of donors. The biopsies were discarded tissues during standard surgical procedures at Radboud University Nijmegen Medical Center (Nijmegen, The Netherlands). The bone blocks were cut into small pieces and subsequently placed in a 50 mL tube to which 20 mL alpha-minimal essential medium was added. After that the tube was shaken vigorously and the medium with cells was collected. This procedure was repeated several times. The collected medium with cells was plated in culture flasks (T175; Greiner Bio-one) and expanded in PM (see Table 2). Cells were cultured at 37°C in a humid atmosphere with 5% CO2 and passaged at ∼80% confluency using trypsin EDTA (Gibco). After the first generation, cells were plated at a density of 5,000 cells/cm2 in culture flasks (T175). The culture medium was changed twice a week. Cells from passage 3 or 4 were used in the experiment. Before coculture experiments, cells were retrieved by trypsin digestion and characterized by fluorescence-activated cell sorting (Becton Dickinson Biosciences [BD]) analysis. Cell aliquots (100,000 cells) were washed with fluorescence-activated cell sorting buffer (phosphate-buffered saline [PBS] containing 1% bovine serum albumin) and stained with allophycocyanin-, fluorescein isothiocyanate-, or phycoerythrin-conjugated monoclonal antibodies against human CD29, CD44, CD90, CD105, and CD31 and negative control isotypes IgG1 and IgG2b. CD105 was purchased from Ancell, and all the other antibodies were from BD. Additionally, the mineralization capacity of each HMSC isolation was evaluated in T75 flasks by both observation using inverted light microscope (Leica DFC 290) and von Kossa staining.
Culture of HUVECs
HUVECs were purchased from BD. Cells were cultured in EM (see Table 2) at 37°C in a humid atmosphere with 5% CO2 according to the guidelines provided by BD. The medium was changed twice a week. Cells from passage 3 or 4 were used in the experiment.
2D culture experiments
Groups and cell seeding
HMSCs and HUVECs were cultured at different cell ratios (HMSCs:HUVECs, 100:0, 98:2, 95:5, 90:10, 80:20, 50:50, 40:60, 20:80, 10:90, and 0:100) in 4 different culture media (detailed information on the content of the media is listed in Table 2); monocultures of HMSCs (100:0) or HUVECs (0:100) served as controls. Cell suspensions were prepared at appropriate ratio and cells were seeded in 24-well plates (Greiner Bio-one) at 10,000 cells/well in 1 mL medium. The medium was changed twice a week. Cell cultures were observed using an inverted light microscopy during the culture period. Measurements for all assays were performed in triplicate (n = 3).
Cell metabolic activity
Cell metabolic activity was measured using AlamarBlue assay (Invitrogen) according to the instructions of the manufacturer. Briefly, AlamarBlue solution was prepared by mixing AlamarBlue with the culture medium in a ratio of 1:9 (v/v). After selected culture periods, cell metabolic activity was measured as described hereafter. The medium was removed and 1 mL of AlamarBlue solution was added to each well, and then the plates were incubated (37°C, 5% CO2) for 4 h. The medium-only group served as blank control. After incubation, 200 μL of the AlamarBlue solution of each well was transferred to 96-well plates (Greiner Bio-one). Fluorescence was measured using a microplate reader (FL 600; Bio-Tek) at 570 nm. The final values of each group were determined by subtracting the values of the blank control.
Cellular DNA content
Cellular DNA content was measured using Quant-iT™ Picogreen Kit (Invitrogen) according to the instructions of the manufacturer. Samples were prepared by washing the cells layers twice with PBS and adding 1 mL of MilliQ to each well, after which repetitive freezing (−80°C) and thawing (37°C) cycles were performed. For the standard curve, serial dilutions of dsDNA stock were prepared to final concentrations of 0–2000 ng/mL. Next, 100 μL of either sample or standard was added to the wells, followed by 100 μL of working solution. Then, the plates were incubated in the dark for 5 min at room temperature. The absorbance of the samples was read using a microplate reader at 450 nm.
ALP activity
ALP activity was measured using the same samples as described for the cellular DNA content measurement. For the assay, 80 μL of sample and 20 μL of buffer solution (0.5 M 2-amino-2-methyl-1-propanol) were added in 96-well plates. Then, 100 μL of substrate solution (5 nM p-nitrophenyl phosphate) was added in all the wells and the plates were incubated (37°C, 5% CO2) for 1 h. The reaction was stopped by adding 100 μL of stop solution (0.3 M NaOH). For the standard curve, serial dilutions of 4-nitrophenol were added to final amount of 0–25 nmol. The absorbance of the samples was read using an ELISA microplate reader (EL 800; Bio-Tek) at 405 nm. ALP activity was normalized for DNA content.
Mineralization
Mineralization was measured using a calcium assay (orthocresolphtalein complexone; Sigma). For sampling, cell layers were washed twice with PBS, after which 1 mL of 0.5 N acetic acid was added to each well and the plates were incubated on a shaking table overnight at room temperature. Subsequently, the samples were stored at −20°C until measurement. For the biochemical assay, 10 μL of sample or standard was pipetted in a 96-well plate, followed by the addition of 300 μL working solution. Working solution consisted of 5 mL of orthocresolphtalein complexone solution, 5 mL of 14.8 M ethanolamine/boric acid buffer (pH = 11), 2 mL of 8-hydroxyquinoline (1 g in 20 mL 95% ethanol), and 88 mL of MilliQ. For the standard curve, serial dilutions of calcium stock (CaCl2) were prepared to final concentrations of 0–100 μg/mL. The plates were incubated at room temperature for 10 min and the absorbance was afterward read using an ELISA microplate reader at 570 nm.
3D culture experiments
Generation of cell pellets
Different cell ratios of HMSCs and HUVECs were pooled to a total of 500,000 cells in 15 mL tubes (Greiner Bio-one) (n = 3). The cells were centrifuged at relative centrifugal force (RCF) of 400g for 4 min. Then, the supernatant was removed and the cells were resuspended in 4 mL of OM. The cells were centrifuged again at RCF of 700g for 5 min, after which the tubes were incubated (37°C, 5% CO2). The cell pellets were cultured for 10 days, during which the medium was changed on days 4 and 8.
Immunohistochemical staining
To observe EC distribution within the cell pellets, platelet/endothelial cell adhesion molecule-1 (CD31) staining was applied on cryo-sections from the cell pellets that were embedded in Oct Embedding Matrix (CellPath Ltd). Sections (6 μm thickness) were cut with a cryotome (Microm HM 560) and fixed in cold acetone for 10 min before air-drying for 30 min. Sections were incubated with 1:40 diluted monoclonal mouse anti-human CD31 primary antibody (clone JC70A; Dako) for 1 h at room temperature. Subsequently, sections were washed with PBS for 10 min and incubated with the secondary antibody (Powervision, Poly-horse radish peroxidase–anti-mouse immunoglobulin; ImmunoLogic) for 30 min. After washing with PBS, slides were developed with the substrate diaminobenzidine (Powervision DAB Substrate Kit; ImmunoLogic) and weakly counterstained with hematoxylin (Mayer). Finally, the sections were dehydrated and mounted. Images were taken using an automatic microscope (Zeiss). CD31+ areas were pseudo-colored, and Leica Qwin Imaging System (Leica BV) was used to count the area percentage CD31-staining in the cross sections.
Statistical analysis
The data are presented as mean ± standard deviation. Statistical analysis was performed with GraphPad Instat 3 software (GraphPad Software Inc.) using analysis of variance combined with the posthoc Tukey Multiple Comparisons test or a Dunnett Multiple Comparisons test. Results were considered significant at p < 0.05.
Results
HMSC isolation, expansion, and characterization
A total number of 10 biopsies were obtained from human donors for the isolation and expansion of HMSCs. Characterization of the HMSCs from these isolates showed consistent expression of CD29, CD44, CD90, and CD105, whereas CD31 was not expressed (data not shown). Further, seven HMSC isolates showed mineralizing capacity by optical evaluation and von Kossa staining (data not shown).
Because of insufficient cell numbers, three isolates were excluded from experiments. The remaining four isolates showed similar results in the (co)culture experiments performed. Consequently, the results obtained with HMSCs from one representative donor are presented below.
Optimization of culture medium
Cocultures of HMSCs and HUVECs and monocultures of HMSCs or HUVECs were carried out using different culture media (Table 2) in 2D culture systems. Cocultures and monocultures were qualitatively evaluated using light microscopic analysis. Cell metabolic activity and mineralization were used as output parameters to quantitatively evaluate cellular performance in these different culture media.
Light microscopic observation of all cocultures (98:2–50:50) and the HMSC monoculture showed normal cell morphology and an increase of cell numbers during culture time. In contrast, HUVEC monoculture demonstrated culture medium-dependent characteristics. HUVEC monoculture showed altered morphology in PM and OM, associated with a decline in cell numbers during time. In EM and MIX, HUVEC monoculture showed normal cell morphology and increasing cell numbers during cell culture.
Cell metabolic activity was assessed on days 15 and 21 after cell seeding. In general, cocultures showed a higher cell metabolic activity than both HMSC and HUVEC monocultures (Fig. 1A). Cell metabolic activity results for the various cocultures showed similarly high values for OM and EM, whereas lower values were obtained when cell culture was performed with PM or MIX. For HMSC monoculture, equally high cell metabolic activity values were measured in OM, EM, and MIX, whereas significantly lower values (p < 0.01) were obtained in PM. On the other hand, HUVEC monoculture showed the highest cell metabolic activity in EM and MIX, whereas OM and PM displayed low metabolic activity.

Cell metabolic activity and calcium content in different culture media (n = 3).
Mineralization was assessed by measuring calcium deposition in the extracellular matrix after 24 days of culture in the different media. The results showed that mineralization only occurred in the cocultures in OM (Fig. 1B). Cocultures showed substantial mineralization, especially those at a ratio of 50:50. HMSC monocultures showed only limited mineralization, whereas mineralization was absent in HUVEC monocultures.
Optimization of cell ratio
To determine the optimal ratio of HMSC and HUVEC in coculture, cells were cocultured at different ratios (98:2–10:90) in both 2D and 3D culture systems. The culture medium used in these experiments was OM, as only this medium was capable of inducing mineralization (see above). Cell morphology demonstrated to be normal for (co)cultures with high HMSC percentage (100%–50%), whereas abnormal cell morphology and even cell death was observed for (co)cultures with high HUVEC percentage (60%–100%; Fig. 2A, B). The results of cell metabolic activity confirmed these results, showing relatively high metabolic activity in (co)cultures with high HMSC percentage and substantially decreased metabolic activity in (co)cultures with high HUVEC percentage (Fig. 2C). Moreover, cell pellets could hardly be formed for (co)cultures containing high HUVEC percentages due to the nonviability of the cells. Consequently, (co)cultures with high HUVEC percentages (>50%) were excluded from the experiments.
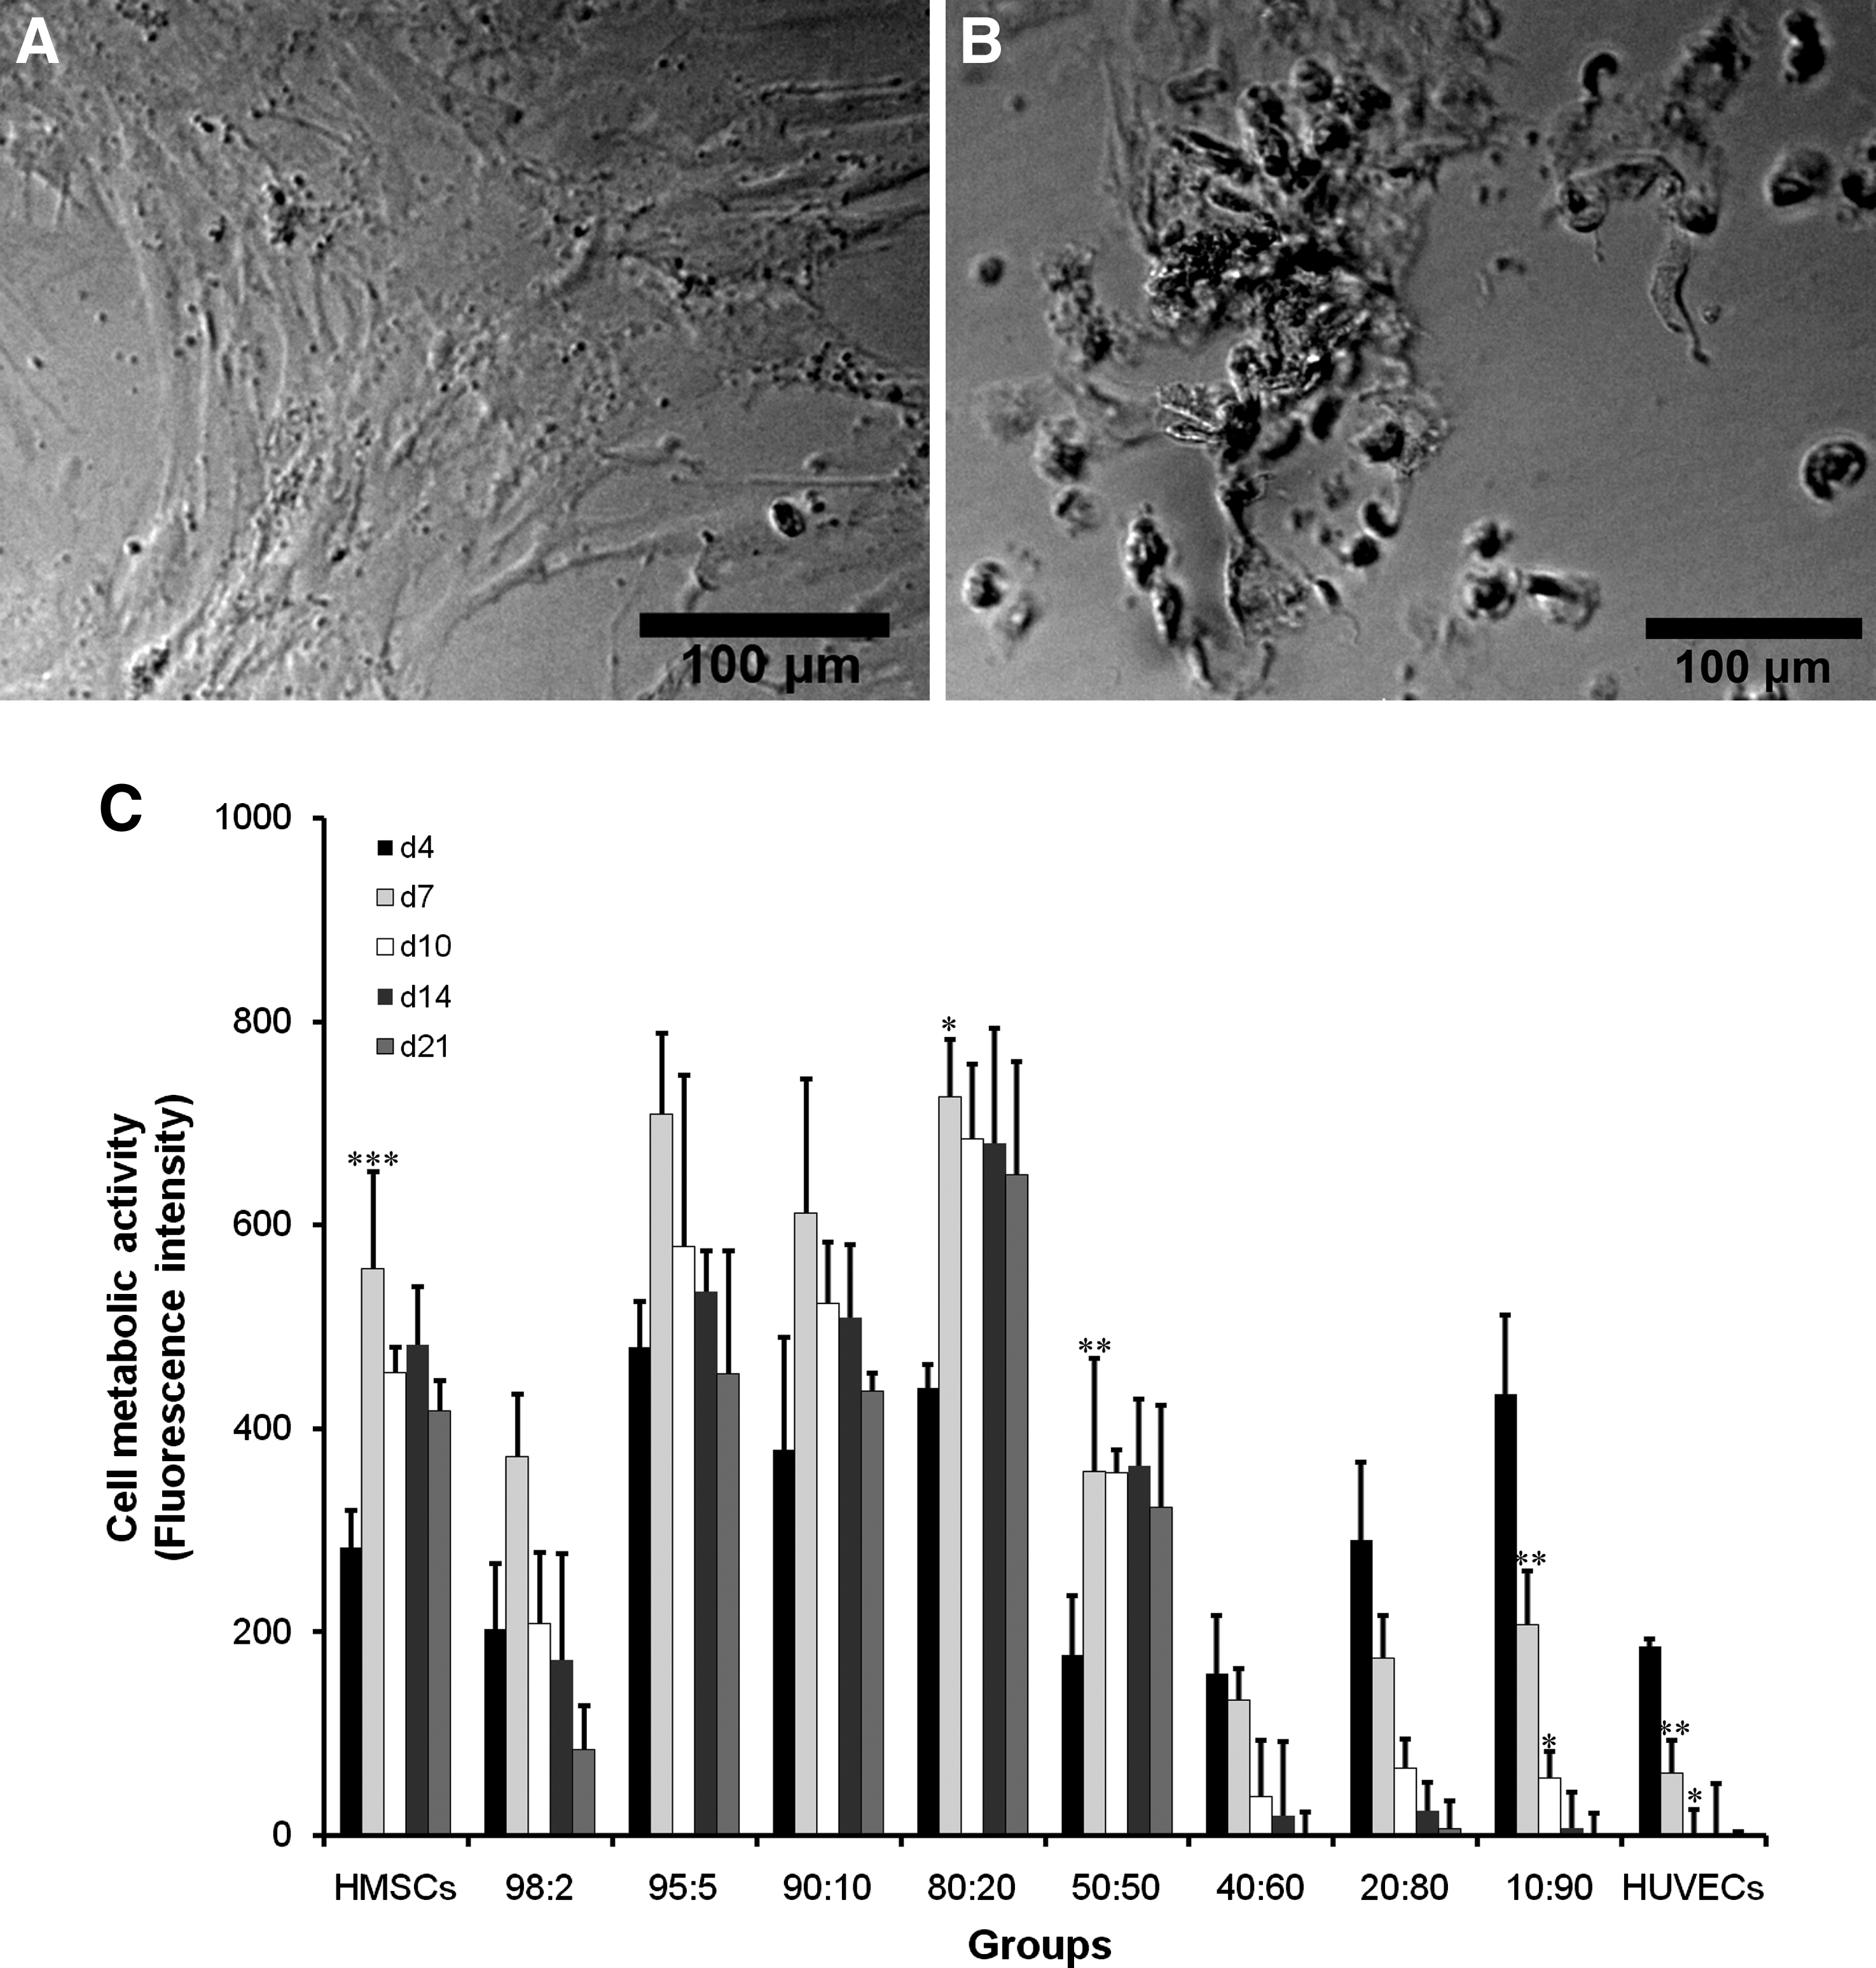
Cell morphology and metabolic activity of HMSC and HUVEC monocultures and HMSC/HUVEC cocultures in OM (n = 3).
2D cultures
In the 2D culture system, osteogenic output parameters were cell metabolic activity, proliferation, differentiation, and mineralization.
Cell metabolic activity showed a significant increase in HMSC monoculture as well as in the 50:50 and 80:20 cocultures from day 4 to 7, after which it remained stable over time. For the other ratios (98:2, 95:5, and 90:10), there was no significant difference between the later and previous time point (Fig. 2C). Cell proliferation was assessed by measuring cellular DNA content at selective time points. An increase in cellular DNA content was observed for all cocultures over time, whereas a plateau phase was reached for HMSC monoculture from day 24 on. The DNA contents were lower in the cocultures than in HMSC monocultures at the earlier time points (days 14 and 18), but this trend was opposite on day 28, on which the 80:20 coculture showed significantly increased DNA content (Fig. 3). Cocultures showed obviously higher ALP activity compared with HMSC monoculture, especially for 50:50 cocultures, which showed highest ALP activity on days 14 and 18. Significantly higher ALP activity was found in 50:50 coculture on day 14 and in 50:50, 80:20, 90:10, and 98:2 cocultures on day 18 compared with HMSC monoculture (Fig. 4). Mineralization was observed using light microscopy and quantified using a calcium assay. Microscopic observation showed the onset of mineralization on day 14 and became more apparent from day 18 on for both 50:50 and 80:20 cocultures, although it was more evident in the 50:50 coculture. No or minor signs of mineralization could be observed for other cocultures or the HMSC monoculture. Quantification of the amount of calcium deposited in the extracellular matrix (Fig. 5) showed substantial mineralization for 50:50 coculture, followed by 80:20, and increased over time. Mineralization was always significantly higher in the 50:50 coculture compared with the HMSC group at each time point. All other cocultures and the HMSC monoculture demonstrated only basal calcium levels during the entire cell culture.
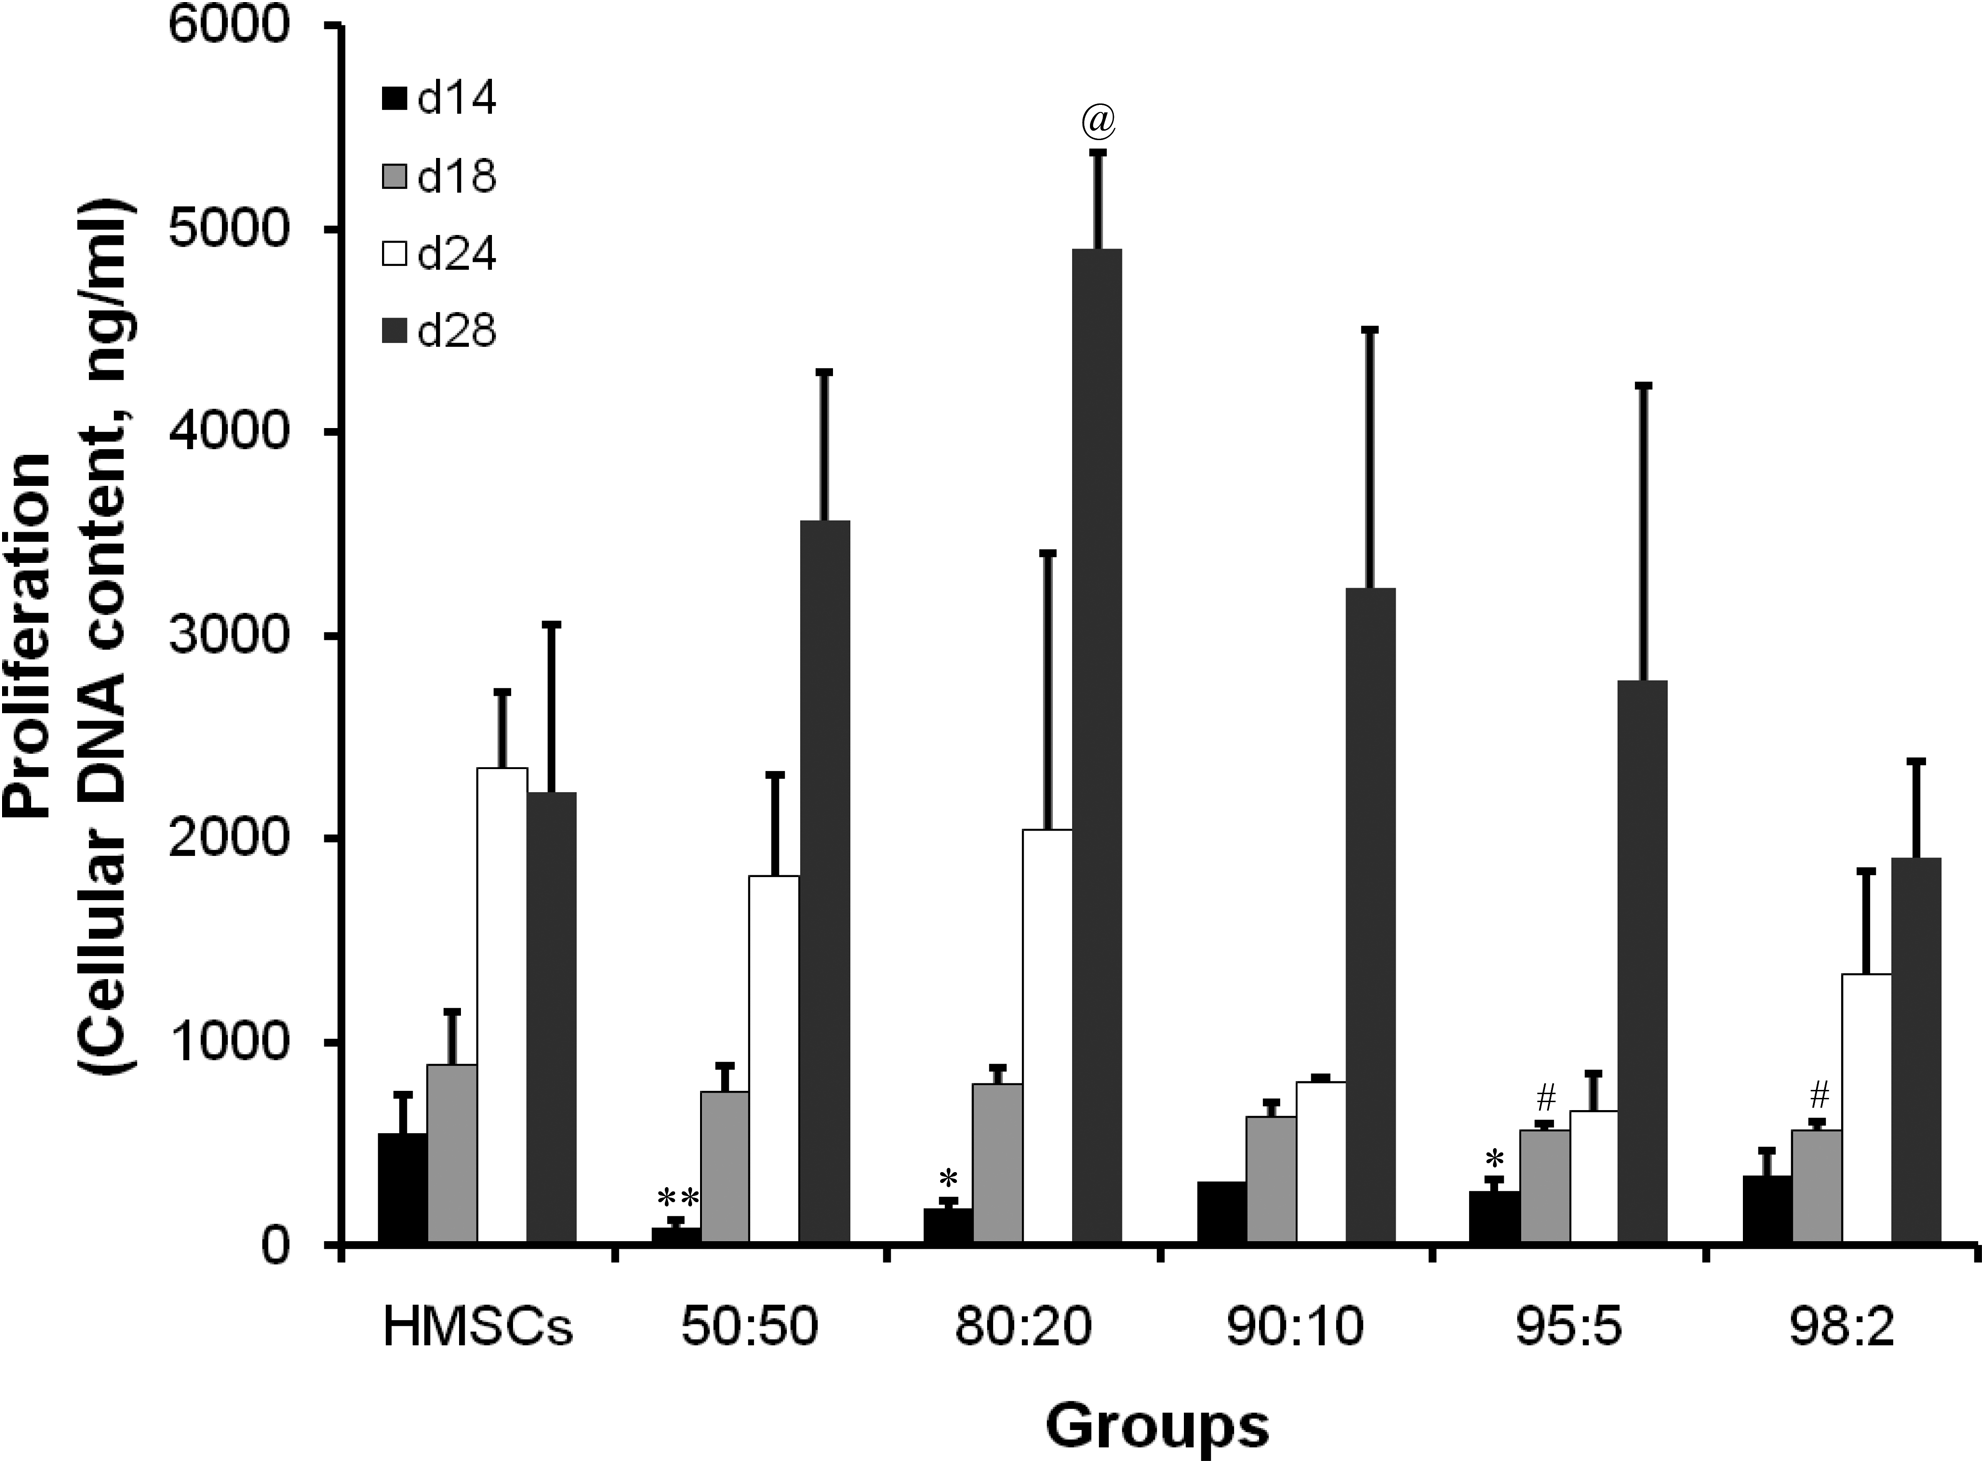
Cellular DNA content of HMSC monoculture and HMSC/HUVEC cocultures in OM (n = 3). *p < 0.05 and **p < 0.01 indicate significant difference compared with HMSC monoculture on day 14; #p < 0.05 indicates significant difference compared with HMSC monoculture on day 18; @p < 0.05 indicates significant difference compared with HMSC monoculture on day 28.

Osteogenic differentiation for HMSC monoculture and HMSC/HUVEC cocultures in OM (n = 3). **p < 0.01 indicates significantly higher ALP activity compared with the HMSC group on day 14. #p < 0.05 and ##p < 0.01 indicate significantly higher ALP activity compared the HMSC group on day 18. ALP, alkaline phosphatase.

Mineralization of HMSC monoculture and HMSC/HUVEC cocultures in OM (n = 3). *p < 0.05 and **p < 0.01 indicate significantly higher mineralization compared with the HMSC group at each time point.
3D cultures
In the 3D culture system, cell pellets consisting of HMSCs and HUVECs at the same cell ratios as in the 2D system were cultured in OM to evaluate the effect of cell ratio on the angiogenic output parameter CD31 expression. After a culture period of 10 days in OM, cryo-sections were prepared for CD31 staining. The negative control (without anti-CD31 antibody) demonstrated the absence of nonspecific staining of the peroxidase-labeled secondary antibody. Histological evaluation (Fig. 6A) showed an apparent increase of CD31-staining with increasing number of HUVECs in the pellet coculture. HMSC monoculture pellets also showed marginal CD31 staining after cultured in OM. Quantification of CD31 staining (Fig. 6B) showed substantial CD31 area percentage for all the cocultures, with a significant decrease when lower numbers of HUVECs used in the cocultures (50:50 > 80:20 > 90:10 > 95:5 > 98:2). Marginal CD31 area percentage was observed for HMSC monoculture pellets. Normalization for the percentage of HUVECs seeded in the coculture pellets showed a significant increase with decreasing numbers of HUVECs in the coculture pellets (Fig. 6C).
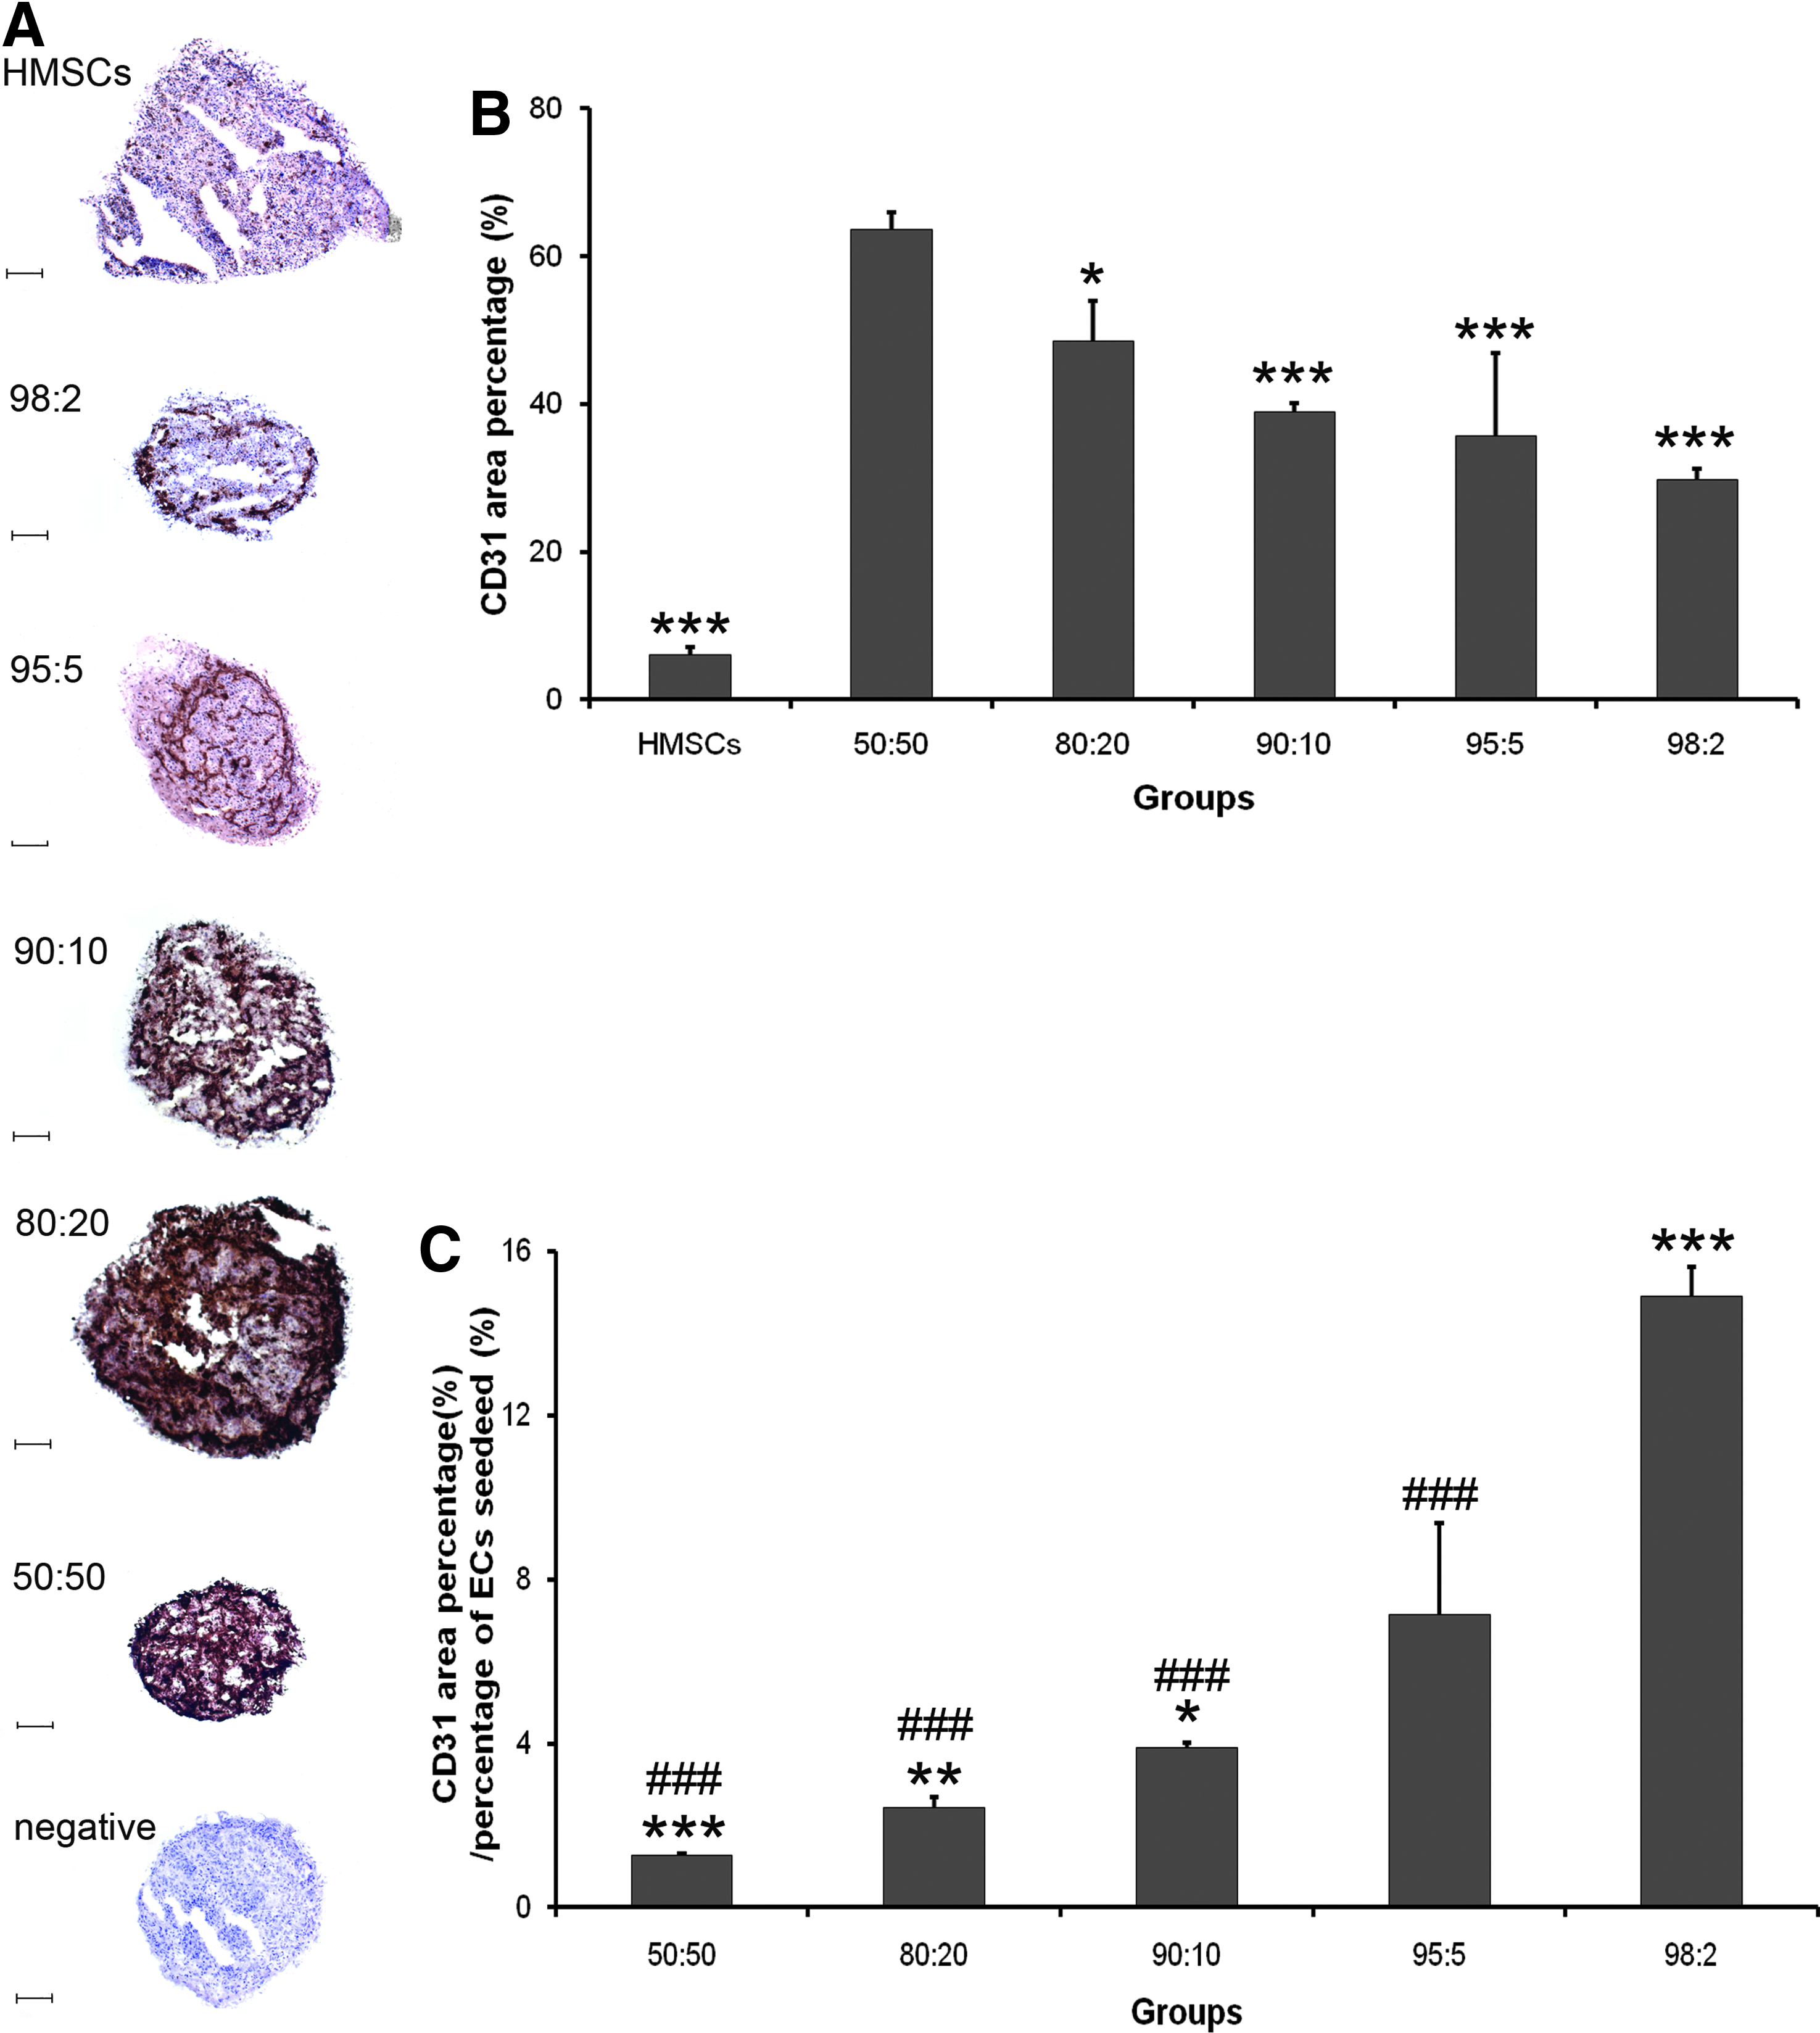
CD31 immunohistochemical staining of cell pellets (n = 3) (day 10).
Discussion
Coculture of OBs with ECs has been proposed as a useful prevascularization strategy in bone tissue engineering. Although attempts have shown encouraging results both in vitro6,8,10,11 and in vivo,7,16–21 hardly any consistency exists in the experimental setups for those studies. It is straightforward to hypothesize that (co)culture conditions determine both the osteogenic and angiogenic outcome parameters. Consequently, it is crucial to determine optimal (co)culture conditions, such as culture medium and cell ratio. 22 In view of this, the present study sought to explore the optimal cell ratio and culture medium for both osteogenic and angiogenic outcome parameters in HMSC/HUVEC cocultures. It was demonstrated that only OM was capable of inducing mineralization, whereas PM, endothelial medium, and a mixture of OM and endothelial medium were not. Extended experiments with OM subsequently showed that mineralization occurred only in cocultures with 50:50 or 80:20 ratios of HMSC and HUVEC, respectively. Although normalized angiogenic outcome was highest for low numbers of HUVECs in cocultures, substantial numbers of HUVECs demonstrated to be required to obtain mineralization as well as CD31 staining.
Cocultures in OM induced mineralization with preservation of angiogenic marker expression
In this study, we evaluated how the different culture media affected mineralization in cocultures and monoculture. In 2D cultures using different cell culture media, the primary focus was on mineralization, as the ultimate aim for bone tissue engineering is the formation of (mineralized) bone tissue. Mineralization was observed only for cocultures in OM, whereas PM, EM, and MIX demonstrated to be incapable of inducing osteogenic differentiation. Consequently, these results show that osteogenic differentiation of HMSCs depends on (i) osteogenic constituents (dexamethasone and β-glycerophosphate) above a certain threshold level, and (ii) interaction with ECs. Regarding the requirement of osteogenic constituents, several reports describe cocultures in either PM or EM to induce either higher ALP activity or more bone formation for cocultures than monocultures.6,8,10,16 It needs to be emphasized, however, that in none of these reports mineralization was assessed using a quantitative mineralization assay.
It is known that the osteogenic capacity of expanded HMSCs decreases with serial passaging.23,24 The results in this experiment showed that mineralization occurred in all cocultures during the quest for the optimal culture medium using HMSCs of passage 3, although to a varying extent with highest values for 50:50 cocultures. In the subsequent experiments to optimize cell ratio, HMSCs of passage 4 were used, showing obvious mineralization for only coculture ratios of 50:50 and 80:20 (HMSCs:HUVECs). Additionally, long-time HMSC expansion (i.e., time, not passaging) may lead to senescence, which is characterized by a lack of proliferation and differentiation of HMSCs.25,26 In view of this, ECs appear capable of inducing mineralization of OBs. Reported data from coculture experiments7,15,27 suggest that ECs drive OBs into an osteoblastic phenotype and therefore ECs were proposed as osteoinductive mediators in a coculture model. 22 For the interaction of the two cell types, two pathways exist: (i) direct cell–cell contact (such as gap junction 6 and cellular bridge 28 ), and (ii) diffusible mediators, which are secreted by one cell type and influence the other cell type via specific receptors. 22 Direct contact has been suggested necessary for inducing osteogenic differentiation because increased ALP activity could only be found in direct contact when it failed in indirect contact or conditioned medium.5,6 For the diffusible mediators, although not determined in the present experiment, many studies have shown bi-lateral secretion of stimulatory factors between the two cell types. ECs can secrete bone morphogenetic protein-2 29 and insulin-like growth factor, 30 which modulate the proliferation and differentiation of OBs.7,31 On the other hand, OBs can secrete vascular endothelial growth factor to enhance the growth and differentiation of ECs.6,29,32,33 Recently, it was reported that ALP expression in coculture in PM was even higher than that of monoculture of HMSCs in OM, 28 which also demonstrated the strong interactions between the two cell types.
Because of these types of communication, ECs can survive and preserve angiogenic marker expression in cocultures and similar results were also reported previously, in which 50:50 of OBs/ECs were cocultured in PM on polyurethane scaffolds. 10 Apparently, ECs need specific growth factors in the culture medium to support proliferation and survival, and it appears that coculture-conditioned medium meets this requirement. However, it seems that this is a cell ratio-dependent process, since ECs can only survive in the cultures with high OB percentage (100%–50%) in OM. Meanwhile, the life span of ECs was reported to be prolonged in cocultures, 34 which might be caused by the cell interactions as well. Herein, CD31 staining was used to evaluate angiogenic marker expression, but this parameter is not comparable with functional blood vessels and it needs further in vivo research.
Osteogenic and angiogenic potential increases with decreasing HMSC/HUVEC ratio in cocultures
ALP activity and calcium deposition represent frequently used early and late markers for osteogenic differentiation, respectively.35,36 In the present study, ALP activity was highest for 50:50 cocultures on days 14 and 18. Two previous reports also observed higher ALP activity for this ratio, but using culture medium consisting of either 1:1 mixture of PM/EM, or PM.6,7 Therefore, we assume that cell ratio has a more important role than culture medium does in affecting the ALP activity. Mineralization was also highest for the 50:50 cocultures, followed by 80:20 cocultures. This observation shows that a decreasing HMSC/HUVEC ratio (up to 50:50) at the time of coculture initiation resulted in higher osteogenic differentiation. In view of the complicated interactions between the two cell types during culture period, the ratio at sample collection might be quite different from the initial one. Although not determined in the present study, Fuchs et al. cocultured OBs with ECs in a ratio of 3:2 onto silk fibroin scaffolds for up to 4 weeks, showing that the cell proliferation rate for these two cell types is different: OBs were increasing from 60% to 89%, whereas ECs were decreasing from 40% to 11.5% over time. 9
In the present study, HMSCs did not express CD31 at the time of (co)culture initiation, but the exclusivity of CD31 expression for ECs appears questionable, as rat MSCs were recently reported to express concurrently both osteogenic and angiogenic markers in OM. 37 Meanwhile, another study also showed that immunostaining can magnify the signal (while CD31 was negative using flow cytometry test, it was weakly positive using immunohistochemical staining). 3 Nevertheless, we speculate that the majority of CD31 expression in HMSC/HUVEC cocultures results from HUVECs and potential contribution of HMSC CD31 expression is only marginal. Consequently, the observation that CD31+ staining increased with decreasing HMSC/HUVEC ratio in the cell pellets seems straightforward. Nevertheless, after normalized by the percentage of ECs seeded, the relative CD31+ staining showed the opposite result. This observation corroborates the results from Rouwkema et al., 11 although <20% of HUVECs in the initial cell pellets appeared not to be capable of inducing mineralization.
The results from this experiment pave the way for future coculture studies. For clinical application using coculture techniques for cell-based bone tissue engineering, however, the present results only indicate that culture medium and ratio are important parameters for the in vitro part of the entire procedure. The entire procedure involves many more steps, including cell isolation, cell expansion, cell seeding onto a scaffold, and finally implantation of the cell-loaded scaffold into a bone defect. Additionally, still huge donor variation exists in the in vitro and in vivo performance of HMSCs, demonstrating the need for more standardization in the isolation and expansion procedures for these cells in combination with preusage screening. From the present results, the 50:50 ratio of HMSC/HUVEC cocultured in OM appears to be the optimal condition for coculture in vitro. Nevertheless, future studies need to be done to verify the feasibility of in vivo bone formation in such coculture system and optimize the cell-scaffold culture conditions (e.g., cell ratio, culture medium, and culture time) to enhance clinical efficacy.
Conclusion
The results from the present study showed that both cell culture medium and cell ratio are important parameters for cocultures of HMSCs and HUVECs. Only OM demonstrated to be capable of inducing mineralization. It was also shown that mineralization and angiogenic potential of the cocultures increased with decreasing HMSC/HUVEC ratio till 50:50. Therefore, we conclude that a HMSC/HUVEC coculture ratio of 50:50 in OM is optimal for both osteogenic and angiogenic potential.
Footnotes
Acknowledgments
The authors thank Dr. Gert Meijer (Department of Oral and Craniofacial Surgery, Radboud University Nijmegen Medical Center) for providing bone biopsies. Ms. Natasja van Dijk and Mr. Vincent Cuijpers (Department of Biomaterials, Radboud University) are acknowledged for technical assistance. This project was financially supported by the Royal Netherlands Academy of Arts and Sciences (KNAW, 08-PSA-M-02) and National Natural Science Foundation of China (NSFC, 50830102).
Disclosure Statement
No competing financial interests exist.