




Abstract
Adipose tissue contains a heterogeneous cell population composed of endothelial cells, adipocytes, smooth muscle cells (SMC), and mesenchymal progenitors and stromal cells that meet the criteria put forth by the International Society for Cellular Therapy as defining mesenchymal stem cells (MSC). In this study, we expanded the stromal vascular fraction (SVF) of human adipose tissue and characterized the resulting adherent primary cell cultures by quantitative reverse transcription–polymerase chain reaction, antigen expression, protein fingerprinting, growth kinetics, in vitro tri-lineage differentiation bioactivity, and functional responses to small molecules modulating SMC-related developmental pathways and compared the results to those obtained with functionally validated MSC cultures. SVF-derived initial cultures (P0) were expanded in a defined medium that was not optimized for MSC growth conditions, neither were recombinant cytokines or growth factors added to the media to direct differentiation. The adherent cell cultures derived from SVF expansion under these conditions had markedly distinct phenotypic and biological properties relative to functionally validated MSC cultures. SVF-derived adherent cell cultures retained characteristics consistent with the SMC subpopulation within adipose tissue—phenotype, gene, and protein expression—that were independent of passage number and source of SVF (n=4 independent donors). SVF-derived cells presented significantly less robust in vitro tri-lineage differentiation bioactivity relative to validated MSC. Expanded SVF cells and MSC had opposite responses to the thromboxane A2 mimetic U46619, demonstrating an unambiguous functional distinction between the two cell types. Taken together, these data support the conclusions that SVF cells expanded under the conditions described in these studies are accurately described as adipose-derived SMC and represent a cellular subpopulation of adipose SVF that is separate and distinct from other classes of adipose-derived cells.
Introduction
adherence to plastic during growth in standard culture conditions, a cell surface marker profile comprising CD105+, CD73+, CD90+, CD45−, CD34−, CD14−or CD11b−, CD79α−or CD19−, and HLA-DR-, and tri-lineage differentiation potential along osteoblast, adipocyte, or chondrocyte developmental pathways.
Cells meeting the ISCT criteria for MSC have been isolated from organs and tissues throughout the body,2,3 including adipose. However, the degree to which the characteristics used to define MSC are unique to MSC is unclear. For example, expression of CD73, CD90, and CD105 has been observed in fibroblasts and other cell types that are unambiguously not MSC (Ref. 4 ; our unpublished observations). Further, in vitro tri-lineage differentiation bioactivity has been demonstrated in fibroblasts, suggesting that the ISCT criteria may not be adequate to define MSC.5–8 It therefore seems reasonable to pose the following questions: Are cell isolates that share certain functional characteristics reflecting a single underlying biological phenotype or are they distinct cellular phenotypes? Are the relatively minimal criteria in the ISCT definition of MSC specific enough to say without ambiguity that cells meeting the criteria are only MSC and not some other cell type? Several groups9–11 have isolated functionally distinct stem or progenitor cells from bone marrow that fulfill the ISCT criteria for MSC, yet can also be regarded as biologically unique, suggesting that the ISCT criteria may not be sufficient to definitively characterize MSC. Additional claims of MSC multi-lineage differentiation bioactivity beyond the mesenchymal lineage have also been questioned on the basis of ambiguous interpretation of gene expression data. 12
We are currently using adipose tissue to source the SMC component for cell/biomaterial composites to regenerate urinary tissue and other tubular organs, including esophagus and small intestine. 13 As part of the regulatory approval process for such combination products, the phenotype of the cellular component must be defined. In this study, we established clear distinctions between the cells expanded from human adipose using the procedures described herein and MSC. For this purpose, a well-established, functionally validated source of MSC must be leveraged as a comparator. Although it may be reasonable to propose utilization of adipose-sourced MSC as comparator, ambiguities associated with ISCT criteria for definition of MSC suggest that adipose may not represent a fully functionally validated source of MSC. We have therefore elected to apply a more rigorous definition of MSC based on full in vivo tri-lineage differentiation of genetically labeled transplanted cells. By this definition, complete heterotopic ossicle formation has been used as an in vivo differentiation assay to demonstrate that only bone marrow-derived stromal cells have osteogenic (and by extension, mesenchymal) differentiation bioactivity. 14 In support of this observation, cells labeled as “MSC” isolated from adipose have been shown through multiple in vitro studies to be phenotypically and functionally dissimilar to bone marrow-derived MSC.15–19 Finally, methodologies for the isolation of MSC from adipose closely resemble methods described herein for isolation of adipose-derived SMCs (Ad-SMC), leading to the potential for considerable confusion in efforts to perform clear, straightforward phenotypic and functional comparisons across cell types. Thus, as bone marrow-derived MSC remains the gold standard for definition of MSC, and as this MSC population is readily sourced commercially and therefore serves as a straightforward, functionally validated comparator, we elected to leverage bone marrow-derived MSC for the relative functional analyses presented in this report.
Although the initial adipose tissue isolate contained adherent cells expressing endothelial, smooth muscle, and adipocyte-associated markers, expansion in media that was neither optimized for MSC growth conditions20,21 nor contained added recombinant cytokines or growth factors to direct differentiation yielded a unique cellular subpopulation with phenotypic and functional characteristics distinct from MSC. Additionally, we demonstrated that the phenotype of cells expanded from human adipose was more similar to bladder-SMC than to MSC. Manifestation of this “Ad-SMC” phenotype was independent of passage number or adipose donor source and did not require directed differentiation with recombinant cytokines and growth factors. Finally, we show that Ad-SMC present only residual in vitro tri-lineage differentiation bioactivity relative to MSC and show opposing response compared with MSC upon treatment with the thromboxane A2 mimetic U46619. Taken together, these data support the conclusion that Ad-SMC represents a cellular subpopulation of human adipose tissue that is separate and distinct from other cell populations, including adipocytes, endothelial cells, and MSC.
Materials and Methods
Preparation of adipose tissue
Human adipose tissue was commercially obtained (Zen-Bio) from subcutaneous harvest or lipoaspiration. Adipose was digested with 0.1% collagenase I (Worthington Biochemical) and 1% bovine serum albumin (Sigma) in Dulbecco's modified Eagle's medium–high glucose (DMEM-HG) (Invitrogen) at 37°C for 1 h, and then centrifuged for 5 min at 300g in 50 mL conical tubes. The stromal vascular fraction (SVF) pellet was resuspended in phosphate-buffered saline (PBS)/1% bovine serum albumin and filtered through a 100 μm Steriflip vacuum filter. Cells were pelleted again at 300g for 5 min and resuspended in culture media.
Culture media used for cell expansion
Ad-SMC and bladder-SMC were cultured in DMEM-HG with 10% fetal bovine serum (FBS) and 5 μg/mL gentamicin (all from Invitrogen) unless otherwise indicated. For experiments examining the role of media types on functional outcomes, the following media were applied: α-MEM/10% FBS (both from Invitrogen), L15 (Sigma)/10% FBS, SMCM (ScienCell) media was used as purchased. MSC was cultured in MSC growth media composed of MSC basal medium fully supplemented as described by the manufacturer (
Human MSCs
Bone marrow-derived MSC at the end of passage two was obtained commercially (Lonza) as frozen samples and analyzed directly without further culturing. MSC are guaranteed by the manufacturer to present tri-lineage differentiation in vitro only until end of P2. Further culturing of MSC beyond P2 has been shown to lead to rapid loss of in vitro tri-lineage differentiation bioactivity even under optimal conditions. 22 Therefore, only MSC frozen at end of P2 will preserve the transcriptomic and proteomic profile associated with fully functionally validated MSC. Cryopreservation of MSC has been shown to not affect bioactivity. 23 Although it is not possible to establish if the freezing protocol induced any transitory phenotypic alteration to MSC, all other cell types were frozen and thawed in identical fashion prior to application in comparative analysis. For FACs analysis, MSC were thawed directly into complete MSC growth media (Lonza) as described by the manufacturer and fixed immediately upon recovery of the population (1–2 days post-thaw).
In vitro tri-lineage differentiation assays
For the in vitro tri-lineage differentiation assays presented in Figure 9, Ad-SMC was expanded in DMEM-HG/10% FBS until end of P2. Bone marrow-derived MSC (Lonza; frozen at end P2) was thawed directly into fully supplemented MSC growth media as described by the manufacturer. Induction of in vitro tri-lineage differentiation and histochemical analysis of differentiation was performed as described (
TaqMan qRT-PCR
Sample RNA was isolated with the RNeasy Plus Mini Kit (Qiagen) according to the manufacturer's instructions. cDNA was generated from 2 μg of RNA using the SuperScript VILO cDNA Synthesis Kit (Invitrogen) according to the manufacturer's instructions. Following cDNA synthesis, each sample was diluted 1:10 with distilled water. qRT-PCR was setup as follows using the TaqMan primers and probes (Applied Biosystems) listed in Table 1: 10 μL master mix (2×), 1 μL primer/probe, and 9 μL cDNA (diluted 1:10). Reactions were carried out in an ABI 7300 real-time thermal cycler using default cycling parameters. PCR data was analyzed using the method of Relative Quantitation (RQ) by Comparative Ct. Relative Quantity is the amount of target normalized to an endogenous reference and relative to a calibrator and is given by the equation: 2–ΔΔCT where ΔΔCT=ΔCTTest − ΔCTCalibrator. The endogenous reference (internal control) was 18S rRNA.
Semi-quantitative RT-PCR
RNA was purified using the RNeasy Plus Mini Kit (Qiagen) following the protocol for purification of total RNA from animal cells. cDNA was generated from 1 μg of RNA using the QuantiTect Reverse Transcription Kit (Qiagen) following the manufacturer's instructions. All PCRs were carried out using a 25 μL volume that consisted of 12.5 μL GoTaq® Green Master Mix (Promega), 2.0 μL primer (0.8 μM final concentration), 1.0 μL cDNA, and 9.5 μL of sterile water. Amplification was carried out using a iQ5 iCycler (BioRad) as follows: denaturation at 95°C for 2 min, 35 cycles of 95°C for 45 s, annealing at 55°C for 45 s, and extension at 72°C for 45 s, followed by a final extension at 72°C for 5 min. Following RT-PCR, the samples were loaded onto 2% agarose gels and electrophoresed at 120V for 20 min. The 1Kb Plus DNA Ladder (Invitrogen) was used to estimate PCR product size. The gels were stained with ethidium bromide (Invitrogen) and observed using the ChemiDoc™ XRS molecular imager and Quantity One® software (BioRad). All samples were normalized by total mass RNA used in the reaction. Internal control was β-actin.
Array RT-PCR
Real-time array-based qRT-PCR analysis was performed for 35 cycles using the SABiosciences MSC (PAHS-082A) and Cell Surface Marker PCR array platform (PAHS-055A) according to the manufacturer's instructions.
Statistical analysis
The number of technical and biological replicates associated with each Table is as follows:
Table 2: n=2 technical replicates per medium type examined and n=2 biological replicates per medium type examined. Table 3: n=9 Ad-SMC biological replicates, n=6 MSC biological replicates. Table 4: n=1. Figures 1 and 2: n=3 biological replicates per time point examined. Figure 3: n=3 biological replicates. Figure 8: n=9 biological replicates. Figure 9, Table: n=3 technical replicates.
Statistical analysis was done using standard two-tailed Student's t-test assuming equal variance for each sample. Confidence intervals of 95% (p-value<0.05) and 99% (p-value<0.01) were used to determine statistical significance. For the data presented in Table 3, no correction (i.e., Bonferroni, Sidak, FDR, etc.) was used because there was no predetermined value or gene marker that had to be met in order for the observed differences to be valid. Instead, this was a retrospective study done to identify gene markers that differentiated the two cell types.
FACS analysis
About 0.5×10⁶ to 1×10⁶ cells per data point were fixed in 2% paraformaldehyde and Fc receptors blocked to prevent nonspecific binding. Cells were then incubated with a directly conjugated antibody for the cell surface markers CD31, CD73, CD90, CD105, CD117, or CD133 (BD Biosciences) as recommended by the manufacturer. Subsequent to final washing (PBS, 0.1% Triton X-100), antigen detection was performed utilizing the BD FACS Aria 1 or Guava EasyCyte Mini Express Assay system using the appropriate fluorescent channel. A minimum of 5000–10,000 events were acquired from each sample.
Two-dimensional proteomic analysis
Cell samples were lysed in Lysis Buffer (50 mM Tris pH 8; 150 mM NaCl; 0.5% NP40 and protease inhibitors; Roche) and 40 μg of protein lysate per sample was electrophoresed on a pH 4.0–7.0 Zoom IEF strip (Invitrogen) according to the manufacturer's instructions. Each strip was then loaded onto a 4%–12% Bis/Tris acrylamide gel and electrophoresed on the 2nd dimension. The gels were stained with SYPRO Ruby stain (Invitrogen) according to the manufacturer's instructions. Quantitation of two-dimensional (2D) proteomic western blot data was performed as follows: Band intensity was calculated from each 2D gel using ImageJ v1.4 software (NIH). Intensity units were normalized per unit area for each polypeptide spot.
Immuno-fluorescence analysis
Confirmation of the SMC-like phenotype of Ad-SMC was made by immuno-fluorescence analysis of calponin and α-SMA expression within Ad-SMC. Bladder-SMC was used as a positive control and bone marrow-derived MSC (Lonza) was used as a negative control. Cells were fixed with 2% paraformaldehyde (Sigma) and blocked with 10% horse serum (Gibco)/0.2% Triton X-100 (Sigma)/D-PBS (Gibco). Primary antibodies (monocolonal anti-calponin (Dako) and monoclonal anti-α-SMA (Dako)) were added at a concentration of 5 and 3 μg/mL, respectively, and plates incubated overnight at 4°C. Cells were washed three times with 2% horse serum/0.2% Triton X-100/D-PBS, and then incubated with 1:500 dilution of secondary antibodies: goat anti-mouse IgG1 (Invitrogen) and goat anti-mouse IgG2a (Invitrogen) respectively for 1–3 h at room temperature. Nuclei were counterstained with Hoechst 33342 (Invitrogen). Mouse IgG1 (Invitrogen) and mouse IgG2a (Invitrogen) isotype controls served as negative controls (not shown). Images were captured with a Leica DMI4000B epi-fluorescence microscope running Simple PCI software.
Results
Cellular composition of human adipose-derived adherent cells
To define the cellular composition of the initial adherent cell population derived from commercially obtained human adipose tissue and to establish a baseline for subsequent gene expression analyses, qRT-PCR was performed 24–48 h after initial plating, or passage zero (P0), using a panel of defined endothelial, adipocytic, and SMC-specific TaqMan primers (Table 1). At P0, within 24–48 h of plating, all three cell types were present as demonstrated by marker expression analysis. As shown in Figure 1, low but detectable levels of ADIPOQ (panel A) and FABP-4 (panel B) were observed in the adherent cell population within the first 24 h, consistent with the presence of residual adipocytes. Similarly, an endothelial population defined by expression of CDH5/VECAD (panel C), vWF (panel D), PECAM1 (panel E), FLT1/VEGFR (panel F), KDR/FLK1 (panel G), and TEK (panel H) was present at this time point. An SMC population defined by expression of ACTA2/SMAA, SM22, MYOCD, MYH11/SMMHC, and CNN1 was also observed within the earliest adherent cell population (Fig. 2A–E, respectively). We were able to detect all three cell populations within 24–48 h of plating.

TaqMan quantitative RT-PCR analysis of adipose and endothelial markers within 24–48 h after plating of the SVF. Both cell types are present in the initial adherent population. Positive controls are adipocytes
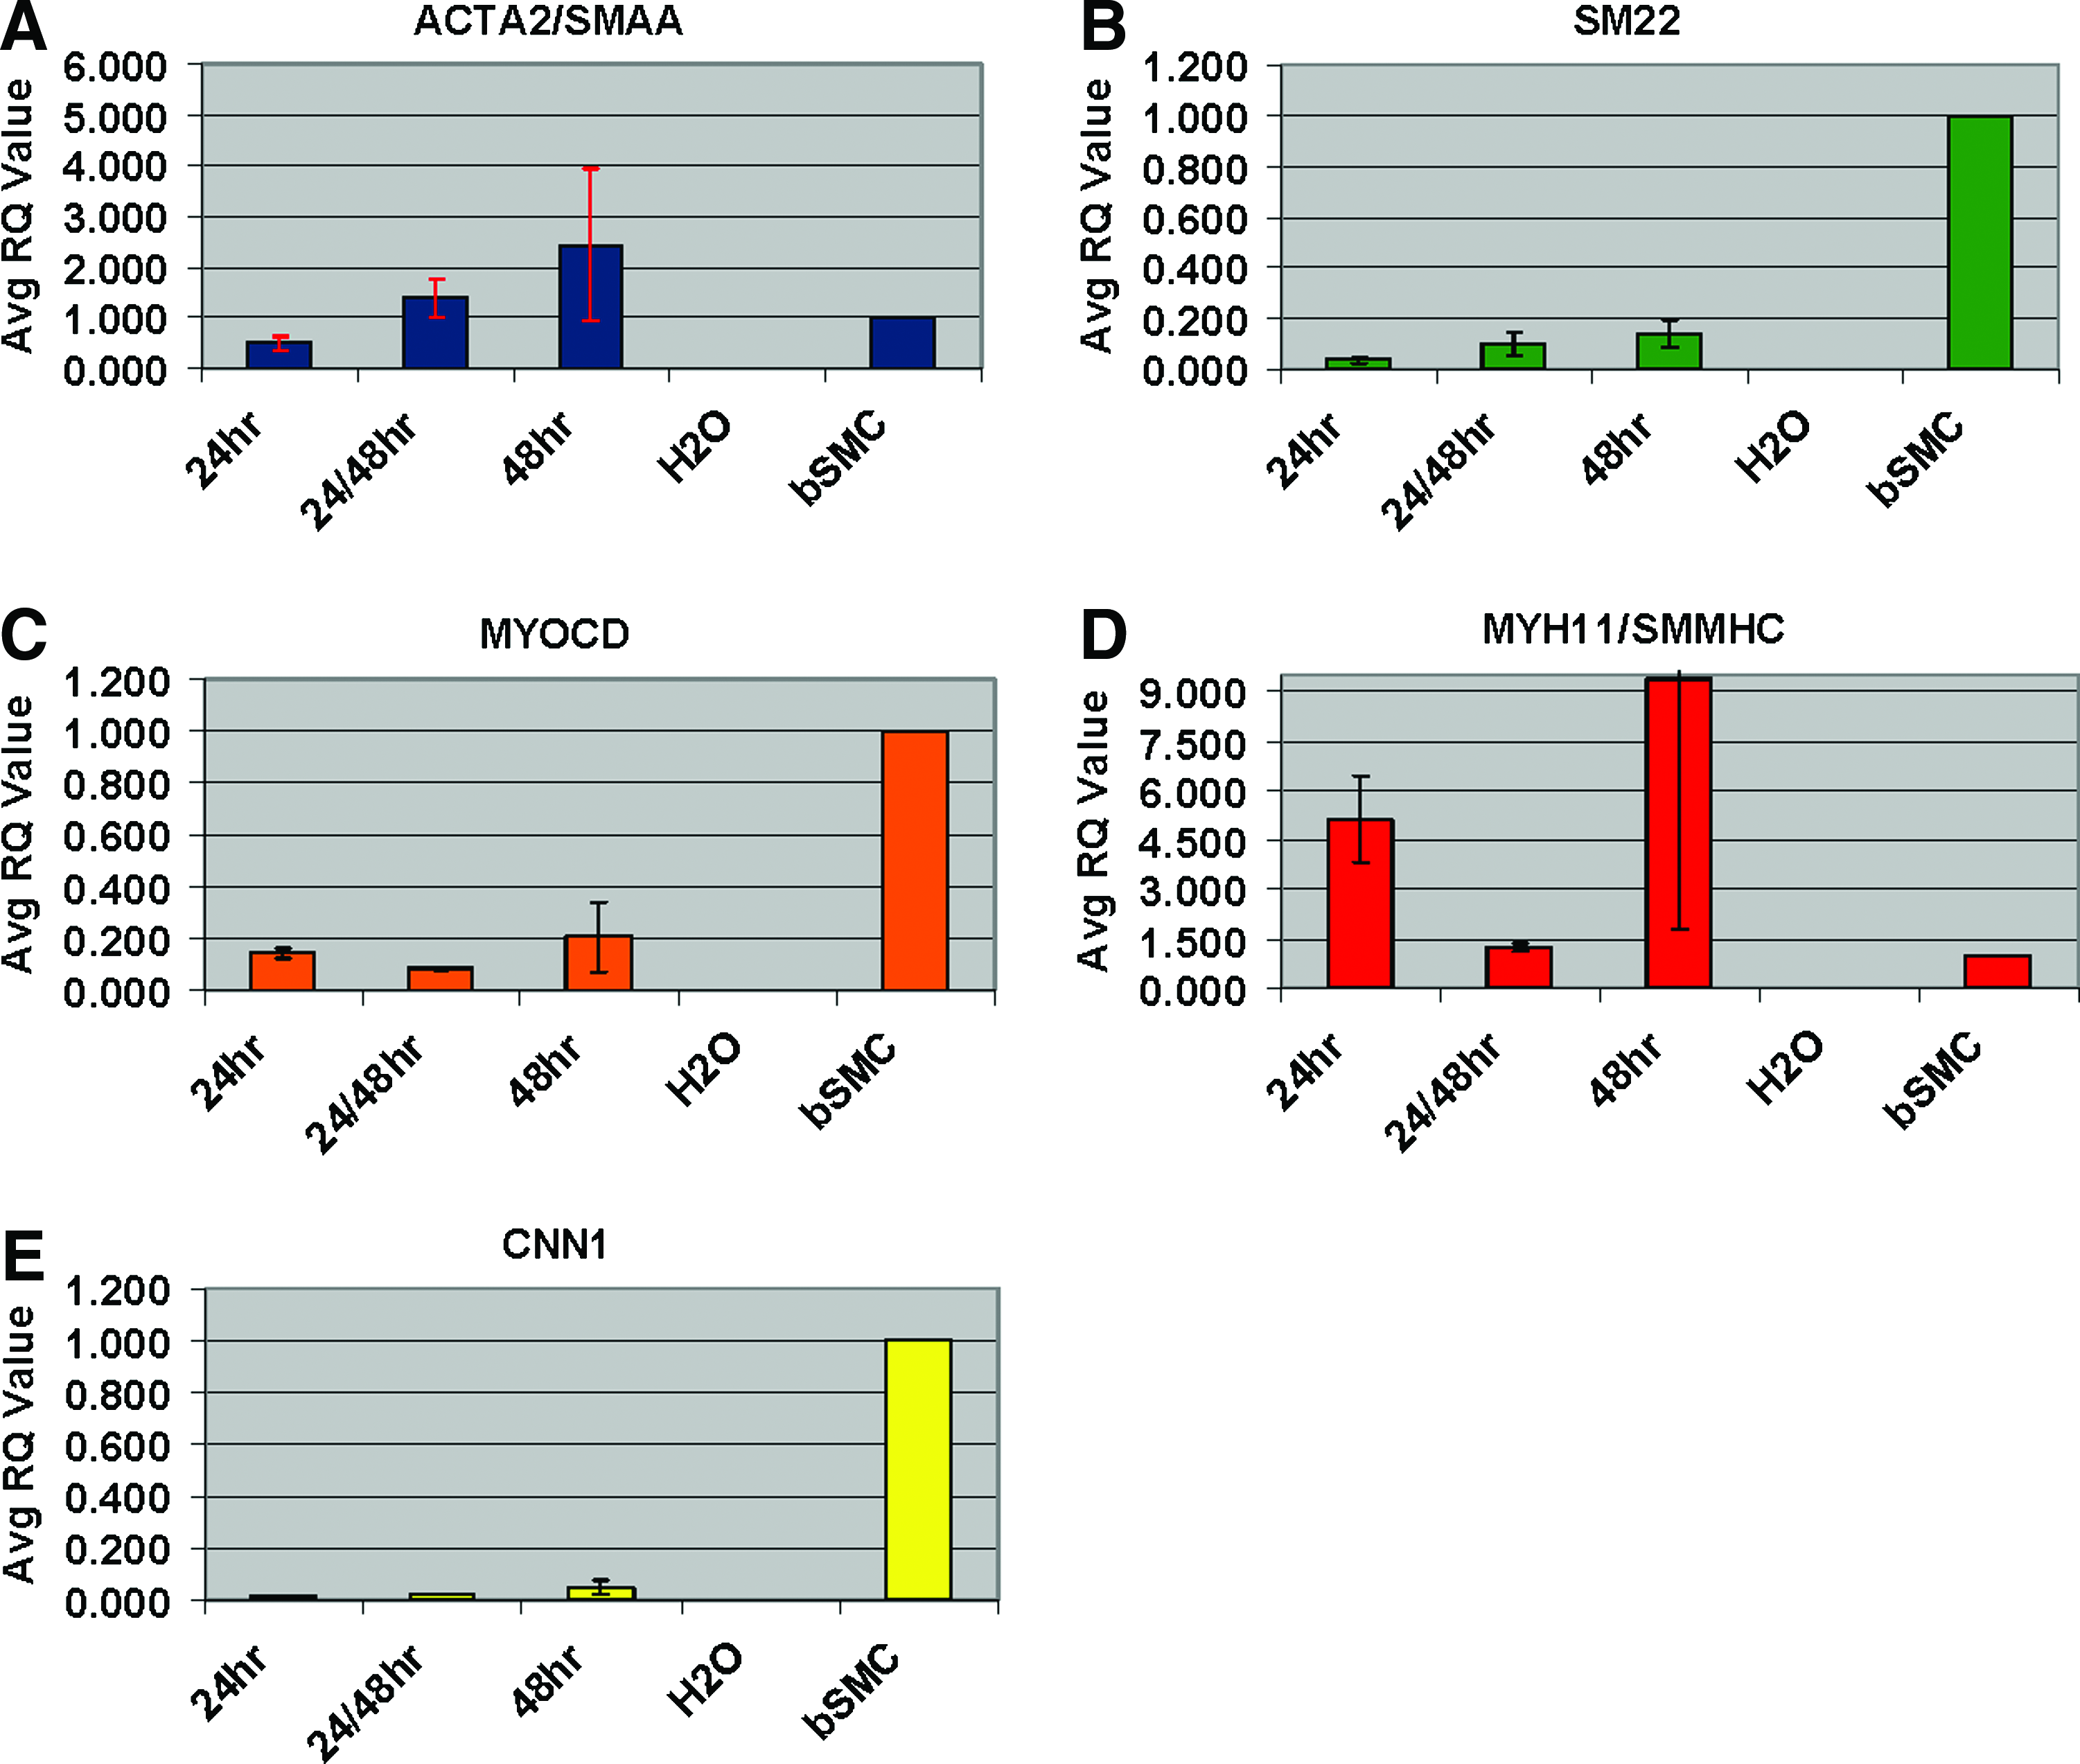
TaqMan quantitative RT-PCR analysis of SMC markers within 24–48 h after plating of the SVF.
Expression of smooth muscle markers is modulated by culture media formulation
Adipose is composed of multiple cell types and the P0 cultures were also heterogeneous. Expansion of undifferentiated MSC from adipose is closely dependent on media composition 20 and factors such as elevated glucose or growth at high density appear to select against the expansion of MSC.21,24 Therefore, we reasoned that modulation of media formulation might be useful for optimizing enrichment of SMC at the expense of MSC and other cell populations. As shown in Table 2, the expansion of an SMC-enriched population from human adipose was most effective when cultures were expanded in media formulations that were principally basal in composition, not supplemented with exogenously added inductive growth factors (DMEM-HG/10% FBS, α-MEM/10% FBS, and L15/10% FBS). Expansion in SMCM (a nonbasal media formulation supplemented with inductive growth factors) yielded cultures with a markedly reduced SMC phenotype as indicated by decreased expression of ACTA2/SMAA, SM22, MYOCD, MYH11/SMMHC, and CNN1 relative to DMEM-HG (p<0.01). Table 2 also demonstrates that no expansion of adipocytes or endothelial cells is observed. Expression of markers associated with but not definitive for MSC is also observed from basal media formulations relative to SMCM (p<0.01).
p-value<0.01 relative to DMEM.
p-value<0.05 relative to DMEM.
n=2 Technical Reps per sample.
n=2 Biological Reps per sample.
SMC, smooth muscle cell; DMEM-HG, Dulbecco's modified Eagle's medium–high glucose.
Cells expanded from adipose in DMEM-HG more closely resemble SMC than MSC
Semi-quantitative RT-PCR was used to assess and compare the gene expression signatures of cells expanded from human adipose in DMEM-HG relative to MSC (Fig. 3A). Expression of the key SMC markers CNN1, MYOCD, and MYH11/SMMHC was noticeably more pronounced in cells expanded from adipose in DMEM-HG than in MSC, demonstrating a clear distinction between these adipose SVF-derived cells and MSC. However, the expression pattern of SMC-associated markers in this adipose SVF-derived population was not identical to that observed from bladder-SMC, consistent with our previously documented observations on the variability in regulation of SMC-associated transcripts in cells derived from different smooth muscle sources. 25 Cells expanded from adipose in DMEM-HG consistently expressed an SMC-like gene expression signature across multiple independent isolates (n=3) and over five passages (Fig. 3B). Expression of ACTA2/SMAA, SM22, MYH11/SMMHC, MYOCD, and CNN1 was remarkably constant across passage and was independent of donor, demonstrating that expression of an SMC phenotype was relatively stable with this expansion process. Differences in the specific transcriptional regulation of SMC-associated markers between bladder and adipose notwithstanding, the robust expression of CNN1, MYOCD, and SMMHC from cells expanded from adipose in DMEM-HG/10% FBS is consistent with an SMC-like phenotype. Therefore, this cell population will be called Ad-SMC for the remainder of this report.
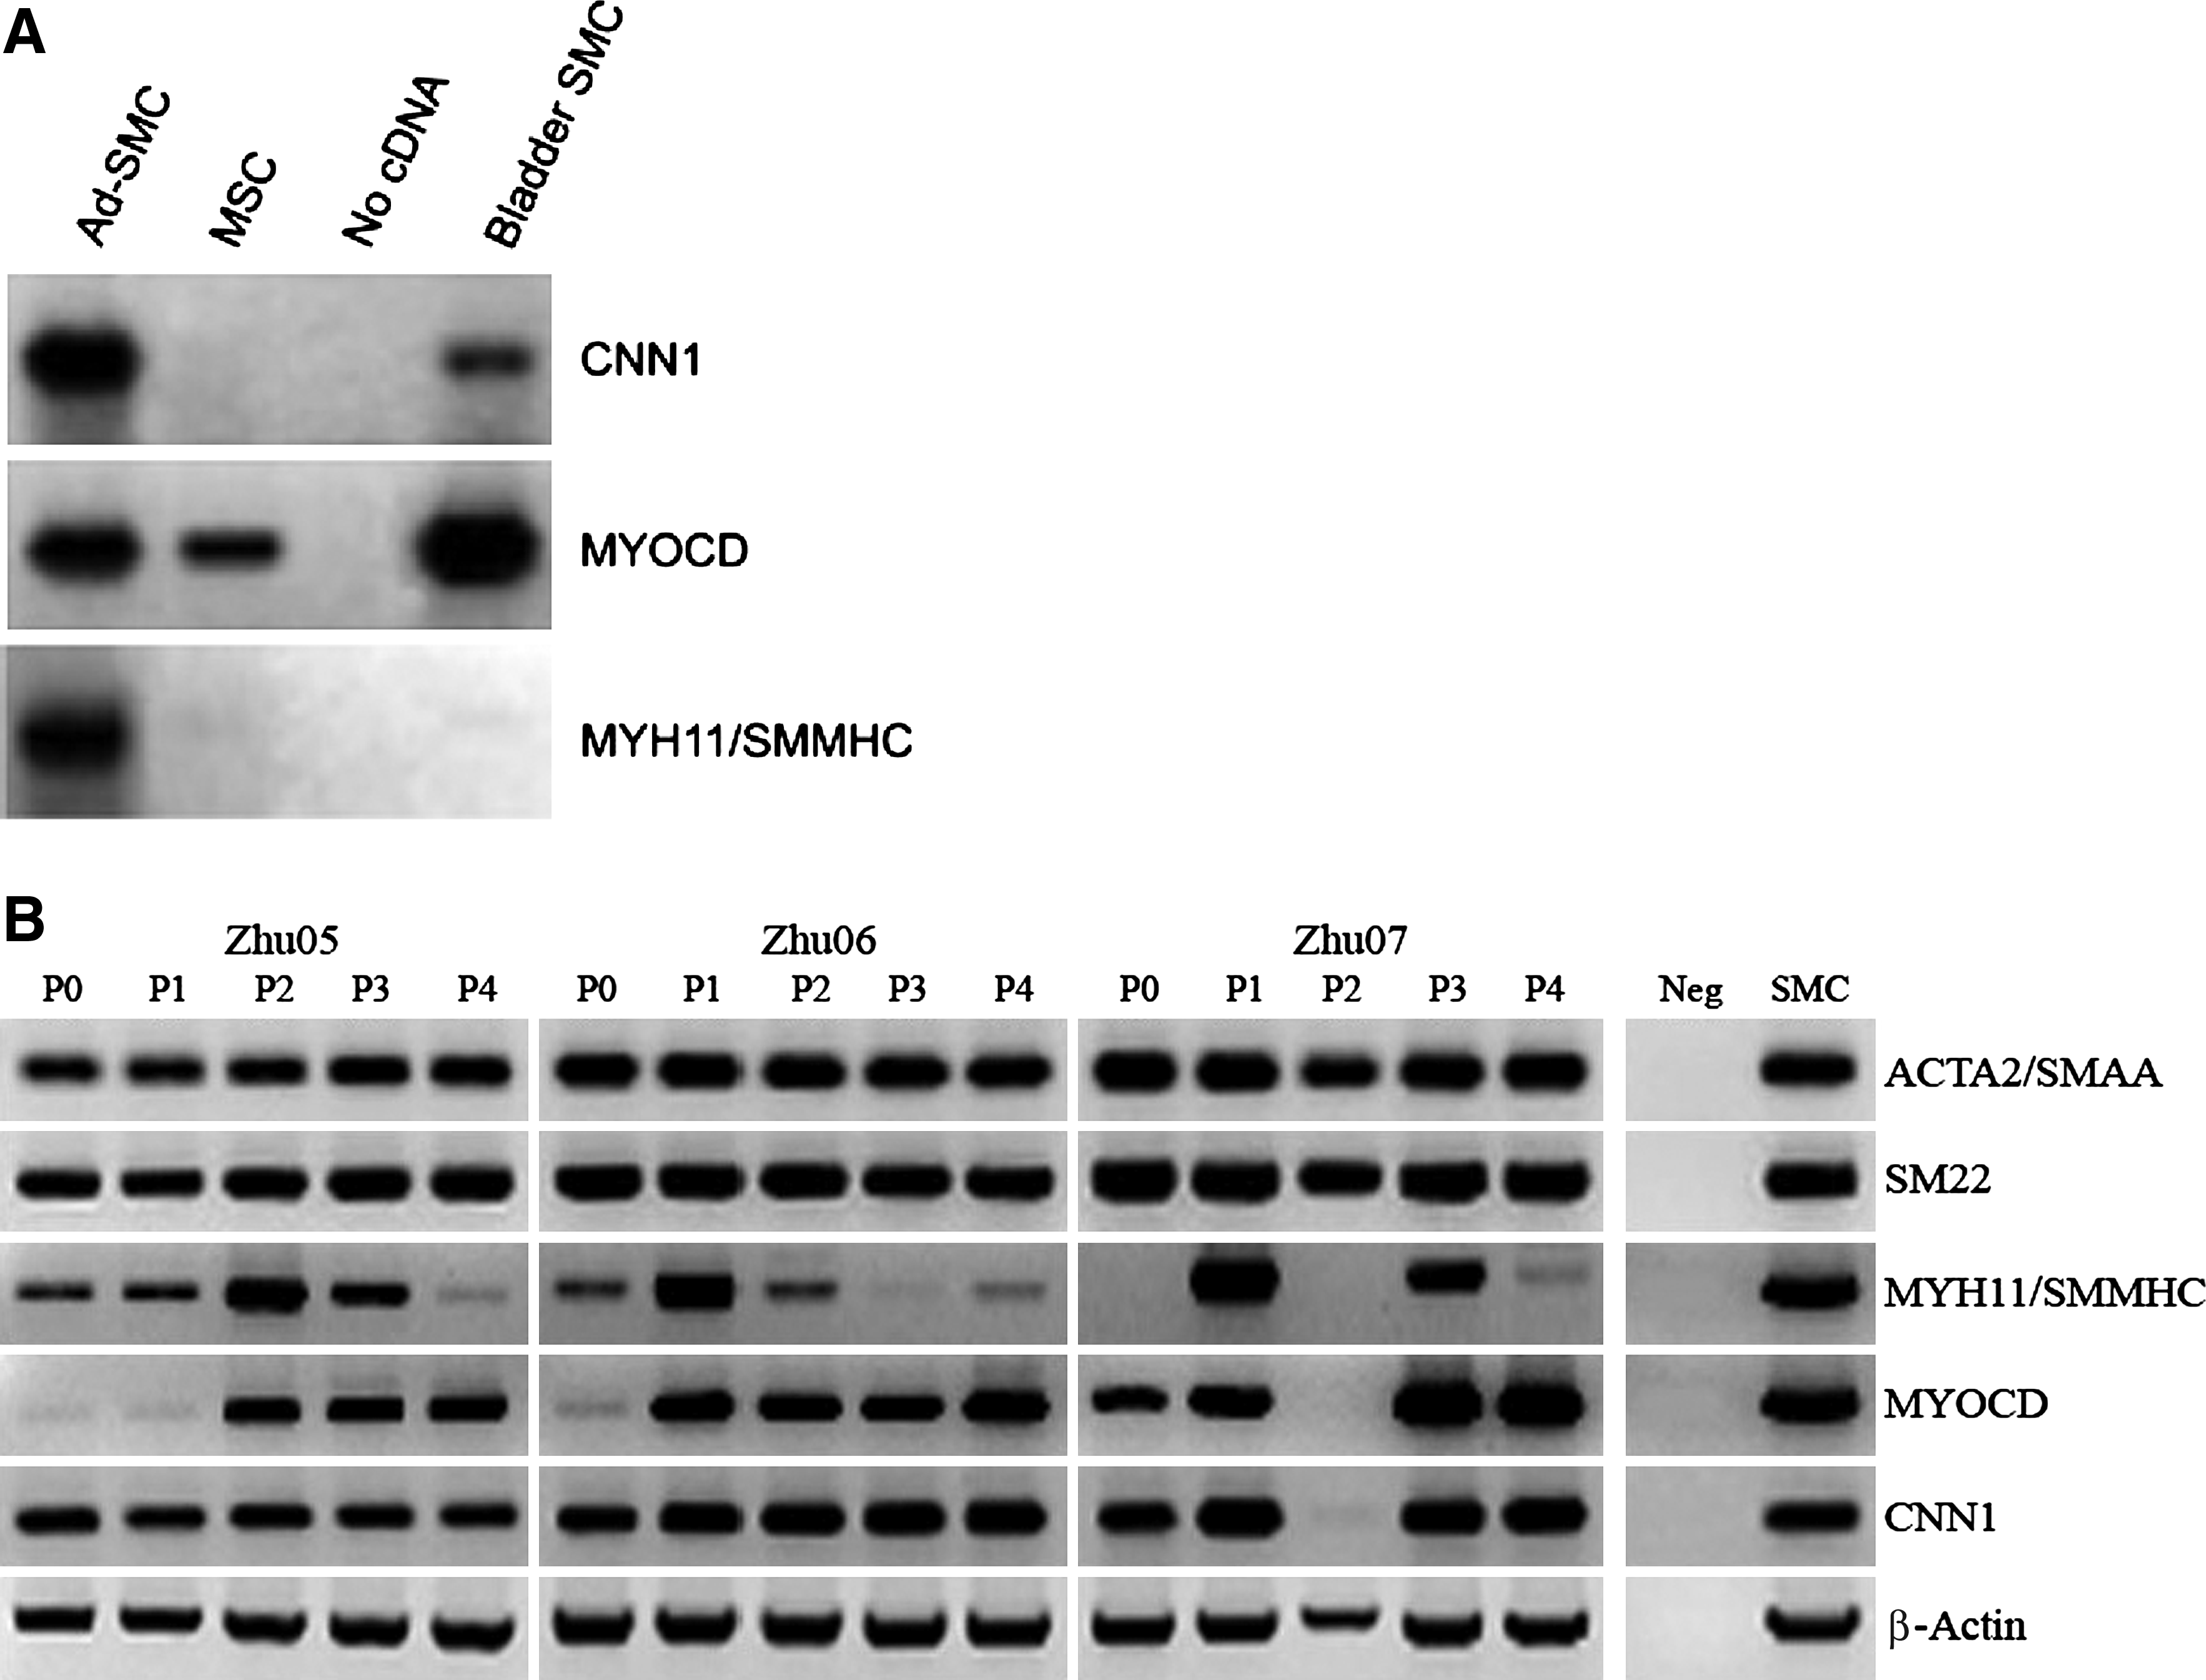
Localization of α-SMA and calponin to stress fibers within cultures of Ad-SMC confirms SMC-like phenotype
The localization of α-SMA and calponin to stress fibers is well established as an indicator of SMC-like phenotype. We therefore applied immuno-fluorescence microscopy to examine the distribution of α-SMA and calponin within cultures of Ad-SMC. Figure 4 confirms that by this definition, Ad-SMC present a phenotype similar to bladder-SMC and therefore represent a principally SMC-like cell population. In contrast, undifferentiated MSC do not robustly express α-SMA and calponin. 20

Localization of SMC-specific proteins to stress fibers in Ad-SMC
Array-based RT-PCR analysis demonstrates significant differences in gene expression of key markers between Ad-SMC and MSC
To directly compare Ad-SMC gene expression with that of MSC, array-based qRT-PCR (SABiosciences MSC Marker Array) was used to systematically identify differences in gene expression between passage controlled (P2) Ad-SMC and MSC. This MSC marker panel array profiles 84 genes involved in MSC pluripotency and self-renewal. A summary of key markers and their relative expression patterns in Ad-SMC and MSC is shown in Table 3. Significant (p<0.05) downregulation in Ad-SMC relative to MSC was observed for RUNX2, HGF, GDF5, and VCAM1. Gene expression for NT5E, ENG, ALCAM, and THY1 was found to be approximately the same for both cell types. Significant (p<0.05) upregulation in Ad-SMC compared with MSC was observed for CD44, BMP6, and IL-1B. These key differences in gene expression between Ad-SMC and MSC were consistent and independent of passage or cell sample (n=6, data not shown). Analysis of cell surface marker expression (SABiosciences Surface Marker Array) was used to compare the phenotype of Ad-SMC cultures at P0 and P4 (Table 4). Expression of the fibroblastic/stromal markers ALCAM, COL1A1, and COL1A2 was maintained across passages, as are the SMC-specific markers MYH10, MYH9, and MYOCD. Both P0 and P4 cultures were negative for the adipocyte marker RETN, indicating that there is minimal contamination from adherent adipocytes. An important distinction between Ad-SMC and MSC was also observed in this experiment; Ad-SMC P0 cultures were HLA MHC II positive and became HLA MHC II negative by P4. In contrast, MSC cultures are constitutively HLA MHC II negative. Another interesting observation was that Ad-SMC became progressively less endothelial with passage, as judged by the general trend in downregulation of the endothelial markers ENG, ICAM2, NOS3, PECAM1, SELP, TEK, VECAM, and VWF. This trend was independently confirmed by RT-PCR analysis (Fig. 5), which shows Ad-SMC were less endothelial than MSC as demonstrated by reduced overall expression of vWF, FLT1/VEGFR, KDR/FLK1, PECAM1, and CDH5/VECAD in Ad-SMC compared with MSC.
Cycle threshold is the cycle number at which the fluorescent signal emitted by the reaction crosses the detection threshold.
MSC, mesenchymal stem cell.
Change in Fold Regulation > |10.0|.
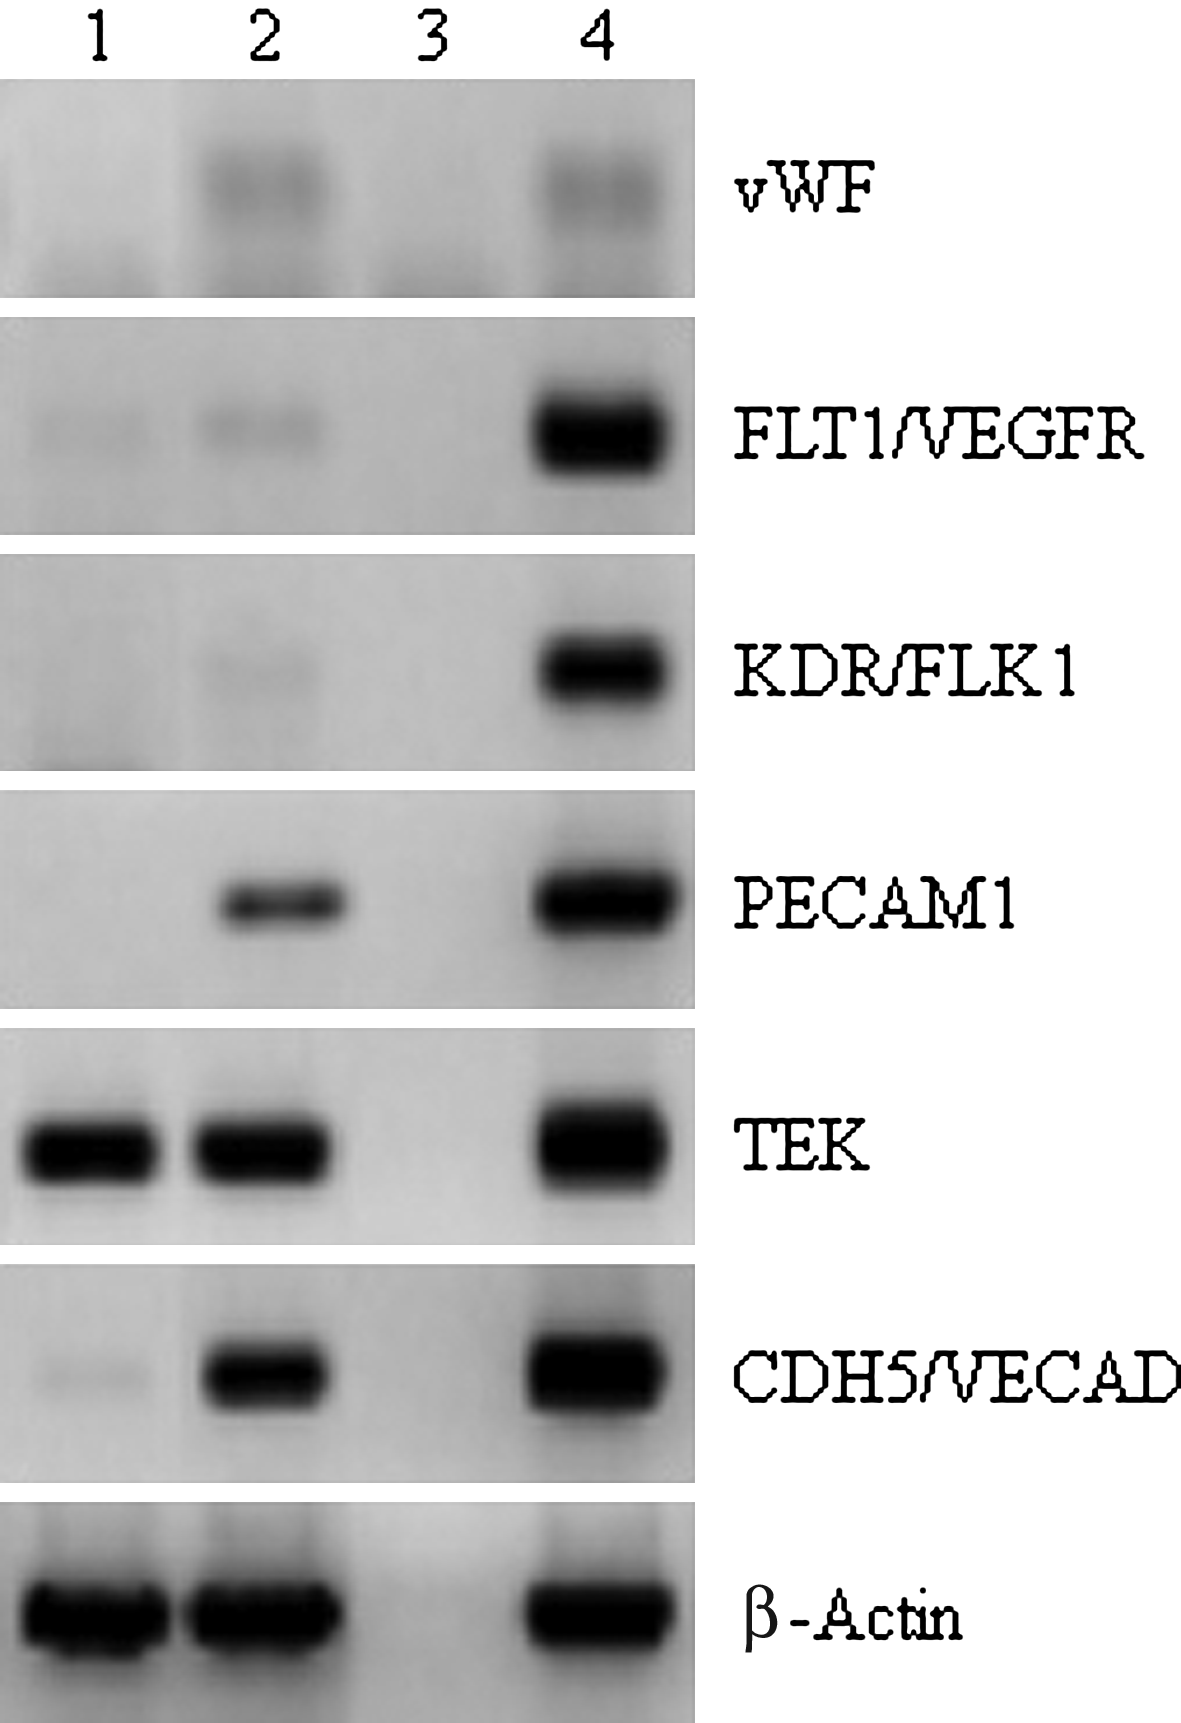
Ad-SMC are less endothelial-like than MSC. vWF, FLT1, FLK1/VEGFR, PECAM1, TEK, and CDH5/VECAD endothelial cell marker expression was assayed semi-quantitatively by RT-PCR with cDNA prepared from Ad-SMC (lane 1) and MSC (lane 2). Samples to which no cDNA was added (lane 3) and HUVEC cDNA (lane 4) were control comparators. All reactions were normalized by mass of cDNA.
The cell surface profile of Ad-SMC differs from that reported for MSC
We observed that both MSC and Ad-SMC expressed the surface markers NT5E (CD73), THY1 (CD90), and ENG (CD105), which are traditionally associated with MSC (Table 3). However, as discussed below, these markers have no intrinsic biological significance beyond their historical association with MSC. FACS analysis supported the marker analysis observations in that CD90 and CD105 proteins were clearly expressed on the surface of Ad-SMC, whereas CD73 was not (Fig. 6). When tested for expression of additional cell adhesion molecules, Ad-SMC was found to be CD117+, a clear distinction from MSC, which are CD117−. 19 The Ad-SMC preparations were CD31+, suggesting that this population lacked stemness, 26 and were negative for CD133, a marker for progenitor cells. 2

FACS analysis of Selected Cell Surface Markers in Ad-SMC. Ad-SMC were labeled with antibodies against the indicated antigens, and analyzed by flow cytometry. Representative histograms are demonstrated by the green line. The respective isotype control is shown as a red line. Cell surface marker profile of Ad-SMC: CD31+, CD73−, CD90+, CD105+, CD117+, CD133−.
Passage-controlled MSC and Ad-SMC have unique proteomic signatures
Comparative analysis of proteins expressed by each cell type at P2 revealed that the proteomic signatures of Ad-SMC and MSC are distinct (Fig. 7, white boxes). The distribution of proteins observed with Ad-SMC was clearly different from MSC isolated from adipose tissue, as well as other classes of stem and progenitor cells.27,28 In contrast, the proteomic signatures of Ad-SMC and SMC expanded from bladder tissue were similar. Densitometric analysis of proteomic profiles (Fig. 7, Table) confirms that Ad-SMC and bladder-SMC are essentially identical, whereas MSC differ from both Ad-SMC and bladder-SMC in 5/11 arbitrarily boxed areas examined. As no extraction of individual polypeptides was attempted, the identity of individual protein factors held in common or differing across the three cell populations is currently unknown.
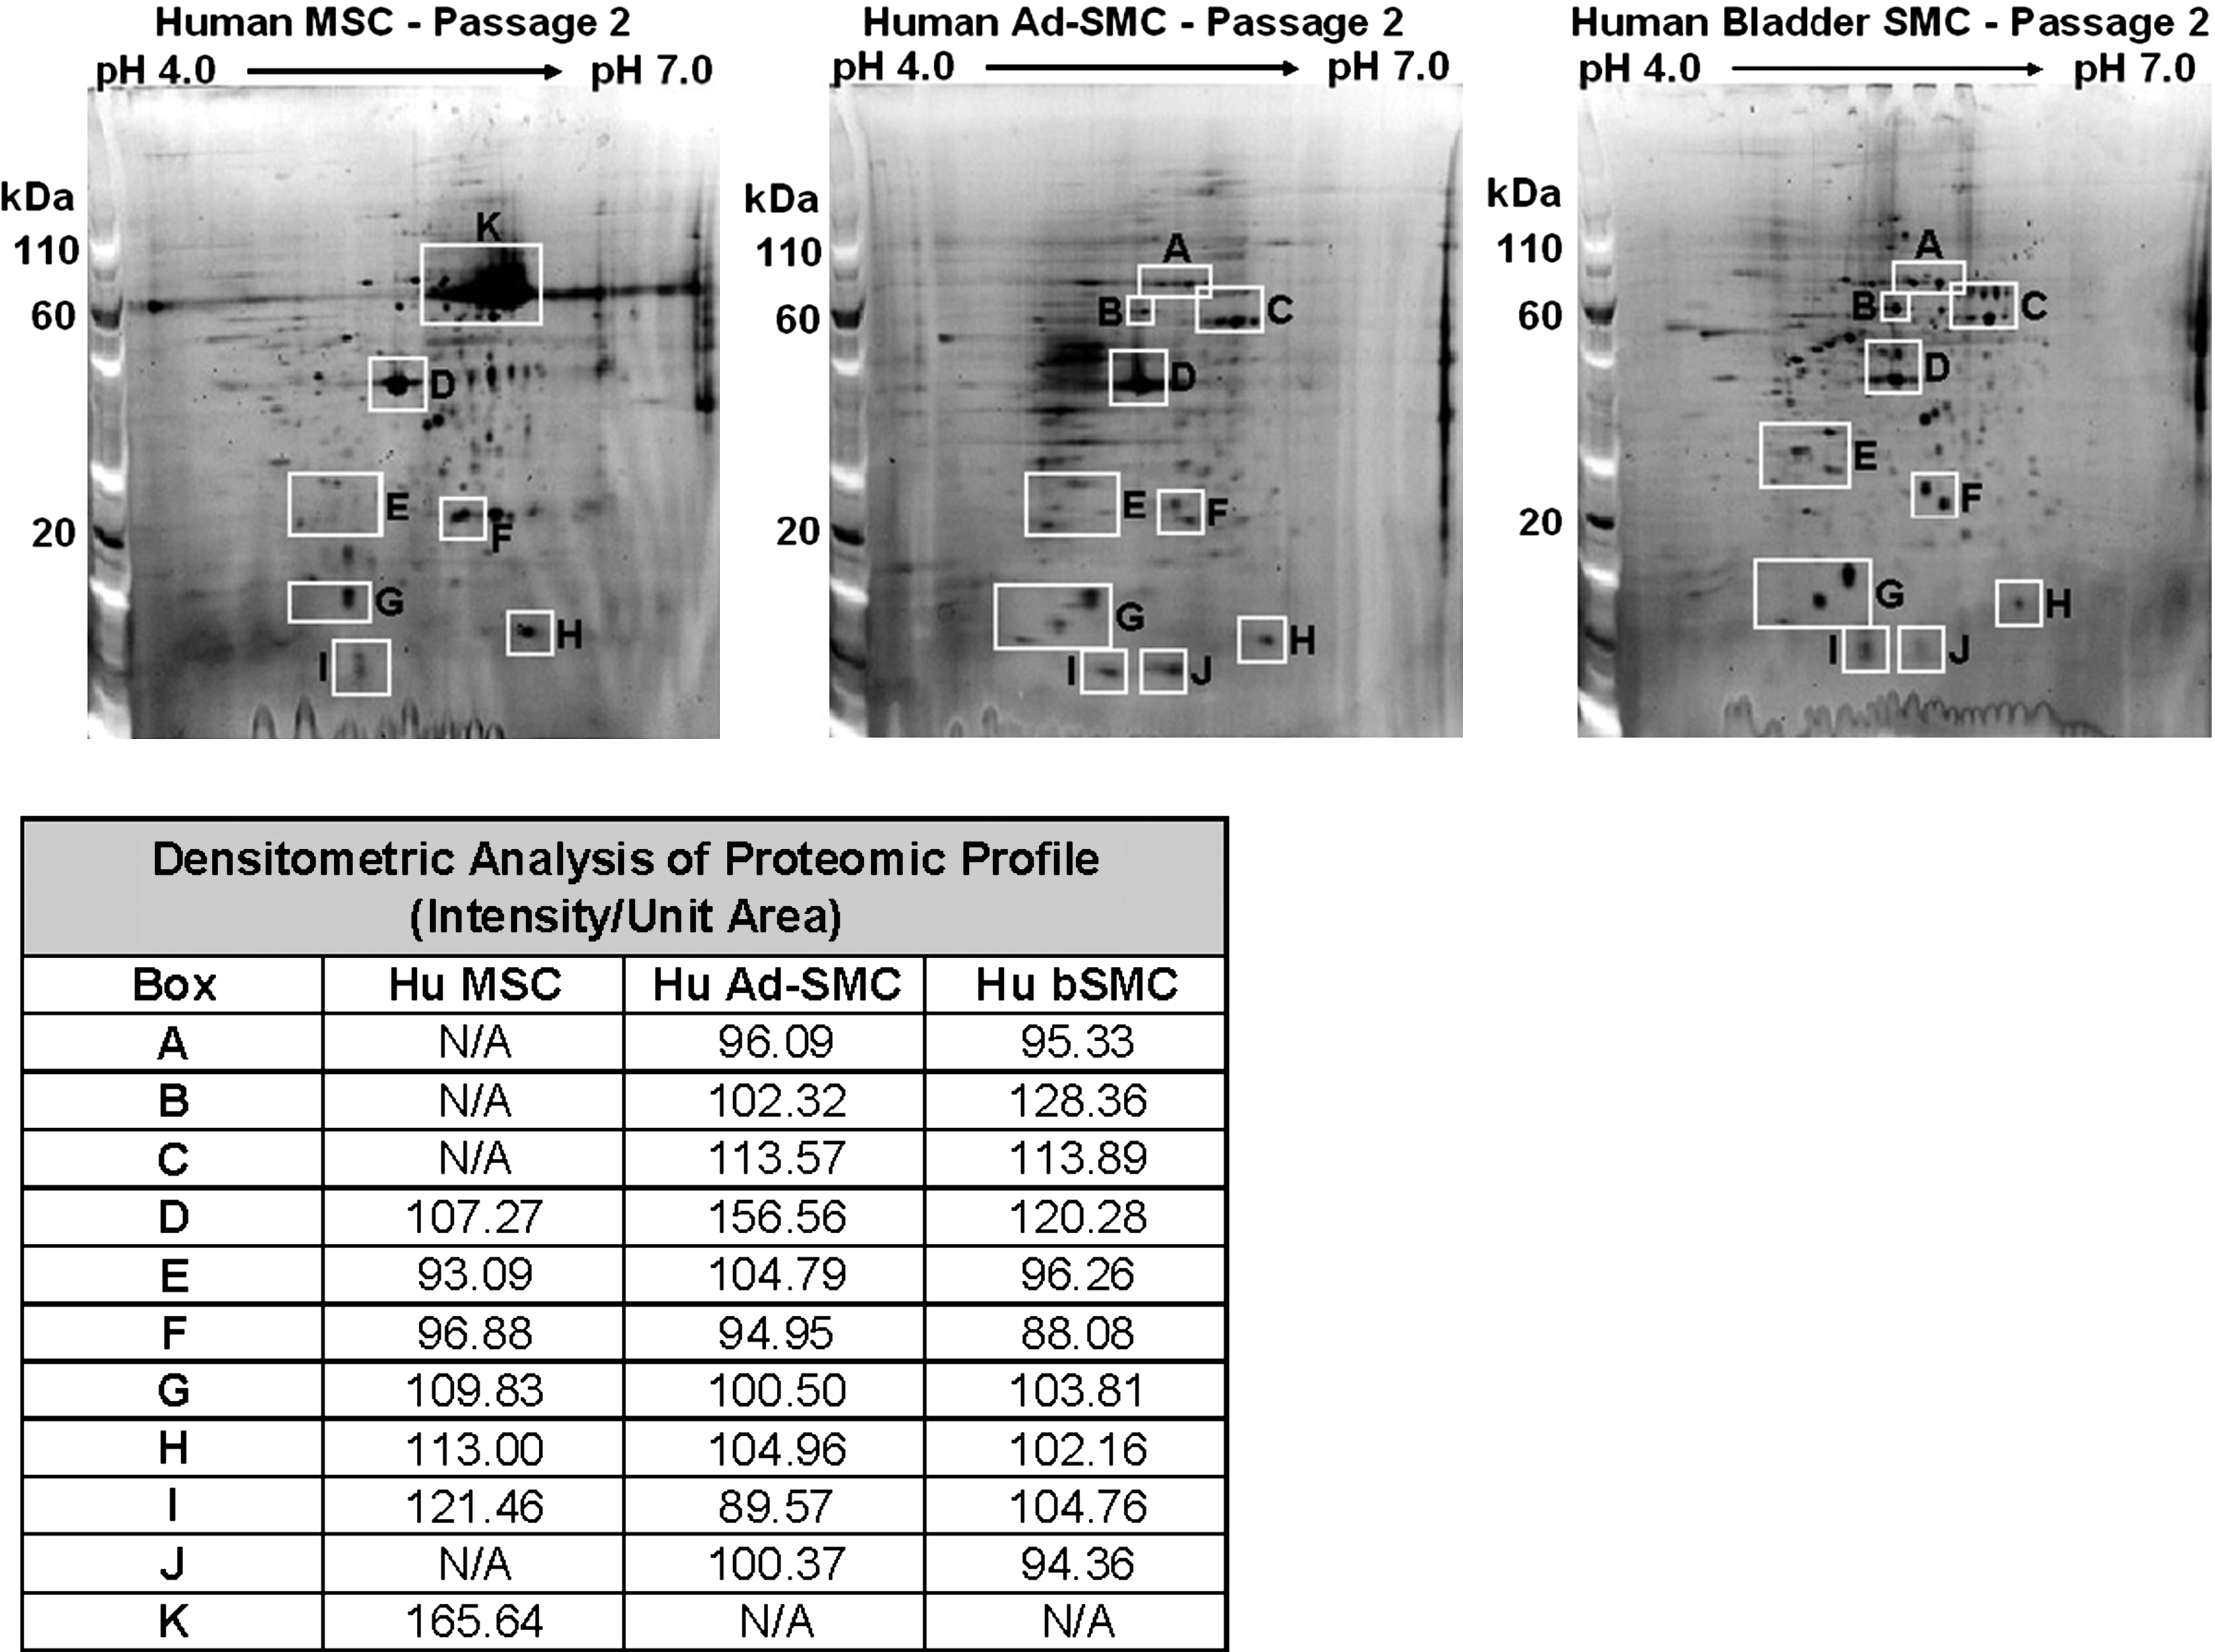
Proteomic signatures of Ad-SMC and MSC are dissimilar. Proteomic signatures were compared by two-dimensional gel electrophoresis. Protein lysates (40 μg) were isolated from bone marrow-derived MSC (left panel), Ad-SMC (middle panel), and bladder SMC (right panel) cultures at the end of passage two, subjected to two-dimensional-electrophoresis (Invitrogen), and stained with SYPRO Ruby stain (Invitrogen) according to the manufacturer's instructions. Comparative analysis of the distribution of proteins from each cell type (Table) revealed that the proteomic signatures of Ad-SMC and MSC are distinct in 5/11 areas examined by pixel densitometry; in contrast, the proteomic signatures of Ad-SMC and Bladder SMC are similar in 11/11 areas examined by pixel densitometry.
Growth kinetics of Ad-SMC differ markedly from MSC
The proliferative potential of Ad-SMC cultures differs markedly from MSC, which have been successfully expanded to 34–42 population doublings. 23 As shown in Figure 8, Ad-SMC exhibited a marked decline in proliferative capacity after the 4th–5th day in culture, which represented 2–4 population doublings. We have also observed that Ad-SMC proliferation was inhibited by cell–cell contact, unlike MSC. These observations suggest that Ad-SMC have limited proliferation capacity and are therefore not stem or progenitor cells by definition.
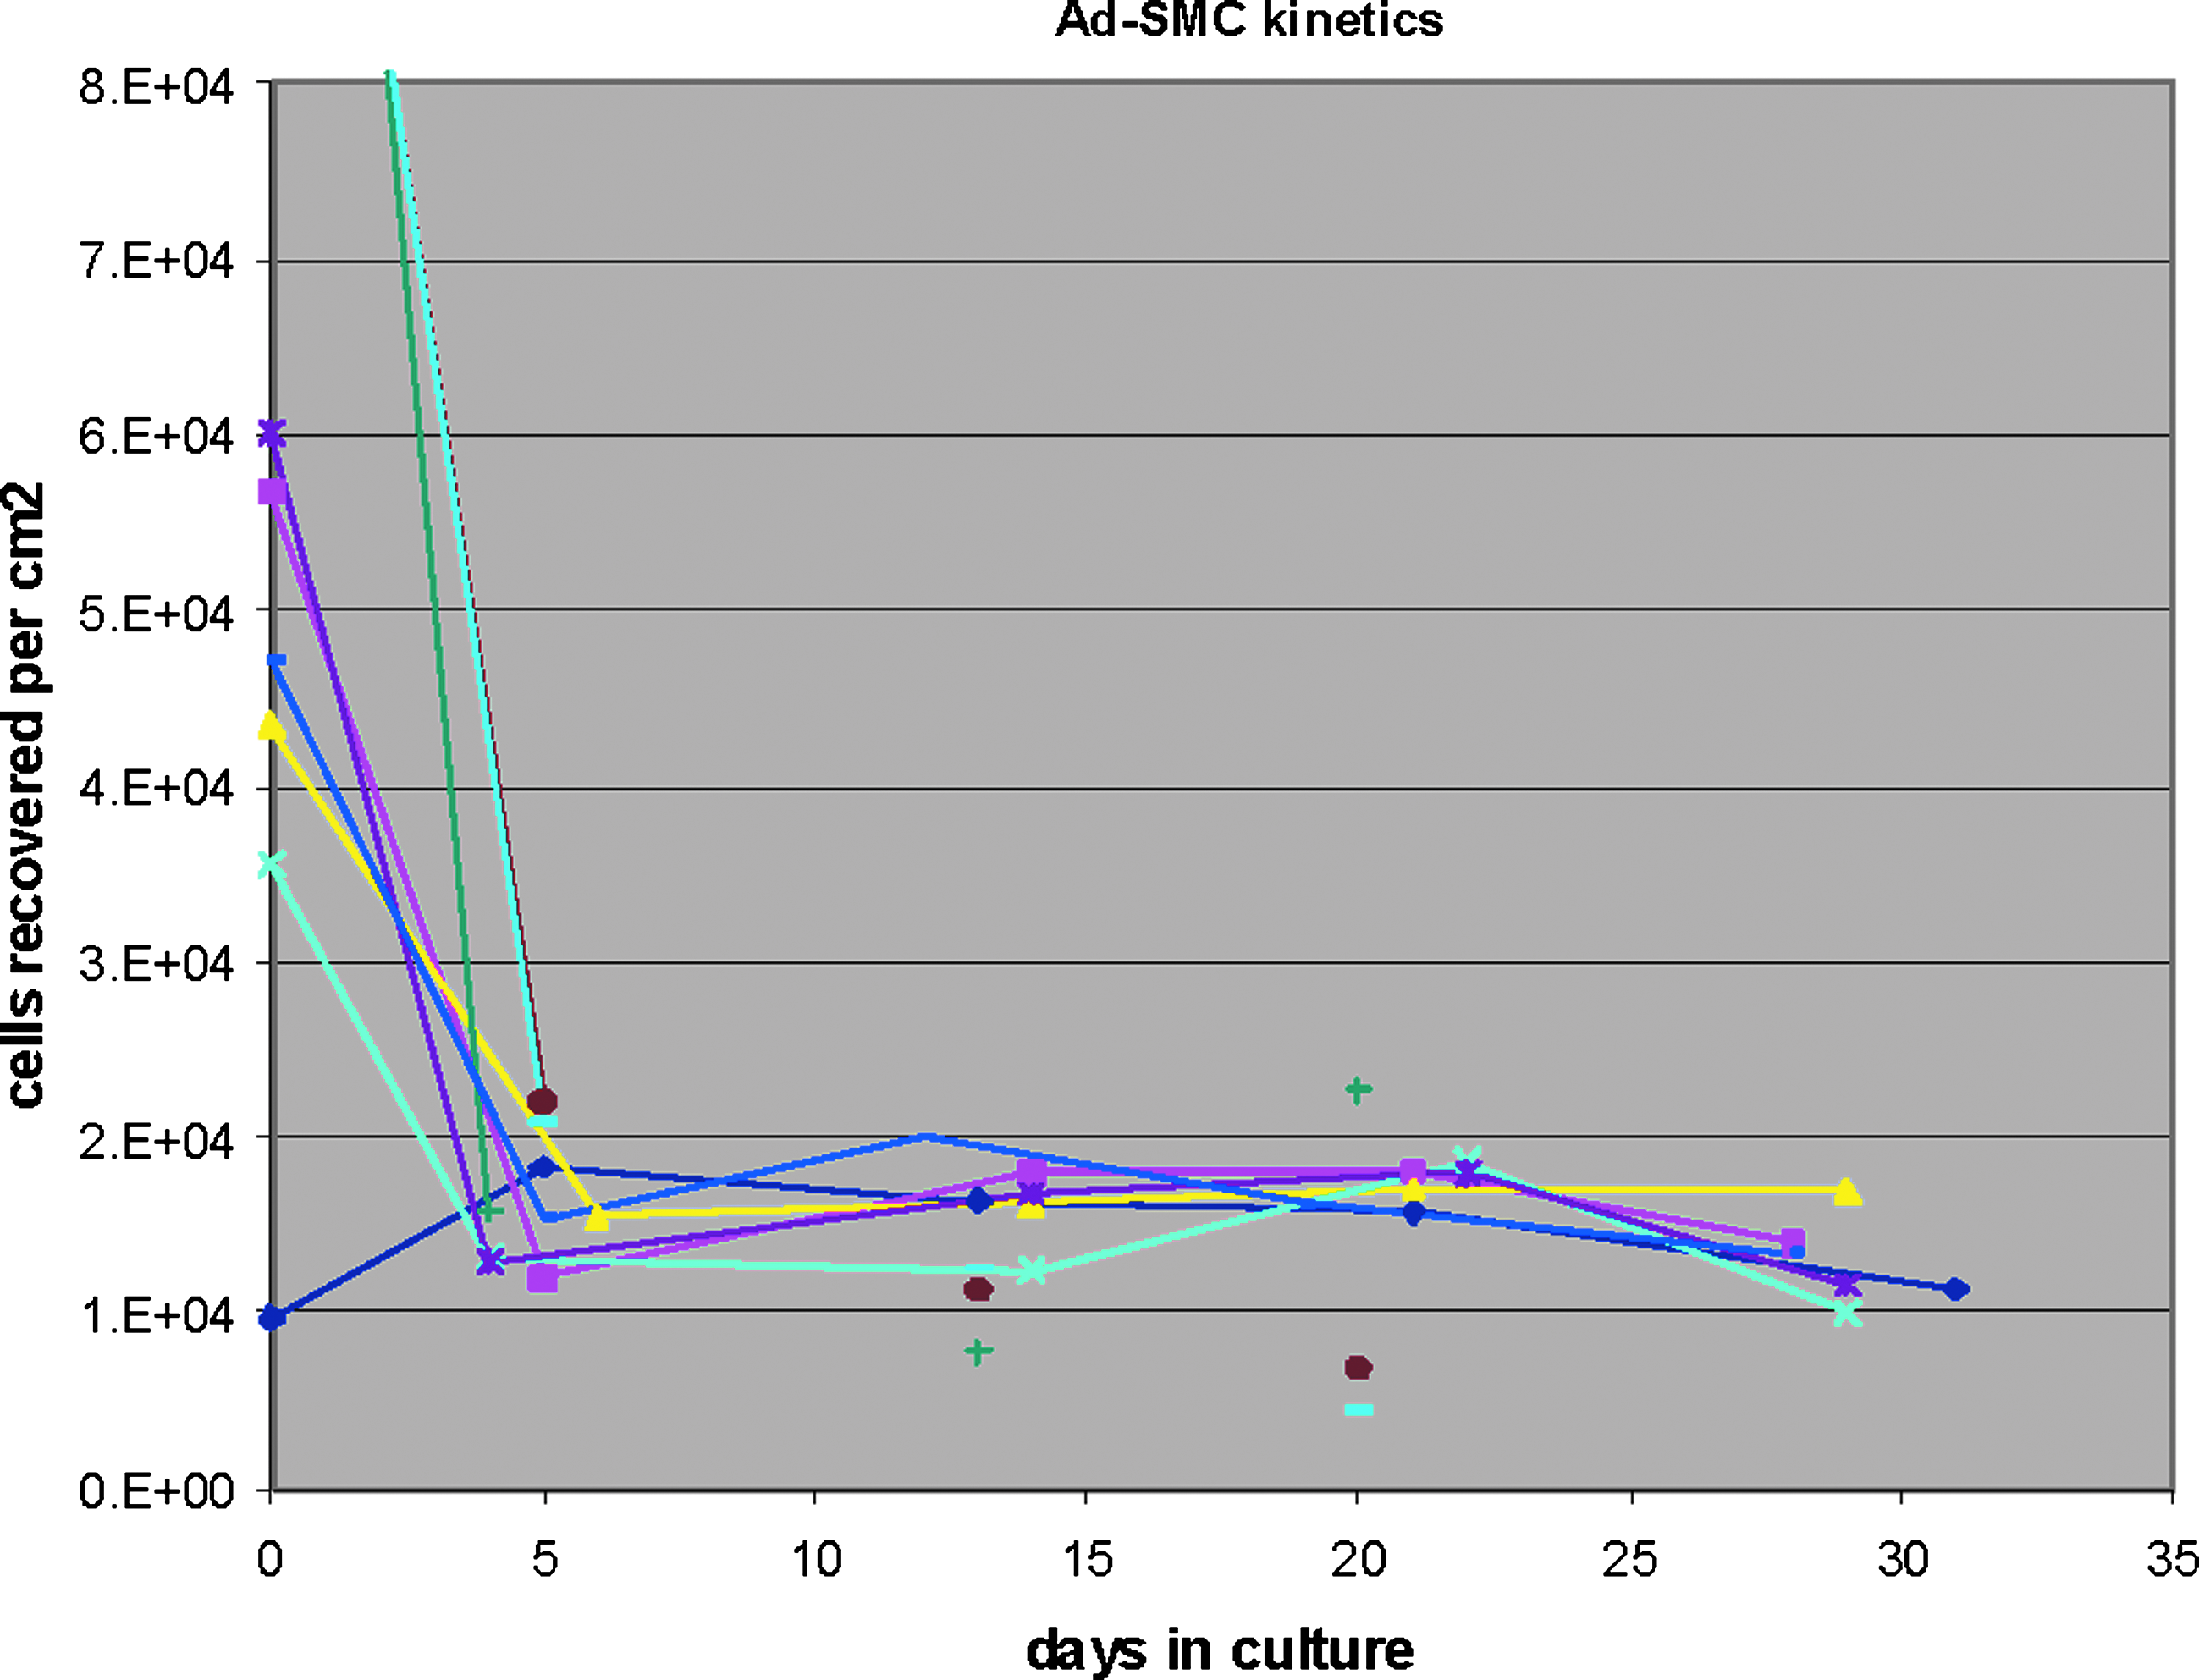
Growth kinetics of Ad-SMC. Number of Ad-SMC recovered per cm2 of tissue culture flask was evaluated over a 30-day period. Multiple independent preparations of Ad-SMC (n=9) show a sharp drop in proliferative potential by day 5, consistent with the absence of self-renewal capability.
Ad-SMC show limited in vitro tri-lineage differentiation potential
We performed comparative in vitro tri-lineage differentiation assays on passage-controlled bone marrow-derived MSC and Ad-SMC. As shown in Figure 9, qualitative histochemical evaluation of functional outcomes indicates that, as might be expected, MSC show tri-lineage differentiation bioactivity along the adipogenic (assayed by Oil-Red staining), osteogenic (assayed by the method of von Kossa), and chondrogenic (assayed by immuno-histological analysis of collagen II expression in chondrogenic pellets) lineages. However, more rigorous quantitative TaqMan qRT-PCR analysis of specific transcriptional profiles associated with differentiation bioactivity along each of the three mesenchymal lineages shows that the tri-lineage differentiation bioactivity of Ad-SMC is significantly reduced relative to MSC (p<0.01) (Fig. 9, Table). Ad-SMC cultures show no evidence of differentiation along chondrogenic and osteogenic lineages, and induction of adipogenic differentiation is significantly reduced in Ad-SMC relative to MSC (differentiated MSC: FABP4 RQ–16464.29, ADIPOQ RQ–470099.45, differentiated Ad-SMC: FABP4 RQ–3940.99, and ADIPOQ RQ–148847.44, p<0.01). These results are consistent with the presence of residual MSC-like bioactivity within early cultures of Ad-SMC.
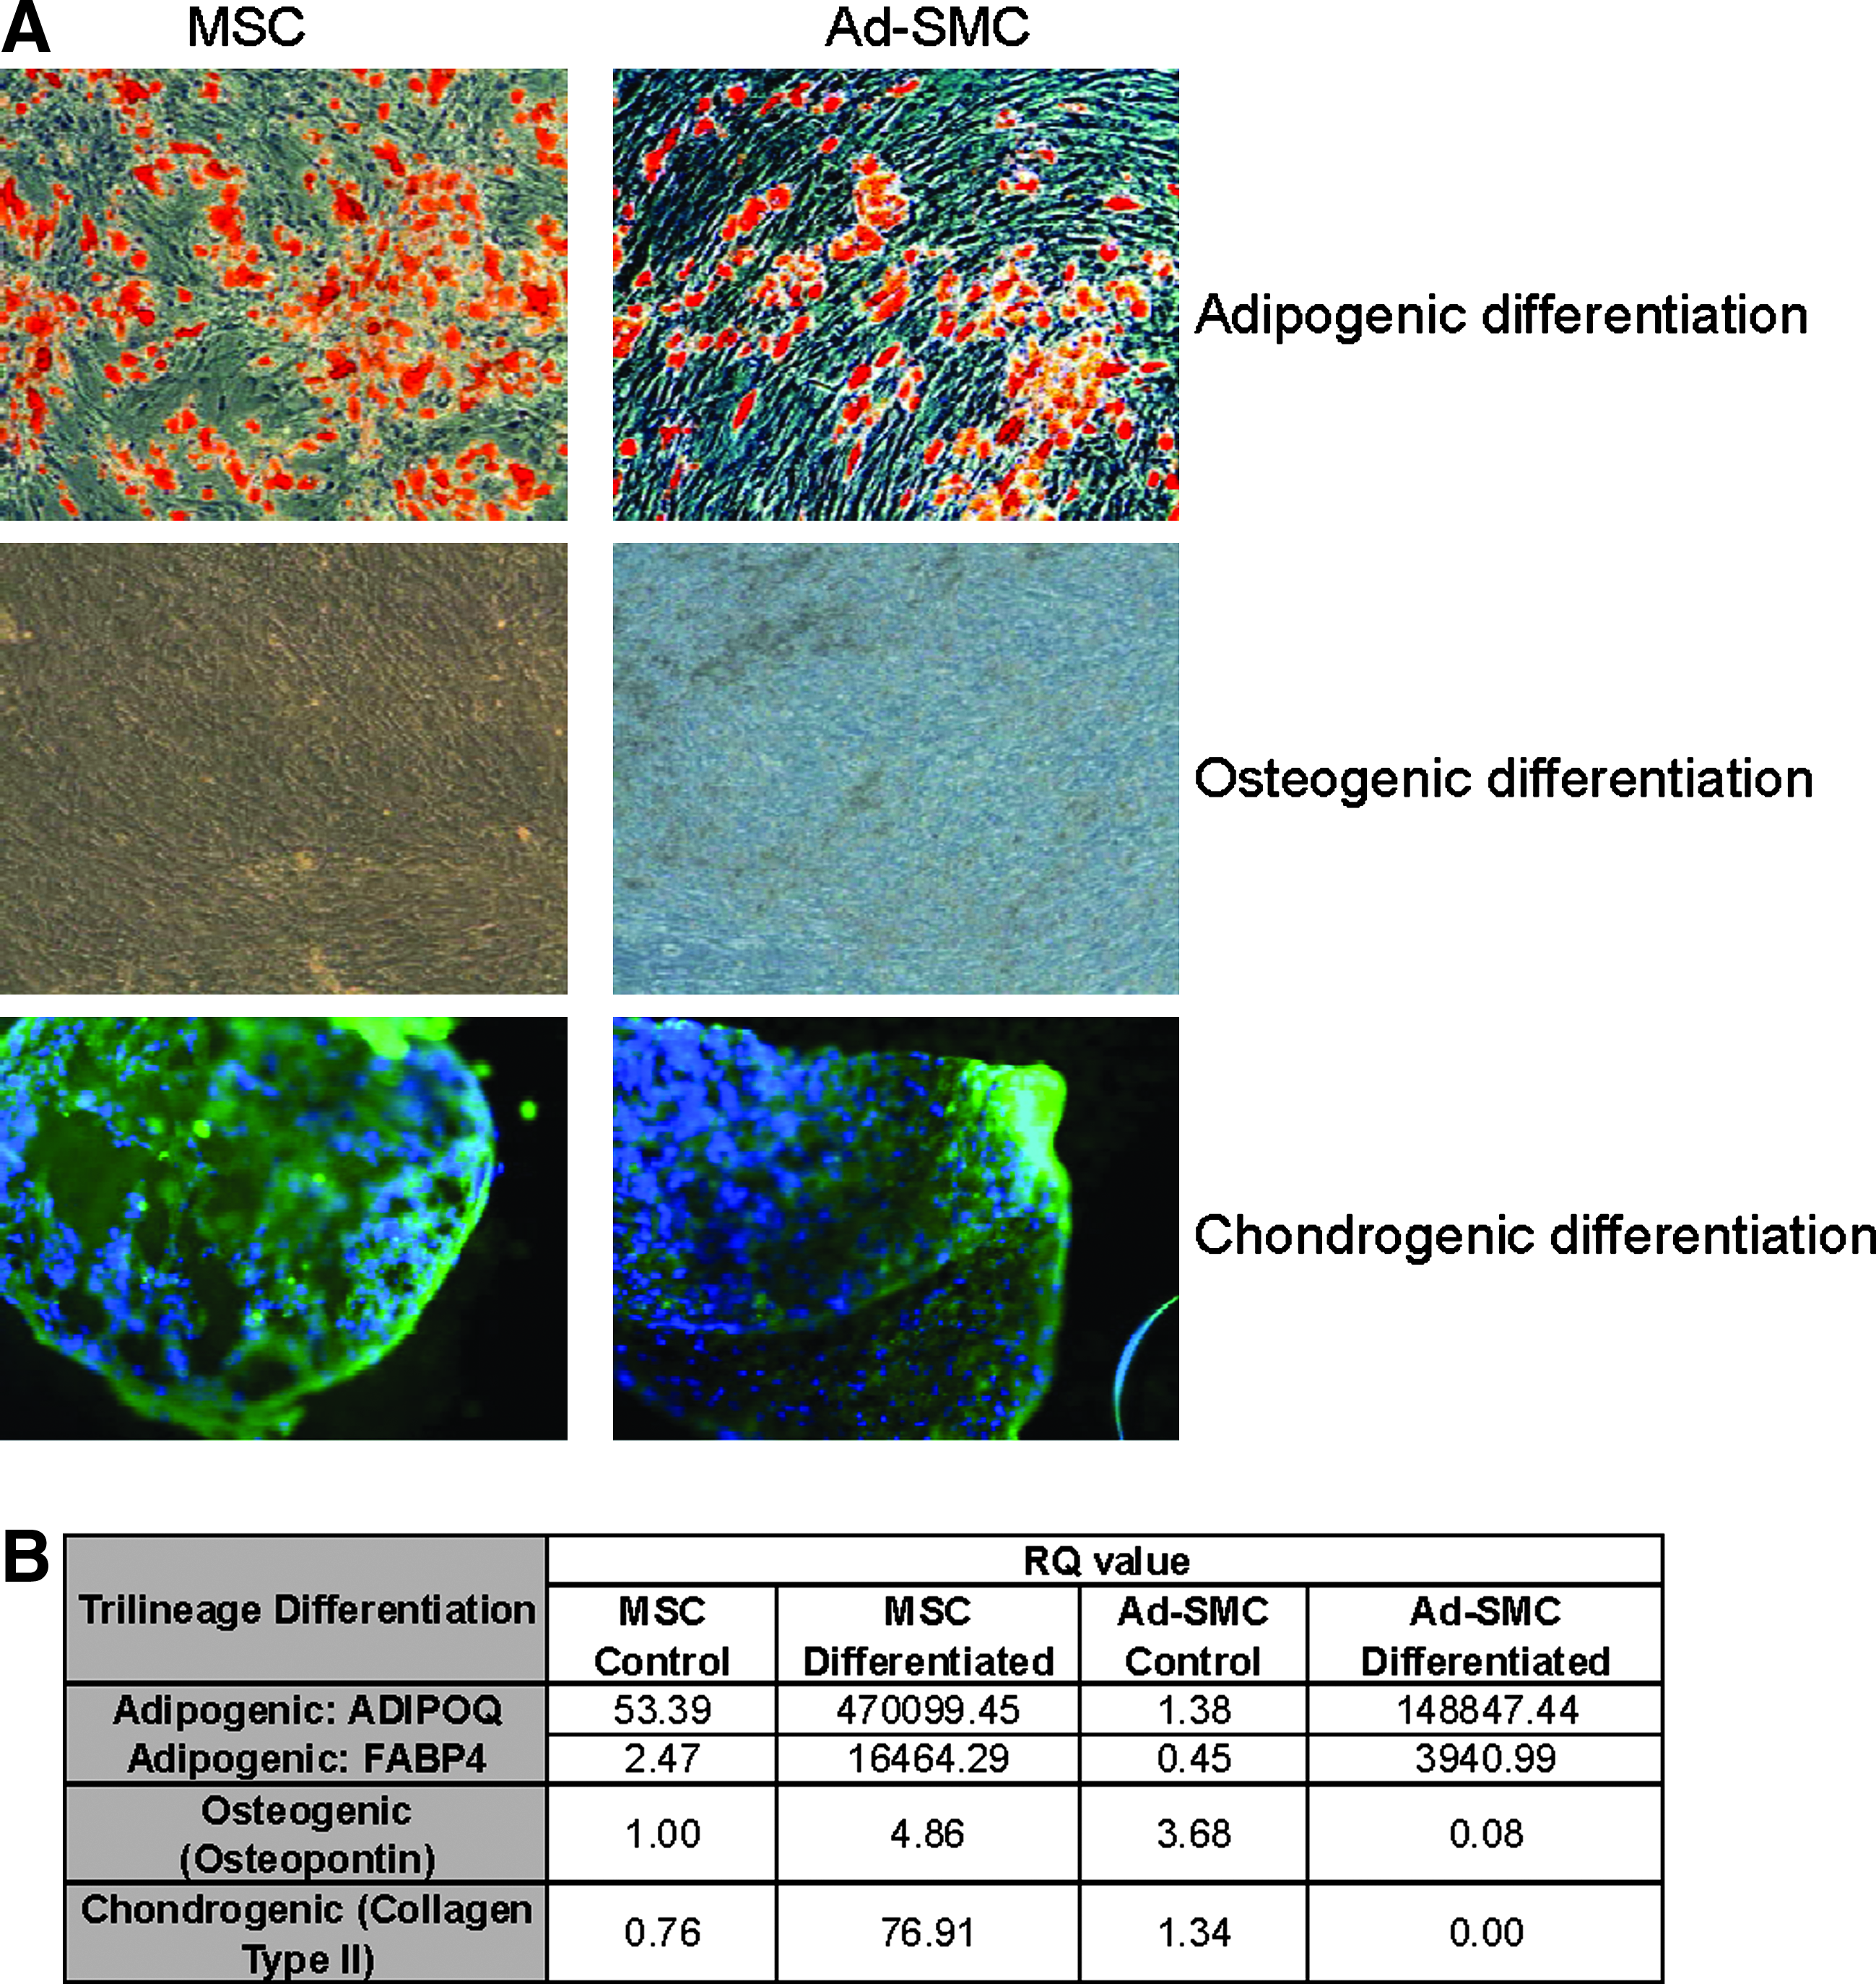
Comparative evaluation of tri-lineage differentiation potential in MSC and Ad-SMC.
Expansion of MSC-like cells from adipose SVF is contingent upon media formulation
To better define the role of media formulation upon expansion of MSC-like cell types from adipose, we cultured SVF-derived cells (isolated as described for Ad-SMC in Materials and Methods) in either DMEM-HG/10% FBS, α-MEM/10% FBS, L15/10% FBS, or SMCM media to end of P2. Rather than apply the lengthy, full in vitro tri-lineage differentiation protocol across multiple media types, we elected to leverage the more straightforward, adipogenic differentiation methodology as a proxy for the presence of MSC-like bioactivity. As shown in Figure 10, adipose SVF-derived cells expanded in SMCM media present a significantly higher frequency of adipogenic progenitors relative to all other media formulations examined. Conversely, SVF-derived cells maintained in basal media formulations without inductive growth factors or cytokines (DMEM-HG/10% FBS, α-MEM/10% FBS and L15/10% FBS) before induction of adipogenesis present a much lower proportion of adipogenic progenitors. Differentiated adipocytes are present at increased frequency from adipose SVF cells maintained in SMCM as early as 4 days subsequent to induction of adipogenesis (Fig. 10). Taken together, these data confirm that modulation of media formulation is critical for expansion of cells with MSC-like bioactivity from adipose SVF.

Effect of media type at isolation on expansion of MSC-like cells from adipose SVF. Cells derived as indicated in Materials and Methods from adipose SVF were expanded in the following media types. SMCM, Dulbecco's modified Eagle's medium-high glucose/10% FBS, α-MEM/10% FBS, L15/10% FBS. Induction of adipogenesis was initiated at day 0 (d0) and continued until day 15 (d15). Phase-contrast images of living cells show clearly visible mature adipocytes containing numerous oil droplets. Magnification=10×. FBS, fetal bovine serum. Color images available online at
Ad-SMC and MSC have distinct responses to U46619 treatment
U46619 is a thromboxane A2 mimetic whose effects include increasing intracellular Ca2+ levels, activating RhoA, Ca2+/calmodulin-dependent kinase, and activating myosin light chain kinase (MLCK) signaling cascades. U46619 has also been shown to induce smooth muscle-like differentiation in human MSC. 29 Figure 11 confirms that treatment with U46619 (1 μM) led to upregulation of the key SMC markers MYOCD and MYH11/SMMHC in MSC. In contrast, the Ad-SMC response was unambiguous downregulation of MYOCD and MYH11/SMMHC expression, which is clear evidence of a functional dichotomy between Ad-SMC and MSC.

Ad-SMC and MSC have opposite responses to treatment with U46619, a thromboxane A2 mimetic. MSC and Ad-SMC cultures were exposed to 1 μM U46619 at 37°C for 72 h (+lanes) before preparing cDNA for semi-quantitative RT-PCR analysis. Samples to which no cDNA was added (No cDNA), Bladder SMC cDNA, and β-actin expression, which does not respond to U46619, were control comparators. Responses of mature smooth muscle markers MYOCD and MYH11/SMMHC to U46619 addition to MSC cultures (red boxes) were as previously reported. MYOCD and MYH11/SMMHC responses to U46619 addition to Ad-SMC cultures (blue boxes) was opposite that observed in MSC cultures. Note that the expression of MYOCD and MYH11/SMMHC in Ad-SMC before treatment with U46619 is comparable to that observed for Bladder SMC. All RT-PCRs were normalized by mass of cDNA.
Discussion
Adipose tissue contains a heterogeneous mix of cell types, including adipocytes, endothelial cells, pericytes, SMC, and MSC. 30 Adherent cells that were derived from adipose tissue using different conditions have been referred to as MSC without applying a systematic approach to defining the isolated cell composition17,31,32; however, as has been demonstrated in the studies presented here, distinctly different cell types can share phenotypic characteristics. As more cell-based therapies move from preclinical to clinical evaluation, establishing a cell composition profile that provides a degree of distinction from other cell types will likely become increasingly important for protecting intellectual property rights, gaining regulatory approval, and scaling up for manufacturing. The relevance of cell type characteristics defined from analysis of native tissue or initial cell isolates to expanded cell populations is unclear because gene and protein expression patterns can be altered by isolation and in vitro expansion. Such differences have been documented for MSC 17 and the data presented in this study confirm that the same is true for Ad-SMC. The more important questions from a product development perspective are what characteristics are associated with the cell population that will be administered and how indicative are those characteristics with regard to cell identity and product potency. Hence, this study compared MSC and Ad-SMC at stages of in vitro expansion that were relevant to cell-based regenerative medicine products. 13
Although cells characterized as MSC have been isolated from adipose and other organs on the basis of in vitro tri-lineage differentiation assays, MSC isolated from bone marrow remains the only MSC that has been functionally validated in vivo by the criteria of complete heterotypic ossicle formation and is recognized universally as a gold standard for MSC. 14 Therefore, we have focused on leveraging bone-marrow MSC as a comparator against Ad-SMC. Although we are comparing cell populations sourced from different tissue types and grown under different conditions, it is important to clarify that it is not our current objective to dissect the specific influences of tissue sources and culture media on cell phenotypes and functionality. Rather, our objective is simply to compare the cell population we are isolating from adipose (Ad-SMC) using the methods described in this article with a well established, functionally validated SMC population (we have chosen bladder SMC) and a well-established, functionally validated MSC population (we have selected bone-marrow MSC) and reference Ad-SMC accordingly against these benchmarks. For these cell types to unambiguously manifest their established, defined phenotype and functionality, they must be isolated and expanded in media formulations optimized for that particular cell type. MSC, SMC, and Ad-SMC express their unique phenotypic characteristics and functionality contingent upon isolation, expansion, and maintenance in defined lots of basal media formulation, low or high serum, selected lots of serum, cell density, presence or absence of inductive cytokines, and the like. Any attempt to alter these optimal parameters will necessarily result in a cell population with properties markedly distinct from that established in the literature for that cell type. For example, it is well known that the growth of MSC in media not optimized for MSC results in rapid loss of in vitro tri-lineage differentiation bioactivity and results instead in a cell population that is principally fibroblastic. Similarly, expansion of Ad-SMC in SMCM media instead of DMEM-HG/10% FBS results in a marked increase in the frequency of cells with MSC-like bioactivity (Fig. 10). Therefore, meaningful relative phenotypic and functional comparisons may only be made with cell populations isolated and expanded in media optimized for that cell type. To this end, bladder-SMC was maintained in DMEM-HG/10% FBS, the definitive media formulation for this cell type in accordance with historically established protocols describing growth of bladder-SMC for comparative analysis.33,34 Further definition of bladder-SMC phenotype was provided by genome-wide transcriptomic characterization of bladder-SMC based on bladder-SMC expanded in DMEM-HG/10% FBS.35,36
Our comparison of Ad-SMC and MSC leveraged established definitions of SMC and MSC and focused on the analysis of smooth muscle phenotype, growth kinetics, in vitro tri-lineage differentiation bioactivity, and functional responses to small molecules that affect SMC-specific signaling pathways. Adherent cells derived from human adipose and cultured in DMEM-HG/10% FBS media consistently displayed an SMC phenotype as shown by expression of ACTA2/SMAA, SM22, MYH11/SMMHC, CNN1, and MYOCD (Figs. 2 and 3). SMC-like phenotype of Ad-SMC was unambiguously confirmed by immunolocalization of α-SMA and calponin to stress fibers within cultures of Ad-SMC (Fig. 4). Interestingly, expression of SMC-associated markers was observed to differ between Ad-SMC and bladder-SMC. In particular, as shown in Figure 3A, the ratio of CNN1/MYOCD is inverted in Ad-SMC relative to bladder SMC. Further, little or no expression of SMMHC transcript was observed from bladder SMC, in contrast to the robust expression of SMMHC mRNA from Ad-SMC. This is consistent with our published documentation of transcriptional variability of SMC-associated markers in SMC derived from multiple smooth muscle sources 25 and is also consistent with the notion that Ad-SMC represents a population distinct from MSC and better characterized as SMC-like. Although endothelial and adipocytic markers were detectable during the initial 24–48 h after plating (Fig. 1), the cultures became progressively more SMC-like and less endothelial with passage (Table 4). This expression profile was maintained across multiple passages and independent of donor source (Fig. 3B). That bladder-SMC is not identical to Ad-SMC is consistent with observed differences in gene expression profiles seen in Figures 2 and 3.
An array-based screening approach was used (Table 3) to identify a core group of markers that consistently and unambiguously discriminated between Ad-SMC and MSC. Such analyses can contribute to cell-based product development by identifying markers with which to monitor and assess cell identity. BMP6, CD44, and IL-1B all demonstrated significantly greater expression in Ad-SMC compared with MSC (p<0.05), whereas GDF5, HGF, RUNX2, and VCAM1 demonstrate significantly greater expression in MSC relative to Ad-SMC (p<0.05). These results were consistent across multiple donor samples (n=3), suggesting that these observations are not a consequence of donor variability or random fluctuations in gene expression levels. BMP6 is a member of the transforming growth factor (TGF)-β superfamily which has been implicated in the regulation of chrondrogenesis and osteogenesis during MSC differentiation.37,38 The relative lack of BMP6 expression may be a stable characteristic of adipose-derived MSC because chondrogenic induction required addition of both TGF-β3 and BMP6 to adipose-derived MSC, whereas addition of TGF-β3 alone was sufficient to induce chondrogenic differentiation in bone marrow-derived MSC. 37 Interestingly, addition of BMP6 to adipose-derived MSC cultures also resulted in an increase in TGF-β1 receptor gene expression. 37 It is well-established that the TGF-β signaling pathway participates in SMC-specific developmental pathways. 39 In addition, Ad-SMC expressed MHC Class II genes at early passage (Table 4) whereas MSC are consistently observed not to express MHC Class II genes. 40 Interestingly, Ad-SMC also express CD31 (Fig. 6), and co-expression of CD31 and MHC Class II genes was previously found to be characteristic of a cell population isolated from adipose that was demonstrated to be more differentiated than the CD31-negative MSC population. 26 Ad-SMC were also found to be limited in proliferation potential (Fig. 8), a characteristic also observed previously in the non-MSC, CD31-positive cell population 26 and a clear distinction from the high capacity for self-renewal demonstrated by MSC.23,41,42 Taken together, these data suggest that Ad-SMC represent a more fully differentiated, less MSC-like cell population.
This interpretation is corroborated by the densitometric analysis of 2D whole proteome profiles of Ad-SMC, bladder-SMC, and bone-marrow MSC shown in Figure 7, which demonstrates that within the arbitrarily sampled areas, Ad-SMC and MSC have distinctive and unique proteomic signatures, whereas Ad-SMC and bladder-SMC are essentially identical. As no extraction of individual polypeptides for mass spectrometric analysis was attempted, the identity of protein factors differing or held in common across all three cell populations remains unknown at this point and will be the subject of future investigation. Additional comparison of the Ad-SMC proteomic profile with that reported for adipose-derived MSC and other classes of stem or progenitor cell shows little, if any, significant overlap.17,28 In parallel with these gene expression studies, we have examined the expression of key MSC-associated cell surface markers on Ad-SMC by FACS. Both Ad-SMC and MSC are positive for CD90 and CD105, but Ad-SMC were negative for CD73, a well-established marker for MSC. 43 Further, Ad-SMC were observed to be CD117+(Fig. 6), which unambiguously discriminates them from MSC derived from either adipose or bone marrow sources.19,44 Although Ad-SMC may share some cell surface markers with MSCs (e.g., CD90 and CD105), Ad-SMC are clearly distinct from MSC in the expression of other established markers (e.g., CD117). Although CD31+expression may be consistent with an endothelial phenotype, results shown in Figures 3–5 confirm that Ad-SMC are principally SMC-like and not endothelial-like. As criteria for definition of SMC-like cells do not focus on cell surface marker profile, comparison of Ad-SMC with bladder-SMC would be uninformative and was therefore not performed.
The functional properties of Ad-SMC clearly show absence of defined, stem-cell-like bioactivity. We have evaluated the in vitro tri-lineage differentiation bioactivity of passage-controlled Ad-SMC relative to functionally validated, bone-marrow MSC using a combination of established, nonquantitative histo-chemical methodologies and quantitative TaqMan qRT-PCR. Histochemical results (Fig. 9) are consistent with limited in vitro tri-lineage differentiation bioactivity within Ad-SMC. However, quantitative gene expression analysis of key markers of mesenchymal differentiation demonstrate statistically significantly less robust differentiation bioactivity in Ad-SMC relative to MSC (Fig. 9, Table). These data indicate that Ad-SMC harvested at the end of P2 may contain a sub-population of cells with residual MSC-like bioactivity. This is not unexpected and is consistent with published observations documenting in vitro tri-lineage differentiation bioactivity within fibroblastic (i.e., non-MSC) cell populations.5–8 We then proceeded to examine the specific influence of media formulations on the isolation of MSC-like cells from adipose-SVF. Using induction of adipogenesis as a rapid proxy for mesenchymal differentiation bioactivity, we show that expansion of cell types with MSC-like bioactivity is directly contingent upon media formulation. Adipose SVF-derived cells expanded in SMCM present a significantly greater frequency of adipogenic progenitors relative to all other media types examined (Fig. 10). It is reasonable to question why a media formulation ostensibly designed for SMC does not facilitate expansion of SMC-like cell types from SVF. To this end, SMCM represents an extensively supplemented media formulation optimized to trigger rapid expansion of a homogenous population of fully differentiated SMC by acceleration of cell cycling times. Within the context of the heterogeneous SVF, such supplementation appears to drive selection for cell types with MSC-like bioactivity. In contrast, SVF-derived cells expanded in media formulations principally basal in composition (DMEM-HG, α-MEM, L15) without supplementation by inductive cytokines or growth factors and without the use of prescreened lots of FBS present markedly fewer adipogenic progenitors.
Unlike methodologies for MSC, isolation and expansion of Ad-SMC is specifically promoted by growth of adipose SVF-derived cells at low cell densities in the absence of positive/negative selection through magnetic bead-based separation, 45 inductive cytokines or growth factors, 28 high serum (>10%) concentrations,3,46 or preselected lots of serum. 47 The specific influences of media formulations on isolation and expansion of cells with MSC-like bioactivity have been extensively documented.20,21,48,49 Expansion of Ad-SMC is therefore the default outcome from culture of SVF-derived cell populations in principally basal media formulations at high cell densities not supplemented by inductive cytokines, preselected lots of serum or high concentrations of FBS. As shown in Table 2, endothelial cells and adipocytes are not present in expanded cultures of Ad-SMC, and although SMC and MSC-associated markers are expressed from all three basal media formulations, statistical significance is only achieved from cells expanded in DMEM-HG relative to SMCM. The expression of MSC-associated markers, while not definitive for MSC, is consistent with the presence of residual MSC-like bioactivity as observed in Figures 9 and 10. We have therefore selected DMEM-HG/10% FBS as our standard media formulation for isolation and expansion of Ad-SMC from adipose SVF. Additionally, high glucose levels in culture media or expansion at high cell densities has been shown to be detrimental to MSC differentiation potential. 21 It has been suggested that the presence of advanced glycation end products related to glucose and other sugars may lead to loss of differentiation potential in MSC. 50 The conditions under which SMC expansion was favored in this study are therefore consistent with the literature regarding in vitro expansion of MSC. Although it may be argued that the acquisition of SMC-like characteristics by expansion of adipose-SVF in DMEM-HG/10% FBS media, the same media used for expansion of bladder-SMC, simply represents a case of phenotypic convergence between the two cell types, the final outcome is ultimately the same regardless of mechanism of action: isolation and expansion of an SMC-like population sharing key functional characteristics associated with contractility with, but otherwise not phenotypically identical to, bladder-SMC.
Another characteristic of stem and progenitor cell populations is a requirement for exposure to combinations of exogenous growth factors, extracellular matrix components, or other defined factors to direct differentiation along defined developmental lineages. For example, adipose-derived MSC was differentiated into smooth muscle-like cells using inductive media containing 100 U/mL heparin for up to 6 weeks before seeding polymeric bladder dome-like scaffold structures that demonstrated evidence of functionality in a rat cystectomy model. 32 TGF-β or small molecule agonists targeting the TGF-β signaling pathway (e.g., sphingosyl-phosphorylcholine, bradykinin, and angiotensin II) have also been used to induce a smooth muscle-like phenotype from adipose or bone marrow-derived MSC.20,51–53 A less targeted approach, epigenomic reprogramming with the DNA demethylating agent 5-azaC, has been used to direct bone marrow-derived MSC toward a cardiomyocyte-like phenotype. 54 Dedifferentiated adipocytes may also be driven along a smooth muscle lineage using TGF-β and have been reported to contribute toward bladder tissue regeneration in a mouse bladder injury model. 55 Finally, methods for TGF-β-induced differentiation of SMCs from bone marrow-derived cells have been described.56,57 Taken together, these reports typically present a MSC-like population with little or no expression of any SMC-associated markers before treatment with an inductive cytokine or small molecule agonist. In marked contrast, Ad-SMC were expanded from adipose in DMEM-HG media and expressed smooth muscle-associated markers, including those typically associated with mature SMCs (e.g., ACTA2/SMAA, SM22, MYH11/SMMHC, CNN1, and MYOCD 58 ) without directed differentiation. This observation strongly suggests that Ad-SMC represent a cell population that is already more fully differentiated and fundamentally distinct from MSC at initial isolation (P0). The acquisition of smooth muscle-like features by porcine bone marrow-derived MSC after multiple passaging at high density without the addition of exogenous growth factors has been recently presented. 59 However, in contrast to this report, we are able to isolate Ad-SMC with a clear SMC phenotype from the earliest passage across multiple, independent preparations (Figs. 3A, B, and 4) without prolonged growth at confluence.
The primary functional characteristic of SMC is contraction, which is achieved through the coordinate action and regulation of a selective repertoire of SMC-specific genes (e.g., ACTA2/SMAA, MYH11/SMMHC, and MYOCD) via multiple intracellular signaling cascades. 60 The activation of SMC developmental pathways is contingent upon the action of serum response factor and its co-activator myocardin on CArG box containing SMC-specific gene promoters (reviewed by Ref. 61 ). Several recent studies have suggested that the extracellular environment of Ca2+ ion gradients coordinately activates multiple intracellular signaling cascades to modulate SMC contraction and expansion, so-called excitation–contraction coupling. This paradigm has been extended to include the coordinate regulation of multiple SMC-specific gene expression pathways with signaling cascades regulating contractility through disparate independent kinases, so-called excitation–transcription coupling (reviewed by Ref. 60 ). U46619 is a stable analog of thromboxane A2 (TxA2), a potent stimulator of platelet aggregation and SMC contraction. TxA2 functions to modulate excitation–transcription coupling through the Ca2+/calmodulin-dependent MLCK pathway that leads to phosphorylation of myosin light chain as well as leading to activation of the RhoA kinase that operates to stimulate actin contraction and polymerization. Treatment with U46619 has been shown to induce SMC differentiation within adipose-derived MSC by increased expression of serum response factor and myocardin and associated upregulation of the SMC-specific markers α-SMA, calponin, smoothelin, and SMMHC. 29 U46619-induced phosphorylation of myosin light chain was blocked by specific inhibitors of Ca2+/calmodulin MLCK and Rho kinase, suggesting that TxA2 stimulates transcription of smooth muscle-specific genes and contractility through signaling pathways common to both activation of SMC-specific gene expression and contractility. This effect of TxA2 on excitation–transcription coupling appears to serve as a functional fingerprint for MSC, regardless of tissue of origin. We have observed that bone marrow-derived MSC recapitulates the upregulation of smooth muscle markers upon treatment with U46619 as observed for adipose-derived MSC. 29 However, as shown in Figure 11, Ad-SMC already express the key contractility-associated functional markers myocardin and SMMHC, thereby satisfying key criteria for definition as SMC-like cell types. Additionally, Ad-SMC respond to U46619 in a diametrically opposing manner, presenting unambiguous downregulation of the key functional smooth muscle markers myocardin and SMMHC. Clearly, the organization and regulation of signaling cascades involved in excitation–transcriptional coupling as observed in MSC is fundamentally different in Ad-SMC, and likely reflects the more differentiated and less stem-like nature of Ad-SMC relative to MSC. This observation provides definitive evidence that Ad-SMC is functionally distinct from adipose or bone marrow-derived MSC and represents a biologically unique cell population isolatable from adipose SVF. Although it is currently unclear exactly why Ad-SMC and MSC present diametrically disparate responses to treatment with U46619, we are actively exploring alternative pharmacological agents targeting additional pathways critical to SMC differentiation such as ERK/MAPK signaling pathways to further evaluate additional functional similarities and differences between MSC and Ad-SMC.
From where do Ad-SMCs originate and what is their relationship to MSC? Adipose is a heavily vascularized tissue and a number of studies have implicated the perivascular niche as a potential source of both MSC as well as smooth muscle and endothelial cells (reviewed by Refs.62,63). Pericytes with MSC differentiation potential have been isolated directly from blood vessels as well as from multiple organ systems throughout the body.2,3,41,64 However, although ACTA2/SMAA+ cells have been localized to all capillaries, arterioles, and venules of the adipose-derived vascular bed, expression of STRO-1, a key MSC-specific marker, is tightly associated with endothelium and additionally found only within a subset of blood vessels. 30 Further, expression of the stem cell-specific markers Oct4 and telomerase was observed only rarely, suggesting that truly pluripotent progenitors are uncommon within adipose. 30 In their entirety, these observations point to MSC, endothelium, and smooth muscle occupying distinct spaces within the broader perivascular niche. Nevertheless, there remains the potential for considerable ebb-and-flow across developmental lineages. For example, endothelial cells appear capable of lineage switching toward an SMC-like phenotype in response to TGF-β or the depletion of pro-angiogenic factors and loss of endothelial cell–cell contact.65,66 In addition, adherent cell types with endothelial and smooth muscle phenotypes as well as limited mesenchymal differentiation potential have been identified to circulate in adult peripheral blood. 67 Such circulating SMCs may contribute to the population of adipose-derived SMCs, although we have been unable to purify them directly from human adult peripheral blood in meaningful numbers (our unpublished observations). Given that MSC in long-term culture also follow an SMC-like differentiation pathway, 68 we believe that taken together, the published data as well as our observations are consistent with the perivascular niche of adipose SVF as a source for a broad continuum of SMCs, smooth muscle progenitors, MSC, and partially lineage-committed MSC-like cell types with variable and overlapping degrees of proliferative and differentiation potential. In this model (Fig. 12), the cell population referred to as Ad-SMC is composed principally of cells with an SMC-like phenotype and function as demonstrated unambiguously by the data presented in Figures 3A, B, and 4. However, results presented in Figures 9 and 10 confirm the presence of a residual sub-population with limited in vitro tri-lineage differentiation bioactivity relative to validated MSC. Taken together, the data clearly demonstrate Ad-SMC to be more SMC-like than MSC-like; therefore, we have placed Ad-SMC appropriately as indicated in the model of adipose SVF shown in Figure 12. As we have shown in this report, modulation of SVF-derived cell phenotypes and functionality away from MSC and toward SMC is possible through selection of media formulations during cell isolation and expansion. Finally, these studies provide methodological validation for the utility of nonbladder sources of SMCs for applications in urologic regenerative medicine, thereby bypassing the potential for isolation and expansion of transformed SMC associated with bladder biopsies derived from patients presenting with bladder-related malignancies. 69
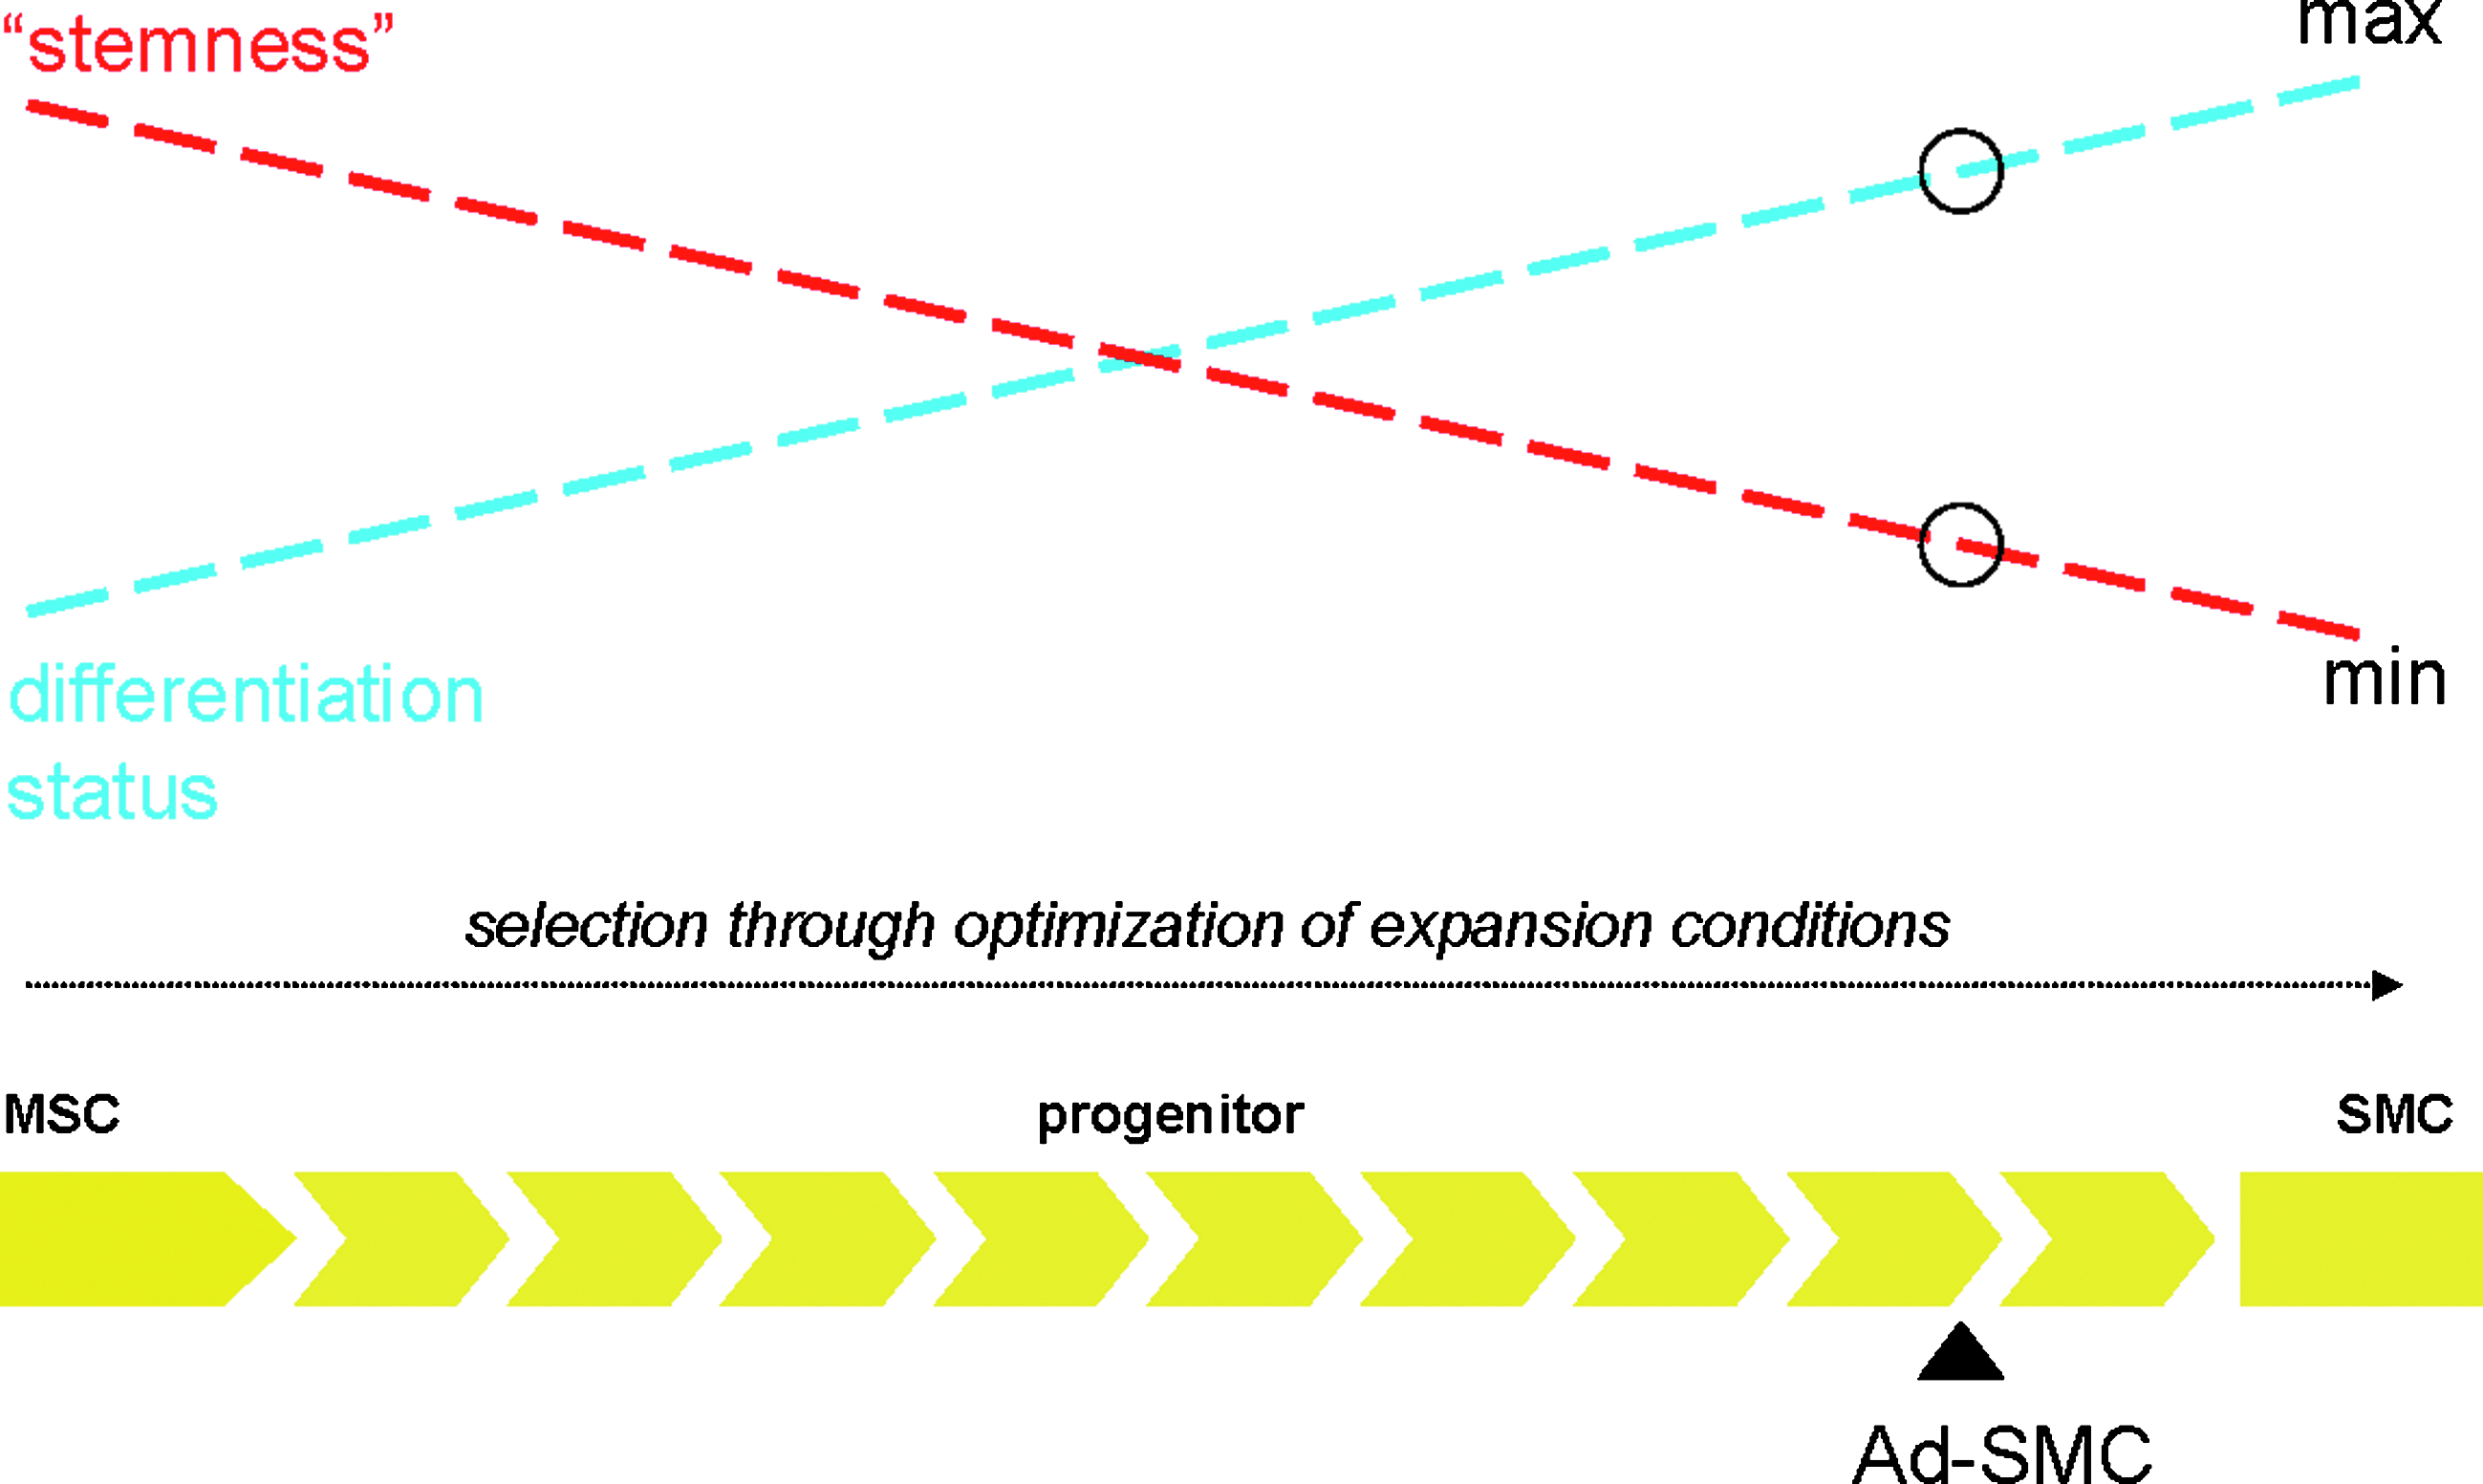
Cells with SMC-like and MSC-like properties are present in adipose in a dynamic continuum with overlapping phenotypic and functional characteristics. Fully undifferentiated true MSC, fully committed SMC, partially committed MSC, SMC progenitors, and other cell populations with intermediate, overlapping phenotypes exist in the SVF of adipose. Selective expansion for SMC-like cell species at the expense of MSC-like cell types is possible through modulation of media formulations applied for cell isolation and expansion.
Footnotes
Disclosure Statement
Authors declare an equity interest in Tengion, Inc.