
Abstract
A major obstacle in chondrocyte-based therapy for cartilage repair is the limited availability of cells that maintain their original phenotype. Propagation of chondrocytes as monolayer cultures on polystyrene surfaces is used extensively for amplifying cell numbers. However, chondrocytes undergo a phenotypic shift when propagated in this manner and display characteristics of more adherent fibroblastic cells. Little information is available about the effect of this phenotypic shift on cellular adhesion properties. We evaluated changes in adhesion property as bovine chondrocytes were serially propagated up to five passages in monolayer culture using a centrifugation cell adhesion assay, which was based on counting of cells before and after being exposed to centrifugal dislodgement forces of 120 and 350 g. Chondrocytes proliferated well in a monolayer culture with doubling times of 2–3 days, but they appeared more fibroblastic and exhibited elongated cell morphology with continued passage. The centrifugation cell adhesion assay showed that chondrocytes became more adhesive with passage as the percentage of adherent cells after centrifugation increased and was not statistically different from the adhesion of the fibroblast cell line, L929, starting at passage 3. This increased adhesiveness correlated with a shift to a fibroblastic morphology and increased collagen I mRNA expression starting at passage 2. Our findings indicate that the centrifugation cell adhesion assay may serve as a reproducible tool to track alterations in chondrocyte phenotype during their extended propagation in culture.
Introduction
Isolated chondrocytes are a common cell source for repair of cartilage defects. Mature autologous chondrocytes retrieved from nonload bearing knee cartilage have been used to repair well-defined cartilage defects in younger patients.8–10 This strategy has been commercialized for repair but remains limited to defined cartilage defects. The advantage of using isolated chondrocytes is that they can be propagated under different culture conditions to facilitate proliferation and/or ECM production. For example, chondrocytes can be grown in low- or high-density monolayer culture 11 or, alternatively, in a constrained environment such as pellet culture, alginate culture or seeded in three-dimensional matrices.12–17 Growth in alginate beads helps maintain the chondrocyte phenotype, but limits cell multiplication.18,19 The more commonly used monolayer culture method facilitates transport of nutrients and cell proliferation. However, this method to propagate the cells causes the chondrocytes to undergo phenotypic changes and assume “fibroblastic” morphologic and biochemical characteristics.19–22 They shift from making type II to type I collagen and decrease their synthesis of high-molecular-weight proteoglycans. 23
Although changes in phenotype have been well characterized when chondrocytes were propagated in monolayer cultures, little information is available about alterations in adhesion characteristics with passage of the cells. The ability of cells to adhere to surfaces in both two and three dimensions is critical for their survival. In this study, we examined the alterations in cell adhesion characteristics of chondrocytes cultured as monolayers as a function of cell passage using a centrifugation cell adhesion assay, based on the method described by Reyes and Garcia. 24 Furthermore, quantitative reverse transcriptase–polymerase chain reaction (qRT-PCR) and immunostaining were also used to compare the relative expression of type I and type II mRNA expression and biomarkers, respectively. Our hypothesis is that the physical cell adhesion assays will detect changes in adhesion properties that correlate with changes in morphology as the chondrocytes de-differentiate in passage as monolayer cultures.
Materials and Methods
Preparation of articular chondrocytes
Articular chondrocytes were isolated from the knee joints of immature steer (2–4 weeks old; Farm-to-Pharm, L.L.C., Warren, NJ) by digestion of the tissue with 11,000 U collagenase (type II from clostridium histolyticum, Sigma Chemical, St. Louis, MO) suspended in 100 mL Dulbecco's modified Eagle's incomplete medium: nutrient mix F-12 (DMEM/F-12; Invitrogen, Carlsbad, CA) containing 50 μg/mL L-ascorbic acid, 50 μg/mL gentamicin (Invitrogen), and antibiotic-antimycotic solution (100 U/mL penicillin, 100 μg/mL streptomycin, 0.25 μg/mL amphotericin B; Invitrogen), but without fetal bovine serum (FBS). The tissue was incubated for 22–24 h on a rocking platform at 37°C in a 5% CO2–95% air incubator to obtain primary chondrocytes. The isolated cells were filtered (40 μm Nylon cell strainer; BD Falcon, Bradford, MA), subsequently assessed for viability, and counted using the Trypan-blue dye exclusion method and a hemocytometer. The chondrocytes were plated at 5×10⁶ cells per T-75 tissue culture flask and incubated for 5–7 days at 37°C at 95% air/5% CO2/90% relative humidity (R.H) in DMEM/F-12 complete media supplemented with 10% FBS (HyClone, Logan, UT) and the other supplements. The retrieved chondrocytes were serially passaged, approximately every 3–5 days, when about 90% confluent, for five passages (starting at passage 0). Chondrocytes were harvested from eight separate knee joints. The resultant chondrocytes from each joint were kept separate and assayed as described next.
Cells were counted in Trypan blue dye, and used to initiate the next passage of cells in T75 flasks, for cell adhesion assays and for immunostaining. Cells (1×10⁶) were harvested at 121 g, room temperature, washed twice in Dulbecco's phosphate-buffered saline (D-PBS), and frozen as a pellet at −80°C for qRT-PCR.
Mouse fibroblasts (L929)
L929 fibroblasts were used as a control cell line with high expected adhesion in the centrifugal test system. The cells were cultured at 37°C at 95% air/5% CO2/90% R.H. in RPMI-1640 complete medium (Invitrogen) supplemented with 10% FBS and without antibiotics or antimycotics. The sub confluent cells were passaged twice to thrice weekly.
Cell adhesion assays
Centrifugation cell adhesion assay
Four wells of a 96-well plate (Costar, St. Louis, MO) were coated with 100 μg/mL fibronectin (Sigma Chemical) and incubated for 1 h at room temperature (Fig. 1). After removing the excess fibronectin solution from the wells, 5×10³ bovine chondrocytes in complete DMEM/F-12 medium with 10% FBS, or L929 (control) cells in RPMI-1640 medium with 10% FBS were premixed with Hoechst 33342 fluorescence stain (10% of volume). The labeled cells were added to the wells and incubated, after being covered in aluminum foil to prevent photobleaching, for 1 h at 37°C at 95% air/5% CO2/90% R.H. Chondrocytes from serial passages for each of the eight joints were examined to determine adhesive properties using the centrifugation cell adhesion assay. At each serial passage, the centrifugation cell adhesion assay was used to obtain three replicate sample measurements. An additional fourth well was used to adjust the microscope parameters, such as exposure. Measurements from this fourth well were discarded.
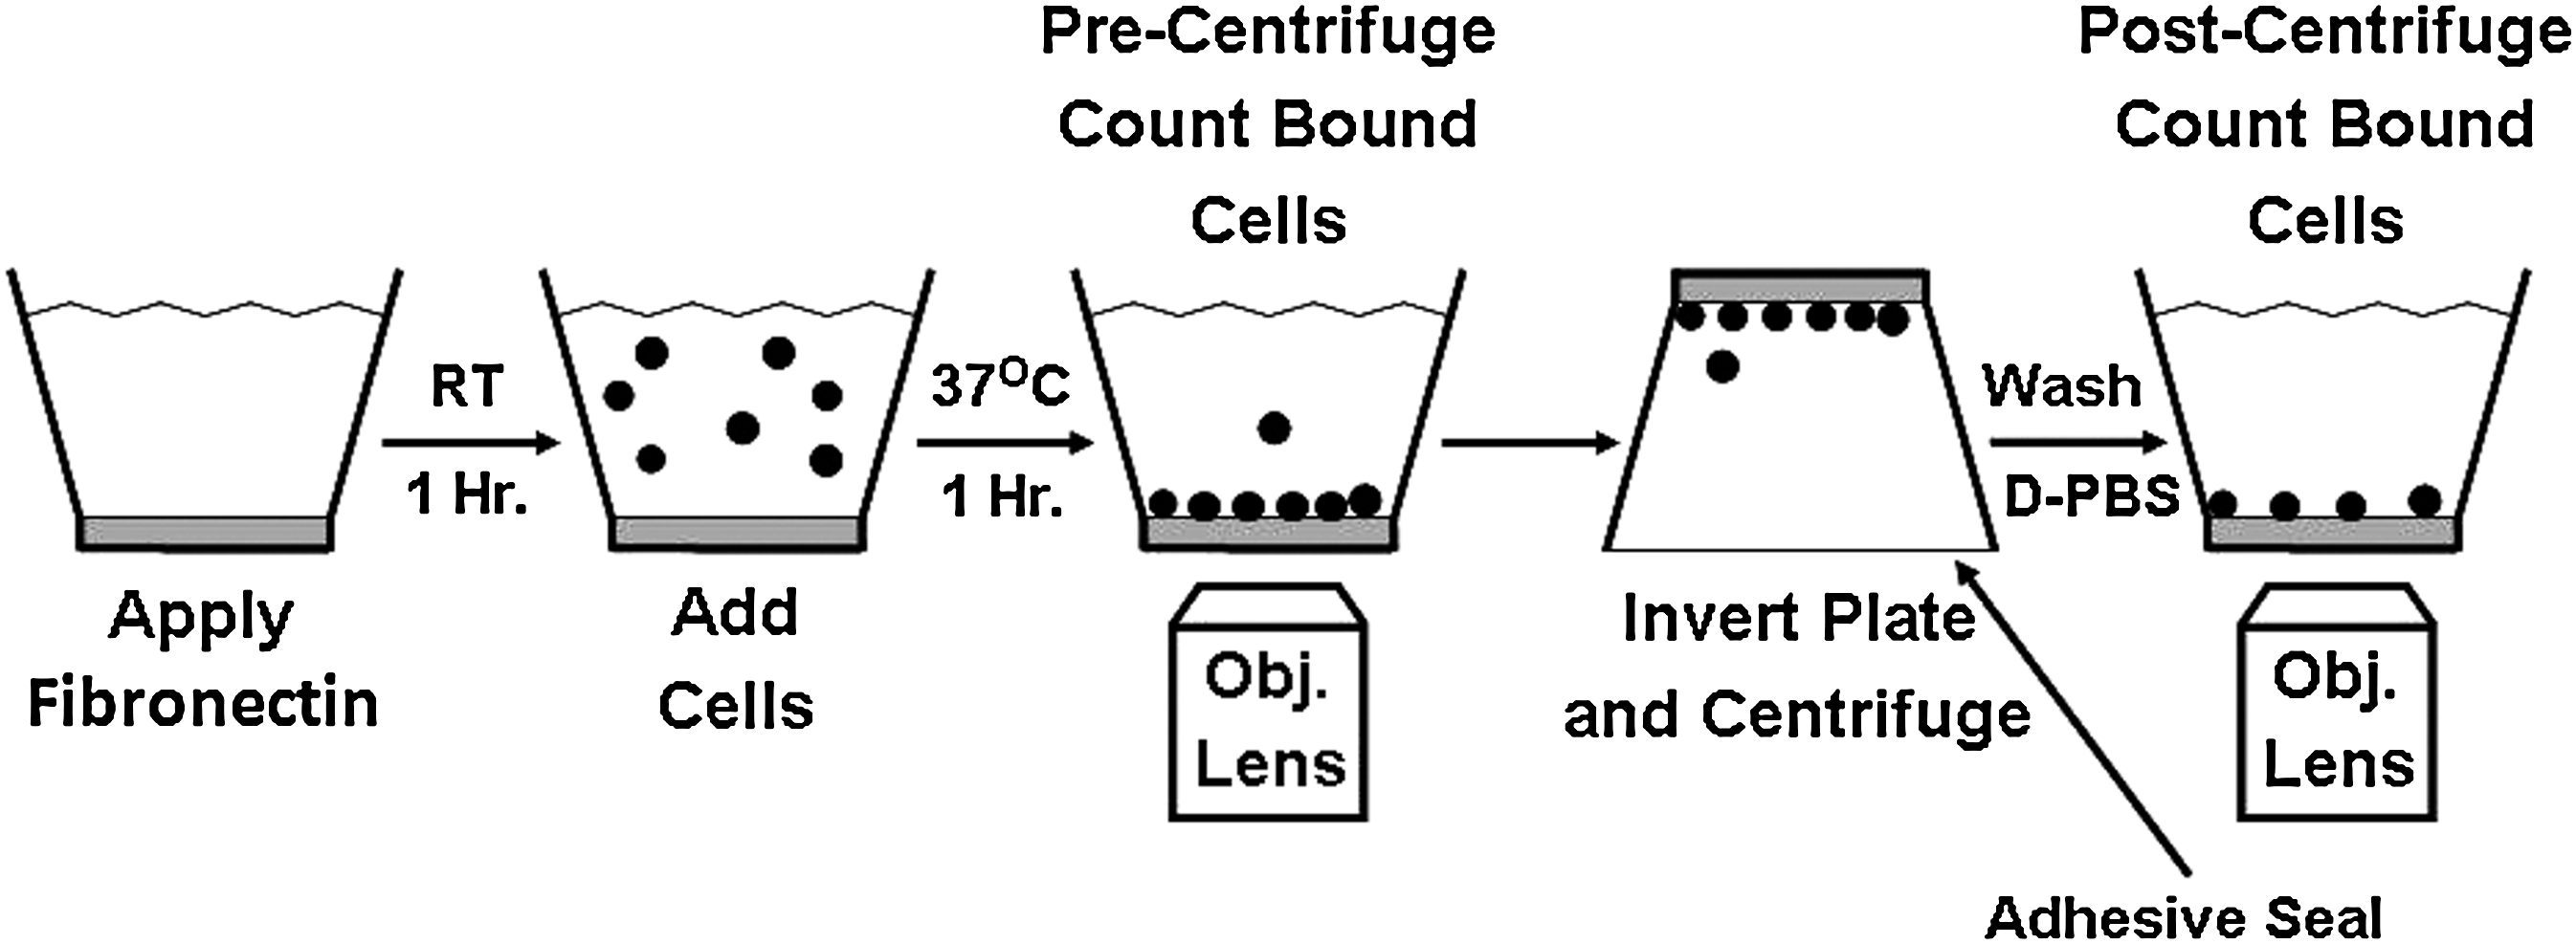
Schematic of centrifugation cell adhesion assay. RT, room temperature; D-PBS, Dulbecco's phosphate-buffered saline (w/o calcium and magnesium); Obj. Lens, microscope objective lens. (Modified from McClay and Hetzler 40 ).
A schematic of the centrifugation cell adhesion assay, which was modified from the method of Reyes and Garcia
24
to include testing at 120 and 350 g relative centrifugal forces (RCF), is shown in Figure 1. Using an inverted microscope (Zeiss AxioVert, equipped with a AxioCam MRm digital camera; Zeiss, Inc., Thornwood, NY) and AxioVision Software (Version 4.8.2; Zeiss, Inc.), 5×5 digital tiled images (total tiled image area=3.177 mm2) were captured for each of the three wells before centrifugation (prespin). The combined number of cells counted per sample was ∼2400–3600 (800–1200 cells/well ×3 wells). The wells were filled with D-PBS, purged of air bubbles, and covered with acetate sealing tape (Fisher Scientific, Atlanta, GA). The plates were centrifuged (upside down) at either a RCF of 120 g or 350 g for 5 min at 22°C. The cell detachment forces (FD) were ∼150 pN (for 120 g RCF) and 440 pN (for 350 g RCF) and were calculated by the following formula:
24
where
V=cell volume=1800 μm3 (measured using a cell counter), d=(cell density−media density)=1.07−1.00=0.07 g/cm3, and RCF=120 or 350 g.
The supernatant was removed from the wells, and the wells were washed 1× with D-PBS. Excess D-PBS was removed from the well using a low flow peristaltic pump (Mini-pump; Control Company, Friendswood, TX) set at a flow speed of 8.2 mL/min. Finally, 100 μL D-PBS was added to each well. A total of 25 tiled digital images (5×5 matrix) were captured for each of the three wells after centrifugation (postspin). The cell number pre- and postspin were determined by stitching together the tiled images and subsequently using an automated cell counting (AxioVision) routine to count the number of fluorescently labeled nuclei. The percent adhesion was determined by dividing the postspin cell count by the prespin count, and multiplying by 100.
RNA isolation
RNA was isolated using the RNeasy Plus Mini Kit (Qiagen, Valencia, CA). Total RNA was eluted into RNase free water and then detected using a NanoDrop ND-1000 Spectrophotometer (NanoDrop Technologies, Wilmington, DE).
Quantitative RT-PCR
The isolated RNA for all joints at all passages was reverse transcribed using a cDNA Archive Kit (Applied Biosystems, Foster City, CA), which can convert up to 10 μg of RNA to cDNA. The cDNA was combined with a Universal Master Mix (Applied Biosystems), oligonucleotide primers, and Taqman probes (Applied Biosystems) for the genes of interest as well as a control gene. The genes of interest were type I collagen, type II collagen, and aggrecan, and the endogenous control gene was glyceraldehyde 3-phosphate dehydrogenase (GAPDH). The sequences for the forward primers for type I collagen, type II collagen, aggrecan, and GAPDH are 5′ AGAACCCAGCTCGCACATG 3′, 5′ CGGGCTGAGGGCAACA 3′, 5′ GGGAGGAGACGACTGCAATC 3′, and 5′ TGCCGCCTGGAGAAACC 3′. The reverse primer sequences for type I collagen, type II collagen, aggrecan, and GAPDH are 5′ CAGTAGTAACCACTGCTCCATTCTG 3′, 5′ CGTGCAGCCATCCTTCAGA 3′, 5′ CCCATTCCGTCTTGTTTTCTG 3′, and 5′CGCCTGCTTCACCACCTT 3′. The probe sequences for type I collagen, type II collagen, aggrecan, and GAPDH are 5′ AGACTTGAGACTCAGCC 3′, 5′ CAGGTTCACATATACCG 3′, 5′ CAGGCTTCACCGTTGAG 3′, and 5′ CCAAGTATGATGAGATCAA 3′. The reaction volume was 20 μL, and the reaction was performed in technical triplicates on a 7900HT Fast Real-time PCR System Prism 7000 sequence detector (Applied Biosystems). The thermal profile followed was 2 min at 50°C, 10 min at 95°C, 40 cycles of 15 s at 95°C, and 1 min at 60°C. Gene expressions were analyzed using the comparative Ct method, with GAPDH used as the endogenous control gene. The passage 0 cells were used as the calibrators in all analyses. Fold changes in gene expression were calculated and are reported as the mean RQ values with associated standard deviations (SDs; n=3), in accordance with the methods previously described. 25
Immunohistochemistry
Cell samples (2×10⁴ cells) were allowed to adhere to a chamber slide for 24 h in DMEM/F-12 complete media supplemented with 10% FBS, and the other supplements, and then fixed in 10% buffered formalin for 10 min. The slides were kept at 4°C in D-PBS after fixing. The samples were rinsed in tap water and deionized water and then incubated with PEROXIDAZED1 (Biocare, Concord, CA), an endogenous peroxidase blocker, and BackgroundSNIPER1 (Biocare), a blocking reagent. The samples were then stained with antibodies to detect either type I collagen or type II collagen. Primary antibodies used were anti-type I collagen (rabbit polyclonal antibody, ab34710; Abcam, Cambridge, MA) and anti-type II collagen (rabbit polyclonal antibody, ab300; Abcam). The type I collagen antibody was diluted×100, and the type II collagen antibody was diluted×200. A HISTOSTAIN®-SP kit (Zymed, San Francisco, CA) was used to visualize type I and type II collagen presence by using the horseradish peroxidase-streptavidin-biotin system. The complex formation was then detected by a 3,3′-diaminobenzidine tetrahydrochloride chromagen. All of the samples were counterstained with hematoxylin, dehydrated in 95% and 100% ethanol twice for 1 min, and covered with a glass coverslip using Histomount (Zymed).
Statistical analysis
Centrifugation assay
The mean percent adhesion for each of the three wells at each RCF and passage number was calculated. The data were subsequently analyzed using a two factor analysis of variance (ANOVA) at a confidence level of 0.95 for the effects of passage number and RCF, with a Tukey Test post hoc all pairwise comparison (SigmaStat, Systat Software, Inc., Richmond, CA).
Quantitative RT-PCR
Data were analyzed using a one-way ANOVA and Tukey's multiple-comparison test to determine statistical differences. A confidence interval of 95% (α=0.05) was used for all analyses, and means and SDs are shown in each figure.
Results and Discussion
Chondrocyte proliferation and de-differentiation in monolayer culture
Attached chondrocytes proliferated with an estimated doubling time of 2–3 days on polystyrene two-dimensional surfaces in T-75 tissue culture flasks as shown in Fig. 2A–C, for passages (Ps) 1, 3 and 5, respectively. On visual inspection of the chondrocytes, the cells at passage 1 were a mixture of rounded and spread cells. By passage 3, the majority of the cells were spread and appeared more fibroblastic.

Comparison of cell morphology at passages
Chondrocyte adhesion characteristics in monolayer culture
The centrifugation cell adhesion assay compared the adhesion of chondrocytes serially passaged for passage (Ps) 0 to passage 5 to the adhesion of a control L929 fibroblast cell line to determine whether, over passage, the chondrocytes were taking on the adhesive characteristics of the fibroblasts. L929 fibroblasts routinely showed 87%–100% adhesion in the centrifugation assay at both 120 and 350 g (Fig. 3). Chondrocytes at passages 3–5 appeared to be taking on the adhesion characteristics of the L929 fibroblast control cells, as the percent adhesion of the passage 3–5 chondrocytes was increased compared with Ps 0–2 and was statistically the same as that of the L929 cells. Only the adhesion of chondrocytes for passages 0–2 was significantly different (p<0.05) from the adhesion of the L929 cells.
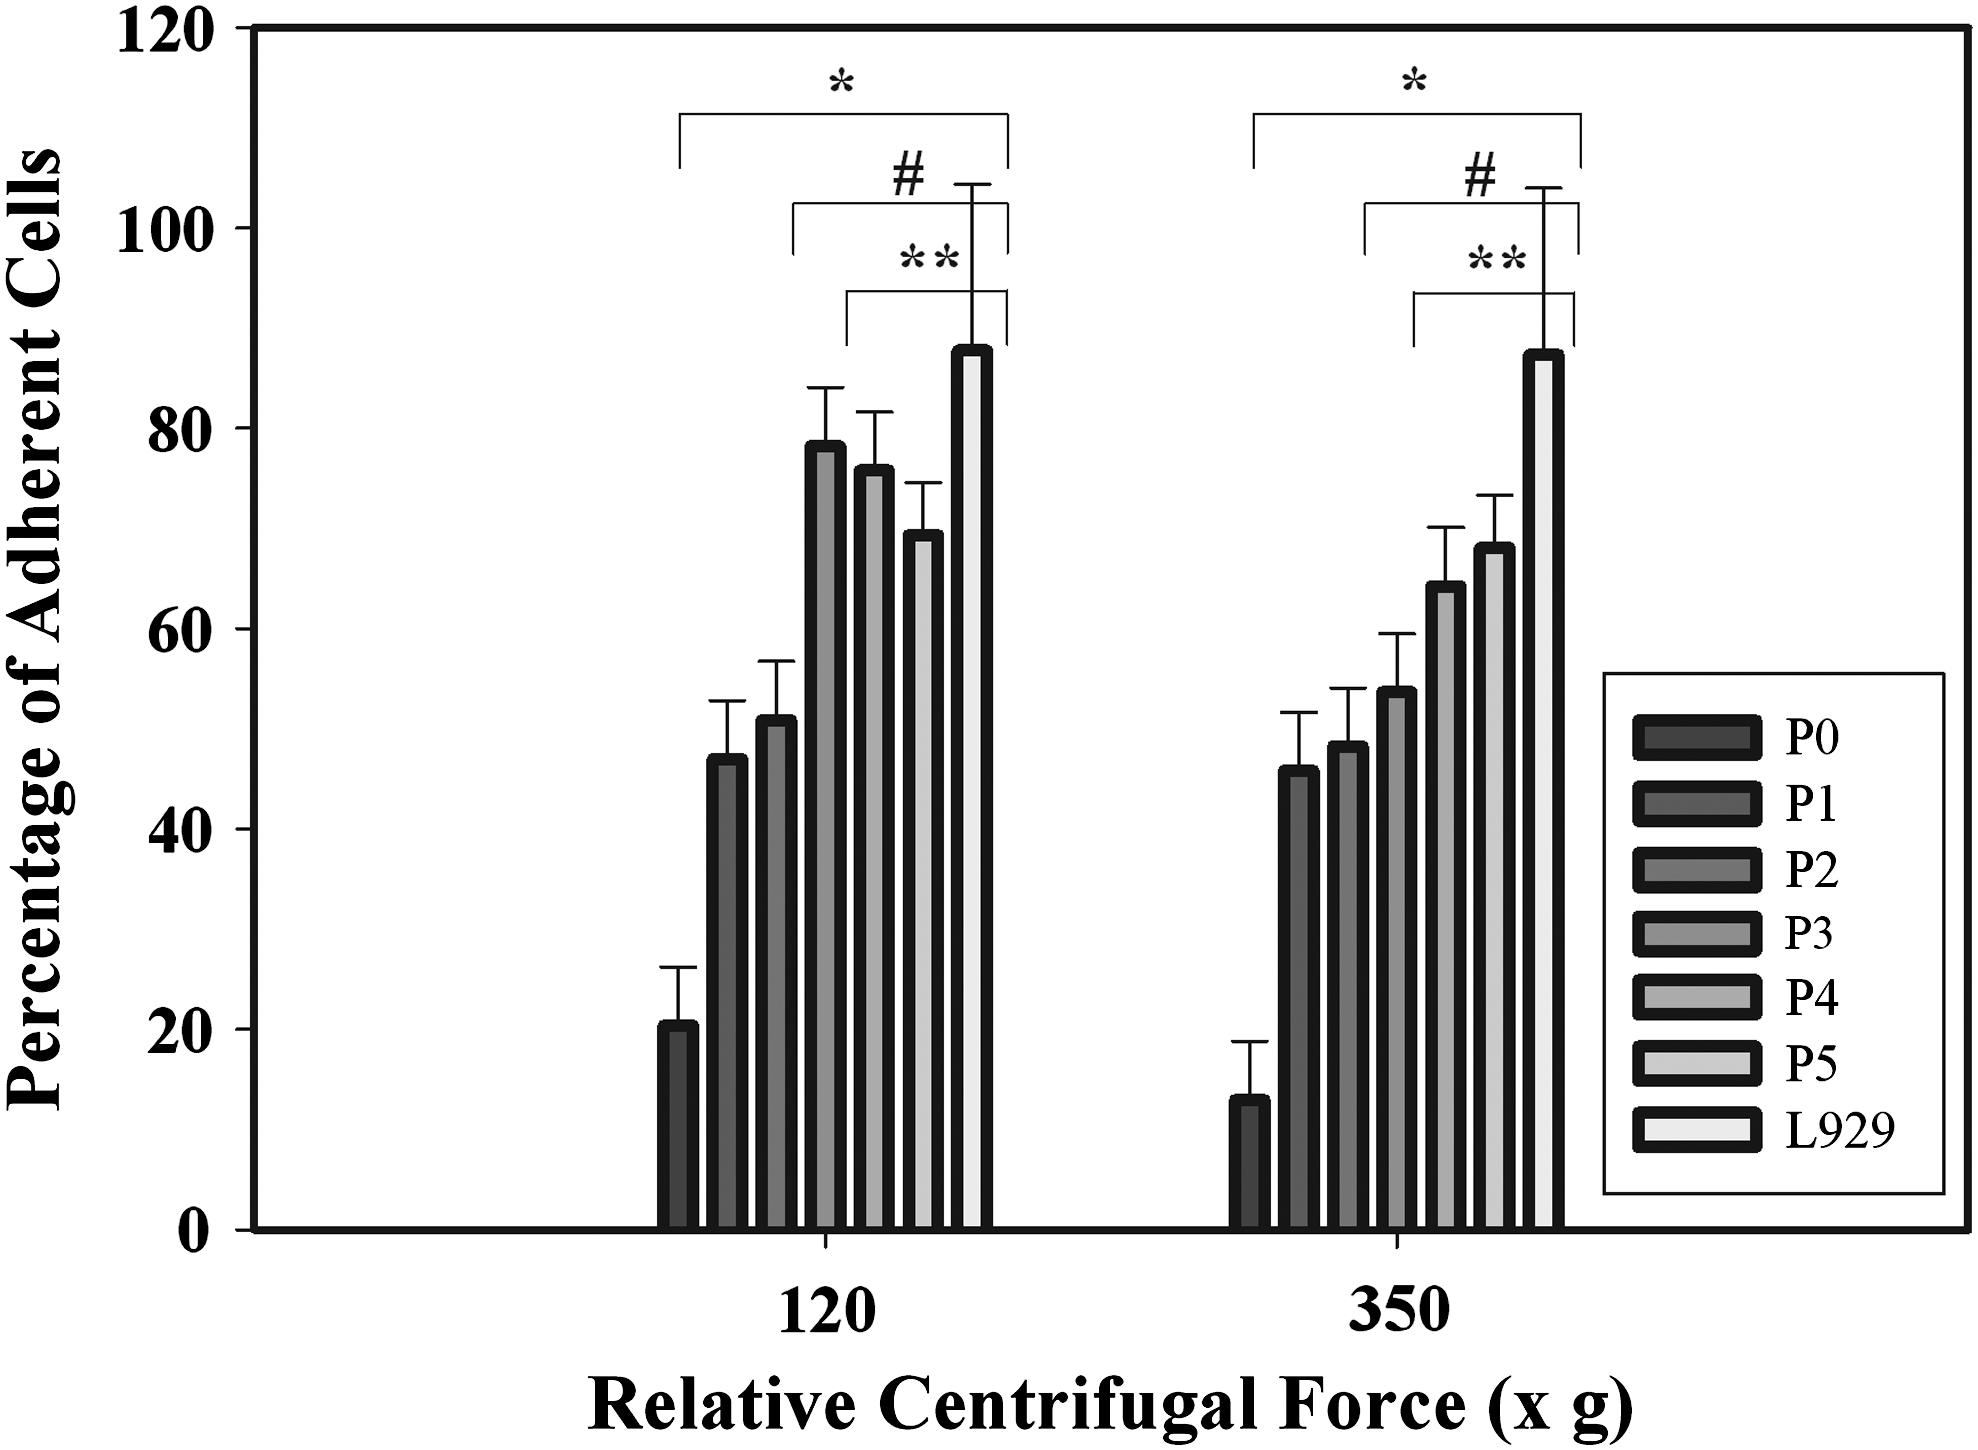
Centrifugation cell adhesion assay results. The assay was performed using two relative centrifugal forces (120 and 350 g). Chondrocytes were harvested from eight separate knee joints. The resultant chondrocytes from each joint were examined separately. At each serial passage, the centrifugation cell adhesion assay was used to obtain three replicate sample measurements. Two-way one-way analysis of variance (ANOVA) with Tukey's test for pairwise comparison indicated at “*” p<0.001 that cell adhesion at Ps0≠Ps 1–5, L929; at p<0.05, “#” Ps1≠Ps0, Ps 3–5, L929, “**” Ps2≠Ps 0, 4–5, L929; and Ps3≠Ps0-1. Passage 3 showed a trend to be different than passage 2 (p=0.090).
The centrifugation assay demonstrated that chondrocyte adhesion at passages 0 to 2 was significantly less than at the later passages 4 and 5 (Fig. 3). Two-way ANOVA with Tukey's test for pairwise comparison indicated at p<0.001 that cell adhesion at Ps0≠Ps 1–5, L929; at p<0.05, Ps1≠Ps0, Ps 3–5, L929, Ps2≠Ps 0, 4–5, L929; and Ps3≠Ps0-1. Passage 3 showed a trend to be different than passage 2 (p=0.090). There was statistically no difference in the adhesion of the chondrocytes at 120 g vs. 350 g (p=0.117). The centrifugation assay was very sensitive, in that it detected differences in adhesion as early as passage 2. The centrifugation adhesion assay showed a coefficient of variation (CoV) that ranged from 2% to 45%. Passage 0 is expected to have a higher CoV since the cell population is the most heterogeneous.
We compared the relative mRNA expression of type I and type II collagen using qRT-PCR. As shown in Figure 4, type II collagen expression decreases rapidly after passage 0, while type I collagen mRNA expression started increasing after passage 2. Immunostaining for markers for collagen I and collagen II (Fig. 5) showed significant staining for collagen II in passage 0, while passage 5 showed significant staining for collagen I.
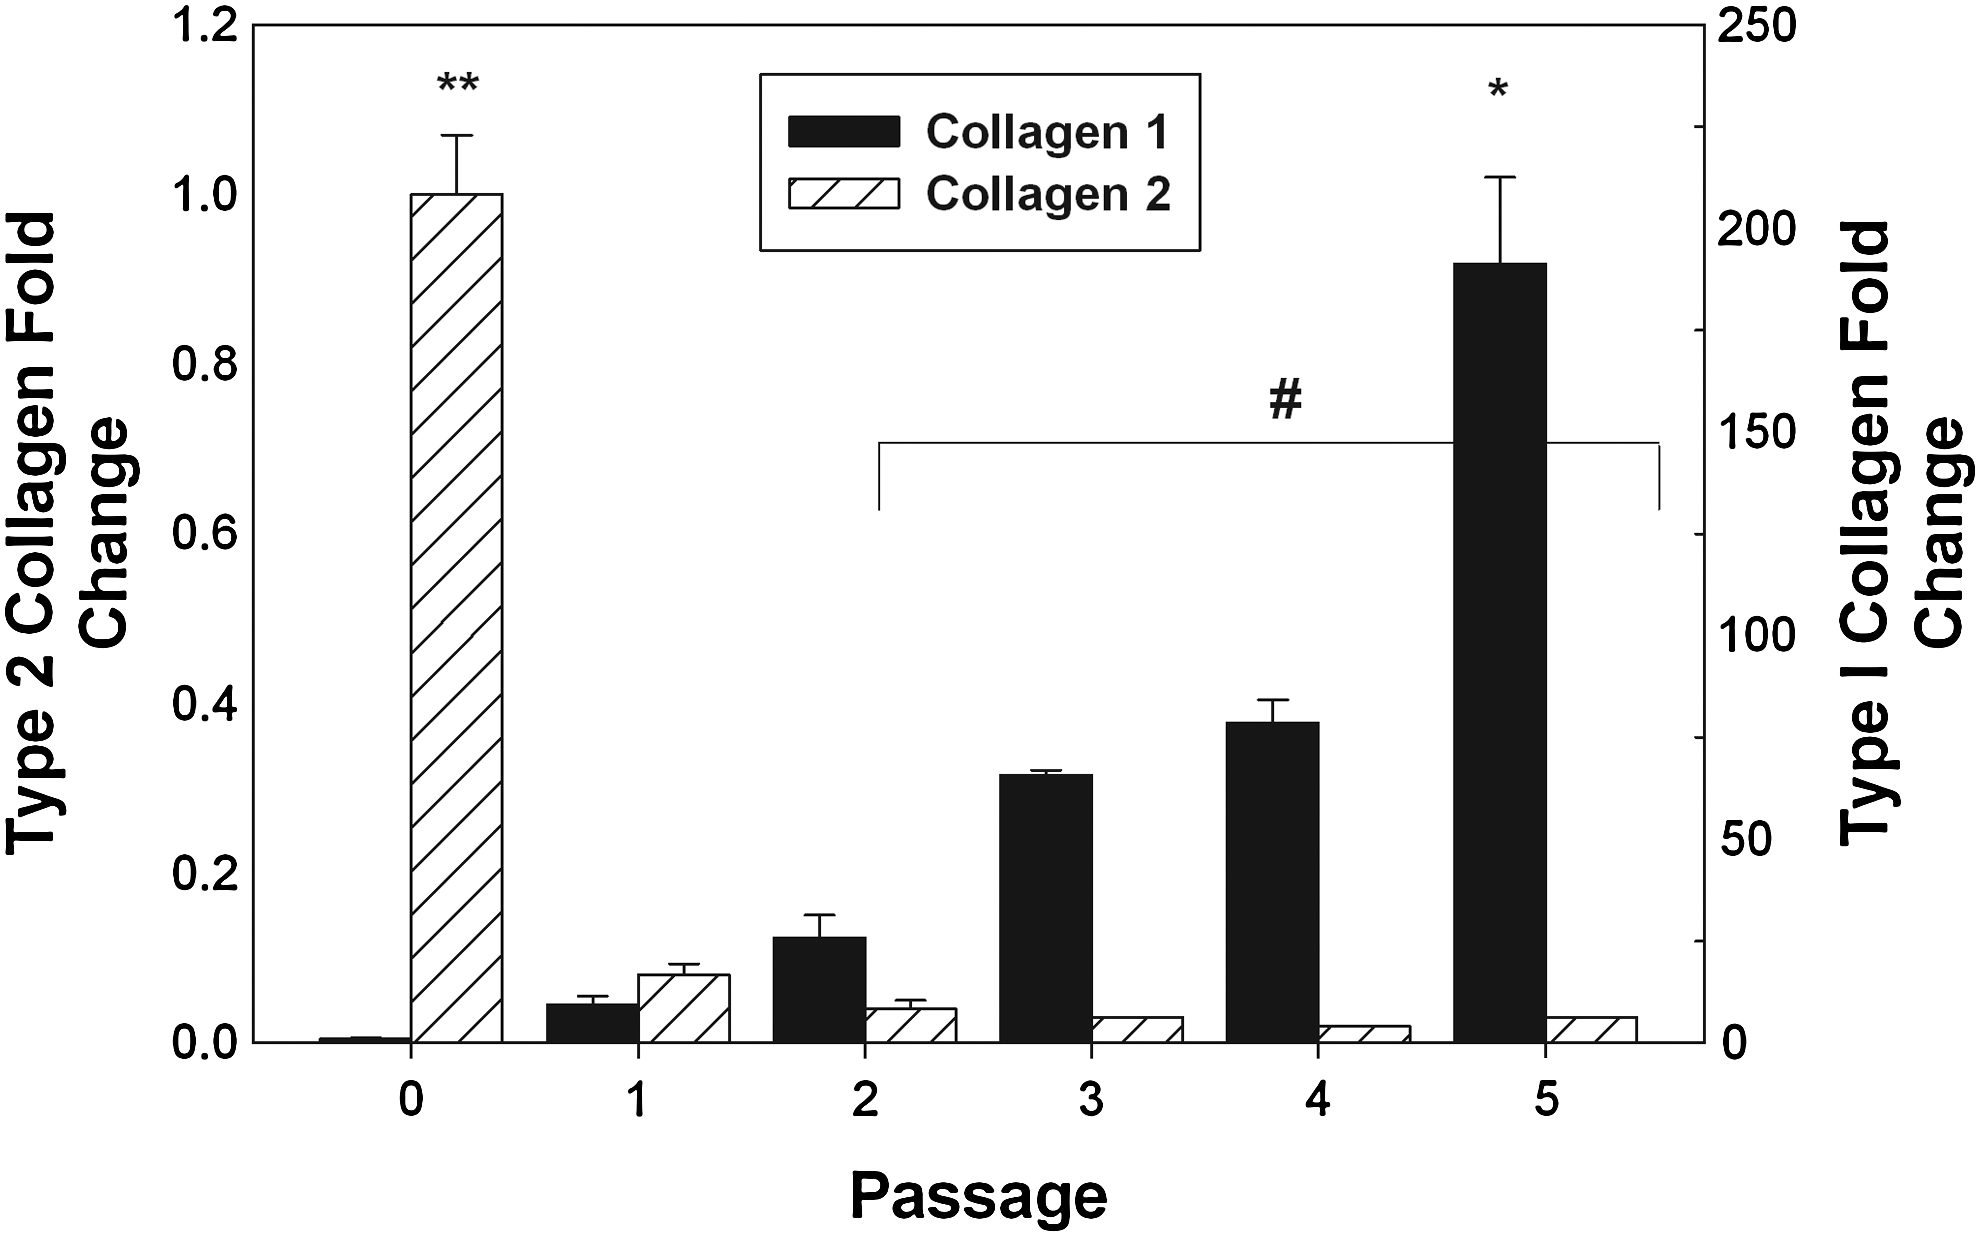
Results of quantitative reverse transcriptase-polymerase chain reaction (qRT-PCR) assay for type I and type II collagen mRNA expression for each cell passage. qRT-PCR was performed on chondrocyte samples taken form each joint at P0–P5 and evaluated for type I and type II collagen mRNA expression, using GAPDH as an endogenous control. Data were analyzed using a one-way ANOVA and Tukey's multiple-comparison test to determine statistical differences. A confidence interval of 95% (α=0.05) was used for all analyses, and means and standard deviations are shown in each figure. * indicates the largest type I collagen expression group; ** indicates the largest type II collagen expression group; and # indicates no statistical difference between the type II collagen expression for passages 2–5.

Immunostaining for markers for collagen I and collagen II at passages 0 and 5. The paired images at passage 0
Centrifugation adhesion assays have been used in the past to monitor cell-substrate interactions,24,26 as well as to assess the distribution and function of cell adhesion molecules. In the current study, the cell adhesion assay was shown to provide a consistent and predictive method to evaluate the performance of cells that will be used to repair defects caused by trauma or sickness. As chondrocytes become more adhesive when cultured in vitro, this cell adhesion assay could be very useful as a screening tool for tissue-engineered products, especially to compare the adhesive properties of chondrocytes grown under different oxygen tension, mechanical stress, or culture conditions (such as 3D vs. monolayer). Although at later passages the change in cell phenotype was visible morphologically and biochemically, the cell adhesion assay provides another tool to measure changes in cell phenotype that is mechanical in nature and independent of other available methods.
It is not clear why chondrocytes become more adherent with passage number in monolayer culture. It has been proposed that as chondrocytes become more fibroblastic, alterations in the production of ECM molecules may occur. Previous investigations have focused on several ECM molecules and their adhesion receptors (integrins, cadherin, Igs) involved in chondrocyte adhesion.22,27–35 Those studies reported on the role of cell adhesion molecules in maintaining the chondrocyte phenotype exemplified by interactions among integrins and type II and type VI collagen.27–29 They also examined the regulation of expression for different integrins during the process of chondrocyte proliferation and de-differentiation. Other investigators evaluated the strength of cell adhesions in cultured chondrocytes.22,30–34 Kino-Oka et al. 35 studied the influence of solid phase materials on the events that regulate cellular phenotypes and modulate cell shape. These previous studies described different methods to evaluate adhesion properties and proposed the role of adhesion molecules in regulating cell shape, phenotype, and proliferation.
The key finding of the present study is that the modified centrifugation adhesion assay identified changes in adhesion properties with the passage number of the cells. Chondrocytes appeared to be more adherent with passage number (Fig. 3). These changes in adhesion properties correlated with phenotypic alterations indicated by changes in cell morphology (Fig. 2), qRT-PCR gene expression (Fig. 4), and immunostaining (Fig. 5). This assay is simple to perform, uses known RCFs to dislodge weakly adherent cells, and allows the user to run multiple replicates simultaneously. The centrifugation assay applies a force to pull the cells in a perpendicular direction away from the surface. Blaise et al. 36 and Hoshiba et al. 37 characterized changes in biochemical markers and morphology of chondrocytes for passages 0 to 3 and 0 and 2, respectively. Kang et al. 38 expanded chondrocytes in vitro to either passage 1 or passage 5, seeded the cells onto biodegradable polymer scaffolds, and maintained the cells in vitro or implanted them into subcutaneous spaces of athymic mice for 1 month. They measured growth rate, viability and apoptotic activity, as well as biochemical markers, and performed histological and immunohistochemical analyses of the chondrocytes and cartilage tissue. Recently, Cheng et al. compared expression of cartilage-associated genes in articular cartilage to their expression in dedifferentiated articular chondrocytes (passage 6) using real-time PCR. 39 The present study is the first that measures changes in actual cell adhesion over sequential passages 0 through 5.
We have previously attempted to use a glass-slide-based parallel plate flow chamber (data not shown) to study chondrocyte detachment as a function of increasing shear forces. In our experience, the hydrodynamic shear stress assay failed to reproducibly identify changes in adhesion properties with cell passage and showed a much higher variability than the centrifugation assay. This variability appeared to be dependent on the user, the age of the chondrocytes, and the flow cell setup. The variability may have also been caused by differences in cell attachment to the slide, flow cell assembly to the slide, and connection of the flow chamber slide in the flow loop. In comparison, the centrifugation cell adhesion assay is easier to perform, provides more data per sample, and is more reproducible.
In conclusion, the present study demonstrates that chondrocytes become more adherent and fibroblastic with passage number using the centrifugation assay. Additional studies are necessary to determine correlations among the expression of specific chondrocyte phenotype markers such as collagen type II and aggrecan, morphology, proliferation, and cell adhesion molecules. The analysis of phenotype markers, including cell adhesion and morphological endpoints, may serve as useful indicators to identify culture conditions that may help preserve chondrocyte phenotype and function for use in therapeutic applications.
Footnotes
Acknowledgments
This work was supported by the FDA, Office of Science and Health Coordination. The authors wish to thank Dr. Andres Garcia for technical discussions and protocols for running centrifugation cell adhesion assays. They would also like to thank Dongha Le, Priyanka Durai, Natasha Lodha, and Brian Nalls for their help in running the cell adhesion assays. They also thank Megan Shoff for her assistance in isolating the bovine chondrocytes. Additionally, they thank Dr. Maureen Dreher for technical help with the acquisition and handling of the bovine chondrocytes and Shiling Ruan and Dr. Dreher for their assistance with the statistical analysis of the data.
Disclaimer
The items identified by brand name are the choice of the authors and are not to be construed as conveying an official endorsement by the U.S. Food and Drug Administration.
Disclosure Statement
No competing financial interests exists for any of the authors.