




Abstract
Noninvasive monitoring of tissue-engineered (TE) constructs during their in vitro maturation or postimplantation in vivo is highly relevant for graft evaluation. However, traditional methods for studying cell and matrix components in engineered tissues such as histology, immunohistochemistry, or biochemistry require invasive tissue processing, resulting in the need to sacrifice of TE constructs. Raman spectroscopy offers the unique possibility to analyze living cells label-free in situ and in vivo solely based on their phenotype-specific biochemical fingerprint. In this study, we aimed to determine the applicability of Raman spectroscopy for the noninvasive identification and spectral separation of primary human skin fibroblasts, keratinocytes, and melanocytes, as well as immortalized keratinocytes (HaCaT cells). Multivariate analysis of cell-type-specific Raman spectra enabled the discrimination between living primary and immortalized keratinocytes. We further noninvasively distinguished between fibroblasts, keratinocytes, and melanocytes. Our findings are especially relevant for the engineering of in vitro skin models and for the production of artificial skin, where both the biopsy and the transplant consist of several cell types. To realize a reproducible quality of TE skin, the determination of the purity of the cell populations as well as the detection of potential molecular changes are important. We conclude therefore that Raman spectroscopy is a suitable tool for the noninvasive in situ quality control of cells used in skin tissue engineering applications.
Introduction
Currently, invasive analysis methods are used for the characterization and functionality evaluation of these tissue-engineered constructs. The termination of the in vivo experiment and the destructive analysis of the explanted construct ex vivo are therefore inevitable. Likewise, the evaluation of in vitro test models is routinely performed post-testing by traditional techniques and technologies for studying cell and matrix components such as histology, immunohistochemistry, or molecular biochemistry. All these methods similarly require invasive tissue processing, including fixation, sectioning, and staining, resulting in the need to sacrifice the tissue-engineered (TE) constructs. This creates the necessity to additionally fabricate a second transplant or in vitro model respectively that would solely serve for construct characterization.
Recently established, however, rather expensive alternatives for the noninvasive monitoring of cells and extracellular matrix components in TE products are multiphoton-induced autofluorescence and second harmonic generation imaging.8,9 Raman spectroscopy might represent a biologically safe and economic option to monitor cells noninvasively in situ. Raman spectroscopy is a laser-based optical technique that detects the vibrational energy levels of molecules, hereby creating a biochemical fingerprint of the screened sample. In detail, every molecule has a unique set of vibrational modes, resulting in a distinct pattern of possible energy levels that the molecule may occupy. Light is able to induce the transition between different vibrational states of molecules either by absorption of a photon or by the so-called Raman process. 10 In absorption spectroscopy, the total photon energy must equal the energy difference between the vibrational states. Typical energy differences occurring in molecular vibrations correspond to light in the infrared portion of the spectrum. Infrared absorption spectroscopy faces several technical complications, including the fact that the molecular absorption spectrum can be affected by the absorption of water molecules, comparably weak light sources and low-sensitivity infrared detectors. In contrast to absorption spectroscopy, Raman spectroscopy is able to transpose the usable spectral region into the visible part of the light spectrum by using only energy differences between input and output photons; therefore, every laser wavelength can be used to record vibrational spectra. One major drawback of Raman spectroscopy is the inherent, extremely small probability of the vibrational energy transition event. Consequently, much light is needed to interact with a sample to yield a small amount of Raman photons. Typically, the ratio is in the order of 1:108 or less. 11 The efficiency of the spectroscopic setup is therefore crucial. A typical setup comprises a laser as a strong light source and an optical system that efficiently focuses the laser onto the sample and collects the emitted Raman light. In recent years, advances in optical components have driven the development of compact Raman spectrometers, typically based on a Raman edge filter as the main component of the system. 12
Raman spectroscopy offers the possibility to probe nondestructively living cells in vitro and even in vivo if suitable laser wavelengths and powers are used.13,14 In this study, Raman spectroscopy was employed for the noninvasive phenotypic discrimination of primary skin cells, including fibroblasts, keratinocytes, and melanocytes. The possibility to differentiate between these primary cell types in situ is particularly of interest when focusing on the evaluation of the quality of TE skin constructs. For the production of such in vitro skin equivalents, a significant number of cells are necessary. Consequently, after isolation from biopsies, these cell types must be expanded in vitro before enough cells are generated for the production of the different layers of the skin model. Although keratinocytes and fibroblasts are located in different anatomical layers and are isolated using separate isolation protocols, there is still a chance of fibroblastic contamination of the keratinocyte cultures. 15 In addition, despite the fact that both epidermal cell types, melanocytes and keratinocytes, are isolated by defined isolation procedures, there is a remaining risk of a contamination of the cell populations with each other. Hence, we aimed to identify the potential to discriminate these cell types noninvasively by Raman spectroscopy to use this technology as a quality control tool in tissue engineering production processes. Since prolonged in vitro culture times might impact the cell quality, we further investigated cell-type-specific fingerprint patterns of normal primary and in vitro-modified keratinocytes based on their Raman spectra. A multivariate analysis of these Raman data was used for the detection of spectral differences. More interestingly, based on these in vitro data, we directly employed laser-based Raman spectroscopy to monitor and discriminate skin cells in human skin biopsies. To study differences between native, primary-isolated, and in vitro-modified keratinocytes in vitro a cell-based skin model was used. Our findings demonstrate that Raman spectroscopy is a promising new technology for the noninvasive in situ quality control and phenotype-separation of cells used in skin tissue engineering applications.
Materials and Methods
Human tissue samples
All research was carried out in compliance with the rules for investigation of human subjects, as defined in the Declaration of Helsinki. This study was carried out in accordance with the institutional guidelines and was approved by the local research Ethics Committee (IRB#190/2005V). After informed written consent was given, juvenile foreskin and a skin biopsy of a 37-year-old woman were obtained from the Robert Bosch Hospital Stuttgart, Germany (PD Dr. T. Walles), and further processed as described below.
Cell isolation and culture
Human fibroblasts and keratinocytes were isolated from juvenile foreskins (n=3). Briefly, biopsies were washed with phosphate-buffered saline (PBS, containing Mg2+ and Ca2+; Invitrogen, Carlsbad, CA), and then cut into pieces (5 mm2) and incubated with 2 U/mL dispase (Invitrogen) over night at 4°C. This incubation step allows the mechanical separation of dermis and epidermis. The dermal part of the skin was used for the isolation of fibroblasts: the minced tissue was transferred into a centrifugal tube containing 500 U/mL type II collagenase (Serva Electrophoresis GmbH, Heidelberg, Germany) and incubated for 45 min at 37°C. After centrifugation of this mixture, the cell pellet was washed, centrifuged again, resuspended in routine culture medium (Dulbecco's modified Eagle's medium [DMEM] containing 10% fetal calf serum [FCS], and 1% gentamycin [all Invitrogen]), and transferred into cell culture flasks. Fibroblasts were cultured in a humidified incubator at 37°C and 5% CO2. The epidermis, which was used for the isolation of keratinocytes, was minced and transferred into a centrifugal tube containing versene mixed with trypsin/EDTA (both from Invitrogen). The incubation of this mixture for 5 min at 37°C was followed by a supplementation with FCS. After gentle mixing, the resulting cell suspension was filtered, centrifuged, and washed. Keratinocytes were cultured in keratinocyte growth medium-2 (KGM-2) (PromoCell, Heidelberg, Germany) in a humidified incubator at 37°C and 5% CO2. Human melanocytes were isolated from the epidermal part of adult female skin (n=3). The skin samples were cut into small pieces (1–2 mm2), washed with PBS, and transferred into a centrifugal tube for incubation with dispase for 3 h at 37°C. The subsequent isolation procedure was identical to that described for keratinocytes. Melanocytes were cultured in Melanocyte Growth Medium M2 (PromoCell) in a humidified incubator at 37°C and 5% CO2. To obtain a purified melanocyte culture and to eliminate a potential contamination with keratinocytes, melanocytes were detached after 10 days and transferred into fresh cell culture flasks.
The human in vitro-modified keratinocyte cell line HaCaT was provided by the German Cancer Research Center (Heidelberg, Germany). HaCaT cells were cultured according to the providers' protocol in routine culture medium at 37°C and 5% CO2.
When cells reached 80% confluence, they were detached and passaged. Culture medium was changed every 3 to 4 days.
Full-thickness in vitro skin model
The full-thickness epidermal/dermal in vitro skin substitutes were generated using cell culture inserts (Nunc, Roskilde, Denmark) suitable for 24-well plates (Greiner BioOne, Frickenhausen, Germany). Each dermal reconstruction was made up of 5×10⁵ fibroblasts embedded into a collagen hydrogel. Briefly, fibroblasts were resuspended with 166 μL ice cold (4°C) gel neutralization solution consisting of double-concentrated DMEM, 3% FCS, 3% 3M HEPES (Roth, Karlsruhe, Germany), and a 1:1 mixture of Chondroitin-4 sulfate and Chondroitin-6-sulfate (0.025 mg/mL; Sigma Aldrich, Munich, Germany). This cell suspension was mixed with 333 μL type 1 collagen solution (rat tail collagen dissolved in acetic acid at a final concentration of 6 mg/mL), given into the insert and incubated at 37°C for 10 min until the collagen matrix completely polymerized. An immersed culture with fibroblast culture medium for 24 h followed. For epidermal reconstructions the dermal equivalent was coated with 25 μL fibronectin solution (Invitrogen) and incubated for 30 min at 37°C, before 1×10⁵ keratinocytes or HaCaT cells in a total volume of 100 μL culture medium were seeded onto this dermal equivalent. Another incubation step for 45 min at 37°C was necessary to allow cell attachment. During the immersed culture period of 6 days, the KGM-2 medium was exchanged every second day with decreasing FCS concentrations (5%, 2%, 0%). The skin construct was subsequently lifted to the air–liquid interface by transferring the insert into a six-well plate, and the culture medium was switched to KGM-2 medium, supplemented with 1.88 mM CaCl2 (Merck, Darmstadt, Germany), which was followed by a 12-day-culture period. The medium was exchanged every 2–3 days.
Immunochemical and histological staining
Immunochemical staining was performed on cells cultured in chamber slides and sections of human skin and the in vitro skin model. The cells were fixed by using ice-cold ethanol/acetone (1:1) for 10 min and washed. Histological sections were deparaffinized and subjected to antigen retrieval. Both cells and histological sections were then exposed to peroxidase blocking solution (EnVision Kit; Dako, Glostrup, Denmark) to quench the endogenous peroxidases. Primary antibodies [Prolyl 4-hydroxylase (P4hβ) (1:100; clone 5B5; Abcam, Cambridge, MA), pan-cytokeratin (1:200; clone AE1/AE3; Abcam), Melan A (1:50; clone A103; Dako), collagen type I (1:100; R1038; Acris Antibodies, Herford, Germany), and cytokeratin-10 (1:200; clone DE-K10; Dako)] were diluted in bovine serum albumin-containing washing buffer and incubated for 1 h. The cells were then incubated with biotinylated secondary antibodies for 30 min, which were observed using a DAB system (EnVision Kit). For general morphology, the sections were stained with hematoxylin and eosin (H&E). Bright-field images were acquired using a Zeiss Axiovert 200 microscope (Carl Zeiss MicroImaging GmbH, Göttingen, Germany).
Raman spectrometer setup
A custom-built Raman spectrometer coupled with a commercially available fluorescence microscope (Olympus, Tokyo, Japan) and equipped with a 785 nm diode laser (Toptica Photonics AG, Munich, Germany) was used for the Raman spectroscopic analysis. The output laser beam with a power of 85 mW was coupled into the microscope and focused onto the samples by a 60× water immersion objective (N.A. 1.2; Olympus). In backscattering geometry, the stray light was collected by the same objective, filtered by a Raman edge filter to suppress elastically scattered light and eventually focused onto the entrance slit of a commercially available spectrograph (Kaiser Optical Systems Inc., Ann Arbor, MI). The holographic grating of the spectrograph was chosen to provide the low-frequency region of the Raman spectrum from ∼0 to 2000 cm–1 with a spectral resolution of ∼4 cm–1. A near-infrared-optimized, cooled CCD camera (Andor iDus, Belfast, Northern Ireland) was attached to the output port and used for data acquisition.
Raman spectroscopy of cells
For Raman spectroscopy measurements, cells were detached, resuspended in routine culture medium, and given into the measuring vessel—a glass bottom dish (Matek Corp., Ashland, MA). The measurement of adherent cells was performed 1 day after seeding. Per each experiment, 20 to 25 cells were measured. Each Raman spectrum measured in a single location of a cell was collected with an integration time of 100 s and an excitation power of ∼20–30 mW, measured at the sample. Data were acquired with the software package Andor Solis, which was provided by the camera manufacturer (Andor iDus). All data sets were reduced to the spectral region between 600 and 1800 cm−1, since the main spectral information is present in this region. Narrow noise spikes that arose from cosmic ray were eliminated from the spectra manually. The corresponding reference spectra, which were taken after the measurement of every fifth cell, were subtracted from the sample spectra to eliminate background information of the medium and the glass bottom dish of the sample cell. Afterwards all spectra were baseline-corrected using a rubber band correction (64 baseline points). For this data processing, software Opus® (Ver. 4.2, Bruker, Billerica, MA) was used. Finally, all spectra were smoothed using the Savitsky-Golay algorithm (nine points, second-order polynomial) to reduce noise and vector normalized for the reduction of inherent variations in absolute signal intensities. These processing steps were carried out with the Unscrambler® (Ver. 9.7, Camo Software AS, Oslo, Norway).
Measurement of ex vivo human skin and skin models
To measure fibroblasts and keratinocytes within their natural environment, the dermis and epidermis of a skin biopsy of a 37-year-old woman were separated by incubation with dispase overnight as described earlier. Keratinocytes from the basal layer and fibroblasts from the dermis were measured as described above. Baseline corrections of these Raman spectra were done manually to minimize the fluorescence background. For the measurement of epidermal cells cultured as part of the in vitro model, the construct was simply removed from the insert and transferred to the measuring vessel. Cells were measured as described above.
Principal component analysis
Principal component analysis (PCA) is one of the most common multivariate techniques used for the analysis of spectral data allowing for the classification of spectra based on their similarity. Briefly, the algorithm finds a new set of basic spectra that are able to describe all measured spectra by a linear combination. The set of basic spectra is ordered in a way that the first spectrum describes the highest spectral variation in the measured data (e.g., one isolated Raman band that strongly changes its peak height in the respective data set). The second spectrum consists of the second strongest spectral variation (e.g., a second, not correlated Raman band). In most cases, it is sufficient to use a limited set of basic spectra to describe the measured spectra since the higher components will ultimately describe just the remaining noise in the spectra. The basic spectra in a PCA are called the loadings of a data set and every measured spectrum may be characterized by a set of linear coefficients that reconstruct the spectrum as a weighted sum of these new basic spectra. These coefficients are called scores and every measured spectrum is represented by a set of scores. The score-plot of a PCA displays every measured spectrum, represented by a point. Similar spectra group together in certain regions, whereas strongly differing spectra are widely separated. In addition, the corresponding plot of loadings shows exactly which variations in the original data are responsible for the variations on the scores and thus provide a hint about the molecular differences.
Support vector machine
As the PCA described above is mainly used to analyze a data set, support vector machines (SVMs) are a common mathematical method used to classify new measurements of unknown samples (test data) based on experiences from a data set of known samples (training data). 16 Thus, the first step in setting up an SVM is training with known data, for example, Raman spectra of known cell types. The mathematical algorithm may then be used with the original spectra or with the score-representation from a PCA—in all cases the spectrum is represented by an n-dimensional set of values (whether n denotes the number of wavelengths recorded or the number of significant scores), that is, by a point in an n-dimensional space. The training data set contains information about the classification: in our case, information about the cell type of every measurement. If cell types can be differentiated by Raman spectroscopy, the corresponding Raman spectra of these cell types should cluster in certain regions of the n-dimensional space. The mathematical algorithm defines boundaries between these clusters by maximizing the distance between the boundary and the respective cluster points; calculating these boundaries completes the training of the data set. An unknown spectrum may now be classified by looking up its position within the n-dimensional space using the separating boundaries. A classification based on SVMs may be characterized by its performance on a known data set. Typically, this data set is split into a training data set (e.g., 50% of all spectra) and a test data set (the remaining 50%). The SVM is trained using the first set of data and will be evaluated using the second data set by comparing the classification results with the true classification and, in particular, by calculating sensitivity and specificity. 17
Sensitivity describes the proportion of true-positive values (TP) that were correctly identified by the SVM analysis. It is calculated by dividing the number of true-positive values by the sum of true-positive and false-negative values (FN) and is displayed in percentage. FN is the number of spectra that were falsely predicted by the SVM analysis.
18
Depending on the application of the Raman measurements, the number of true-positive values corresponds to all correctly predicted Raman spectra of the mainly focused cell type. (For the comparison of fibroblasts and keratinocytes, the amount of correctly predicted keratinocyte spectra is TP and the number of keratinocyte spectra that were predicted as fibroblast spectra corresponds to FN.)
Specificity describes the proportion of true-negative values (TN) that are correctly identified by the SVM analysis. It is calculated by dividing the number of true-negative values by the sum of true-negative and false-positive values (FP) and is displayed in percentage.
Depending on the aim of the cellular characterization by Raman spectroscopy, the number of true-negative values corresponds to the number of correctly predicted Raman spectra of the undesired cell type. For the identification of a potential fibroblast contamination within a keratinocyte population, the number of correctly predicted fibroblast spectra represents the value of TN. The number of fibroblast spectra that were predicted as keratinocyte spectra represents the FP value.
Statistical analysis
Data are presented as mean±standard deviation. Statistical significance was assessed by Fisher's analysis of variance (ANOVA) and Kruskal–Wallis test. p-values<0.05 were defined as statistically significant.
Results
Raman spectrum interpretation
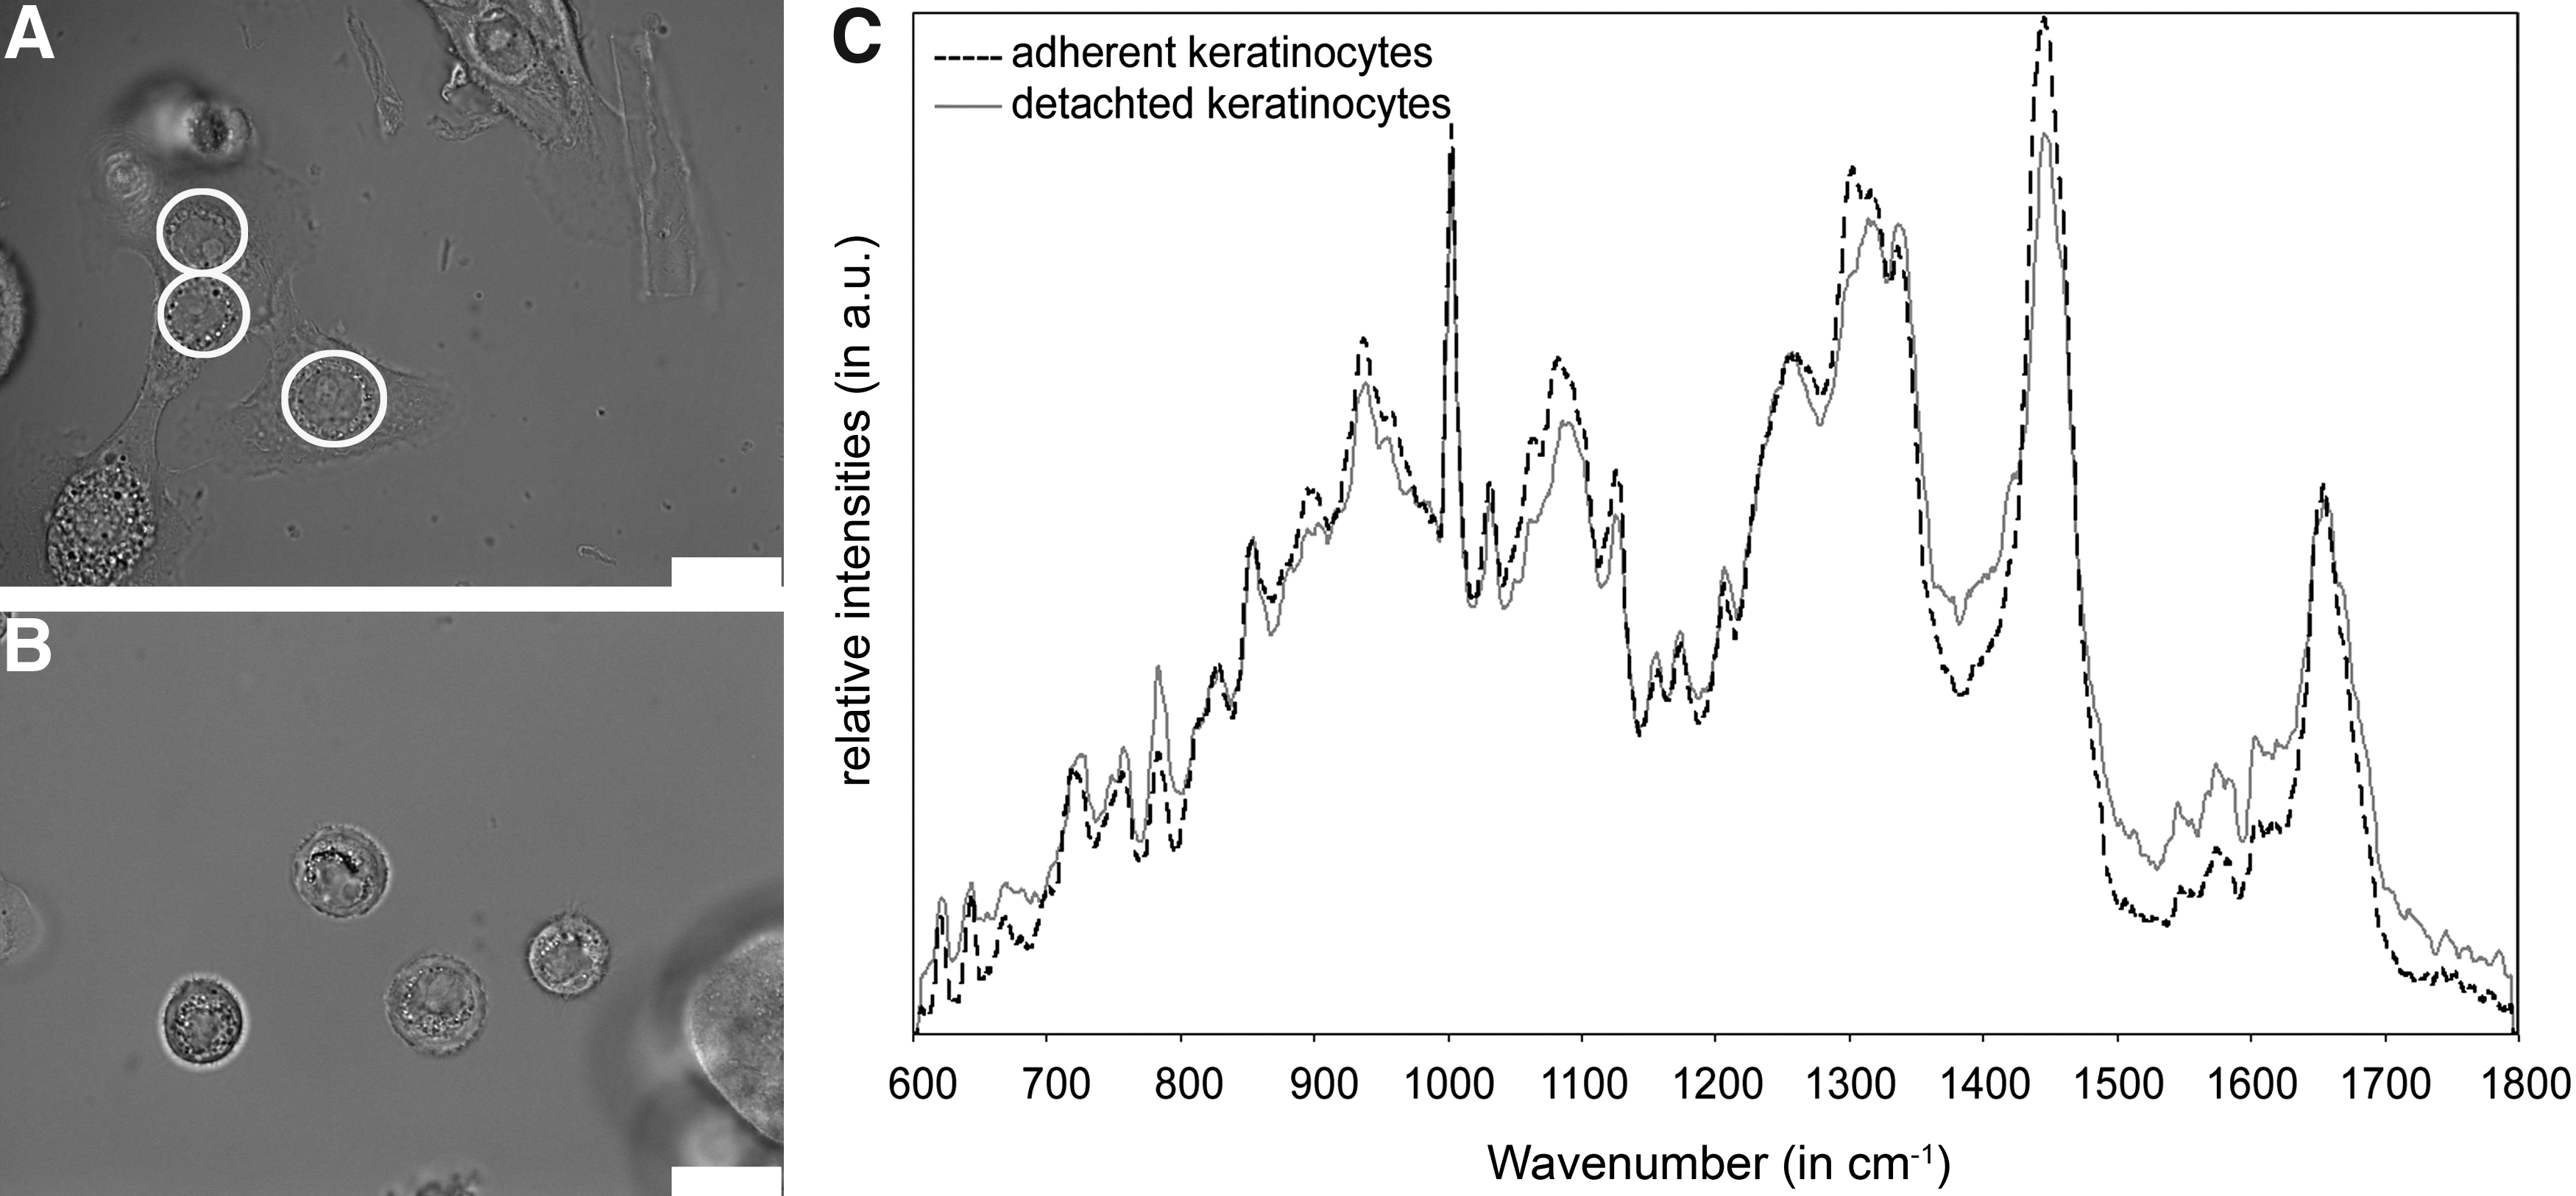
This study focused on the noninvasive characterization of several skin cell phenotypes by Raman spectroscopy, allowing a marker-free and rapid cell analysis. A typical Raman spectrum with peaks originating from defined molecular vibrations of various cellular components was obtained from an individual living cell within an integration time of 100 s. By employing a sensitive and multivariate analysis of the obtained spectra, the detection of minor cellular differences was possible. This chemometric technique helped analyzing entire Raman spectra simultaneously, simplifying a complete spectral data set into a few PCs. During a PCA algorithm, score values were translated to a PC (PC1–PC4) from a corresponding spectrum. Thus, score plots could be used to identify clustering of data, which consequently helped to reveal important trends within a data set. For the initial experiments, adherent keratinocytes were selected because the cell nuclei are well distinguishable from the cytoplasm. These cell compartments could therefore be studied separately by Raman spectroscopy (Fig. 1A, C). These first experiments helped to assign which cellular component was responsible for which significant peak seen in the Raman spectra of detached cells (Fig. 1B, C). Raman spectra of the cytoplasm showed very low intensities and did not contain useful information as the signal-to-noise ratio was low and no significant peaks were observable (data not shown). In contrast, Raman spectra obtained from the cell nuclei of adherent keratinocytes and spectra obtained from detached keratinocytes revealed similar cell-specific Raman peaks (Fig. 1C).
Bright-field micrographs of human
Phenotypic discrimination of epidermal and dermal skin cells
The phenotypical discrimination of primary skin cell types by Raman spectroscopy was studied using epidermal keratinocytes and dermal fibroblasts (Fig. 2). Mean Raman spectra of primary fibroblasts and keratinocytes were shown for the spectral region between 600 and 1800 cm−1 since most spectral information is present in this fingerprint region (Fig. 2A). The averaged and similarly structured spectra of these two cell types showed typical peaks originating from different biomolecules such as proteins, nucleic acids, lipids, and carbohydrates.13,19–21 However, a few spectral differences were observed at 870, 955, 1037, 1079, 1269, and around 1665 cm−1 (Table 1). These differences could be due to both spectral differences and intensity shifts. In general, spectral differences are due to peaks that are solely present in one spectrum and do not occur in the second spectrum, whereas intensity shifts are due to different intensities in the same peak in both spectra. Based on these assumptions, we have evaluated that spectral differences occurred at wavenumbers of 870, 955, 1037, and 1269 cm−1, whereby intensity shifts were seen at 1079 and 1665 cm−1. Both peaks at 955 and 1079 cm−1 could be assigned to lipids such as cholesterol.22,23 Others associated the peak at 956 cm−1 to molecular vibrations of keratin. 24 These Raman peaks show significantly higher intensities in the Raman spectra of keratinocytes than the spectra of fibroblasts (Fig. 2B). Collagens can be assigned to peaks at 870, 1037, 1268, and around 1665 cm−1.21,25–28 The intensities of these Raman peaks are significantly higher in the spectra of fibroblasts in contrast to the peaks of the spectra of keratinocytes except of the Raman peat at 1665 cm−1 (Fig. 2B). Figure 2C shows the PCA plot performed on Raman spectra of primary keratinocytes and fibroblasts using the PC1 and PC2. These two PCs account for 58% of the total explained variance. For both cell types, data points (scores) clustered together in one region within this PCA plot. The separation of these two clusters occurred along the PC1 axis.
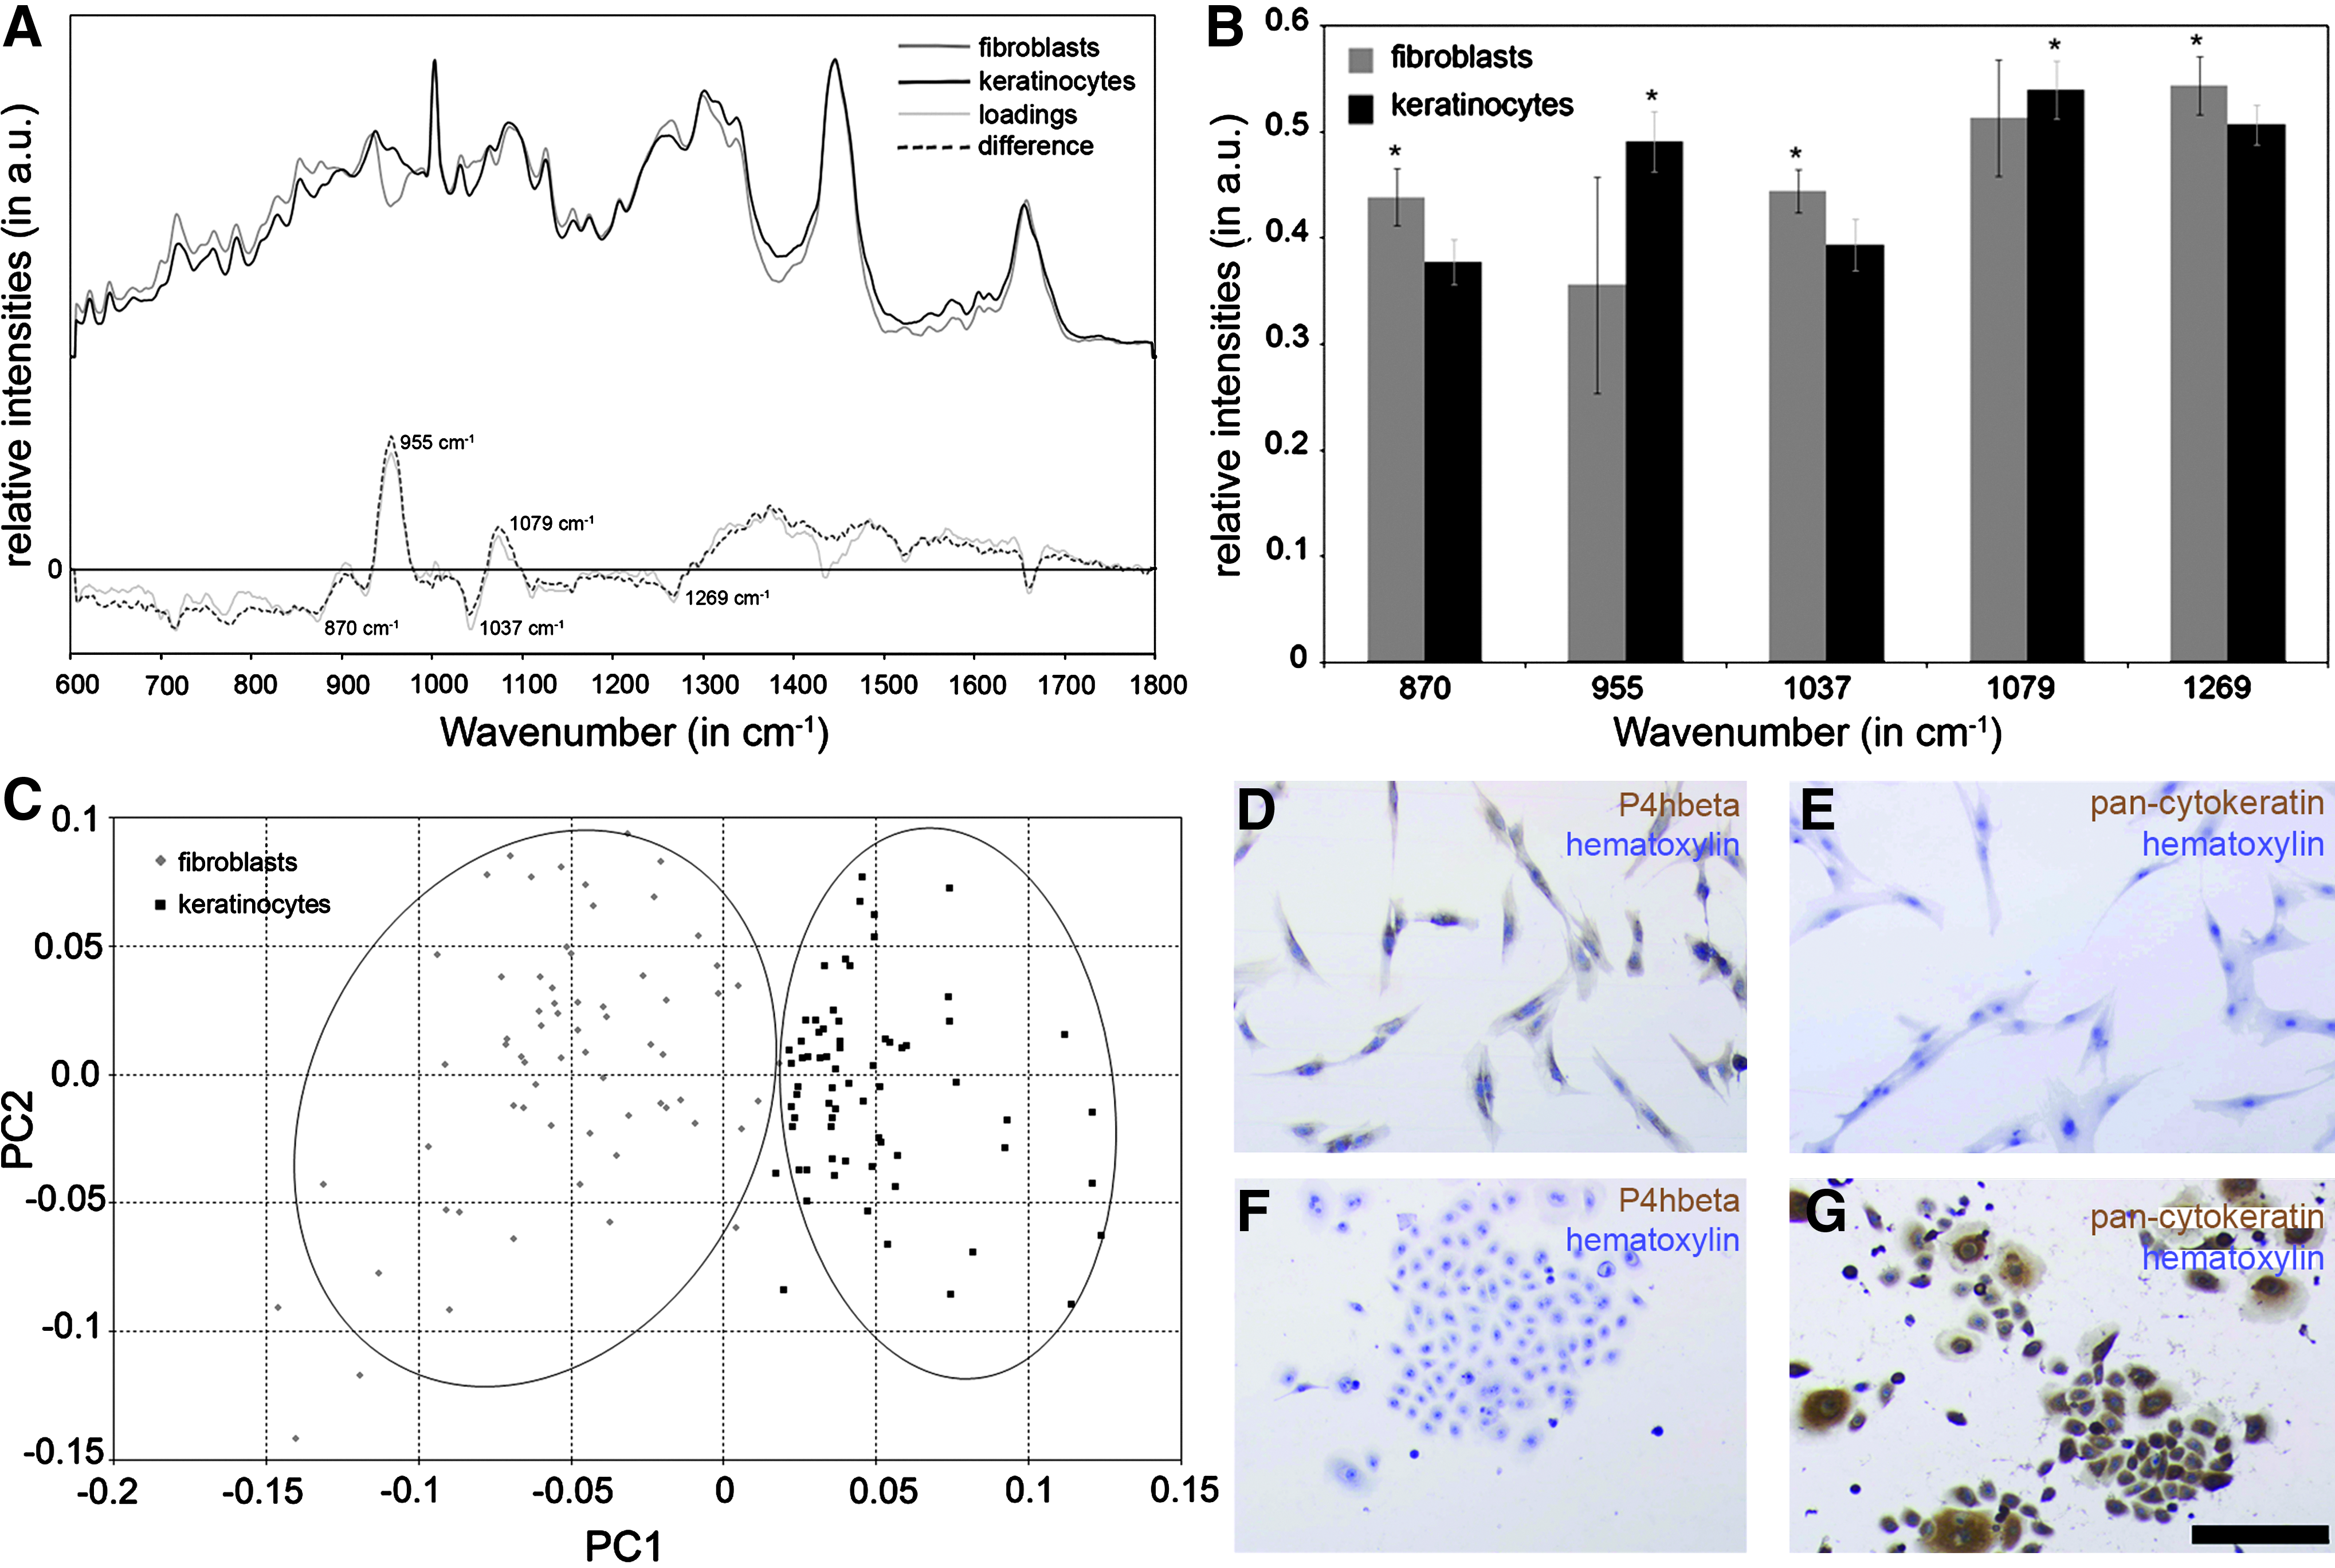
The discrimination of fibroblasts and keratinocytes was also shown by routine immunocytochemical staining using pan-cytokeratin and P4hbeta (Fig. 2D–G). P4hbeta was used to distinguish fibroblasts from keratinocytes as it is only found in fibroblasts (Fig. 2D vs. F). P4hbeta is an intracellular enzyme required for the synthesis and formation of many types of collagen. 29 In contrast, the pan-cytokeratin antibody specifically identified keratinocytes, whereas no staining was observed within the fibroblast cultures (Fig. 2E vs. G). Cytokeratin is a structural protein found in the cytoplasm of epithelial cells. 30
Distinction of melanocytes and keratinocytes
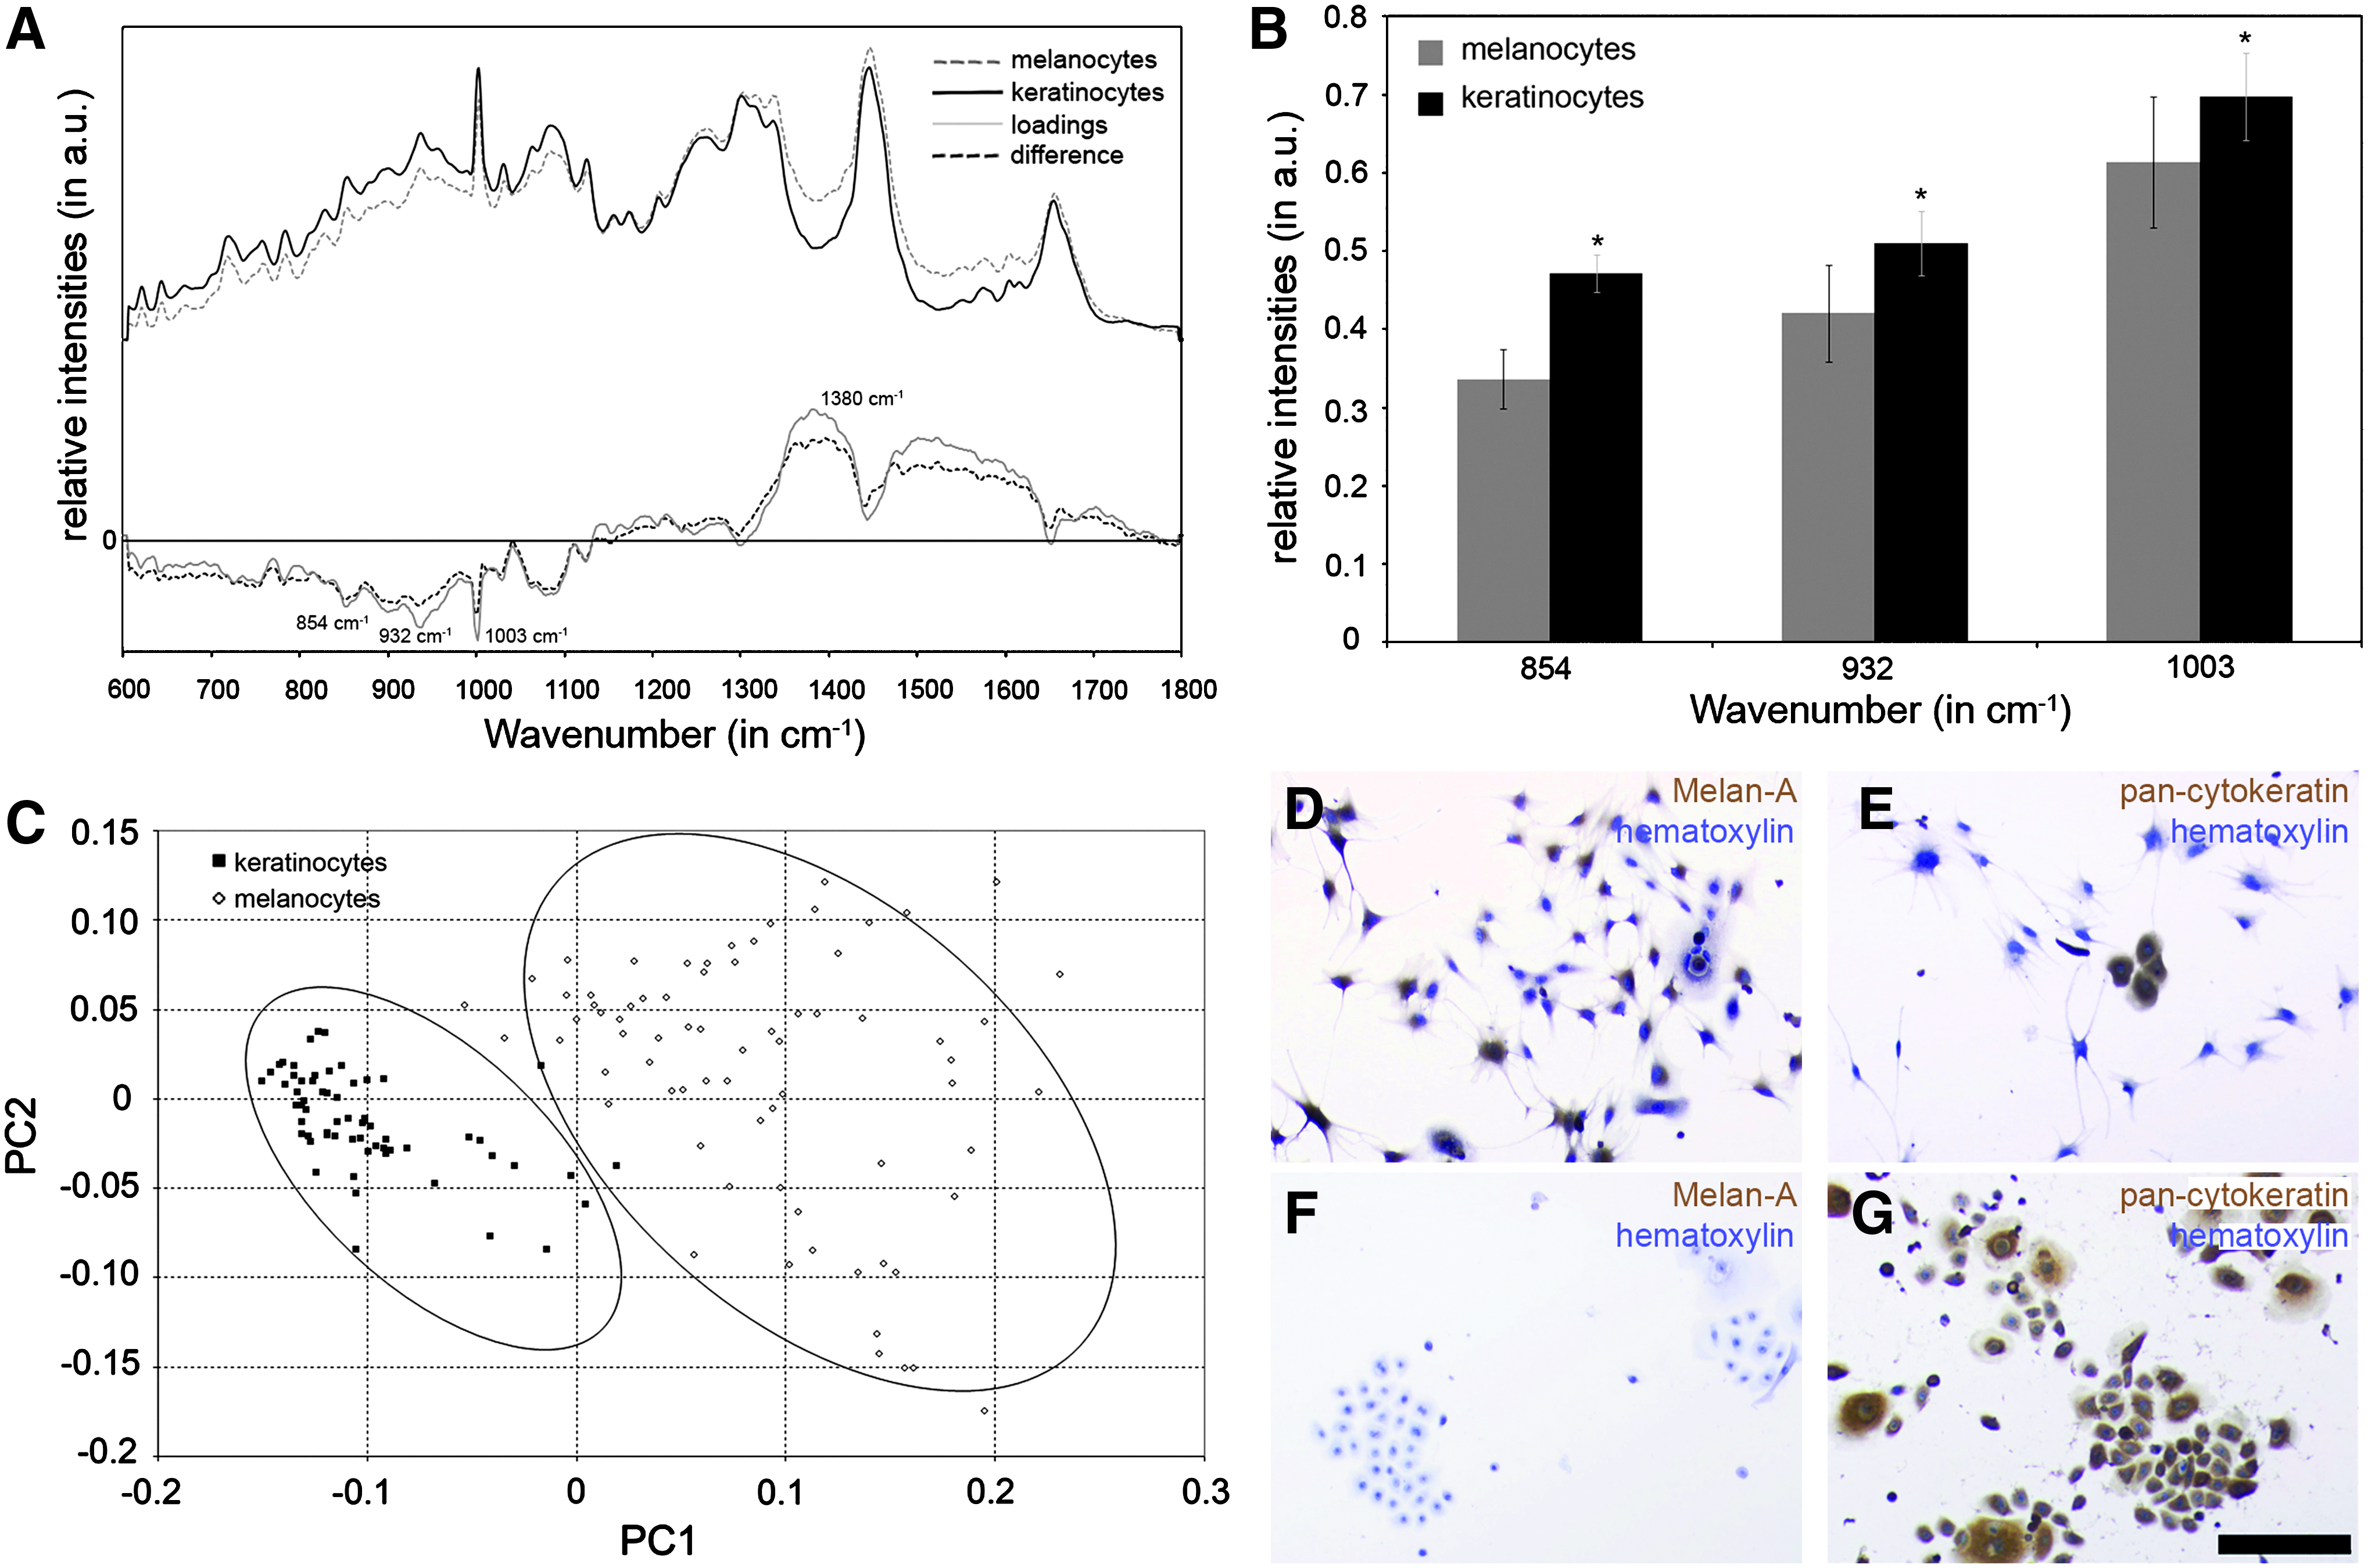
Melanocytes and keratinocytes are two cell types present in the epidermal layer of the skin. Here, we aimed to detect spectral differences between these cell types using Raman spectroscopy. Figure 3A presents the mean Raman spectra obtained from primary melanocytes and keratinocytes as well as the mean difference and loading spectra. Spectral differences were observed between melanocytes and keratinocytes in the spectral baseline and in the loading spectrum at 854, 932, 1003, and around 1380 cm−1 (Table 2). In previous reports, the ring structure of the amino acid tyrosine had been assigned to the peak at 854 cm−1; the helical structure of proteins had been assigned to the peak at 932 cm−1, whereas the overall protein concentration was identified by the peak at 1003 cm−1.21,31,32 All mentioned peaks showed significantly higher intensities in the Raman spectra of keratinocytes compared with the spectra of melanocytes (Fig. 3B). The peak at 1380 cm−1 was assigned to the pigment melanin. 33 The intensity values for this specific peak were not normally distributed and therefore analyzed by a Kruskal–Wallis ANOVA, which showed significantly higher peak intensities for the spectra of melanocytes than for keratinocytes. We established a score plot comparing the spectra of melanocytes and keratinocytes (Fig. 3C). Each of the displayed score clusters represents either melanocytes or keratinocytes that are separable along the PC1 axis. PC1 and PC2 accounted for 78% of the explained variance although there were two scores in the keratinocyte cluster that could be assigned to the melanocyte population. Routine immunocytochemical staining also showed the discrimination between melanocytes and keratinocytes (Fig. 3D–G). Melanocytes were solely stained with the Melan-A antibody (Fig. 3D vs. F), which binds to a protein antigen found in melanocytes of the skin. 34 As described above, keratinocytes were stained with the pan-cytokeratin antibody, which was in contrast to the melanocyte population (Fig. 3E vs. G). We found that pan-cytokeratin-stained keratinocytes appeared also in the melanocyte cultures, which can be explained by a limitation of the isolation method (Fig. 3E).
Discrimination between primary and in vitro-modified cells
For the production of skin equivalents or in vitro skin models, a sufficient amount of preferably autologous cells is necessary. These cells are obtained through multiple passages of cell expansion. During this prolonged in vitro culture, pathologic cell changes may occur; therefore, it is of particular importance to noninvasively monitor cells to exclude primary cells, which are potentially degenerated or genetically altered. Here, we tested the possibility to detect molecular cell changes by comparing Raman spectra of primary keratinocytes and in vitro-modified (immortalized) HaCaT cells. Figure 4A shows mean Raman spectra obtained from primary keratinocytes and HaCaT cells as well as the mean difference spectrum and loading values to identify the most significant spectral differences. The occurring profiles of the loading and difference spectra were almost identical and showed distinctive peaks in the regions of 727, 785, 1003, 1093, 1252, and 1660 cm−1. Interestingly, it had been previously reported that peaks at 727, 785, 1093, and 1252 cm−1 correspond to molecular vibrations of nucleic acids, DNA and RNA bases, and PO2− stretching vibration of the DNA backbone.21,35 It was also shown before that the peak at 1003 cm−1 occurs due to specific vibrations of phenylalanine, which indicates a difference in the protein concentration of the studied cell types as well as the amide I peak at 1660 cm−1 (Table 3).21,31,36 All mentioned Raman peaks showed significantly higher intensities in the spectra of HaCaT cells when compared to keratinocytes (Fig. 4B).

In our experiments, we also observed differences in a broader peak, present in the wavenumber region at 1400 cm−1, occurring in the loading and difference spectra. Although we performed a baseline correction of the Raman spectra to exclude the (background) signal from the glass and the medium, we believe that this signal results from the glass of the glass bottom dish. We hypothesize that this is most likely because during Raman measurements, which are performed on nonadherent cells in suspension, the laser was focused at different (z-) depths of the primary and modified cells due to significant differences in cells' morphologies (Fig. 4C, D). However, when we excluded the wavenumber region that can be assigned to the glass signal (1338–1450 cm−1), we still observed a clear discrimination of the two cell types with a small area of overlapping scores (Supplementary Fig. S1; Supplementary Data are available online at
The results of the PCA performed on the spectral data set obtained from keratinocytes and HaCaT cells showed two distinguishable clusters containing each of the studied cell types (Fig. 4E). In contrast to the distribution pattern of HaCaT cells, we identified a broader distribution of score values of keratinocytes, most likely due to a higher heterogeneity of the primary isolated cells. For this analysis the first and fourth principal components (PC1 and PC4) corresponded to 41% of the total explained variance.
Raman spectroscopy of ex vivo and in vitro skin
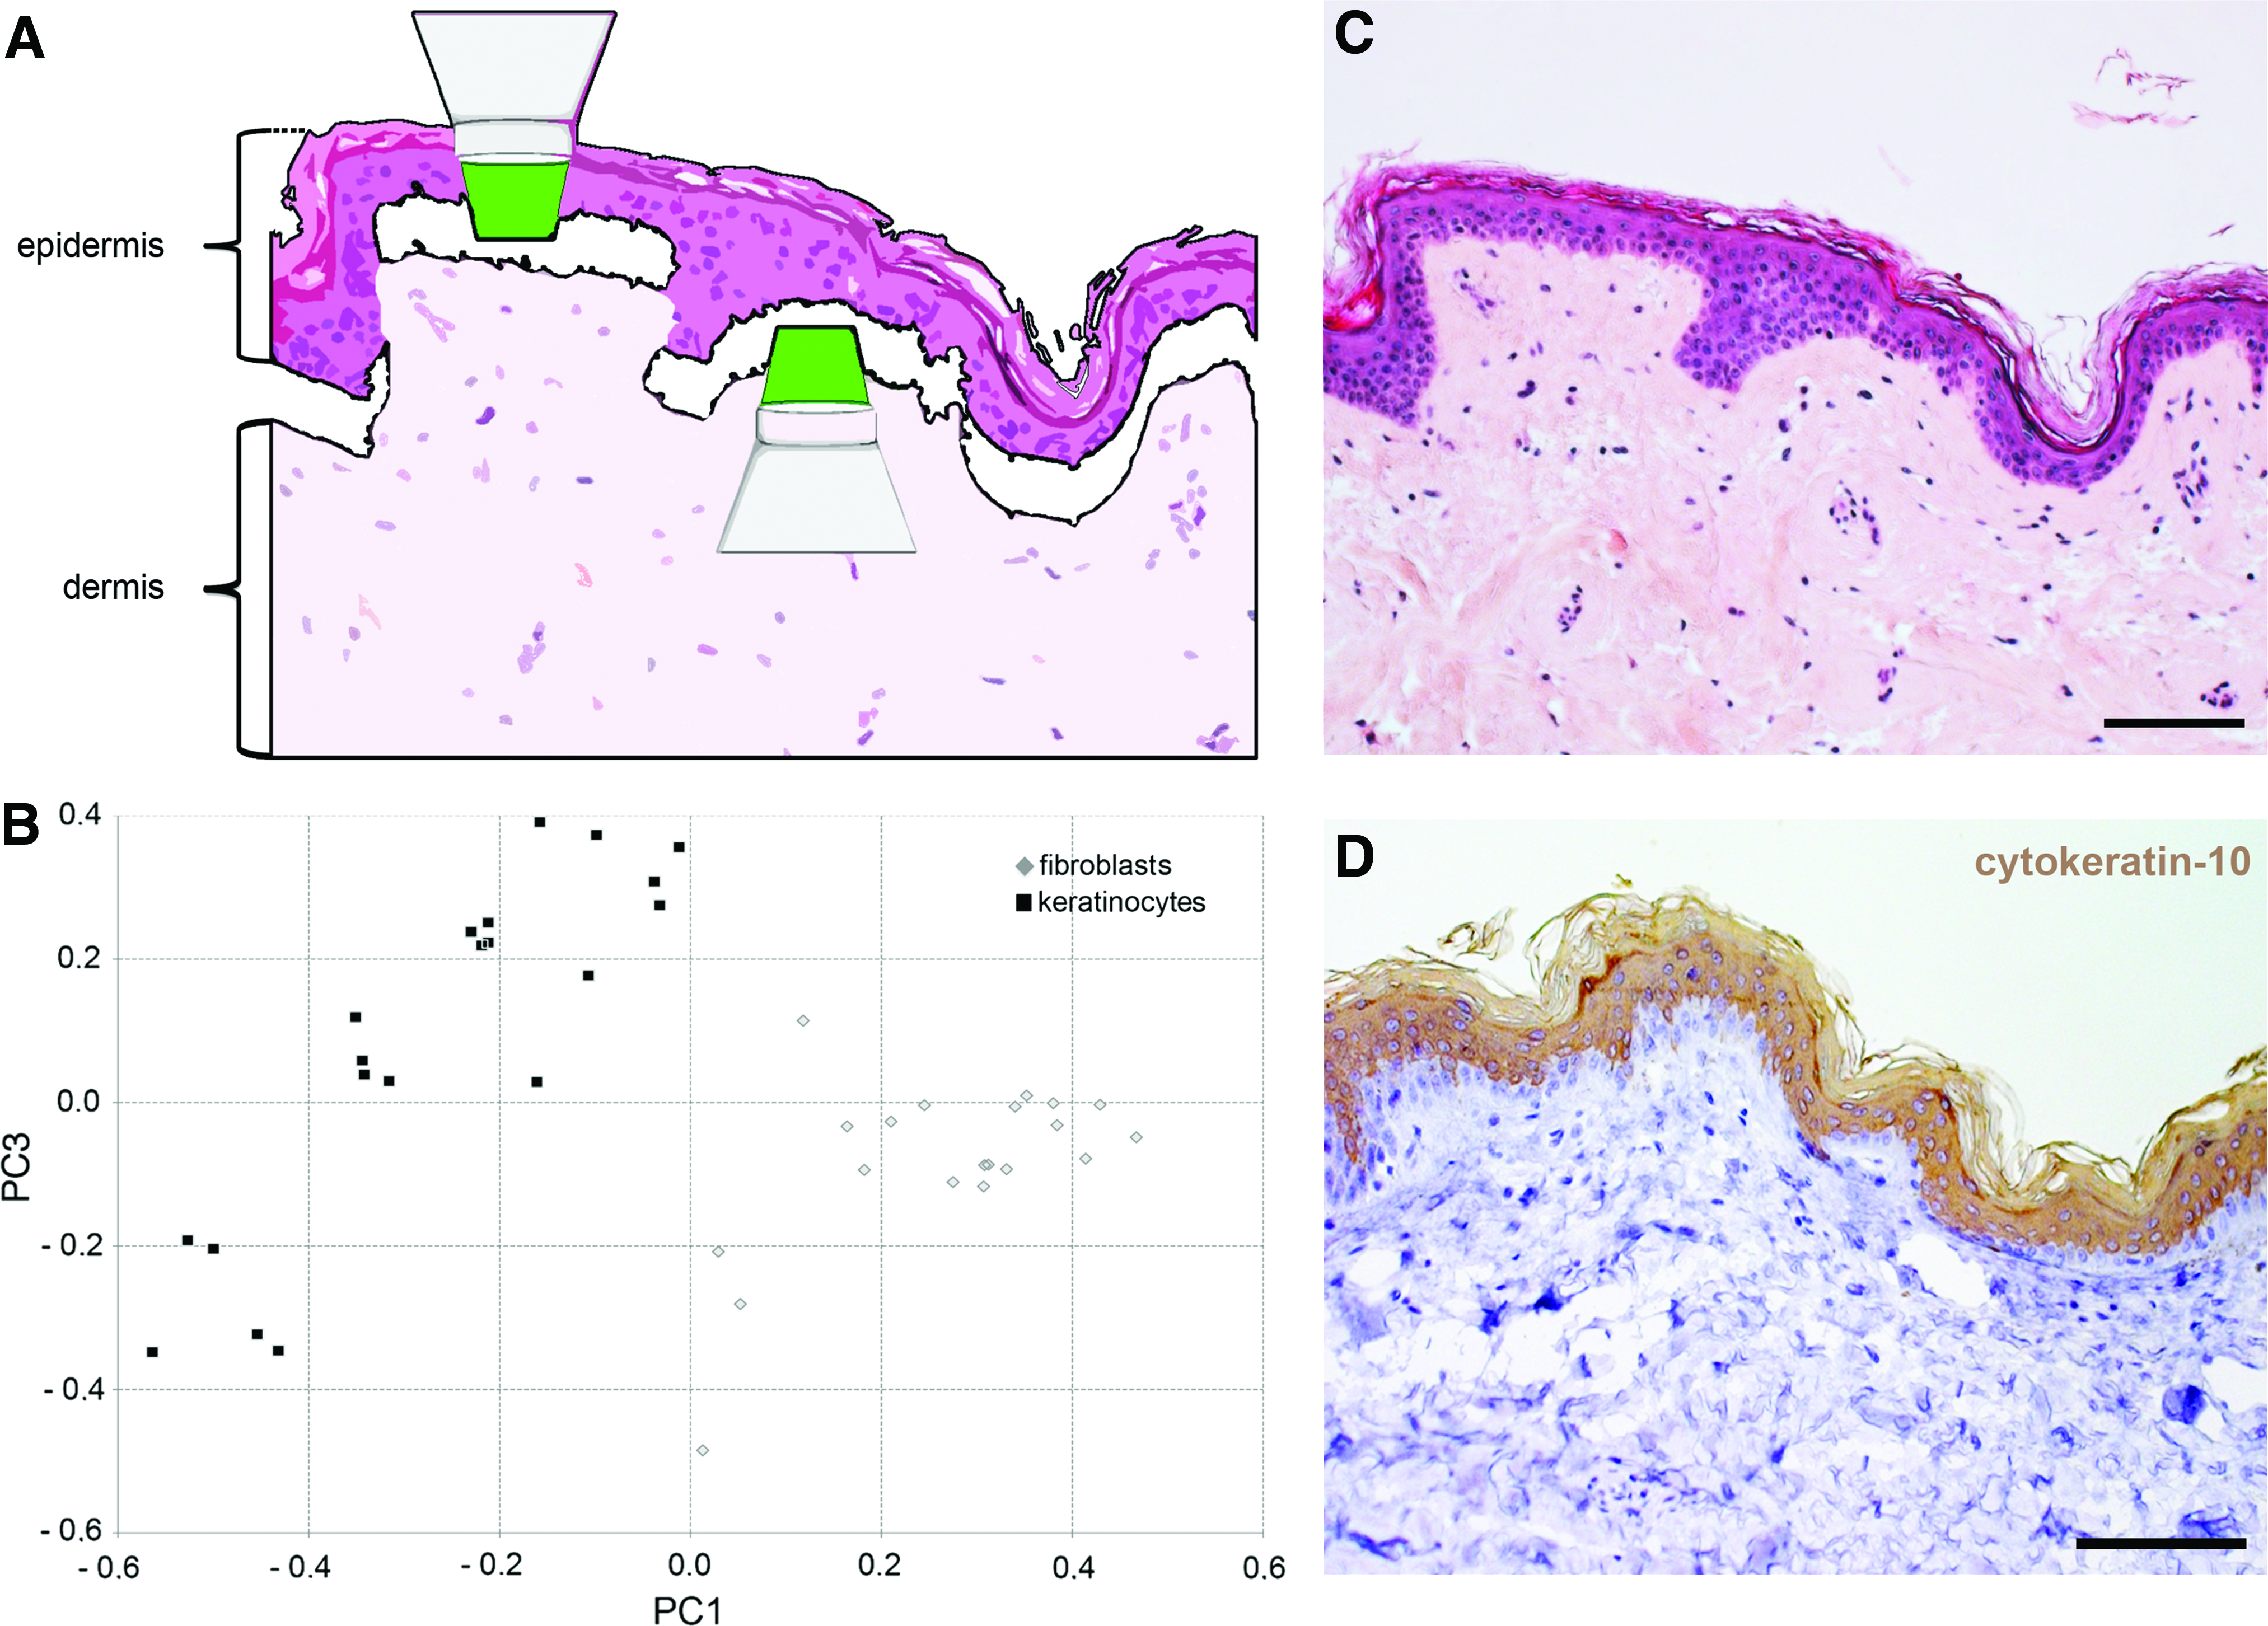
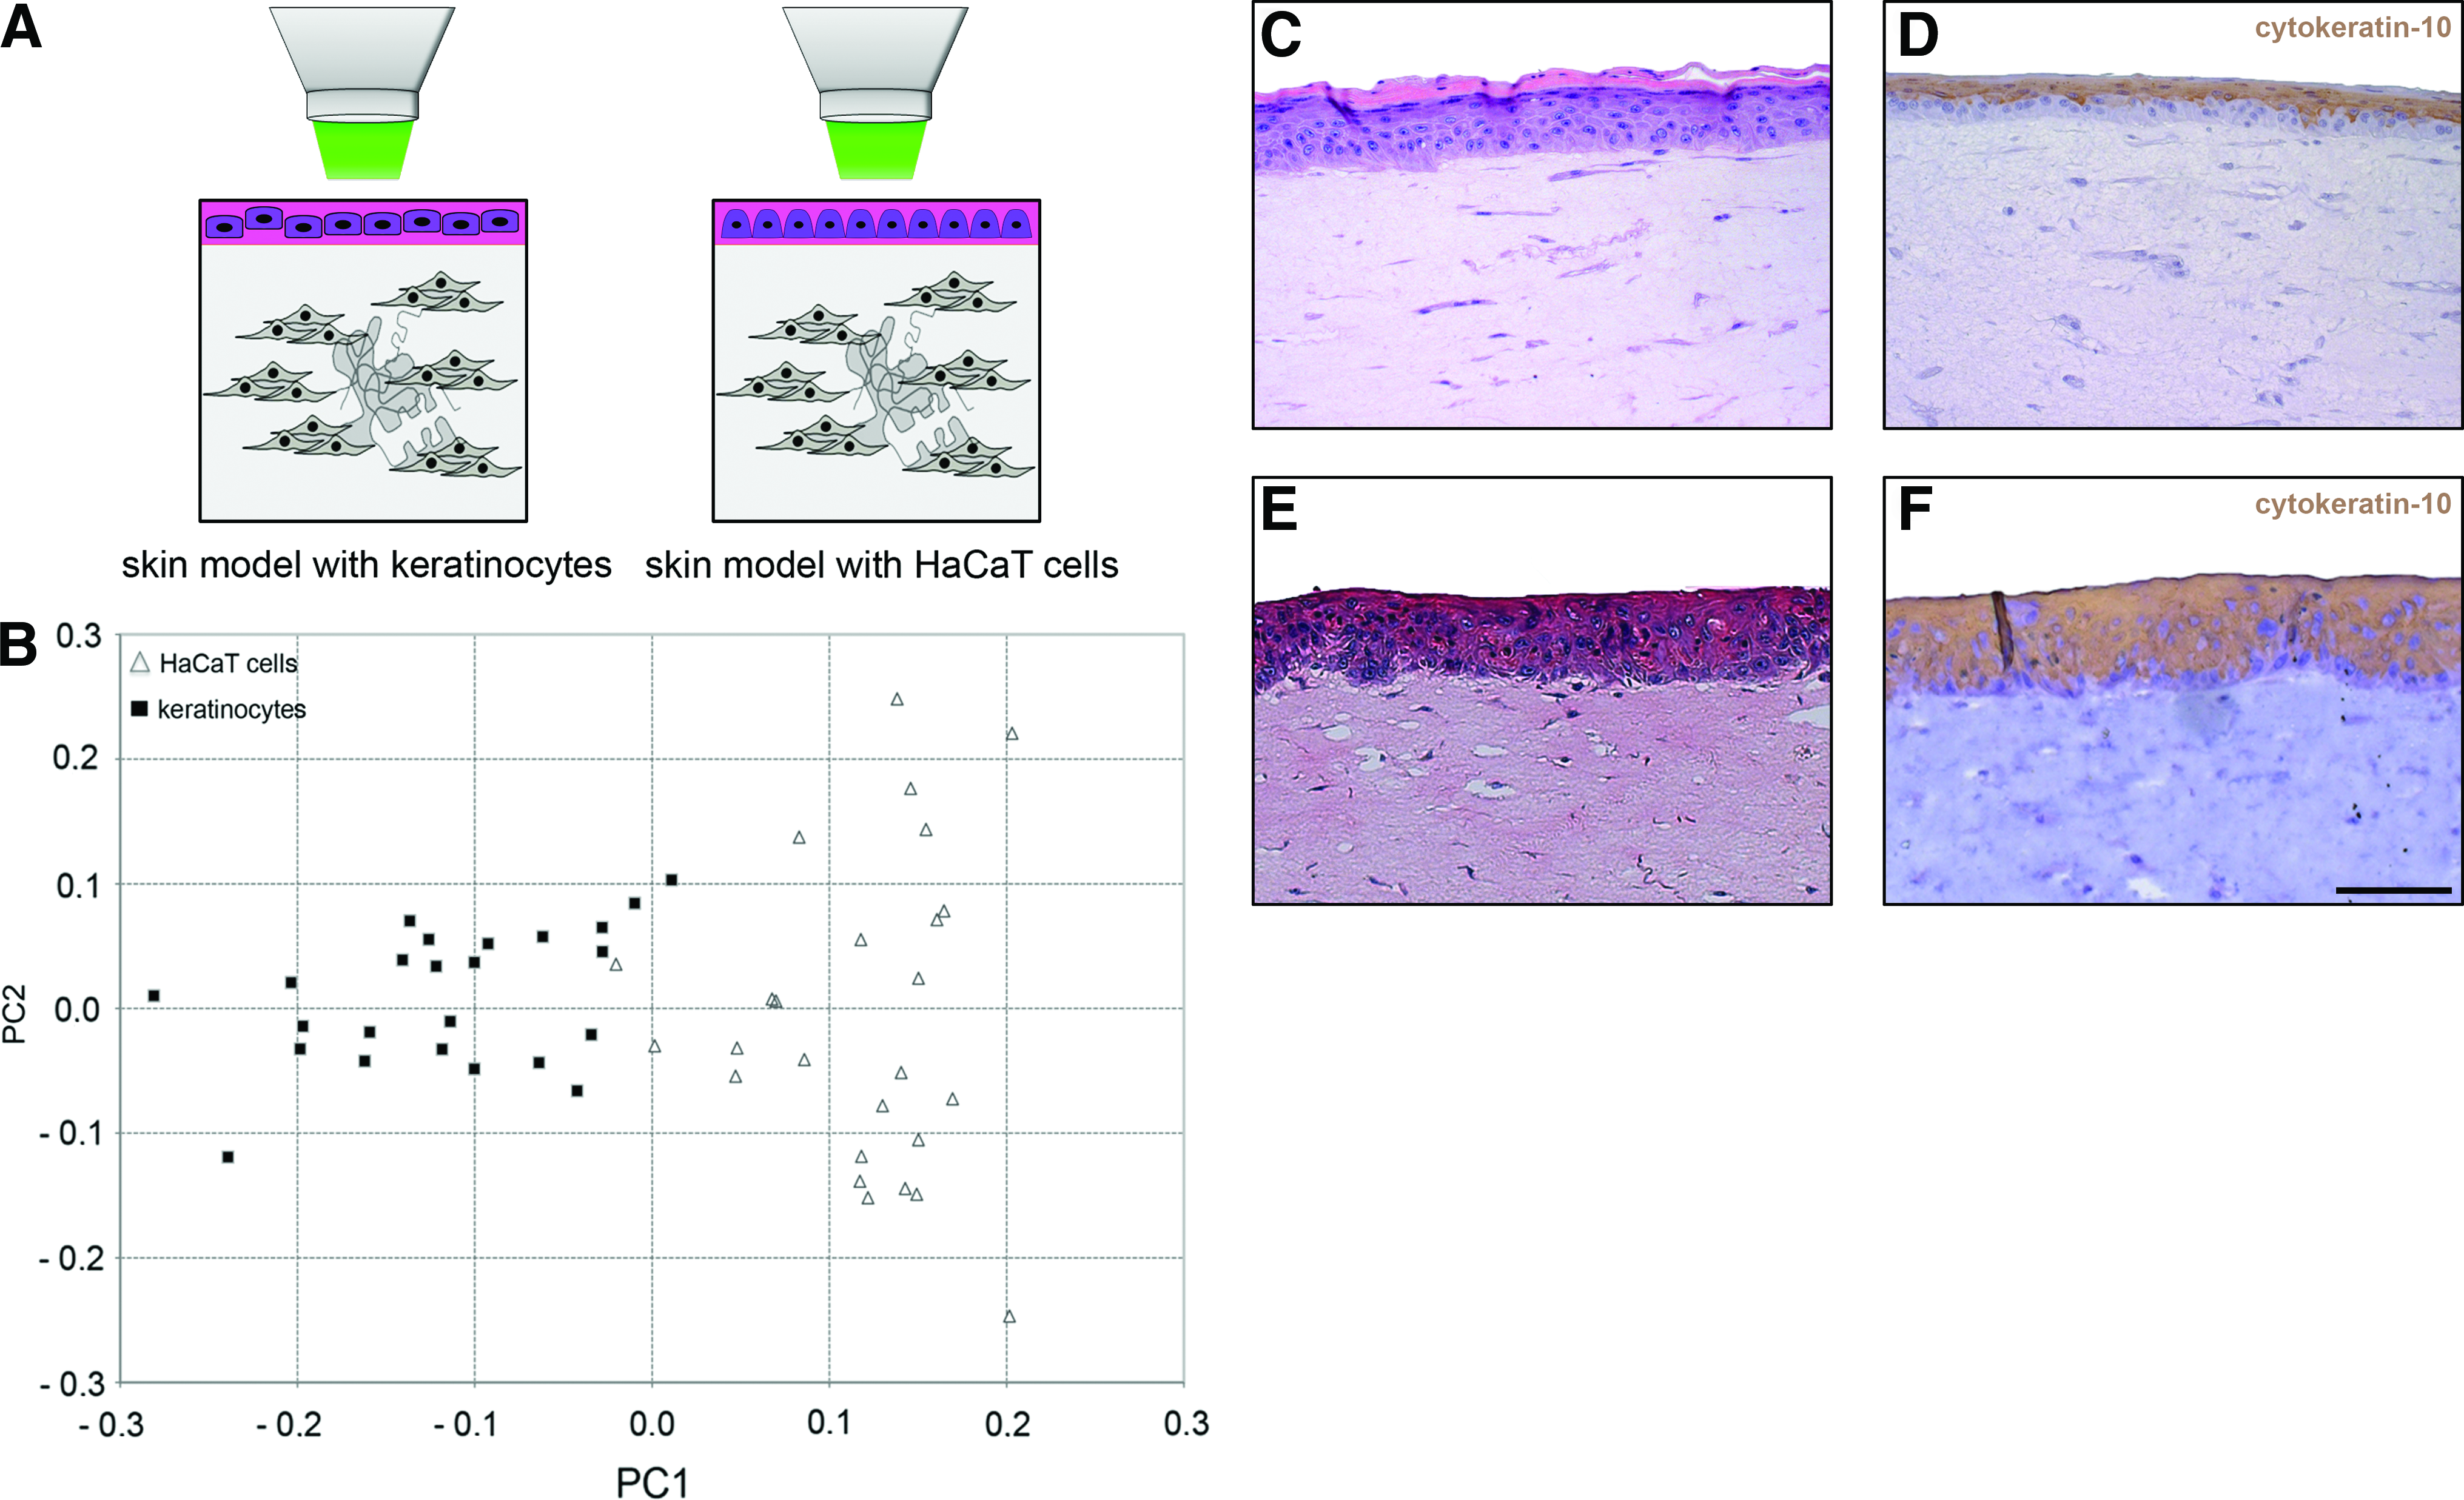
The potential to discriminate different skin cell types within their native environment was examined. Raman spectroscopy was employed to monitor vital keratinocytes and fibroblasts in ex vivo skin (Fig. 5). We observed a successful separation of these two cell types by their Raman spectra. Accordingly, two clusters containing scores of each cell type were discriminated along the PC1 axis (Fig. 5B). Routine histological and immunochemical staining using a keratinocyte marker (cytokeratin-10) confirmed the clearly separable epidermal and dermal layers (Fig. 5C, D). Using in vitro skin models, we were further able to differentiate between native and in vitro-modified cells within defined matrix components (Fig. 6). Primary keratinocytes and HaCaT cells were measured and the multivariate analysis of the obtained spectra resulted in two clusters that were separated along the PC1 axis (Fig. 6B), whereby two scores of the HaCaT cell population slightly shifted to the score cluster of the primary keratinocytes. To clearly show the localization of the epidermal layer on top of the dermal layer, the skin models were also analyzed using routine histology (Fig. 6C, E) as well as by using a marker that identifies a structural protein as part of the cytoskeleton of epithelial cells (cytokeratin-10) (Fig. 6D, F).
Discussion
Raman spectroscopy is an established technique for the noninvasive identification and characterization of several cell types based on their biochemical composition. The cell's biochemical fingerprint is measured and translated into Raman spectral peaks that can then be further analyzed using multivariate analysis. Raman spectroscopy has been used for the characterization of different tissues and organs such as bone and bronchial or colorectal tissue.37–43 It has also been evaluated as a diagnostic tool for cancer monitoring,23,27,44,45 the screening of the molecular and structural composition of skin, and for identifying differences between pathologic and healthy skin structures.46–50 Raman spectroscopy has also been employed for the monitoring of the skin's reaction to contrast agents, nanoparticles, and toxic substances.51–53 Skin cells were analyzed by comparing different culture substrates,54,55 skin cell lines,36,56 and cell organelles. 57 Although TE skin has previously been studied by analyzing Raman spectra of excised and labeled skin and skin equivalents, 58 our report is the first to use Raman spectroscopy to noninvasively identify primary human skin cells solely based on their biochemical fingerprint without any processing (fixation, sectioning, or staining) or the use of any substances (contrast agents), as it is needed for routine technologies such as flow cytometry or immunochemical staining. In our study, specific Raman peaks and differences in Raman signal intensities identified biochemical differences between several skin cell types. We applied multivariate analysis to the spectral data, which helped to successfully discriminate between the studied skin cells. The distinction between primary fibroblasts and keratinocytes was based on peaks occurring at 870, 955, 1037, 1079, 1269, and 1665 cm−1, most of which had previously been described to detect lipids such as cholesterol, keratin, and collagens.21–28 The most significant difference was seen at the peak 955 cm−1. Singh et al. have identified that this peak can be assigned to cholesterol. 22 Interestingly, spectral analyses showed that the concentration of cholesterol is indeed higher in keratinocytes than in fibroblasts, which was found by studying the cholesterol synthesis of these two cell types by extracting lipids from cell fractions and the medium. 59 According to this study, keratinocytes synthesized 10-fold more cholesterol per mg cell protein than fibroblasts. 59 Schurer and colleagues reported that the overall higher lipid concentration seen in the epidermal skin layer populating keratinocytes is primarily due to the cells' generation of a permeability barrier composed of lipids, whereby dermal fibroblast, which are located in the dermis, have no functional need for lipid production. 60 These observations suggest that the significantly higher peak seen in our study in keratinocytes at 955 cm−1 might be due to a higher lipid content of these cells when compared to fibroblasts. However, it has been speculated before that this wavenumber region (955/956 cm−1) could also be assigned to keratin, studying bovine hooves using Raman spectroscopy. 24 Keratin is a fibrous structural protein that protects the skin from mechanical stress and contributes to the waterproof property of the outermost layer of the skin. 61 Since keratin is located in cells of the epidermis such as keratinocytes, one could speculate that the differences seen in our peak signal intensities could also be attributed to keratin. These results were also supported by immuncytological staining of these cell populations, which showed that cytokeratins are solely present in keratinocytes and not in fibroblasts.
Relevant peaks resulting from the measurements of fibroblasts are present at 870, 1037, 1269, and 1665 cm−1. Similar peaks were previously assigned to collagen by studying skin and breast tissue sections as well as purified collagen from bovine or rat-tail tendons with Raman spectroscopy.21,25–28 It has been further shown that Raman spectra of the dermal skin layer showed strong resemblance to such collagen spectra as the major part of the dry weight of the dermis consists of various collagens. 47 These data confirm our hypothesis that significantly higher Raman band intensities at 870, 1037, 1269, and 1665 cm−1 seen in dermal fibroblasts are due to the cells' capability for collagen synthesis (Supplementary Fig. S2), which is in strong contrast to keratinocytes. Due to this successful discrimination of keratinocytes and fibroblasts by Raman spectroscopy, we believe that potential fibroblastic contaminations of keratinocyte cultures could be detected noninvasively. Additionally, the sensitivity of this method, which describes the proportion to correctly identify a keratinocyte by its Raman spectrum, accounts for 97.3%. The specificity of this technology to correctly assign a spectrum of a contaminating fibroblast within a keratinocyte population is 77.1%.
In this study, we further showed that Raman spectra of skin cell types within their native environment in ex vivo skin could successfully be separated by a multivariate analysis. These results confirmed the applicability of this technique for the analysis of both cell suspensions as well native tissues. However, a key characteristic of the skin is the pigmentation, which is based on the pigment melanin that is responsible for the skin color and plays an essential role in defending the skin against harmful UV rays. 15 Melanin is synthesized and distributed by melanocytes and transferred to the associated population of keratinocytes. 62 Hence, a major difference between these two cell types that are both located in the epidermal layer is the potential to synthesize melanin. Here we found that the Raman spectra of melanocytes and keratinocytes differed in both the spectral baseline and in peaks present at 854, 932, 1003, and 1380 cm−1. Previous in vivo measurements of skin samples with different melanin contents have revealed positive correlations between the background height of Raman spectra and the pigmentation of cells. 63 In addition, Raman spectra of human skin as well as of natural and synthetic melanin are dominated by a peak at 1380 cm−1. 33 Protein backbone vibrations that were assigned to the peak at 932 cm−1 by studying human nails as well as the typical protein peak at 854 and 1003 cm−1 indicated higher protein concentrations in keratinocytes than in melanocytes.23,31,32 So far, we believe that the major difference in the obtained Raman spectra of melanocytes and keratinocytes is due to the pigment melanin, which is solely synthesized by melanocytes. However, we are currently investigating other possible protein targets that could be the cause of the different Raman spectra seen for keratinocytes and melanocytes. Besides the successful discrimination of melanocytes and keratinocytes within a score plot, the sensitivity of this technique to correctly classify a melanocyte spectrum (90.2%) as well as the specificity of this method to detect a keratinocyte within a melanocyte population (94.6%) supports these results, which lead us to the conclusion that Raman spectroscopy can be employed for the monitoring of the purity of skin cell populations. The presence of contaminating keratinocytes in the melanocyte cultures did not have an impact on the establishment of the training data set of the SVM as we could clearly distinguish these cells due to their morphology and pigmentation (Supplementary Fig. S3).
To test the possibility to noninvasively identify molecular, potentially pathological changes in keratinocytes, we employed Raman spectroscopy to discriminate between primary keratinocytes and an in vitro-modified keratinocyte cell line. No differences were seen in the Raman spectra intensity patterns of primary and in vitro-modified keratinocytes that are typically assigned to lipid structures (such as 1079 cm−1 and 1300 cm−1)—a phenomenon that was also seen before by analyzing the total lipid content in human primary keratinocytes and HaCaT cells by lipid extraction.21,25,64 In contrast, our experiments revealed that Raman spectra of these two cell types differed significantly in peaks assigned to proteins and nucleic acids at 727, 785, 1003, 1093, 1252, and 1660 cm−1. We observed that the Raman spectra intensities were significantly higher in HaCaT cells when compared to primary isolated (native) keratinocytes. By studying both cell types as well as DNA- and RNA-containing solutions using Raman spectroscopy, peak assignments to proteins and nucleic acids have been made.21,31,35,36 Taken these results into account, the detected biochemical differences seen in HaCaT cells versus primary keratinocytes are most likely based on different protein and nucleic acid contents due to an altered proliferation potential of the modified cells. The impact of the proliferative state of a cell on the biochemical fingerprint has been previously shown studying the Raman spectra from healthy and cervical cancer cells and from normal and transformed human breast epithelial cell lines.44,45 Interestingly, we could also show a 100% sensitivity of this technology to correctly discriminate an in vitro-modified cell from a primary cell. Moreover, the specificity for the analysis of the keratinocyte population is 86.5%. Significant differences were also observable in the Raman spectra taken from primary keratinocytes and HaCaT cells that were cultured within the epidermal layer of a skin model when plotted within a score plot. Thus, we could show that the noninvasive detection of modifications of primary cells during in vitro culture by Raman spectroscopy is possible.
Conclusions
This study demonstrates the feasibility to noninvasively separate cells in cell suspension, within ex vivo skin and in vitro skin models, based on their biochemical differences using Raman spectroscopy and multivariate analysis. We were able to discriminate between primary skin cell types, including fibroblasts, keratinocytes, and melanocytes without the need for further sample processing (e.g., fixation or antibody staining), making this technology a more suitable tool for cell and tissue state diagnosis in contrast to routine techniques such as flow cytometry and immunochemical staining. Differences between in vitro-modified cells and their corresponding primary cell type were clearly identifiable. This observation is especially important for the production of artificial skin and in vitro skin models, where both the biopsy and the transplant consist of several cell types. Thus, the purity and quality of the cell populations used for the production of TE skin could easily and noninvasively be determined and does not require cell-type-specific marker. In addition, the evaluation of these engineered products by using Raman spectroscopy allows a safer production process, as a frequent monitoring of cellular properties is possible. The overall goal for the integration of Raman spectroscopy as an analysis method for cellular samples is to determine several cell properties using one rapid and noninvasive measurement that could be incorporated into an up-scalable tissue engineering model. First studies are aiming currently on the development of Raman-spectroscopy-based systems for activated cell sorting. 65 Thus, Raman spectroscopy offers a high-throughput screening tool for the quality control of in vitro skin models for commercial and regenerative medicine approaches.
Footnotes
Acknowledgments
The authors would like to thank PD Dr. Thorsten Walles for providing the human tissue samples and Shannon Lee Layland for his helpful comments. The authors are grateful for the financial support from the Fraunhofer-Gesellschaft Internal Programs (Grant No. Attract 692263 [to K.S.-L.]).
Disclosure Statement
No competing financial interest exists.
References
Supplementary Material
Please find the following supplemental material available below.
For Open Access articles published under a Creative Commons License, all supplemental material carries the same license as the article it is associated with.
For non-Open Access articles published, all supplemental material carries a non-exclusive license, and permission requests for re-use of supplemental material or any part of supplemental material shall be sent directly to the copyright owner as specified in the copyright notice associated with the article.
