




Abstract
Cell seeding into scaffolds plays a crucial role in the development of efficient bone tissue engineering constructs. Hence, it becomes imperative to identify the key factors that quantitatively predict reproducible and efficient seeding protocols. In this study, the optimization of a cell seeding process was investigated using design of experiments (DOE) statistical methods. Five seeding factors (cell type, scaffold type, seeding volume, seeding density, and seeding time) were selected and investigated by means of two response parameters, critically related to the cell seeding process: cell seeding efficiency (CSE) and cell-specific viability (CSV). In addition, cell spatial distribution (CSD) was analyzed by Live/Dead staining assays. Analysis identified a number of statistically significant main factor effects and interactions. Among the five seeding factors, only seeding volume and seeding time significantly affected CSE and CSV. Also, cell and scaffold type were involved in the interactions with other seeding factors. Within the investigated ranges, optimal conditions in terms of CSV and CSD were obtained when seeding cells in a regular scaffold with an excess of medium. The results of this case study contribute to a better understanding and definition of optimal process parameters for cell seeding. A DOE strategy can identify and optimize critical process variables to reduce the variability and assists in determining which variables should be carefully controlled during good manufacturing practice production to enable a clinically relevant implant.
Introduction
To meet this need, many seeding techniques such as static, rotational, and perfusion seeding have been developed over the past three decades.4–7 Most of these methods are often lengthy and uncontrollable, which limits their clinical applicability. To date, the most common and widely used method is static seeding, in which a concentrated cell suspension is passively introduced into a scaffold. Many factors, including cell source, cell density, scaffold type, scaffold geometry, seeding time, and seeding vessel can affect the quality of the seeded construct.2,6–8 It has been shown that changes in the scaffold porosity significantly affect the cell seeding efficiency (CSE) of human mesenchymal stem cells (hMSCs) in 3D-engineered bone scaffolds. 9 In addition, seeding human umbilical cord cells at different cell densities does not seem to affect the initial seeding efficiency but analyses after culturing the cell-seeded scaffolds show that higher seeding densities result in an improved biosynthesis and differentiation of the cells. 10 Besides the individual effect that these factors exert on the seeding process, also their interactions play a major role in determining outcome parameters such as CSE. However, little is known about the relative influence of each factor. Therefore, the identification of key factors that quantitatively predict reproducible and efficient seeding protocols becomes imperative.
In traditional single-factor experimental designs, the effects of factors on process outcomes are often investigated by varying the process parameters one factor at a time (OFAT). This approach assumes that all single parameters are mutually independent of each other and fail to indentify interactions between the different factors involved. However, for most cell-based product manufacturing processes, it is common that many variables are interdependent and that significant interactions exist. 11 Fully optimizing a seeding process by OFAT experiments is therefore time consuming and requires a more high-end approach. To overcome this problem, more and more often statistical design of experiments (DOE) is used.12–14 Statistical DOE provides efficient procedures for planning multi-factor experiments in such a way that the data obtained can be analyzed to yield consistent and objective conclusions on the involvement of all investigated parameters.15,16 This quality by design (QbD) approach is a powerful tool that has been successfully applied in the optimization of developmental protocols for a broad range of scientific fields, including stem cell biology, biopharmaceutical manufacturing and in pharmaceutical studies to identify key therapeutic agents that could lead to the development of industrially relevant pharmaceutical products and has been proven to be reliable.17–24 Surprisingly, the use of DOE in tissue engineering research is still limited.
Developmental engineering can poise the metamorphosis of the still largely empirical tissue engineering domain into a rigorous discipline based on universally accepted engineering principles of QbD.25,26 Figure 1 shows the flow diagram of the methodology used to characterize and optimize the multi-factor-driven cell seeding into a 3D scaffold. We hypothesize that by applying DOE, critical process parameters of the cell seeding process could be identified as an initial step toward process control. In this study, we investigated the effect of two input factors (cell type and scaffold type) and three process factors (seeding volume, seeding density, and seeding time) on the response variables (CSE and cell-specific viability [CSV]) by systematically varying all factors within predefined ranges. Consequently, we have provided an in-depth analysis of the cell seeding process using customized quantification as well as guidelines for further process optimization showing the relevance of a QbD approach for skeletal tissue engineering processes.
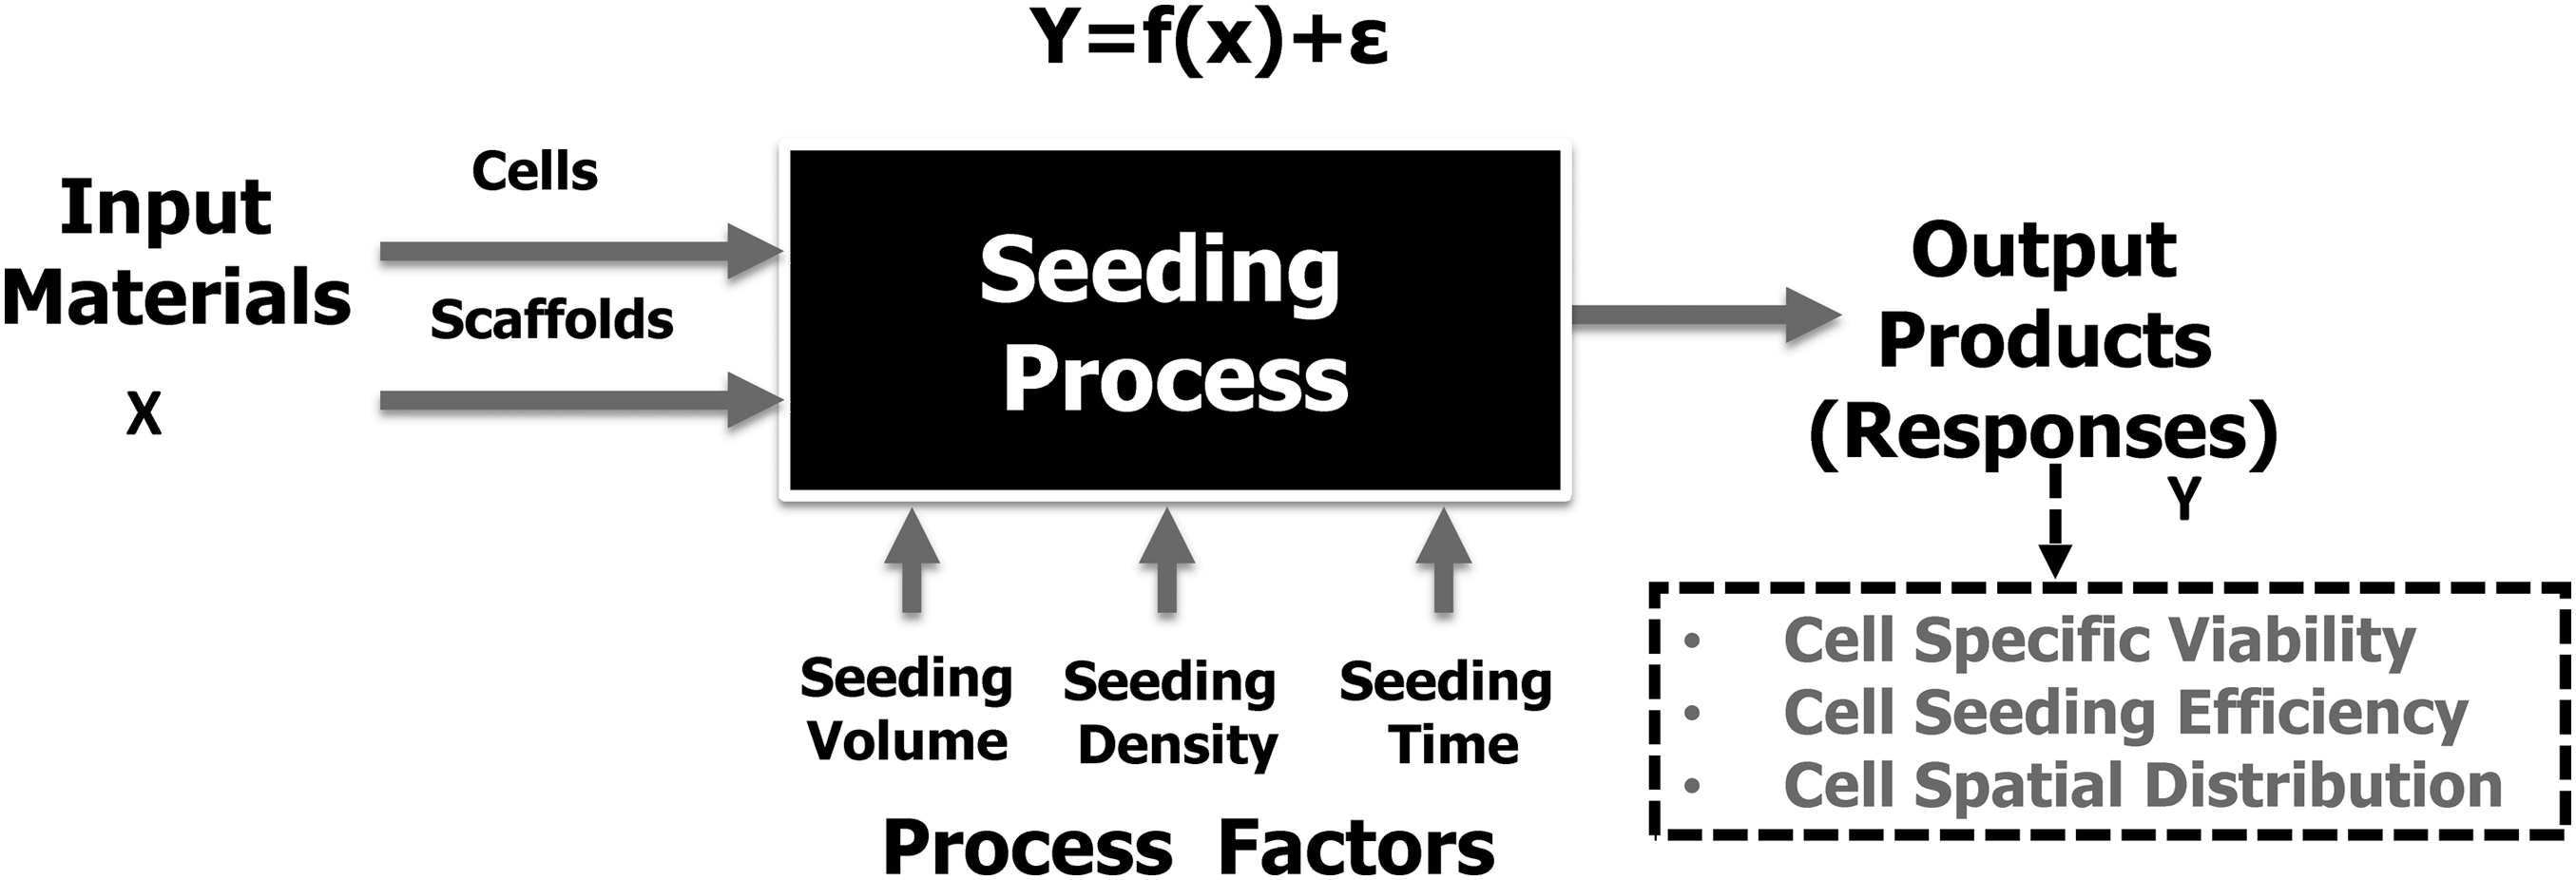
A schematic view of the experimental design for a typical cell seeding process.
Materials and Methods
Experimental design
Five seeding factors were investigated in this study: two category-type input factors (cell type and scaffold type) and three continuous-type process factors (seeding density, seeding volume, and seeding time). These factors were carefully selected based on their known effects
27
and previous own findings.
7
A factorial design
For each run, the level of each factor is indicated with a minus (−) or a plus (+) when the level is low or high, respectively.
Cells
Two cell types were used in this study: clinically relevant human periosteum-derived cells (hPDCs), being a heterogeneous population containing mature bone cells as well as osteoprogenitors, and a homogeneous population of mature osteoblasts derived solely from a well-characterized human osteosarcoma cell line (SaOS-2). Both cell types are able to form bone in vivo.28,29
hPDCs were isolated from periosteal biopsies of different donors as described previously.28,30 This procedure was approved by the ethics committee for Human Medical Research (Katholieke Universiteit Leuven) and with patient informed consent. hPDCs were expanded in Dulbecco's modified Eagle's medium with high-glucose (Invitrogen) containing 10% fetal bovine serum (BioWhittaker) and 1% antibiotic–antimycotic (100 units/mL penicillin, 100 mg/mL streptomycin, and 0.25 mg/mL amphotericin B; Invitrogen). hPDCs were passaged at 80%–90% confluency. At the time of experiment, cells from passage 4 to 6 were trypsinized with Tryple Express (Invitrogen) and seeded in the scaffolds.
SaOS-2 cells were chosen for their osteoblastic features. This well-characterized cell line has been shown to produce mineralized tissue in vivo and is frequently used to conduct performance studies in relation to bone tissue regeneration. 29 SaOS-2 cells were cultured and prepared in the same conditions as hPDCs (5% CO2, 95% humidity, and 37°C).
Scaffolds
Titanium scaffolds are widely investigated in bone tissue engineering applications because of their stability and biocompatibility. 31 Bio-inert cylindrical porous titanium scaffolds (Ø=6 mm, h=3 mm) with two distinct macrostructures were used: foamed titanium (FOAM) scaffolds with a random pore architecture and 3D fiber-deposited titanium (3DFD) scaffolds having a regular pore architecture.
All scaffolds were kindly provided by VITO. The FOAM scaffolds were produced by a gel casting technique with foaming agent. 7 The 3DFD scaffolds were produced by depositing consecutive layers with a 0°–90° orientation. After shaping, the scaffolds were dried at room temperature for 24 h, followed by a calcination step at 500°C and a sintering step at 1200°C for 2 h.
Their surface morphology was characterized by scanning electron microscope (see Fig. 2). To quantify their 3D morphology, microfocus computed tomography (μ-CT) was used: radiographic gray value images were taken every 0.5° with a Tomohawk (HOMX 161 X-ray system with AEA Tomohawk CT-upgrade; Philips X-ray). The images were reconstructed with CT-recon software (SkyScan N.V.) and binarized according to the procedure of Kerckhofs et al. 32 Quantitative macrostructural analyses of the pore size, strut size, and surface area were performed with the aid of the CT scan software (SkyScan N.V.). Table 2 shows parameters related to the architecture of both scaffold types. The foamed structures contained circular, but irregularly distributed pores with a pore size ranging between 100 and 800 μm. The 3DFD scaffolds contained struts with an average thickness of 350 μm and an average spacing of 220 μm in height and 900 μm in width. Both the FOAM and 3DFD Ti scaffolds had highly interconnected pores (100% interconnectivity) and a comparable porosity of 75% (76.3%±0.8% and 75.6%±1.7%, respectively). μ-CT analyses showed a slightly higher specific surface area (7.2±0.2 mm−1) for FOAM Ti scaffold compared to the 3DFD Ti scaffold (6.1±0.2 mm−1).
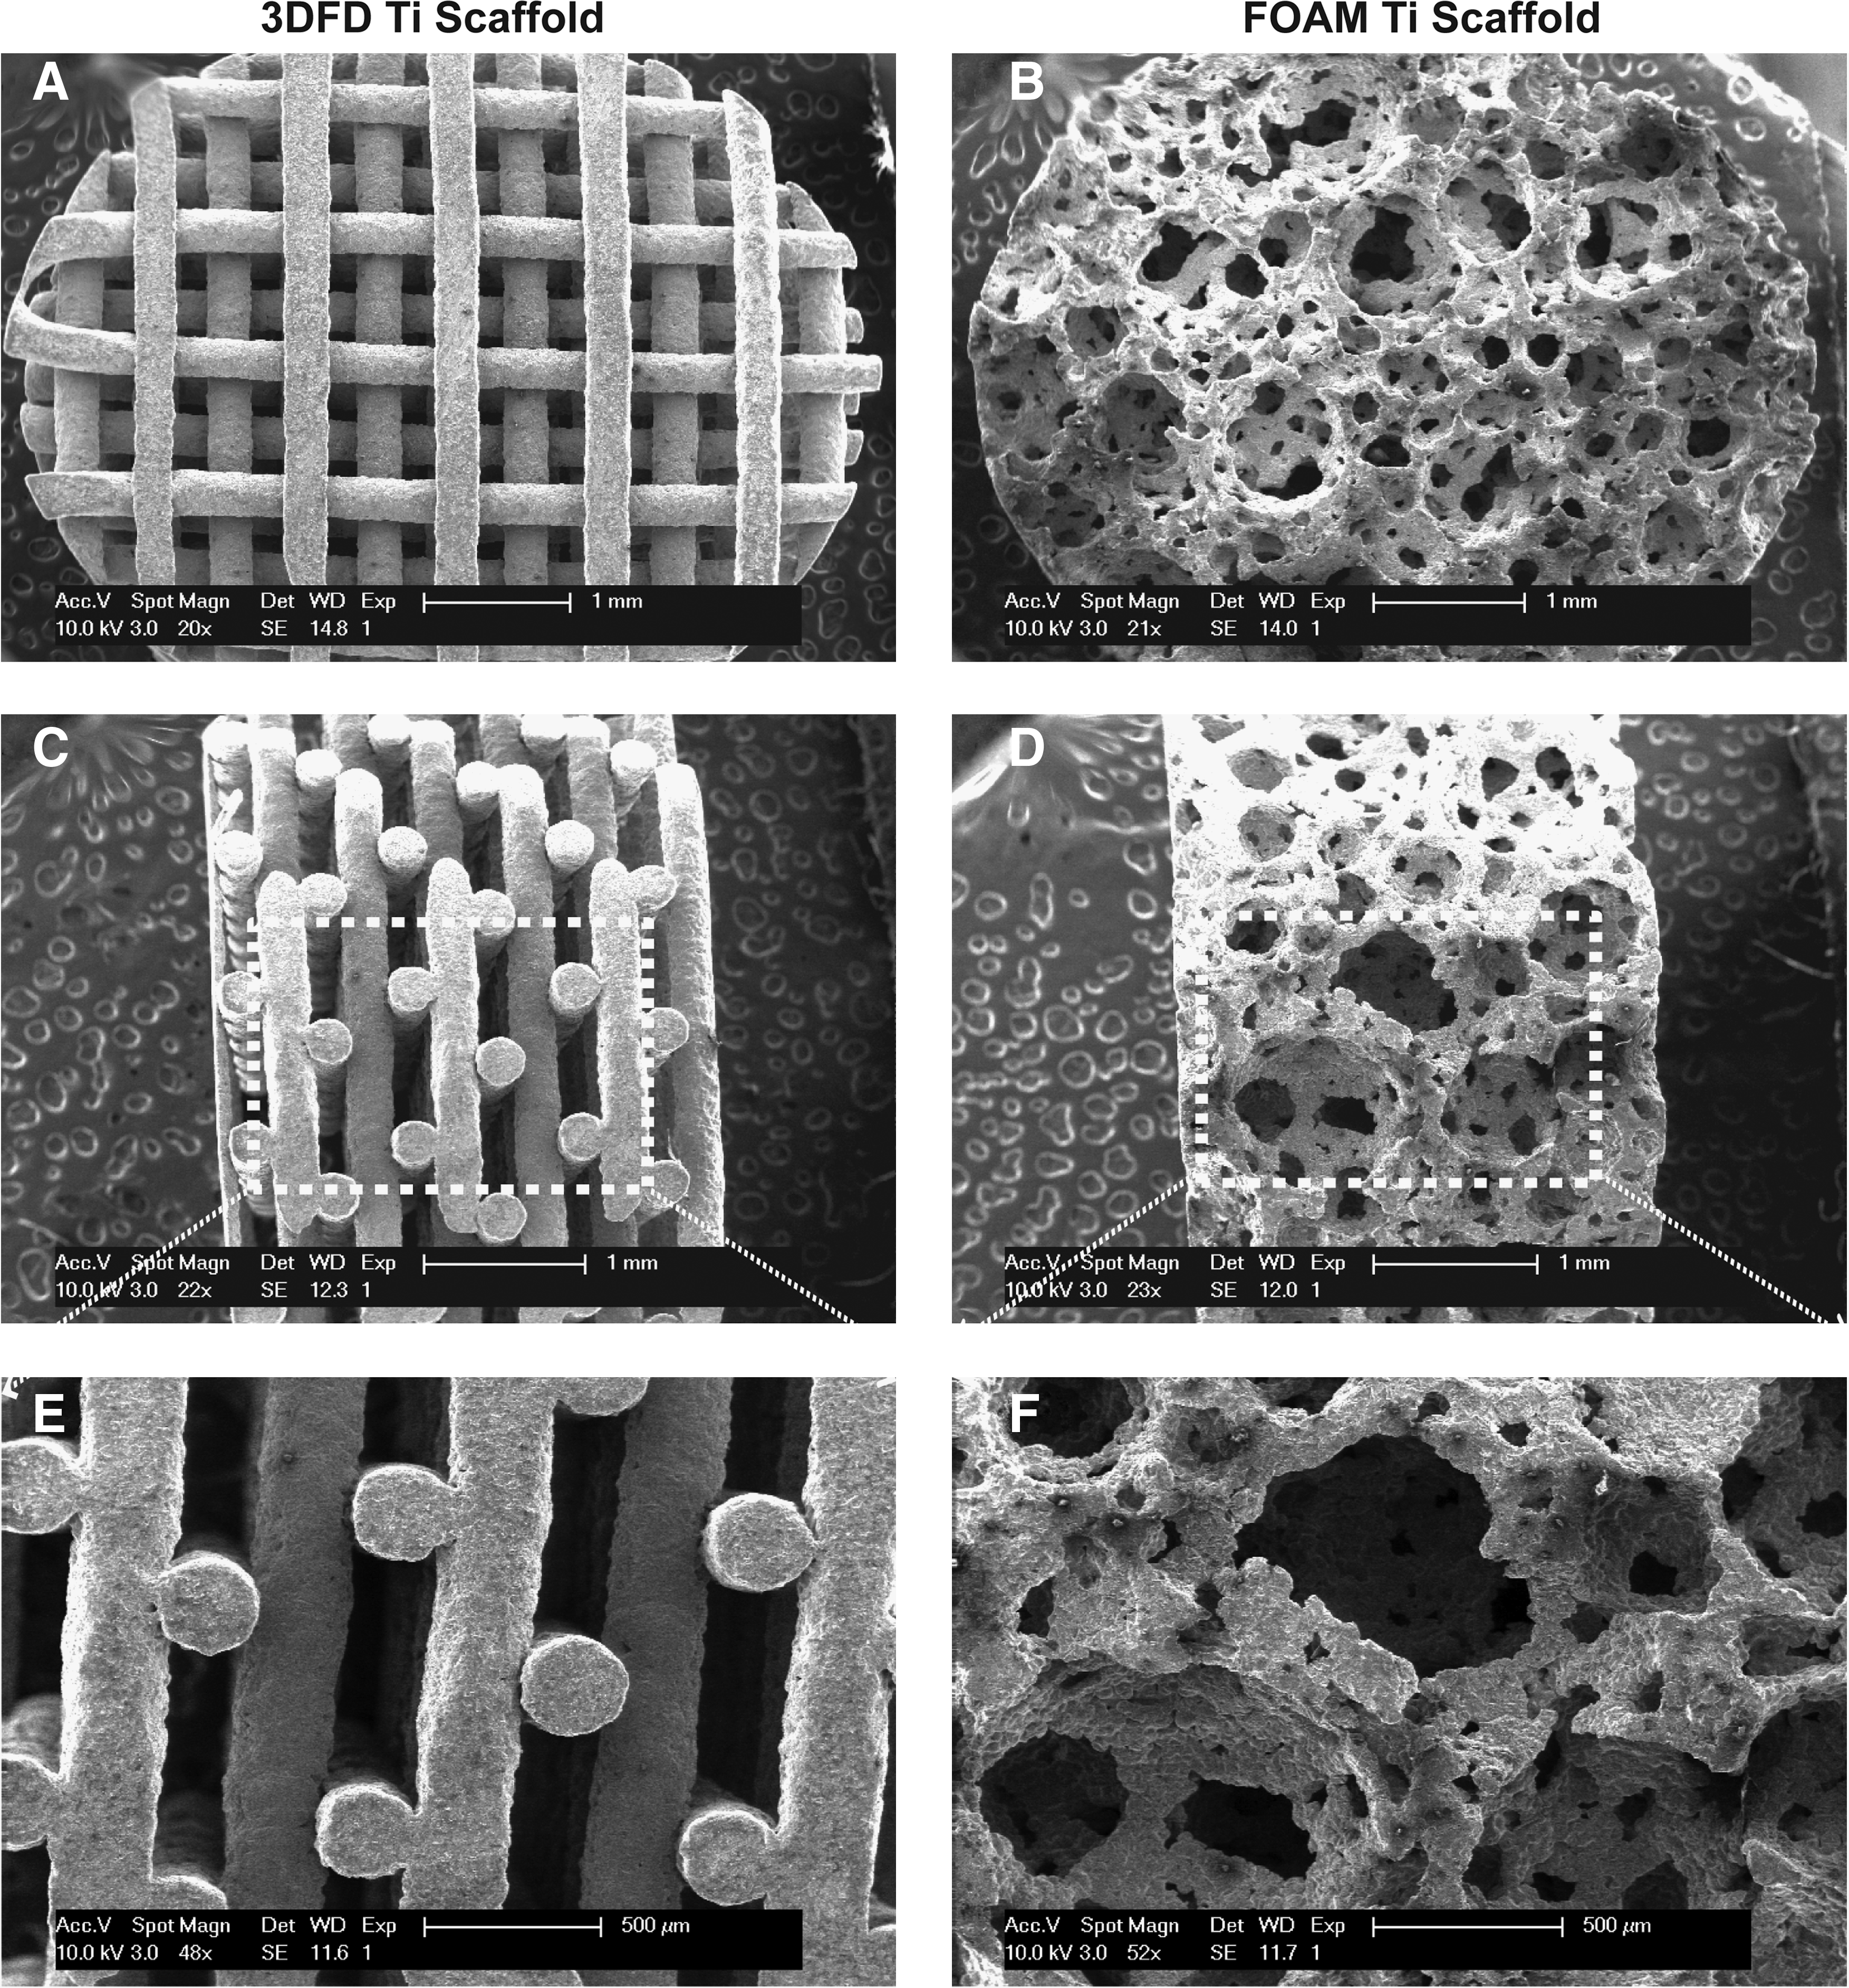
Scanning electron micrographs of the two Ti scaffold types are depicted. The side view
Due to the layered organizational structure, 3DFD scaffold z-direction pore size (∼220μm) and x–y plane pore size (∼900μm).
Cell seeding process
Before cell seeding, all scaffolds were sterilized by ethylene oxide gas and prewetted by vacuum impregnation with culture medium. The scaffolds were dried overnight and placed into 48-well tissue culture plates (Nalge Nunc). Each well was precoated with an agarose gel to prevent cells adhering onto the tissue culture plate. 60,000 or 1,200,000 cells were thereafter suspended in 30 or 90 μL of culture medium. These volumes correspond to, respectively, 50% or 150% of the available internal scaffold volume and are indicated as low and high level (see Table 2), and will be further referred to as the medium filling ratio (MFR). The cell suspensions containing different cell densities were slowly dropped onto the surface of the prewetted and subsequently dried scaffolds (3DFD and FOAM). The cells were incubated for 30 min or 4 h to allow cell attachment onto the scaffold (37°C, 5% CO2, and 95% relative humidity). Subsequently, the scaffolds were washed twice with prewarmed phosphate-buffered saline (PBS) and used for further measurements and analyses as described below. An overview of all experimental conditions is shown in Table 1.
Response measurements and data analysis
The response measurements are based on the metabolic activity, the cellularity, and the viability of the cells in the seeded scaffolds. In addition, the cell spatial distribution (CSD) was also evaluated for the seeding experiments using 3DFD scaffolds.
Cell metabolic activity
Cell metabolic activity was evaluated using a cell counting kit-8 (CCK-8) kit (Sigma), which uses the unique water-soluble tetrazolium salt-8 (WST-8) in measuring dehydrogenase activity. This assay allows a sensitive colorimetric determination of viable cell metabolic activity without interfering with the DNA measurement. In short, after 30 min or 4 h seeding time, the scaffold was rinsed gently with PBS to remove nonattached cells. Subsequently, the scaffold was transferred to another 48-well plate containing 400 μL complete culture medium (10% FBS, 1% Antibiotics) plus 40 μL CCK-8 kit per well and incubated on an orbital shaker in a 37°C incubator. WST-8 reduction was quantified by measuring the sample absorbance at 450 nm using a micro plate reader. An acellular control scaffold served as the negative control.
Cellularity
The cellularity of the scaffold in the presence of dsDNA was evaluated with a Quant-iTTM dsDNA HS Assay Kit (Invitrogen) according to the manufacturer's instructions. Briefly, after assessing the metabolic activity within a scaffold, the scaffolds were rinsed twice in pre-warmed PBS and placed in 350 μL lysis buffer (NucleoSpin®; BD). The scaffolds were stored in −85°C until the assay was performed. Each scaffold underwent three freeze–thaw cycles to lyse the cells. The supernatants were drawn off and measured with Quant-iTTM dsDNA HS assay kits. Fluorescent intensity was measured with a Qubit Fluorometer (Invitrogen). DNA quantities in the samples were obtained directly from the fluorometer by calibrating with the DNA standard sample. As shown in Supplementary Figure S1 (Supplementary Data are available online at
CSE and CSV
To systematically investigate the influence of the five seeding factors on the cell seeding process, two critical quality attribute (CQA) parameters were calculated: CSE and CSV.
As an important indicator of the seeding process, CSE was defined as the percentage of initially seeded cells that attached to the scaffold. Multiple methods for quantifying CSE are currently available.
6
This diversity makes it hard to compare different cell-seeding techniques, whereas a unified method within the field of tissue engineering could create a standardized solution. Previously, we evaluated four different calculation methods and confirmed that the direct DNA quantification assay is the most reliable and accurate evaluation method.
7
CSE is best defined as Eq. (1):
CSV is calculated from the metabolic activity and the cellularity measurements by DNA content in the same cell-seeded scaffolds. The WST-8 absorption values were normalized to the DNA data in the same scaffold to get cell viability per cell, as shown in Eq. (2):
Cell spatial distribution
To quantify how uniformly viable cells were distributed along the seeding direction in 3DFD scaffolds, we adapted the cell distribution quantification method used by Bueno et al. 27 with the aid of Live/Dead staining morphology characterization and image analysis.
First, the seeded scaffold was stained using the Live/Dead® viability kit (Molecular Probes, Invitrogen) according to the manufacturer's instructions. The cell-seeded scaffolds were washed with PBS and then incubated with a fluorescent dye solution containing both calcein-AM and Ethidium-Homodimer-2 for 30 min. Excessive dye was removed by rinsing with PBS. The seeded scaffold was transferred to a new 35 mm dish containing 2 mL PBS to keep the scaffold immersed in PBS during microscopic observation. Living and dead cells were examined using a Zeiss Fluorescence Stereo-Microscope. Living cells were stained green by calcein AM and dead cells red by ethidium homodimer-2. Microscopy images were acquired (with n=3 scaffolds per seeding method) at low magnification with a 1.6×objective, corresponding to 100% of the total scaffold seeding section.
The viable CSD within 3DFD scaffolds was then quantified by using NIH ImageJ software (ImageJ; National Institutes of Health) based on the images taken after Live/Dead staining. This imaging and quantification approach could not be applied for the FOAM scaffolds. Due to their irregular internal architecture and hence limited line of sight, it was not possible to image and quantify the attached cells on all internal surfaces throughout the scaffold; only a qualitative viability assessment could be performed. First, five equal regions of interest (ROI) were created along the depth (drop seeding direction) as follows: top layer, top-middle layer, middle layer, bottom-middle, and bottom layer, and then the percentage of green area against the black within each ROI was considered as viable cell density. For comparison, the cell distribution index (CDI) was normalized by dividing the viable cell density in each ROI by the viable cell density in the whole scaffold seeding section.
Statistical analysis
The two CQA responses, CSE and CSV results, were analyzed with statistical software (Minitab). Because several factors are involved, multivariate analysis of variance was used to test the significance of each term in the equation and the goodness of fit of the regression model. The statistical significance level was set at p<0.05 in all cases. Diagnostics were performed to verify the model assumptions (normality and homoscedasticity) and to detect outliers. When warranted, transformation of the response was used. All values are reported as mean±standard deviation. General linear model parameter estimation was performed by least squares estimation. The main effects and the two-factor interactions are included in the statistical model given in Eq. (3)
where Y is the predicted response, β is the parameter estimate, X is the coded value of the factor levels, and ɛ is the residual error. Statistical models were accepted when there was no lack of fit, no correlation in the residual plots, and the residuals were normally distributed.
Results
Statistical analysis of cell seeding process response
Cell seeding efficiency
Figure 3A shows the statistical analysis of CSE in a stacked bar graph. The labels on the x-axis correspond to the defined 16 seeding conditions as listed in Table 1. Experimental runs 9 and 11 have the highest CSE (89.4%±14.0% and 94.2%±3.7%, respectively). In both conditions hPDCs were seeded using 50% MFR and incubated for 4 h. SaOS-2 cells with 150% MFR resulted in the lowest CSE in runs 8 and 16 (12.4%±3.9% and 16.7%±1.9%, respectively). In contrast to its effect on hPDCs, increasing the seeding time from 30 min to 4 h did not result in a significant improvement at 150% MFR for the SaOS-2 cells.

Statistical analysis response of the CSE.
To study the effects of the five selected seeding factors on CSE, we applied statistical analysis using Minitab software to detect the factor and interaction effects, which are most important to the process or to the design optimization. The normal plot of the standardized effects in Figure 3B shows that CSE was significantly affected by cell type (factor C), seeding volume (factor A), seeding time (factor D), and interactions CD, AE and AB with factor B, indicating the seeding density and factor E the scaffold (p<0.05). The main effect plots (Fig. 3C) confirmed that cell type (factor C) and seeding volume (factor A) had a strong negative effect on CSE, whereas seeding time (factor D) had the most significant positive effect.
Three two-factor interactions plots are shown in Figure 3D. The CD interaction (cell type and seeding time) shows that CSE increased with seeding time for both cell types, with the seeding time having a much more profound positive effect on hPDCs than on SaOS-2 cells. For the AE (seeding volume and scaffold type) interaction, a negative CSE interaction was shown with the regular Ti scaffold having a much smaller effect than the irregular one when the seeding volume increased from 50% to 150% MFR. Surprisingly, the seeding density (factor B) did not contribute to CSE, and it was only present in one interaction with a limited impact. This third significant interaction term between the seeding volume and seeding density (AB) showed that an increase in seeding volume (from 50% to 150% MFR) resulted in a larger decrease in CSE in the case of higher seeding density compared to lower density. This indicated that the variability of CSE is lower for higher cell seeding density conditions.
Cell-specific viability
CSV is one of the most important variables besides CSE, and the ability to control CSV is crucial for the quality of a cell–scaffold construct. Figure 4A quantitatively shows the CSV normalized to the DNA content for each run (n=3, the average and standard deviation are depicted). No significant differences were found. Subsequently, the effect of several seeding parameters as well as the effect of their interactions was investigated. The normal plots (Fig. 4B) show that the most significant of the investigated process parameters for CSV was seeding density (factor B), followed by seeding volume (factor A) and seeding time (factor D). The interactions AE and CD were the ones that affected CSV the most.
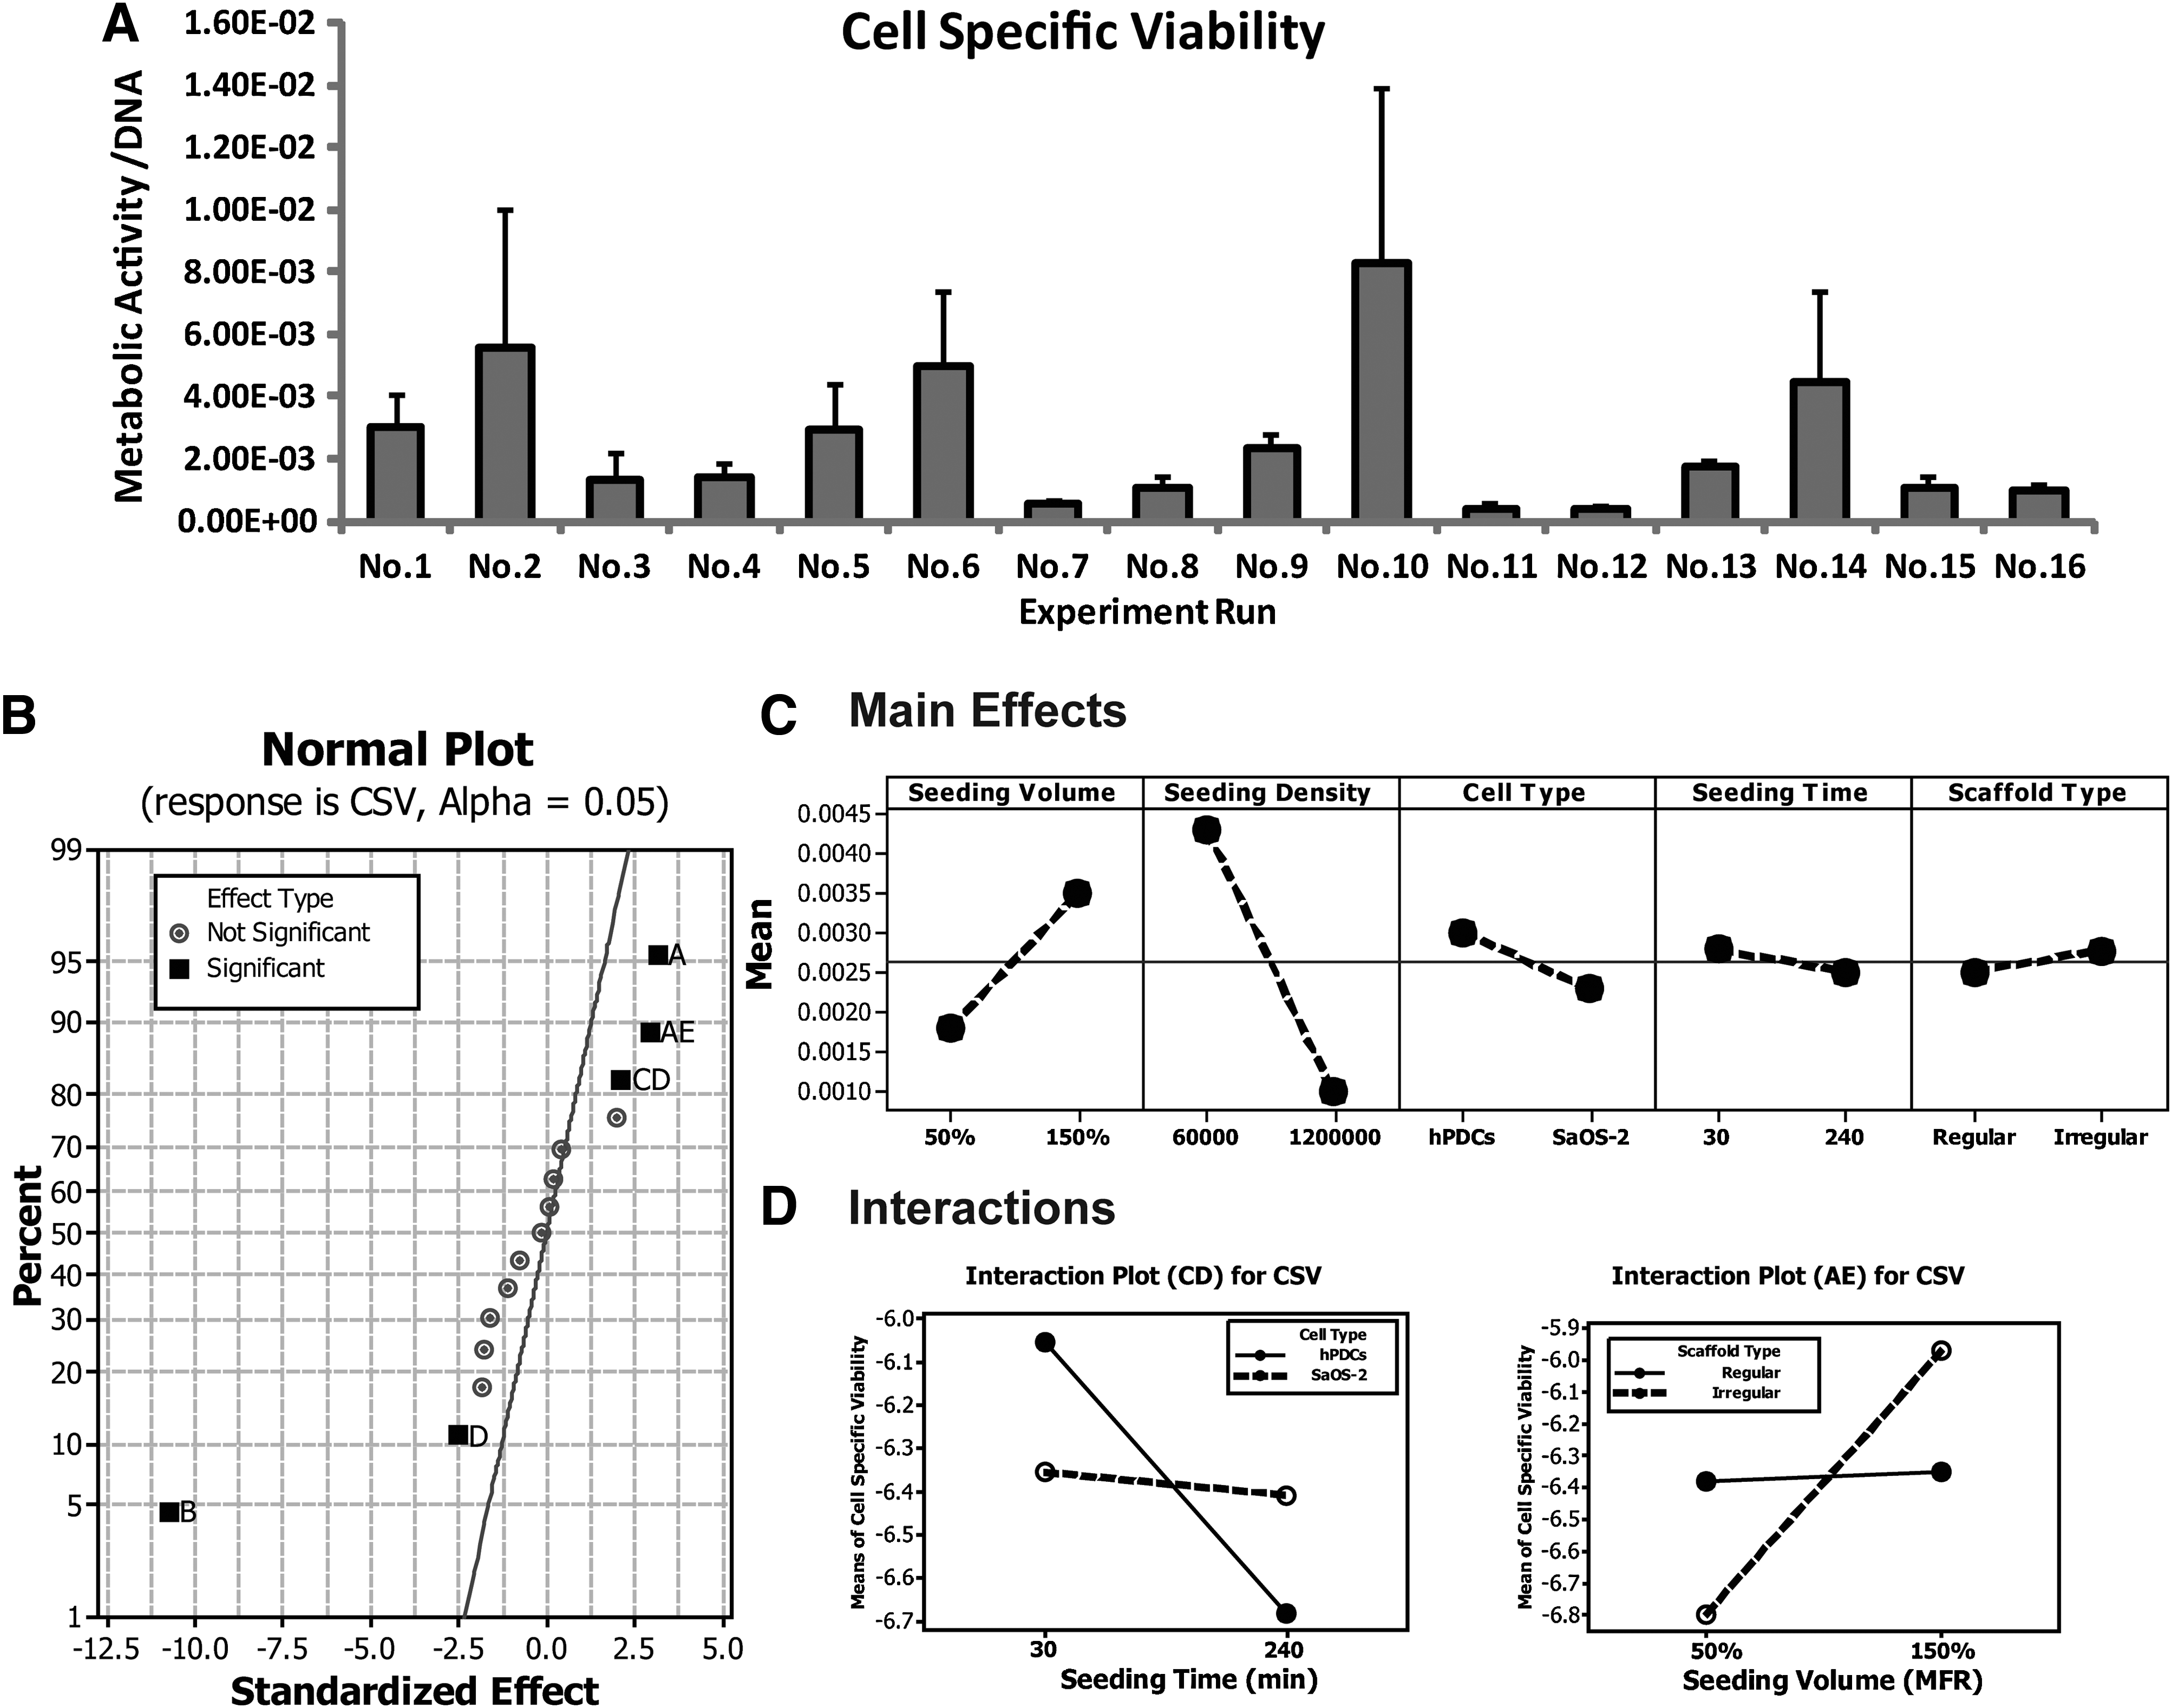
A statistical analysis of the CSV.
The main factor plot (Fig. 4C) showed a different trend for CSV compared to CSE. The seeding volume (factor A) had a positive effect on CSV, as a larger seeding volume greatly increased CSV, whereas the other two significant main effect factors, seeding density (factor B) and seeding time (factor D), had a negative effect on CSV. Although the two category factors, namely, cell type (factor C) and scaffold type (factor E), had a rather small effect on CSV, both were involved in two significant two-factor interactions: AE (seeding volume and scaffold type) and CD (cell type and seeding time) (Fig. 4D). An increase in seeding time for hPDCs resulted in a much lower CSV compared to no/or smaller effects for SaOS-2 cells. Also, an increase in seeding volume caused a more profound CSV increase for irregular scaffolds than for regular scaffolds.
Results from the factorial DOE-based experiments indicated that among the three continuous type seeding factors, seeding volume (factor A) and seeding time (factor D) significantly affected the CSE and CSV. Surprisingly, the scaffold type (factor E) was not identified as a critical factor for the chosen value range, but the interaction with seeding volume (factor A) influenced both CSE and CSV.
Cell spatial distribution
Besides higher CSE and CSV, also a homogeneous or controlled viable cell distribution throughout a scaffold is important to guarantee a successful tissue construct. We therefore performed an in-depth cell distribution analysis of the two significant effect factors that were identified from the above DOE approach: seeding volume (factor A) and seeding time (factor D) by using the same cell seeding density. Their effects were investigated on 3DFD Ti scaffold seeded with the more clinically relevant hPDCs.
Figure 5 shows a top and side view of a regular scaffold for two seeding conditions (50% and 150% MFR, respectively). Living cells are depicted as green fluorescent dots on the background of the scaffold material. As shown in Figure 5A, cells seeded with a lower MFR (50%) have a more cell aggregate-like distribution inside of the scaffold, whereas a more homogenous cell distribution was found for the 150% MFR group.

Analysis of the cell distribution by fluorescence stereomicroscopy of cell–3DFD scaffold constructs stained with calcein AM and ethidium EthD-1;
Along the drop seeding direction, a qualitative view of the distribution was provided by comparing the different areas of the samples. The images of a 50% MFR-seeded scaffold suggest a more heterogeneous distribution, as most of the cells aggregated in the middle-bottom part of the scaffold (CDI were 0.6, 1.9, 2.1, 0.8, and 0.2 for ROIs from top to bottom). In contrast, there is a more homogenous distribution in 150% MFR-seeded scaffolds, in which CDI is comparable in the five ROIs from top to bottom (0.8, 1.0, 1.3, 2.2, and 0.9, respectively). This finding shows that by increasing the cell seeding volume (factor A), a more uniform cell distribution can be achieved.
Discussion
In this study, the optimization of the cell seeding process was investigated using a DOE statistical method to determine the process parameters that maximize CSE and CSV, and that improve CSD in scaffolds with different architectures. The main findings of this study were (1) among the three continuous type seeding factors, seeding volume and seeding time significantly affected CSE and CSV, (2) cell type and scaffold type were both involved in the interactions with other seeding factors, and (3) cell seeding in a 3DFD scaffold using a high MFR improved CSD and CSV.
A major observation in our study was the strong dependency of the CSE on the cell type: hPDC or SaOS-2 cells. With the primary cell type (hPDCs) we obtained a higher CSE compared to the SaOS-2 differentiated cell line. Zhao and Ma confirmed the influence of the cell type on CSE. 33 In their study CSE obtained with human mononuclear cells (hMNCs) was about 8.05% lower (p<0.05) than that obtained for hMSCs, seeded under the same conditions. 33 They postulated that the difference in CSE between hMNCs and hMSCs was due to a difference in cell adhesion properties. This cell type-dependent difference warned us to be careful when comparing published results from different research labs. The choice of the cell type has an enormous influence on the assessment of CSE due to differences in cell behavior. Cells from a stable osteosarcoma cell line (SaOS-2) offer the advantages of being well characterized, and ease the comparison with other studies. Furthermore, their immortality allows almost unlimited passages and thus enables high flexibility for assay planning. Studies with primary cell types (such as hPDCs), although offering more clinically relevant cell populations, are subjected to the variability and singularities of primary cells, including the heterogeneity of the cells.
Besides the choice of cell source, the scaffold choice is also important for the in vivo performance of cell–scaffold constructs in skeletal tissue engineering. 34 We chose titanium (Ti) and its alloys as case study scaffold, because Ti can be manufactured into a porous architecture and it has been tested and accepted as a suitable metal for use in humans in orthopedic surgery.5,35 Research showed that the internal architecture of porous implants determines the mechanical properties of the implants and controls tissue regeneration. 36 In our study, the two scaffold types were manufactured as such that a similar porosity and surface area were obtained, in order to assess solely the effect of pore architecture (regular vs. irregular) on cell seeding process. The cellular evaluation has shown that there was no significant difference in CSE and CSV between the two selected scaffold geometries, but a smaller standard deviation was found for the regular 3DFD scaffold conditions. This finding was confirmed by the study of Jukes et al. 37 as they showed that seeding in 3DFD poly(ethylene oxide terephthalate) and poly(butylene terephthalate) copolymers scaffolds led to a more homogenous distribution compared to seeding in a compression-molded scaffold. In the study of Buckley and O'Kelly, 38 no statistical difference in cell number was found between the two scaffold groups with a bimodal or trimodal architecture after static seeding with MC3T2-E1 osteoblastic cells. Meanwhile a superior homogeneous cell distribution was found throughout the entire scaffold when seeding a regular trimodal scaffold having unidirectional channels compared to a bimodal scaffold.
It is reasonable to accept that the pores of a 3DFD scaffold are more regular, homogeneous, and more accessible for the cell suspension during drop seeding when compared to a FOAM scaffold. The latter might result in cell aggregate entrapment in some of the small internal pores (see Fig. 2). Due to the tortuous pore structure of the FOAM scaffold, the smaller pores could be blocked with cells when using a smaller seeding volume, and could prevent or limit medium outflow of the scaffold when increasing MFR. Further, the 3DFD scaffold geometry can be easily adjusted, allowing the creation of external mesh structures with highly defined, patient-specific external structures, and controlled internal structural characteristics. The residual analysis of CSE (Supplementary Fig. S2) also showed a difference in the variability between the different cell and scaffold types used. Indeed, hPDCs, being a stem cell-like heterogeneous cell population, have a higher variability than SaOS-2 cells, being a homogeneous cell line. Likewise, the 3DFD regular Ti scaffold has a small variability compared to the foam-like irregular Ti scaffold. This shows that by choosing a more homogenous cell population and a more regular scaffold, one starts with a smaller variability and thus can keep the standard deviation further on in the process better under control and more likely small enough to eventually see differences in biological outcome. Hence, it seems an attractive option to use controllable and reproducible scaffold architectures in the field of skeletal tissue engineering.
In relation to the three continuous seeding process factors: seeding volume, seeding density, and seeding time, the results of the present study are supported by other studies.38–40 We have already shown that the cell density did not significantly affect CSE, whereas the volume of seeding medium-to-free scaffold volume ratio (MFR) and the seeding time did. 7 Similar findings were obtained by Zhou et al. 39 They applied cell densities of 2500, 5000, 10,000, 20,000, and 400,000 cells/μL and did not find a significant influence on CSE. Buckley and O'Kelly 38 also reported a trimodal scaffold seeding volume dependency, resulting in an inverse relationship in the seeding efficiency: CSE was maximal (85.4%±4.9%, n=4) when using 25 μL and decreased to 67.7%±2.2% when using 50 μL and to 43.8%±3.2% when using 100 μL. The positive effect of the seeding time on CSE was also in accordance to published data,38,40 as Buckley and O'Kelly obtained a minimum of 46.6% at 5 min and increased to 75.5% up to 60 min.
We demonstrated that factorial design DOE can serve as a basis for determining the conditions that best suit a particular cell seeding application when compared with the currently used OFAT approaches. Optimization of the cell seeding process has been extensively studied by using various strategies with different types of cells and scaffolds. However, most of these investigations are geared toward a specific application and cannot be straight-forwardly extrapolated to other tissue engineering scenarios. Comparison of data between different specimen groups is problematic or even impossible because many of the variables such as scaffold and cell type that are presently used for direct comparison should be treated with great caution. For example, scaffolds differ in chemical properties (polymer, ceramic, or metallic)41,42 and 3D geometry (porosity, permeability, and surface area). Vunjak Novakovic et al. 43 obtained essentially a 100% CSE in fibrous polyglycolic acid scaffolds, but were less successful when using sponge-like scaffolds. Most studies also differ in their choice of cell type, as some use stem cells37,44,45 to examine the interaction between cells and materials, whereas others use generally known cell lines.46,47 Furthermore, the species used (human, rat, mouse, etc.) differ in the literature. All these differences make a direct comparison of assays and data between the various studies difficult and even impossible. Thus, we are not surprised to see the huge variability of CSE from below 10% to 80%–90% in the literature.4,39
DOE approach is an efficient method for evaluating the effects of process parameters on response variables. This method was originally developed in agriculture-related research and was successfully adapted to industrial applications and other sciences.48–51 The Food and Drug Administration Good Manufacturing Practices regulation and International Organization for Standardization 9000 now require its confirmation for process validation since it provides the possibility of obtaining maximal information from a minimal number of experiments. To our knowledge, this type of multi-factorial analysis on the 3D scaffold seeding in skeletal tissue engineering has only been rarely reported in the literature. Radisic et al. 40 succeeded in applying a systematic seeding study with C2C12 mouse myoblast cells by a randomized factorial experimental design with three factors: seeding time, seeding number and seeding setup with CSV, metabolic activity, and CSE as the response parameters. The method, however, has not been applied for quality control in skeletal tissue engineering. Using a DOE strategy to explain the complex seeding process can help to determine critical process variables, as well as optimizing these factors in order to reduce the variability, and assist in determining which seeding process variables should be carefully controlled during future good manufacturing practice manufacturing to meet regulatory requirements. Tissue engineering is undergoing a major conceptual and methodological transformation in an effort to implement in vitro processes that mimic in vivo tissue development. We believe that multi-factorial DOE will be an excellent tool for optimizing such sequential processes and help to achieve the goal of consistent tissue-engineered products.
Finally, we are aware that the DOE approach used in this study was designed to screen five important factors that influence the seeding process, all exerting various effects on the different response variables (CSE and CSV); hence, trade-offs between individual optima were made. To obtain a higher CSE while keeping a relative higher CSV, a response surface methodology (RSM) design can be used to further optimize the remaining key cell seeding process factors. The strategy of first screening for important factors and interactions, followed by their optimization using RSM is of interest when optimizing global and individual tissue engineering process steps.
In conclusion, as seeding cells into a scaffold is a critical step in a tissue engineering process, DOE is proposed as an extremely important tool for tissue engineers and biochemists who are interested in selecting specific cell–scaffold combinations and/or improving the performance of this process step. Applying DOE for specific cell–scaffold combinations of this study showed that an increase in seeding time had a positive effect on CSE, whereas increasing cell seeding medium volume caused a significant CSE decrease for both hPDCs and SaOS-2 cells. Primary cells (hPDCs) resulted in a higher CSE compared to an osteosarcoma cell line (SaOS-2). It was also shown that for the interaction between cell type and seeding time, the seeding time had a more beneficial effect on CSE of hPDCs than of SaOS-2 cells. CSE was also greatly influenced by other interactions, in which an increase in medium volume caused an increased reduction in CSE at lower cell densities compared to a minor effect at high densities. Also, the irregular scaffolds were more sensitive to medium volume changes than the regular ones. Together, these results indicate that the use of a homogeneous cell population along with a regular scaffold may lead to a more robust seeding process and subsequently a better starting point for a tissue engineering manufacturing process.
Footnotes
Acknowledgments
The authors are grateful to Carla Geeroms, Isabelle de Wit, and Kathleen Bosmans for excellent technical assistance. This work is part of Prometheus, the Leuven Research & Development Division of Skeletal Tissue Engineering of the Katholieke Universiteit Leuven:
Disclosure Statement
No competing financial interests exist.
References
Supplementary Material
Please find the following supplemental material available below.
For Open Access articles published under a Creative Commons License, all supplemental material carries the same license as the article it is associated with.
For non-Open Access articles published, all supplemental material carries a non-exclusive license, and permission requests for re-use of supplemental material or any part of supplemental material shall be sent directly to the copyright owner as specified in the copyright notice associated with the article.
