




Abstract
The use of seeded scaffolds in regenerative medicine is limited by the low survival of transplanted mesenchymal stem cells (MSC). Current approaches aim at improving cell viability but require an adequate long-term detection of the transplanted cells. Unfortunately, commonly performed labeling techniques have not been validated for this purpose, and studies often reveal inconclusive results. Consequently, we intended to identify the most suitable method for long-term detection of human MSC (hMSC) in vitro and in vivo. hMSC were labeled using the vital stainings PKH26 and carboxyfluorescein diacetate succinimidyl ester (CFDA-SE) as well as enhanced green fluorescent protein (eGFP) transduction. Metabolic activity and relative fluorescence intensity (RFI) were quantified in vitro over 21 days at 8 time points using standardized semi-automated microscopy and flow cytometry. In vivo, cell seeded scaffolds were subcutaneously implanted in nude mice, and RFI was analyzed over 42 days at 5 time points. In vitro, PKH26 and CFDA-SE significantly reduced metabolic activity. RFI of both stainings significantly decreased after 1 day and further faded to <1% after 7 days. In contrast, labeling with eGFP showed no metabolic effect on hMSC, and no significant reduction of RFI over the total period of 21 days. In vivo, RFI of eGFP labeled cells reached a plateau phase after 21 days and displayed a 3.8-fold higher RFI compared with PKH26 and CFDA-SE on day 42 evaluated in 280 field of views per scaffold using three scaffolds for each labeling technique and time point. We conclude that PKH26 and CFDA-SE are unsuitable for long-term detection of hMSC. eGFP transduction, in turn, allows long-term detection of hMSC in vitro and in vivo. Our results suggest that eGFP is currently the best option among the fluorescent labeling techniques to follow the fate of transplanted hMSC.
Introduction
However, scaffold-based bone regeneration did not yet meet the great expectations that had been excited. Recent studies indicated that most of the transplanted cells die after being introduced into the host organism due to a lack of oxygen and nutrient supply limiting the success.4–8 Consequently, future strategies will have to promote cell survival of the transplanted cells. To evaluate these new strategies, it is the prerequisite to closely follow the fate of transplanted cells on a single-cell level using standardized tools. To date, however, no reliable method has been validated to detect human MSC (hMSC) after implantation in vivo in a long-term experiment.
Multiple different approaches for cell tracking have been described, including X-ray-based methods, single photon emission computed tomography (SPECT), positron emission tomography (PET), magnetic resonance imaging (MRI), or optical imaging.9–11 SPECT-, PET-, and MRI-based tools allow following the cells' distribution within a living organism, but are limited to centers that are in possession of the necessary devices, are extremely time consuming, costly, and do not allow cell detection on a single-cell level. Immunohistochemistry enables the differentiation between cells of different species; however, this method is time consuming, elaborate, and error prone. 12
Fluorescence microscopy is an alternative method that is readily available in many laboratories. 13 This technique requires labeling of cells before transplantation. Commonly used are vital stains such as PKH26 or carboxyfluorescein diacetate succinimidyl ester (CFDA-SE)13–18 and genetic labeling techniques such as overexpression of fluorescent proteins. 13 To label cells with enhanced green fluorescent protein (eGFP), its gene has to be introduced into the target cell's genome. Vital stainings are easy to apply and economical. However, they fade over time due to cell division.14,19,20 Therefore, they have been used to assess the number of cell divisions21,22 or the population doubling time.23,24 Furthermore, CFDA-SE has been shown to be detectable not only in vital cells, but also in apoptotic and necrotic cells. 25 Nevertheless, vital stainings are regularly used for in vivo cell detection of vital cells.7,17,26–31 Moreover, the studies analyzed the fate of labeled cells in vivo by manual evaluation.7,17,26 This concept is time consuming, prone to inter- and intra-observer-variability, and minor changes in fluorescence intensity cannot be detected. 32 Despite being used for in vivo experiments, these labeling methods have not yet been validated for their applicability to identify hMSC after transplantation within a living organism over a long period of time. 17
We have previously shown that semi-automated optical imaging of fluorescence labeled cells utilizing a customized algorithm allows a cost-effective and standardized evaluation of a large number of samples on a single-cell level. 33 Based on this technique, we aimed at objectively comparing two commonly used vital stains, the membrane staining PKH26, and the cytosolic staining CFDA-SE to eGFP transduction of hMSC regarding their usefulness for long-term detection of hMSC in vitro and in vivo.
Materials and Methods
Cells and cell culture
We performed our experiments using two different immortalized clonal expanded hMSC cell lines, one overexpressing human telomerase reverse transcriptase (hTERT), named SCP-1 (passage 71-74), and one overexpressing hTERT along with eGFP transduction in passage 37, named SCP-1 eGFP (passages 90–95), 34 both of which display a population doubling time of approximately 26 h. Details on cell lines have been published elsewhere. 35 Cells were cultured using minimum essential medium Alpha GlutaMAX™ culture media (Invitrogen) supplemented with 10% FBS (Sigma-Aldrich) and 40 IU/mL penicillin/streptomycin (PAA Laboratories GmbH) in a humidified incubator at 5% CO2 and 37°C in a T-75 flask (NUNC). Medium was changed every 3 days. A confluency of 50% was never exceeded to prevent differentiation. 36 For trypsinisation, cultures were washed twice with phosphate-buffered saline (PBS) and trypsinized using 0.5 g/L Trypsin with 0.2 g/L EDTA-Na dissolved in PBS (Gibco).
Two-dimensional in vitro experiments
For two-dimensional experiments cells, were trypsinized and stained as indicated below 24 h before image acquisition. Stained cells were seeded in T-25 flasks (NUNC) at a density of 1000 cells/cm2 and directly before image acquisition, medium was replaced by PBS containing Ca2+ and Mg2+ (Gibco) to reduce background fluorescence of the media. The remaining cells where seeded in T-75 flasks and kept in culture as a stock for the following time points. For in vitro experiments, fluorescence intensity was measured on days 1, 2, 3, 4, 7, 10, 14, and 21. All experiments were performed in three independent runs in triplicate. Results represent mean±95% confidence interval (CI).
Stainings
All stainings were performed according to the manufacturer's protocols. The concentrations assessed in this study were selected according to the manufacturer's protocols, preliminary experiments (data not shown), and the literature.14,17,37 Untreated SCP-1 of the same passage served as a control.
Briefly, PKH26 staining was performed as follows: After trypsinisation, cells were washed in serum-free media and centrifuged for 5 min at 500G at 37°C. The cell pellet was resuspended in either a 5 μM or in a 10 μM PKH26 staining solution (PKH26 GL Sigma-Aldrich) and incubated for 5 min at room temperature. The reaction was stopped with 1 mL heat inactivated FBS for 1 min. Finally, cells were washed and centrifuged twice for 5 min at 500 g and 37°C and subsequently plated in a T-75 flask (NUNC).
For CFDA-SE staining (Invitrogen), a stock solution of 10 mM CFDA-SE was prepared by dissolving the CFDA-SE dye in dimethyl sulfoxide. The stock solution was then diluted to working concentrations of 5 and 10 μM by addition of PBS without Ca2+ and Mg2+. Staining was added to adherent cells in T-25 flasks cells and incubated for 15 min at 37°C. Thereafter, cells were washed twice with PBS, and fresh culture medium was added. The first medium change took place 1 h after the staining procedure.
WST-I assay
A WST-I assay (Roche Diagnostics) was performed to assess the metabolic activity of the cells after labeling according to the manufacturer's instructions. To this end, PKH26 and CFDA-SE stained SCP-1 as well as SCP-1 eGFP cells were seeded in triplicates for each preparation in 24-well plates at a density of 2500 cells/cm2 and incubated for 24 h after the staining procedure. Untreated SCP-1 served as control. Thereafter, cells were treated with the WST-I reagent. The WST-I reagent was mixed with full medium at a ratio of 1:10, and cells were incubated for 4 h. Subsequently, 100 μL of medium from each well were transferred into a 96-well plate, and the absorbance was measured at 450 nm using an enzyme-linked immunosorbent assay plate reader. The measurements were repeated thrice for each well. All experiments were performed in three independent runs in triplicate. For each labeling, the same passage of untreated SCP-I served as a control and was set as 100%.
Flow cytometry
Flow cytometric analyses were performed on an FACSCalibur flow cytometer (BD Bioscience). Stained cells were trypsinized and washed twice with PBS. A total number of 10,000 cells in a final volume of 200 μL were used for each run. Cell populations were gated, and fluorescence intensity of PKH26, CFDA-SE, and eGFP labeled cells was assessed using the FL1 channel and FL3 respectively. For the final evaluation, we used the FlowJo V.8.6.3 software (Tree Star). For each run, the arithmetic mean of fluorescence intensity was determined using FlowJo's statistic analysis software. Results represent mean values and 95% CI of three independent runs and triplicates. For each labeling, the same passage of untreated SCP-I served as a control.
Animals, scaffolds, surgical procedure, and histology
For in vivo experiments, 15 athymic nude mice (Harlan) were divided into three groups, one for each labeling method (10 μM PKH26, 10 μM CFDA-SE, and eGFP), resulting in five mice per group. After labeling, 250,000 cells were seeded on scaffolds of cylindrical bovine demineralized bone matrix (Tutogen) of 3 mm in diameter and 6 mm of height according to a standardized protocol. 38 To implant the cell-seeded scaffolds subcutaneously, mice were anesthetized by injecting a mixture of fentanyl (0.05 mg/kg), midazolam (5 mg/kg), and medetomidin (0.5 mg/kg) intraperitoneally. Subsequently, an incision of 5 mm length was set medially on the back of the mice and four subcutaneous pouches were created to hold the scaffolds. Three scaffolds seeded with stained cells and one empty scaffold, which served as a control, were implanted per mouse. One mouse of each group was sacrificed after days 1, 7, 14, 21, 42, and scaffolds were explanted. All procedures were performed according to German animal protection legislation and approved by the Government Committee of Upper Bavaria. Specimens were fixated in 4% paraformaldehyde for 12 h and afterwards treated with an ascending concentration of sucrose solution (3 h in 5% sucrose, 3 h in 10% sucrose, and 12 h 20% sucrose). Specimens were frozen in Tissue Freezing Medium (Jung). Serial cryo-cuts were prepared using an HM 500 M cryotome (Microm) with a slice thickness of 16 μm. For each animal from all groups, 10 sections were obtained from both ends and the middle portion of the scaffold, adding to 30 sections per scaffold. Five sections from corresponding zones of each scaffold were analyzed. Sections were selected by the best macroscopic appearance concerning artifacts due to the cutting procedure throughout the entire scaffold.
Microscope
For image analysis an Axiovert S100 (Zeiss) microscope equipped with a 75 XBO W/2 lamp was used. For detection of in vitro fluorescence of CFDA-SE and eGFP, a triple-band filter (F61-002; AHF) was used. For detection of PKH26, the Zeiss' filter set #14 (Zeiss) was applied. To avoid background fluorescence in the in vivo images, a small-band filter set was used for CFDA-SE and eGFP specimen (excitation: 488/6 nm, dichroic mirror: 495 nm and emission: 510/10 nm; AHF). Images were acquired with a Zeiss black and white digital camera (AxioCam MRm; 1388×1040 pixels) and processed with the Zeiss Axiovision software (AxioVs40 V 4.7.1-08-2008). The objective used was a Zeiss 10 times magnification A-Plan (10x/0.25 Ph1Var1, Zeiss) for phase-contrast images, and a Zeiss Fluar (10x/0.50; Zeiss) was used for fluorescence images.
Image acquisition
Image acquisition was performed in a standardized manner described in detail elsewhere. 33 Briefly, for semi-automated microscopy, a SCAN IM 130×100–1 mm automated table (Märtzhäuser-Wetzlar GmbH & Co. KG) was used. For in vitro analyses, 10×10 field of view (FOV) mosaic images of a total area of 7×6 mm were obtained in phase contrast and fluorescence microscopy. This is referred to as large field microscopy. For each T-25 flask, three different, incoherent, randomly chosen large field images were obtained. For the acquisition of the in vitro fluorescence images, a fixed exposure time of 500 ms for SCP-1 eGFP, of 250 ms for PKH26 labeled cells, 200 ms for CDFA 10 μM, and 400 ms for 5 μM stained cells was used. The exposure time was set according to preliminary experiments (data not shown), and images were exported as 16-bit gray value TIF images. To analyze the scaffolds of the in vivo experiment, 7×8 FOV were needed at a magnification of ×10 to image an entire section. For the acquisition of the fluorescence in vivo images, a fixed exposure time of 250 ms for SCP-1 eGFP and CFDA-SE labeled cells, 50 ms for PKH26 stained cells was used. All images for the elimination of the autofluorescence were taken with an exposure time of 25 ms.
Image analysis and algorithm tools
The automated image analysis was performed using ImageJ (Version 1.42g). 39 The technique for acquisition of the relative fluorescence intensity (RFI) for in vitro images was described in detail elsewhere. 33 Briefly, the sum of the fluorescence for all pixels was acquired using ImageJ and divided by the total number of cells counted by an algorithm for counting cells in phase-contrast images. 33 The result is referred to as RFI. In an explanted 3D construct, the total number of cells on the scaffold cannot be determined using microscopic techniques. To be able to objectively compare fluorescence intensity of in vivo images, the fluorescent area was multiplied with the mean fluorescence intensity and is referred to as relative fluorescence intensity* (RFI*). Results represent mean±95% CI. For evaluation of the in vivo fluorescence, two images of the same region were acquired, one of the labeled cells and one of the scaffold (excitation 400 nm, emission 450 nm). A minimum image of both pictures was calculated using ImageJ, and this newly created image was then subtracted from the original image of the labeled cells.
Statistical analysis
Statistical analysis was performed using SigmaStat version 3.0 and SigmaPlot version 8.0 (SPSS). To compare the fluorescence intensity between the different time points of the in vitro experiment, the t-test was used. To analyze the results of the WST-I assay as well as the in vivo experiments, the rank sum test was used. A value of p<0.05 was considered significant.
Results
WST-I assay
In order to assess the metabolic activity of the cells after the different labeling methods, a WST-I assay was performed. Nonlabeled hMSC cells served as a control. Twenty-four hours after the labeling procedure, both concentrations of PKH26 induced a significant reduction in metabolic activity, with the 5 μM concentration resulting in a relative metabolic activity of 54.1%±12.8% (p≤0.001; Fig. 1) and the 10 μM concentration yielding 21.8%±5.6% (p≤0.001; Fig. 1). Similarly, the 5 μM and 10 μM concentrations of CFDA-SE reduced the relative metabolic activity to 84.6%±2.9% (p≤0.001) and 77.9%±1.8% (p≤0.001; Fig. 1), respectively. eGFP labeled cells, in turn, showed no significant difference compared with the untreated hMSC cell line SCP-1. Their relative metabolic activity appeared to be 101.8%±6.4% (p=0.56; Fig. 1).

WST-I assay. To assess the impact of the three labeling methods on the metabolic activity of human mesenchymal stem cell (hMSC), a WST-I assay was performed. Unstained SCP-1 cells served as a control; their metabolic activity was set to be 100%. PKH26 reduced the cells' metabolic activity to 54.1% (5 μM) and 21.8% (10 μM), respectively, whereas carboxyfluorescein diacetate succinimidyl ester (CFDA-SE) staining reduced the cells' metabolic activity to 84.6% (5 μM) and 77.9% (10 μM), respectively. In contrast, enhanced green fluorescent protein (eGFP) cells (90th passage) did not show alteration of the cells' metabolism. Error bars equal 95% confidence interval, three independent experiments in triplicate, ***p≤0.001.
Assessment of the fluorescence intensity by semi-automated microscopy
To evaluate the in vitro fluorescence intensity, 300 FOVs were analyzed for each staining procedure and time point, adding to a total of 10800 FOVs. The RFI of both concentrations of PKH26 significantly decreased after the first day (p≤0.001). On day 7, it reached 0.55%±0.16% (5 μM) and 0.63%±0.15% (10 μM) of the initial fluorescence intensity (Fig. 2a, b). In a similar manner, the RFI of both concentrations of CFDA-SE significantly decreased after day 1 (p≤0.001) resulting in a value of 0.01%±0.0% (5 and 10 μM) on day 7 (Fig. 2c, d). In contrast, eGFP labeled cells revealed an increase of the RFI of 3.4% during the 21-day experiment (Fig. 2e, f), showing no significant differences at any time (p≥0.501). The untreated SCP-1 did not show any fluorescence intensity at any time (data not shown).

Relative fluorescence intensity (RFI) in vitro using semi-automated microscopy over the duration of 21 days. As early as 1 day after staining, both concentrations of PKH26
Validation of semi-automated microscopy by flow cytometry analysis
To validate the microscopic findings, cells derived from the identical staining procedure were subjected to flow cytometry analysis. When using the 5 μM concentration, PKH26 showed no significant decrease of the RFI after day 1 (p≤0.116). However, after day 2, a significant reduction of RFI was noted (p=0.005; Fig. 3a), and only 4.2%±0.44% of the RFI was detectable on day 7. When using 10 μM PKH26, a significant decrease of the RFI was detected after day 1 (p=0.001; Fig. 3b). Here, the RFI was 3.0%±0.10% after 7 days.

RFI measured using flow cytometry. In analogy to the results produced by semi-automated microscopy, RFI of PKH26
As seen with semi-automated microscopy, CFDA-SE stained cells analyzed by flow cytometry showed a significant decrease in RFI after day 1 for both the 5 μM (p=0.009) and the 10 μM concentration (p≤0.001; Fig. 3c, d). On day 7, the RFI was 0.44%±0.03% (5 μM) and 0.92%±0.19% (10 μM) of the initial fluorescence intensity (Fig. 3c, d). Exemplary results of flow cytometry analysis at different time points for 10 μM CFDA are shown in Figure 3f.
Again, eGFP labeled cells showed no significant changes of RFI at any time (p>0.05) when assessed by flow cytometry. The RFI was 109.4%±7.85% after 21 days compared with the fluorescence intensity on day 1 (Fig. 3e). As noted earlier, the untreated SCP-1 did not show any fluorescence intensity at any time (data not shown).
In vivo tracking
When analyzing a non-stained cryosection of fluorescent cells on a subcutaneously implanted scaffold using a small band eGFP filter, autofluorescence of the scaffold interferes with the fluorescence of the cells (Fig. 4a). We therefore developed an algorithm using the freeware ImageJ to minimize autofluorescence artefacts. For this purpose, cryosections were imaged using a blue spectrum filter. This yielded pictures displaying exclusively the autofluorescence of the scaffold (Fig. 4b). Using the “image calculator” function of ImageJ, a minimum image of the first 2 pictures was calculated (Fig. 4c). This newly created image was subtracted from the original image, resulting in a purified picture of the fluorescent cells (Fig. 4d).

Algorithm to subtract the autofluorescence of the scaffolds from the original image.
The autofluorescence subtraction algorithm was applied to all the specimens of the in vivo study. Exemplary images of different time points of the three labeling methods are shown in Figure 5. It appears that eGFP labeled cells showed the highest fluorescence intensity after 42 days (Fig. 5, row 3) when compared with PKH26 (Fig. 5, row 1) or to CFDA-SE labeled cells (Fig. 5, row 2). The latter staining methods faded rapidly over the course of 21 days. After 42 days, there was barely any fluorescence detectable (Fig. 5, rows 1 and 2).
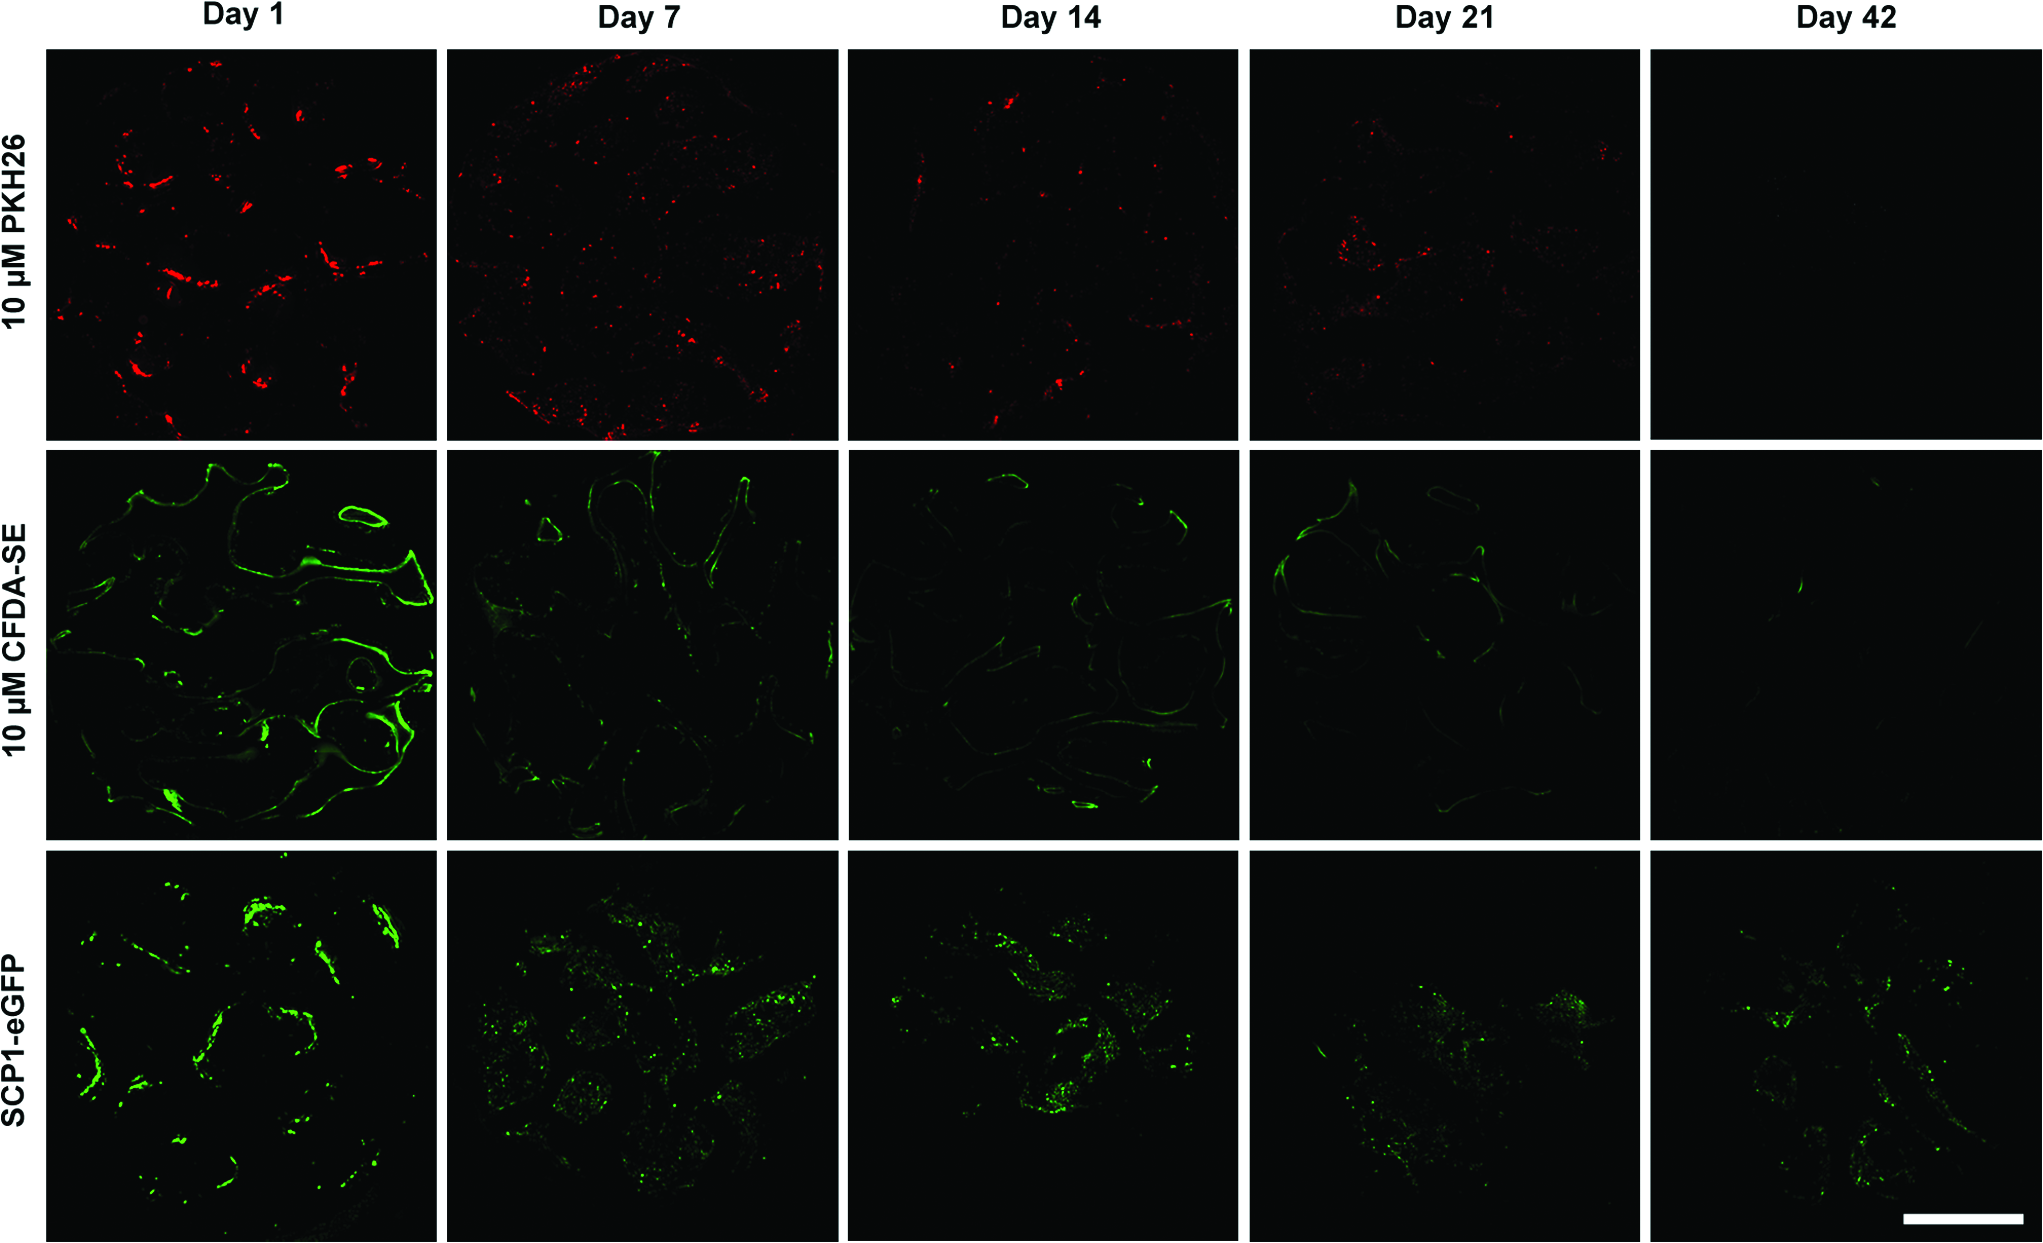
Exemplary images of cryo-cut DBM scaffolds seeded with hMSC labeled with PKH26 (row 1), CFDA-SE (row 2), and eGFP (row 3). Scaffolds were seeded with 250,000 stained hMSC in vitro and subcutaneously implanted on day 0. On days 1, 7, 14, 21, and 42, scaffolds were harvested and cryo-cut into 16 μm sections. After 42 days, PKH26 and CFDA-SE fluorescence has almost entirely faded; eGFP fluorescence is clearly visible after 42 days. Images were acquired using standardized microscope settings. Scale bar equals 1 mm. Color images available online at
To quantify the fluorescence intensity of labeled cells on scaffolds after in vivo application, we calculated the fluorescence intensity of five sections per scaffold. Fifty-six FOVs were obtained for each section. In total, for each scaffold, 280 FOVs were included in the analysis. For each labeling, three scaffolds were evaluated per time point, adding to 840 FOVs. PKH26 staining showed a significant reduction of the RFI* to 57.3%±20.5% after day 1 (p=0.002; Fig. 6a). It further decreased to 4.1%±2.2% on day 42. CFDA-SE stained cells significantly decreased in RFI* from 35.4%±6.6% on day 1 (p≤0.001) to 4.6%±2.5% on day 42 (Fig. 6b). eGFP labeled cells showed a less pronounced yet significant reduction of fluorescence intensity to 27.6%±16.1% after day 21 (p≤0.001). After 42 days, eGFP labeled cells showed an RFI* of 17.5%±12.4% (Fig. 6c), which was 3.8 times higher than that of PKH26 and CFDA-SE labeled cells.
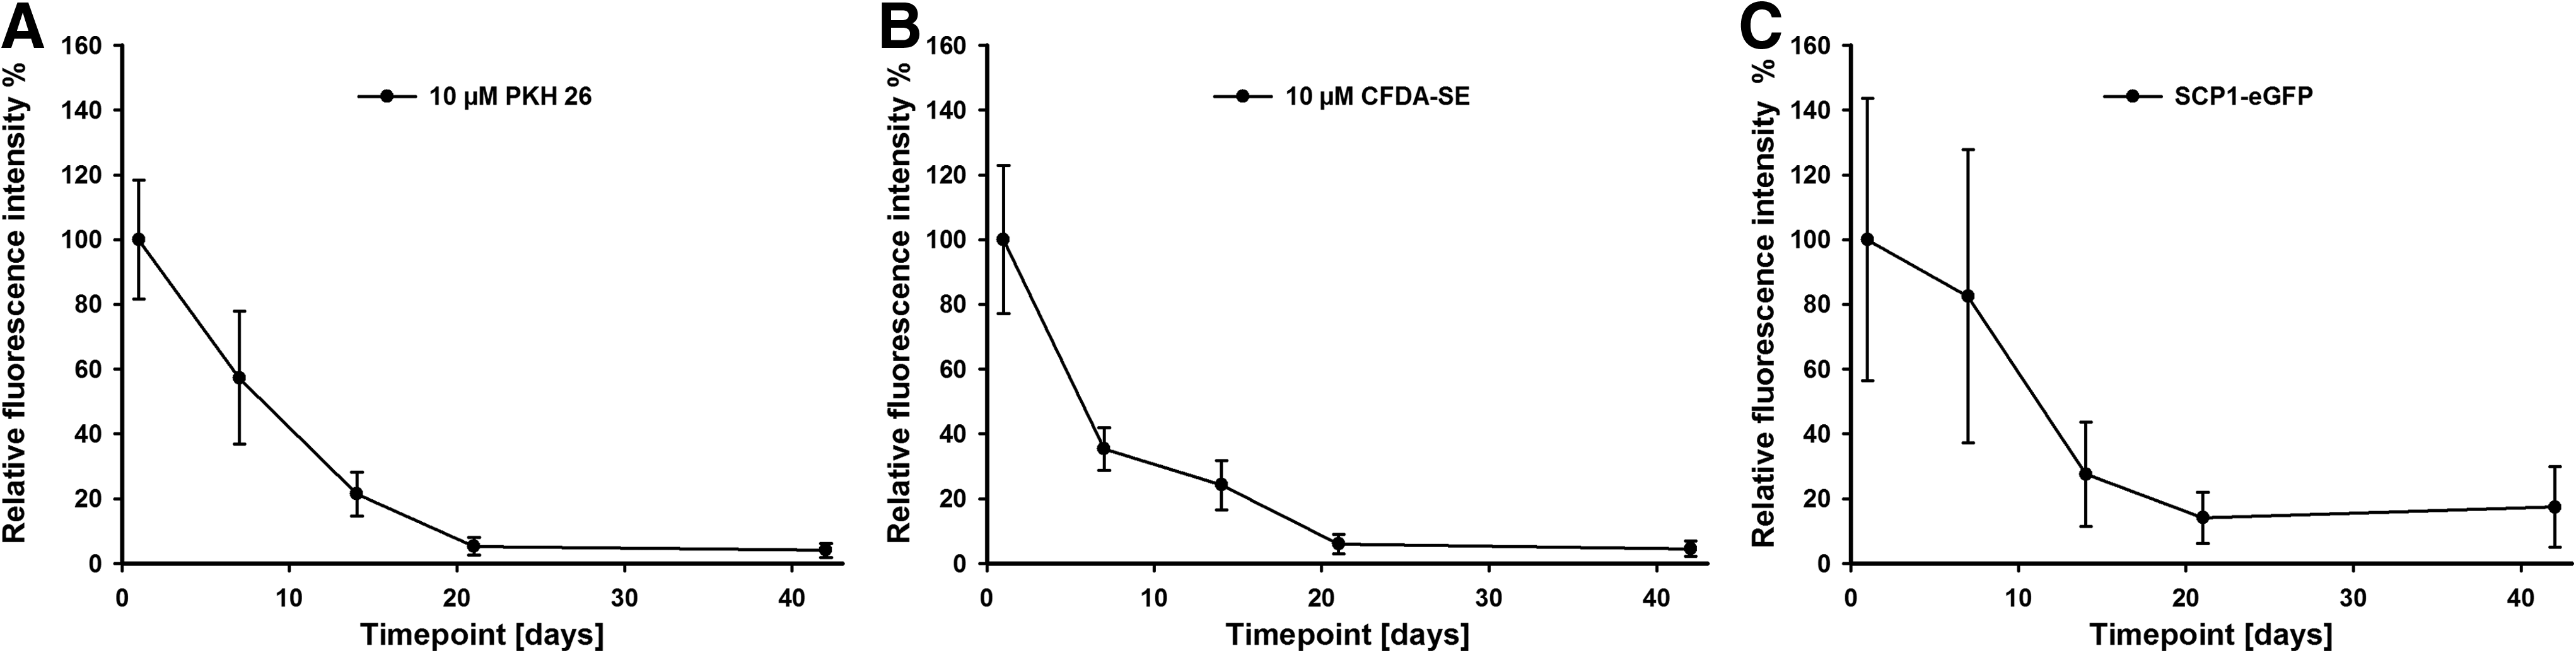
Quantification of RFI of cells labeled with PKH26
Discussion
Cell-based regenerative therapies of bone are currently limited by the low survival of transplanted cells.6,7 New strategies aim at improving the cell viability. Different fluorescence labeling methods with specific advantages and limitations are regularly used to monitor cell survival. We, therefore, aimed at objectively comparing three common fluorescence labeling techniques regarding their aptness to detect hMSC after transplantation over a longer period of time.
In vitro analyses
Staining with PKH26 showed a significant decrease in cell metabolism. Similarly, but less pronounced, staining with CFDA-SE caused a significant reduction of metabolic activity compared with eGFP labeled cells. This may be due to the fact that especially PKH26 staining requires multiple cycles of centrifugation and washing, which may additionally be harmful the cells. CFDA-SE staining is less invasive, as cells do not have to be detached but this is known to have cytotoxic effects. Our results go well in line with the findings of Hemmrich et al. 14 , who observed significant cell loss in preadipocytes due to staining using PKH26 and CFDA-SE. In contrast, cellular metabolism of eGFP labeled cells remained unaltered compared with untreated SCP-1 cells. However, it is important to note that, after eGFP-transduction, cells routinely are given time to recover from the labeling procedure. In our study, lentiviral transduction was performed in passage 37, and experiments were carried out in passages 90–95, potentially biasing the cytotoxicity experiment. Nevertheless, others labeled embryonic pig cells with eGFP by gene transfer and observed no toxic effects but a regular development of the animal. 40
In vitro, assessment of the fluorescence intensity of PKH26 was more imprecise represented by a larger 95% CI. This is presumably due to the inhomogeneous staining pattern of the dye. In contrast, CFDA-SE staining and eGFP labeling resulted in a homogeneous labeling of the entire cytoplasm, which goes well in line with observations by others.13,41,42 Fluorescence intensity of both vital stainings significantly decreased after the first day. After 7 days, the fluorescence intensity was less than 0.63% of the initial value. The decline was expected, as the fluorescence intensity is halved with each cell division.14,42,43 It has to be mentioned that the low seeding density of 1000 cell/cm2 promotes cell proliferation and, therefore, is an unfavorable setting for the use of PKH26 and CFDA-SE. In a setup not favoring proliferation or using cell types with longer population doubling times, the fluorescent dyes may well be successfully used to detect cells over longer periods of time. Consequently, CFDA-SE labeled lymphocytes have been detected up to 8 weeks in vivo. 44 However, beside the multilineage potential, the high proliferative capacity is a key feature of hMSC. By using a low seeding density, we explicitly addressed whether the analyzed labeling methods are suitable for highly proliferative cells. In turn, for the vital stains, eGFP fluorescence intensity did not decrease, but remained constant over the entire 21 days of observation, as it is stably integrated into the genome and constantly expressed by each vital cell. This feature makes labeling with eGFP more appropriate for detection of hMSC.
The measurement of fluorescence intensity was simultaneously carried out by semi-automated large field microscopy and flow cytometry analyses. Both techniques generated congruent results, thereby proving that the quantification by large field microscopy is equally reliable compared with the well-established method of flow cytometry analysis.
In sum, PKH26 and CFDA-SE might be easy to apply and well established but are not appropriate to detect fast dividing cells such as hMSC. Labeling with eGFP is a complex procedure requiring distinct laboratory facilities, but is better suitable for following the fate of hMSC.
In vivo detection
Background noise is a common problem when evaluating in vivo specimen. Regularly, fluorescence images are processed in order to reduce these artefacts. In our study, we present an algorithm based on the open source software ImageJ. This enabled us to easily and reproducibly evaluate large specimens in a semi-automated manner.
PKH26 is known to result in multiple fluorescent areas within one cell after the first cell division. Therefore, the cell number cannot be estimated by the number of fluorescent dots. In order to acquire a comparable parameter for the fluorescence intensity, we calculated the RFI*. Even though the RFI* does not represent exact cell numbers, it is a reproducible relative parameter allowing comparison between different time points and techniques.
When using PKH26 and CFDA-SE, the decrease in RFI* after the first time point was lower compared with the in vitro experiments. One possible explanation may be that the cellular metabolism and subsequently proliferation are reduced as cells adapt to the in vivo conditions. Fluorescence intensity reached a plateau phase of 4%–5% after 21 days for both vital stainings. One reason could be that cells die after implantation but still emit a fluorescence signal as the stainings are detectable not only in vital, but also in apoptotic and necrotic cells. 25 Another possible reason is that cells go into growth arrest and stop proliferating in response to a low supply of nutrient and oxygen after transplantation. In contrast, the RFI* of eGFP labeled cells reached a plateau phase after 21 days that was at least 3.8-fold higher. This difference again reflects the fact that the vital stains fainted over time as the cells divided, thus wrongly reducing the count of viable cells. Unlike the in vitro experiments, the RFI* of eGFP-labeled cells also decreased over the first 21 days. A decline in RFI* was expected as it is known, that cells die after subcutaneous transplantation.4–7,45 Beyond the 21st day, the fluorescence reached a steady intensity of 20%. In a previous study, we demonstrated by quantitative reverse transcriptase polymerase chain reaction analysis that approximately 20% of subcutaneously transplanted hMSC survive. 38 Taking in account that the florescence intensity of eGFP labeled cells does not faint with cell division, the decline is most likely to reflect the actual decrease of vital cells in vivo.
The eligibility of the different labeling techniques in terms of long-term detection of hMSC revealed here is highly relevant, as numerous studies still use CFDA-SE and PKH26 to quantify the number of viable cells after transplantation.28,30,31,46 Recently, Zimmermann et al. subcutaneously transplanted CFDA-SE labeled rat MSC seeded on scaffolds. 26 After 14 days, no CFDA-SE labeled cells were detectable. The authors concluded that all cells had died. Similarly, Kneser et al. evaluated a cell-seeded preformed bone substitute in a calvarial defect rat model. 17 The authors concluded that the low survival rate of transplanted cells underlies the decreased CFDA fluorescence intensity. With the features of the different labeling methods demonstrated here, care should be taken when interpreting such findings.
Another potential source of error is the quantification of viable cells in vivo by manual counting.7,17,26 This concept is extraordinarily time consuming and prone to inter- and intra-observer variability. 32 Furthermore, subtle changes in fluorescence intensity cannot be detected. We, therefore, believe that the fluorescence intensity should rather be measured in an objective and standardized fashion as presented by our algorithm, which proved to be a powerful tool to analyse large sample sizes in a standardized fashion.
Conclusions
The algorithm presented reliably picked up the fluorescence intensity of cells on implanted scaffolds and may, thus, be an efficient tool to objectively assess cell-based therapies in the future. Our results demonstrate that, despite being the most complex procedure of the three methods presented, stable transduction of cells using eGFP is the most reliable method for long-term detection of fast dividing cells such as the hMSC cell line used in this study.
Footnotes
Acknowledgments
Hans Polzer was supported by the Friedrich-Baur-Foundation, LMU Munich (project 0018/2008), the scientific publisher council of MMW, Munich, and by the Faculty of Medicine, LMU Munich (FöFoLe, project 704). Florian Haasters acknowledges the support of the Friedrich-Baur-Foundation, LMU Munich (project 0019/2008), and the Faculty of Medicine, LMU Munich (FöFoLe, project 660). Wolf Christian Prall and Elias Volkmer were supported by the Faculty of Medicine, LMU Munich (FöFoLe, project 565 and 642). We thank Tutogen Germany for providing the DBM scaffolds.
Disclosure Statement
No competing financial interests exist.