
Abstract
As the field of tissue engineering develops, researchers are faced with a large number of degrees of freedom regarding the choice of material, architecture, seeding, and culturing. To evaluate the effectiveness of a tissue-engineered strategy, histology is typically done by physically slicing and staining a construct (crude, time-consuming, and unreliable). However, due to recent advances in high-resolution biomedical imaging, microcomputed tomography (μCT) has arisen as a quick and effective way to evaluate samples, while preserving their structure in the original state. However, a major barrier for using μCT to do histology has been its inability to differentiate between materials with similar X-ray attenuation. Various contrasting strategies (hardware and chemical staining agents) have been proposed to address this problem, but at a cost of additional complexity and limited access. Instead, here we suggest a strategy for how virtual 3D histology in silico can be conducted using conventional μCT, and we provide an illustrative example from bone tissue engineering. The key to our methodology is an implementation of scaffold surface architecture that is ordered in relation to cells and tissue, in concert with straightforward image-processing techniques, to minimize the reliance on contrasting for material segmentation. In the case study reported, μCT was used to image and segment porous poly(lactic acid) nonwoven fiber mesh scaffolds that were seeded dynamically with mesenchymal stem cells and cultured to produce soft tissue and mineralized tissue in a flow perfusion bioreactor using an osteogenic medium. The methodology presented herein paves a new way for tissue engineers to identify and distinguish components of cell/tissue/scaffold constructs to easily and effectively evaluate the tissue-engineering strategies that generate them.
Introduction
Currently, classical histology by physical sectioning continues to be the standard method for evaluation of efficacy of 3D tissue-engineered constructs. A complete representation of a 3D scaffold can be crudely generated by merging individual sections after being stained and microscopically imaged. However, histology by physical sectioning is time-consuming and incomplete, and potentially misrepresents the actual visualization of the 3D tissue formation within the entire tissue construct due to slice thickness limitations, distortion artifacts, and tissue separation during sectioning. Alternatively, because of their speed and nondestructive nature, imaging techniques are serving an increasingly important role in characterization of tissue-engineering constructs. In particular, high-resolution X-ray microcomputed tomography (μCT) has been identified as a powerful tool in evaluating tissue-engineered constructs, because it provides adequate resolution to detect tissue synthesis and vascular in-growth into scaffolds. 1 Additionally, other researchers have reported that cells have tolerated μCT scanning well, which could allow for the opportunity of repeated nondestructive scans without interfering with an experiment.2–4
However, X-ray-based imaging is not without drawbacks. Major limitations of μCT are related to the mechanism of obtaining an image. Namely, scanned materials become visible based on their attenuation of the X-ray energy beam. Thus, radiodense materials (rock, metal, and calcified bone) appear well in the μCT images, while radiolucent materials (such as polymers, water, and soft tissue) may be barely visible or not appear at all. Moreover, if two or more materials have similar X-ray attenuation properties, it is nearly impossible to distinguish between them using conventional μCT. Synchrotron radiation-based μCT (SR-μCT) addresses this challenge by offering the advantage of phase contrasting (among others), while various X-ray contrast-staining agents (such as iodine-based agents, Au/Ag, OsO4, etc.) can be used to complement μCT imaging in analyzing materials that otherwise would be difficult to image or distinguish from each other. 5 However, access to a particle accelerator required for SR-μCT is not always readily available, and the contrast agents can be expensive and/or toxic to the cells being imaged (i.e., the imaging process would require sacrifice of the sample). Moreover, it is nontrivial to stain materials selectively, especially in the case of tissue engineering, where contrast-tagged antibodies could be required for selective staining. Finally, in the case of porous media, such as the scaffolds used in tissue engineering, there is no way to guarantee that the contrast agent will have access to all of the pore space within the scaffold postculture.
Therefore, the aim of this article was to introduce a straightforward and practical approach to effectively accomplish 3D virtual histology via conventional high-resolution μCT, without the need of X-ray-contrast agents or having to rely on access to exotic equipment. The case study chosen to illustrate our approach is a bone tissue-engineering (BTE) application where four different materials need to be distinguished: polymer scaffold, cells, soft tissue, and mineralized tissue. In our example, preosteoblastic mesenchymal stem cells (MSCs) are seeded and cultured in vitro on porous polylactic acid (PLA) nonwoven fiber mesh scaffolds under flow perfusion in the presence of an osteogenic medium.6–13 We show as a proof of concept that conventional high-resolution μCT, in conjunction with an ordered scaffold surface geometry and established image processing techniques, can be effective in providing a 3D histological look inside engineered cell/tissue/scaffold constructs.
Materials and Methods
Scaffold production
The complete details of the fibrous scaffold preparation can be found in our previous publication. 14 Briefly, the scaffolds were nonwoven fiber meshes, constructed using polymer microfibers produced with spunbonding.15–19 In spunbonding, a hot polymer melt is extruded from a heated die and then fed through a high-speed air venturi to attenuate a polymer strand to a microfiber. The polymer used in the production of fibers was PLA (grade 6251D, 1.4% D enantiomer 108,500 MW, 1.87 PDI; NatureWorks LLC). A custom Brabender extruder (19.1-mm [0.75 in.] diameter×381-mm length) was used to pressurize and melt the polymer. The polymer exiting from the extruder (20:1 L/D barrel ratio and 3:1 compression ratio) was then fed to a modified Zenith pump. Controlled quantities of molten polymer were then pumped through a heated die (single 0.420-mm internal diameter capillary) at flow rates ranging from 0.13 to 0.81 g/min. The polymer strand exited the die and fed through an air venturi 100 cm below the die nozzle. A manually circulated collection screen 175 cm below the die face was used to collect a random even layering of fibers. This procedure resulted in a nonwoven mesh. Layers of fibers were stacked and measured until the stack reached a mass of 9.0±0.1 g within an area of 162.8 cm2. The collected nonwoven fiber stack then had a 7-cm center cut sheet obtained from it. Finally, using an 8-mm-diameter die, discs were punched from the layered fiber sheets. The resulting scaffolds used in culturing were ∼85% porous with an 8-mm diameter and ∼2.3-mm thickness. Average fiber diameter was found to be 34.8±1.85 μm. Fiber diameters were measured optically using a Nikon HFX-II microscope.
Cell culture
MSCs were extracted from tibias and femurs of Wistar rats (Harlan Laboratories) using established methods.8,20–22 Next, 5 mL of extracted cells suspended in an α-minimum essential medium (α-MEM, Invitrogen) supplemented with 10% fetal bovine serum (FBS; Atlanta Biologicals) and 1% antibiotic–antimycotic (Invitrogen) was plated per polystyrene 75-cm2 culture flasks (BD). Each flask was then supplemented with an additional 6 mL of osteogenic medium [α-MEM supplemented with 10% FBS, 1% antibiotic–antimycotic, 50 g/mL ascorbic acid (Sigma), 10 mM β-glycerophosphate (Sigma), and 10−8 M dexamethasone (Sigma)]. Cultures were incubated at 37°C and 5% CO2. Nonadherent cells were removed after 3 days of culture. The culture medium was replaced with a fresh osteogenic medium every 2 days. Cell cultures at ∼80% confluency were washed with phosphate-buffered saline (PBS, Sigma), lifted with trypsin (Invitrogen), centrifuged at 400g for 5 min, resuspended in an osteogenic medium and used for seeding.
Scaffold seeding and culture
Cassettes containing prewet nonwoven fiber scaffolds were placed into a flow perfusion bioreactor.23–26 Using oscillatory flow perfusion, MSCs were seeded on each nonwoven fiber mesh scaffold.27,28 Seeding suspensions were 1 million cells per scaffold for noncultured samples, and 500,000 cells per scaffold for long-term cultured samples. Culturing was performed by applying a continuous unidirectional flow of 0.5 mL/min/scaffold for a duration of 16 days after the initial seeding. All cultures were incubated at 37°C and 5% CO2. During the long-term culture, the osteogenic medium was refreshed every 3 days. At the conclusion of seeding or culturing, cell/scaffold constructs were removed from their cassettes and washed twice with PBS. The washed constructs were then fixed with 10% PBS-buffered formalin (Sigma) at 4°C overnight. Next, they were washed twice with PBS and passed through serial dehydration using ethanol–water. Samples were then critical point dried using a Tousimis Research Corporation autosamdri-814.
Scaffold cellularity
Once seeding was concluded, scaffolds were removed from cassettes, washed with PBS, and placed in 3 mL of DIH2O. The fiber scaffolds in DIH2O then had their structures opened up using forceps to allow the DIH2O to easily penetrate the structures. To lyse cells, samples were subjected to three freeze/thaw cycles. Scaffold cellularities were determined using the PicoGreen® dsDNA quantification assay (Invitrogen). A standard curve was produced using solutions of λDNA of known concentration. Briefly, 43-μL aliquots of samples and standards were placed in individual wells of a 96-well plate along with 107 μL of reaction buffer (20×10−3 M Tris–HCl and 1×10⁻³ M EDTA, pH 7.5) and 150 μL of PicoGreen® dye. The 96-well plate containing the solutions was allowed to incubate at room temperature in the dark for a minimum of 5 min. After incubation, fluorescence was measured (490 nm excitation/520 nm emission) using a Synergy™ HT Multi-Mode Microplate Reader. The total amount of DNA detected in the sample divided by the amount of DNA contained in one cell was used to calculate the scaffold cellularity. The DNA assay was performed on 6 scaffolds (N=6) to obtain cell numbers.
μCT Imaging
The nonwoven fiber mesh PLA scaffolds were analyzed via high-resolution μCT by an Xradia MicroXCT 400, an isotropic spatial resolution of 0.9108 μm. Intensity image slices were obtained at optimum settings of 200 μA intensity and 40 kV energy. Acquired 2D X-ray images were filtered for noise reduction and assembled into 3D reconstructions of the scaffolds using a custom MatLab® code. Verification of average fiber diameter for the nonwoven fiber mesh scaffold can be found in our previous publication. 14 Scaffolds from just after seeding and after 16 days of culture were imaged in this manner. The resolution of all images presented in this article corresponds to the resolution of the μCT imaging system: that is, the interpixel distance of 2D slices and the intervoxel distance in 3D reconstructions correspond to 0.9108 μm. No X-ray dyes or contrasts were used in this study.
Scanning electron microscopy imaging
Scanning electron microscopy (SEM) imaging was performed on the same samples that were imaged with μCT for the validation of the virtual histology results. After cell-seeded scaffolds were imaged via μCT, scaffolds were mounted to metal stubs and sputter coated with gold–palladium using an Anatech Hummer VI triode sputtering system. SEM imaging was then performed on a JEOL JSM-840A scanning electron microscope with a tungsten filament. Digital imaging was produced using the IXRF Systems EDS 2008 program.
Proposed segmentation algorithm
A representative 2D slice of raw data obtained from the μCT machine can be seen in the left pane of Figure 1. Each pixel contains a 16-bit grayscale intensity value that is representative of the X-ray beam attenuation at that particular spatial coordinate. Immediately, it becomes obvious that there are two materials in the image that are easily distinguishable: the PLA fibers that have a circular-to-ellipsoid cross-section and account for most of the solid material in the image, and the mineralized tissue that is nearly white in color due to its high attenuation of X-rays. The latter can be segmented from the rest due to the much higher pixel intensity, because no other material bleeds into this range. The PLA fibers, on the other hand, have the lowest pixel intensity, as is expected for polymeric materials. Knowledge of the PLA intensity threshold, combined with the observation that the PLA fiber cross-sections occupy a much larger area than any other object in the image that is not mineralized tissue, allows for segmentation of the scaffold material from the rest of the image. This leaves the cells and the soft tissue that they have produced. Although there is a slight difference in intensity between cells and ECM, there is a bleed of intensity at the borders where cells and ECM meet. Because of this trait, cells that are encapsulated in ECM require special attention, as is discussed later in the article. The procedure outlined above is described in an algorithmic form below, and an overview of it is depicted in Figure 2:

Segmentation of different materials in a 2D microcomputed tomography (μCT) image of a 16-day cultured sample. Left: original image obtained from the μCT machine; Right: segmented image using the algorithm described in this article. Cyan is polylactic acid (PLA) fibers; green is cells; yellow is soft tissue; and magenta is mineralized tissue (scale bar is 250 μm). Color images available online at
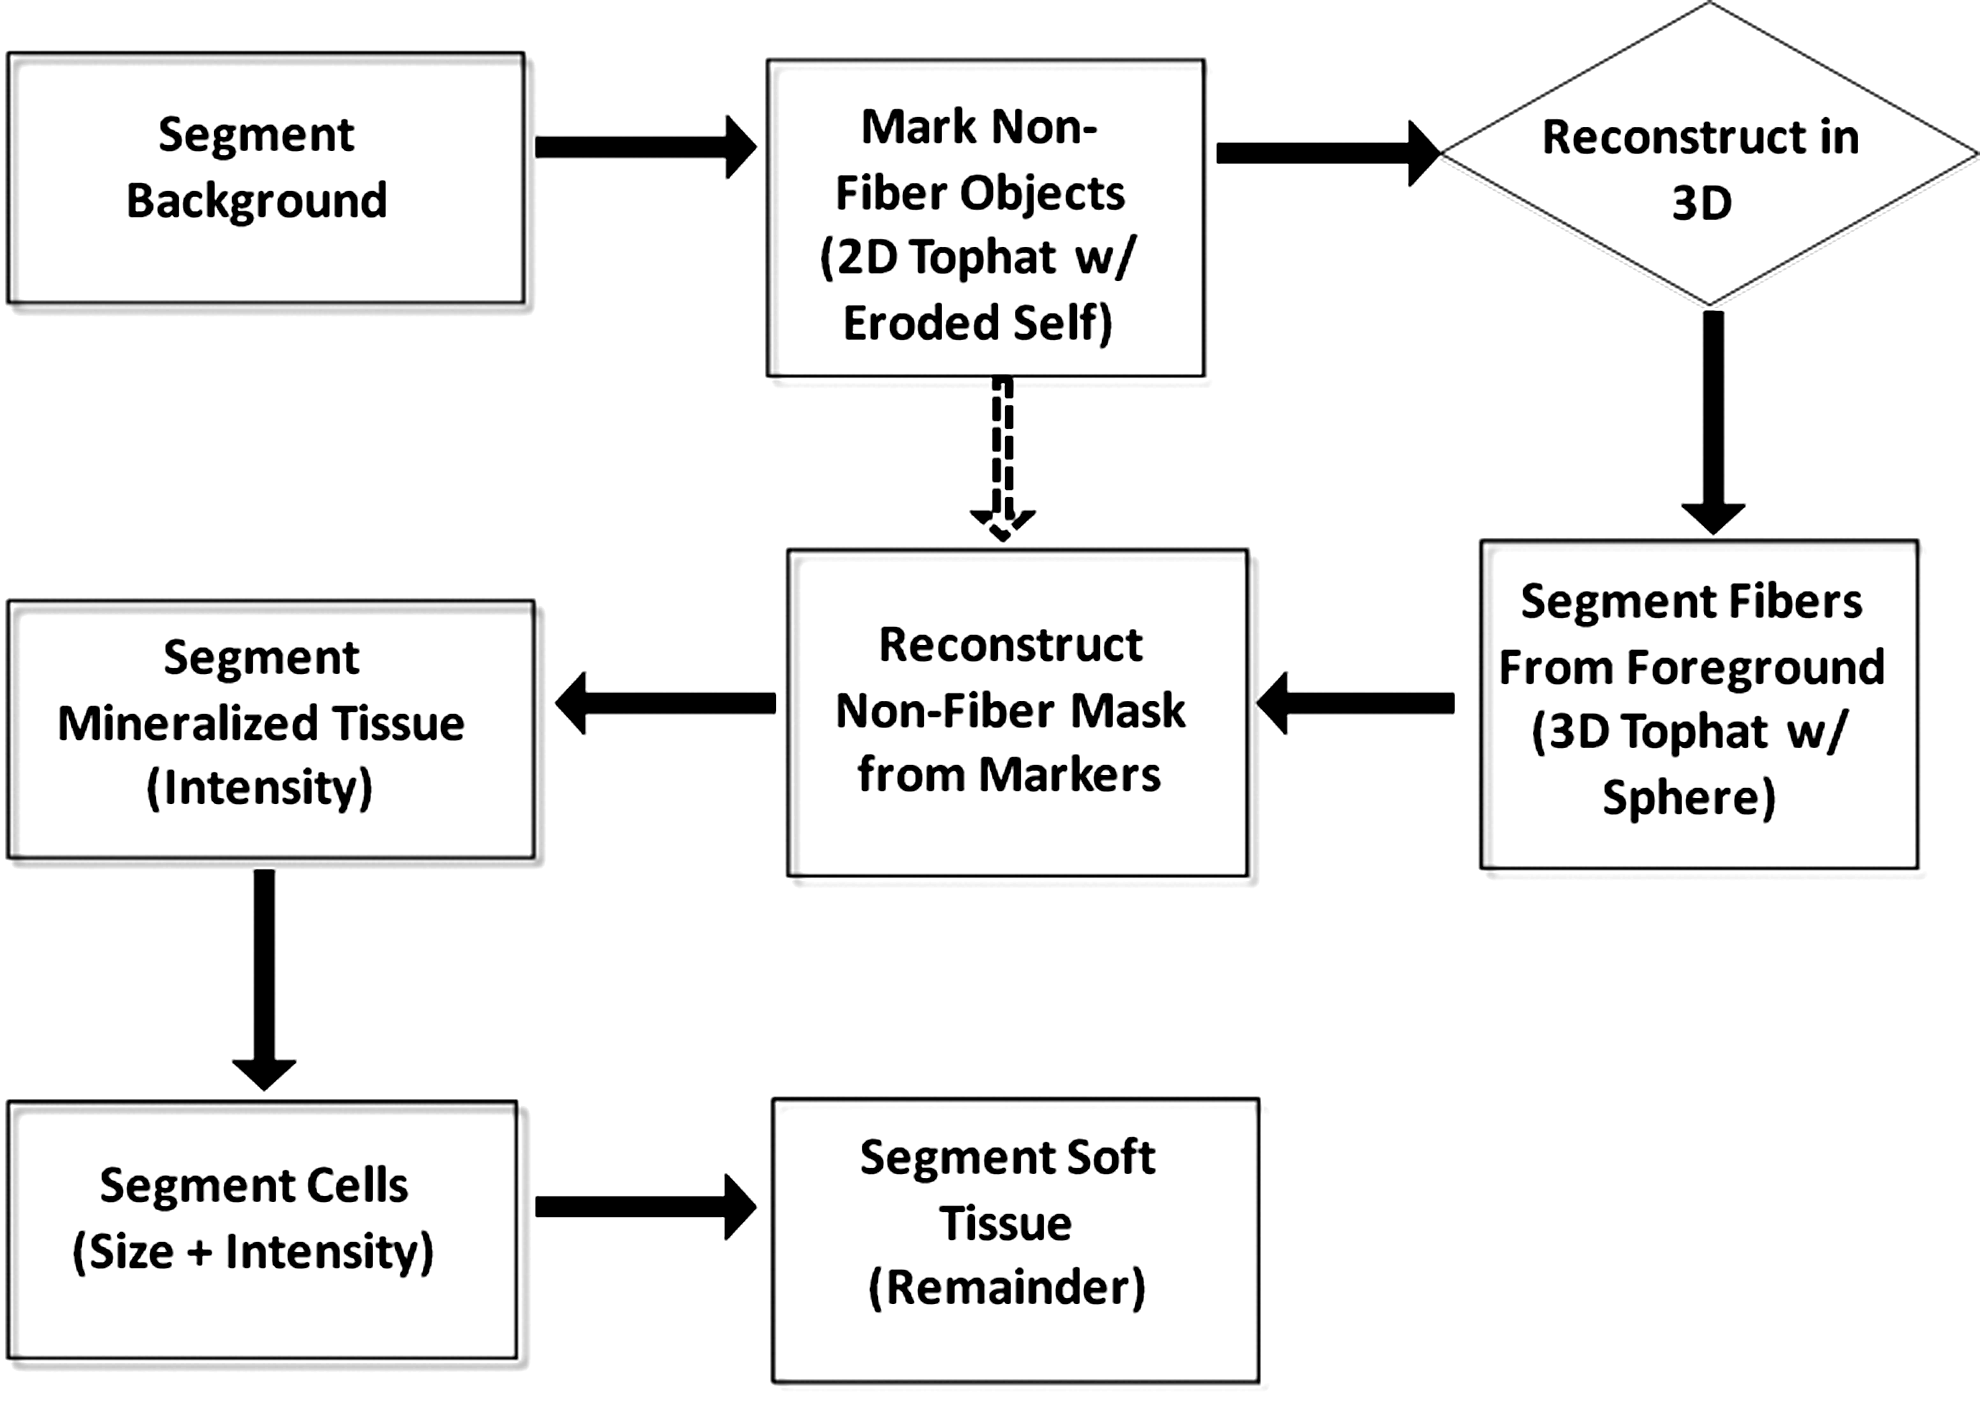
Process flow diagram outlining the proposed μCT image segmentation algorithm.
Two-dimensional preproprocessing
1. Remove backround: (a) Contrast stretch image (saturate 1% of low and high intensities) to improve signal-to-noise ratio and remap the new intensities weighed toward brighter pixels by using a gamma-value of 3. (b) Fill holes in grayscale image to obtain outlines of foreground objects. (c) Use simple thresholding to obtain a black & while (BW) mask of foreground. We used an intensity of 25,000 as the global threshold for the brightened images from step “a” and excluded pixels belonging to the BW mask from step “b” from the thresholding. (d) Filter foreground mask for salt noise (remove lone pixels).
2. Create markers for nonfiber objects: (a) Estimate locations of nonfiber objects for future use using the top-hat procedure with a special structuring element. The structuring element is created individually for each foreground object in the BW foreground mask by eroding the object itself until about 50% of its original area is left. The result of the top-hat procedure gives the objects on fiber surfaces.
Three-dimensional segmentation
3. Segment nonfiber material from foreground: Segmented fibers from the rest of the materials present in the image by performing a 3D top-hat procedure on the foreground BW mask with a spherical structuring element, where sphere diameter is taken to be the maximum expected cell diameter of 15 μm. The top-hat algorithm “rolls” the structuring element along the inner fiber boundary, and whatever cannot be reached by the sphere is considered to be nonfiber. An intensity threshold of 18,000 applied to the original (nonbrightened) images can further help to refine the segmentation results, since most of the nonfiber objects are brighter than this value.
4. Reconstruct nonfiber 3D mask: (a) Filter the nonfiber material mask for fiber voxels that have been erroneously segmented in the previous step (isolated voxels, surface voxels, etc.). (b) Use nonfiber object markers from Step 2 to perform image reconstruction into the cleaned mask from part “a”.
5. Segment-mineralized tissue from nonfiber foreground: Threshold the mineralized tissue based solely on the significant intensity difference relative to the rest of the materials in the image. In our images, an intensity threshold of 30,000 worked well for this step, because all of the mineralized tissue is brighter, and all the other objects are dimmer than this value.
6. Segment cells from nonfiber foreground: Since at this point the only remaining nonfiber materials in the image should be cells and soft tissue, segment the former by utilizing differences in intensity and some prior knowledge of the cell size/morphology. The optimum intensity threshold between cells and soft tissue that we identified is about 1.2 times the soft tissue average intensity, roughly 25,000. Apply this threshold globally to segment cell matter, and from these, isolate individual cells by applying a cell size search window: minimum and maximum volume bounds that correspond to spherical objects between 4–15-μm diameter (at this point, assumption of a spherical shape is only used for the volume estimation).
7. Segment soft tissue from nonfiber foreground: Once the cells and the mineralized tissue have been segmented, by the process of elimination, the only remaining nonfiber materials in the image should be soft tissue.
A representative 2D slice of the segmented data using the above algorithm can be seen in the right pane of Figure 1.
Spatial comparison measurement: equivalent sphere diameter
Experimental measurements of equivalent sphere diameter (ESD) were performed on 2D SEM images using ImageJ software. To estimate ESD from SEM images, three edge-to-edge cross-sectional measurements of multiple cells were made. The first measurement was across the largest edge-to-edge cross section, if the cell had a visibly larger cross section. The second measurement was made at a 90° angle from the first. The third measurement was made by bisecting the two first measurements. This resulted in measurements of 45° from one another. The three edge-to-edge measurements were then averaged and considered to be the ESD of the cell from SEM imaging. An illustration of a typical ESD measurement made from SEM is shown in Figure 4 (left). These were compared to ESDs measured from the μCT images. The latter were calculated by applying the volume of a sphere formula to the 3D reconstructions of cells attached to the scaffold surface.

Left: Visual ESD measurement using SEM images of cells on a cell seeded nonwoven fiber scaffold. Example measurements for an ESD calculation appear as edge-to-edge bars in red (scale bar is 5 μm). Right: histogram comparing ESD calculations of cells from μCT and SEM imaging, illustrating validation of the proposed methodology. The red color is μCT; light blue is SEM; and green is the overlap between the two. ESD, equivalent sphere diameter; SEM, scanning electron microscope. Color images available online at
Spatial comparison measurement: nearest neighbor distance
Experimental measurements of the nearest neighbor distance (NND) were performed on 2D SEM images using ImageJ software. Planar NNDs in the SEM images were measured from a cell's center to the center of the nearest neighboring cell. An illustration of a typical NND measurement made from SEM is shown in Figure 5 (left). These were compared to NNDs measured from the μCT images. The latter were calculated by taking the distances (not necessarily planar) between the centers of mass of cells nearest to each other in the 3D reconstructions.

Left: Visual NND measurement using SEM images of cells on a cell-seeded nonwoven fiber scaffold. Example measurements for an NND calculation appear as edge-to-edge bars in red (scale bar is 50 μm). Right: histogram comparing NND calculations of cells from μCT and SEM imaging, illustrating validation of the proposed methodology. The red color is μCT; light blue is SEM; and green is the overlap between the two. NND, nearest neighborhood distance. Color images available online at
Statistics
Values were reported as the average from all samples taken from an experimental group±standard error. Datasets for scaffold cellularity were analyzed using single-factor ANOVA at a confidence level of 95%. A two-sample Kolmogorov–Smirnov test was conducted on spatial comparison measurement, ESD, and NND, data with a confidence level of 95%.
Results
To evaluate the performance of our virtual histology algorithm, we first tested scaffolds seeded with cells that were not cultured. A total of eight scaffolds were seeded with cells and three subvolumes (592.4 μm×92.0 μm×592.4 μm) were scanned in different areas of each scaffold, bringing the total number of μCT samples examined to N=24. The Figure 3 (left) shows a typical 2D μCT slice of one of the noncultured scaffolds with only cells and fibers present in the image (note the difference with Figure 1, which also contains soft and mineralized tissues). It is apparent from Figure 3 (left) that the fibers and the MSCs (marked with green boxes) are clearly distinguishable from each other by the human eye. However, to test whether the proposed algorithm is up to the challenge, we applied the MATLAB code to the μCT image stacks and created 3D representations of the scanned scaffold subvolumes. Figure 3 (right) shows one such reconstruction resulting from the algorithm, where the MSCs are again labeled in green. From this figure, it is apparent that the size and the shape of the MSCs relative to that of the PLA fibers are appropriate, and no unexpected objects appear in the reconstruction.
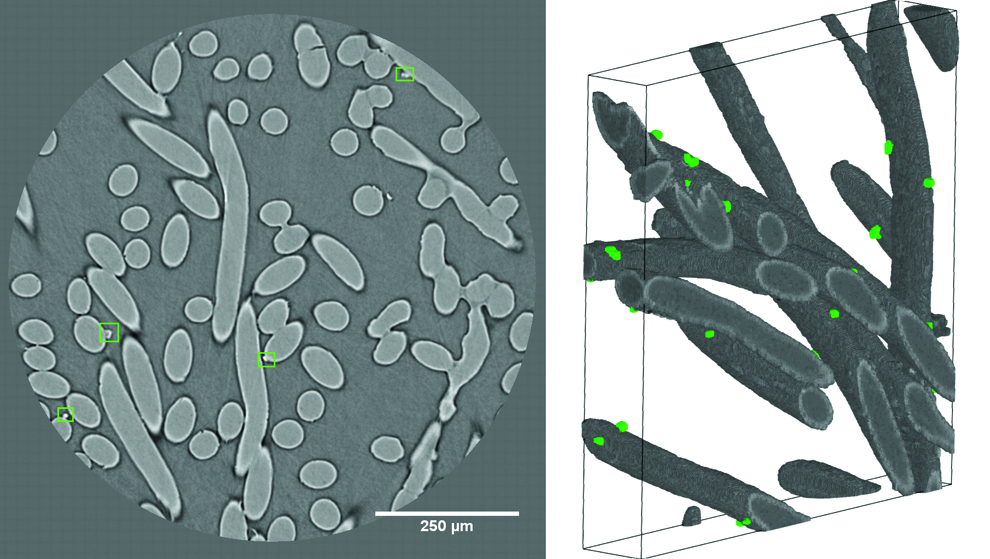
Images from μCT showing cells attached to fibers of nonwoven fiber mesh scaffolds. Left: 2D μCT image of the nonwoven fiber mesh scaffold with MSCs seeded on the PLA fibers. The cells are seen within the green boxes to be round, and brighter than the fibers (scale bar is 250 μm). Right: 3D reconstruction using μCT images of cells on PLA fibers from a 1 million cell-seeded nonwoven fiber mesh scaffold: Cells segmented using the proposed algorithm are shown in green color (only cells ∼10 μm in size are shown for clarity; image size is 592.4 μm×92.0 μm×592.4 μm). MSC, mesenchymal stem cells. Color images available online at
As a way to validate against experiment, we compared the cellularity obtained from the virtual histology to that obtained from the PicoGreen® dsDNA quantification assay. The cellularity obtained from the μCT imaging and reconstructions (when scaled to the full scaffold size) was 268,000±35,000 cells/scaffold, while the DNA assay for samples from the same experimental group gave a cellularity of 247,000±31,000 cells/scaffold. The number of structures observed as cells from μCT imaging are not significantly different (p=0.68) from the cellularity found using the widely accepted PicoGreen® assay, thus providing a validation of the methodology. This can be observed in Figure 6.

Graph of scaffold cellularities observed from analysis of μCT virtual histology and from PicoGreen® DNA assay. The graph depicts an 8% difference between the mean cellularity found by the DNA assay and the mean cellularity found by virtual histology. This difference is within commonly observed noise ranges for similar experimental cell measurements. Also, it can be seen from the graph that the mean cellularities are not statistically different from one another (p=0.68).
For further validation of the virtual histology algorithm against experiment, two spatial comparison criteria were tested: scaffold cellularity, ESD, and NND. A comparison of μCT to SEM results for ESD and NND appear in Figures 4 (right) and 5 (right), respectively. Both of the spatial comparison criteria show statistical agreement between the μCT and SEM imaging results, with ESD and NND, respectively. This finding further validates the reliability of the proposed methodology to differentiate between at least two object types, in this case, cells and polymer scaffold. Results from μCT are presumed to be a more accurate representation of the actual ESD and NND measurements, due to the fact that they are based on 3D measurements and a larger sample size, explaining moderate differences to those observed from SEM.
For the case of cultured scaffolds, however, the complexity of the image-processing task increases twofold: there are now four different materials in the μCT instead of two that must be distinguished without the help of any foreign agents. Luckily, the mineralized tissue is readily separable via simple intensity thresholding, as is immediately apparent from Figure 1. Thus, given that scaffolds can be easily segmented based on their size and shape, and mineralized tissue based on its intensity, the most challenging image-processing task that remains for the histology of cultured scaffolds is to differentiate between cells and soft tissue. However, by taking advantage of a few simple characteristics of cell morphology and intensity, these two similar materials can be successfully segmented. This is illustrated in Figure 7.

Segmentation procedure for cells embedded in soft tissue: comparison of cell intensities relative to those of soft tissue around them for four different cases. Grayscale insets show the actual μCT images being analyzed; color traces the path of the intensity profile in each image (red marks the cells, and blue marks the soft tissue). Color images available online at
Figure 7 shows four different cases of cells embedded in soft tissue, where the small size (∼10 μm in diameter) and slightly higher intensity (>1.2× surrounding soft tissue intensity) of the cells distinguish it from the tissue. By utilizing these differences, cultured scaffolds can too be reconstructed in a histological manner, with all four of the materials segmented from each other. Figure 8 is a representative final result of one such reconstruction that clearly shows the complex interplay between the newly formed tissue, the cells and the scaffold material, as are identified by our algorithm. From Figure 8, it is apparent that there are individual cells (marked in green) outside of the ECM along with mineralized (red) or soft (yellow) tissue located on the PLA fibers. These are summarized in Table 1.
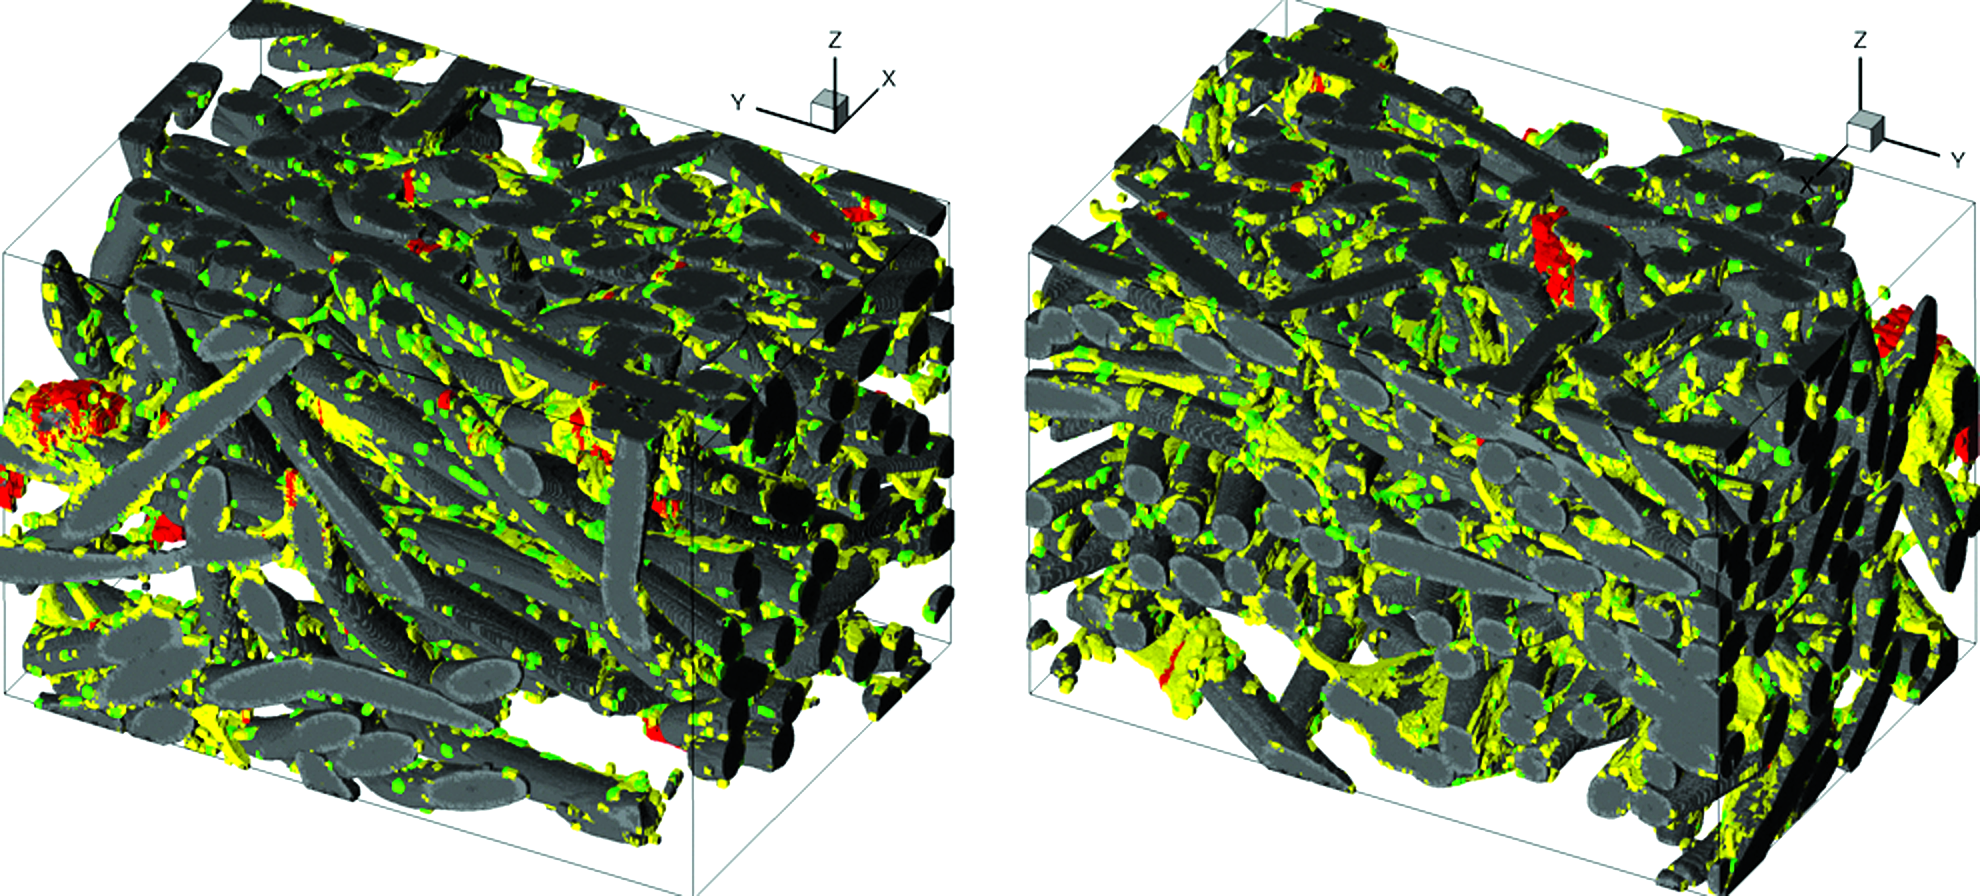
Final 3D reconstruction (image size is 0.62 mm×0.91 mm×0.62 mm) of μCT an imaged 16-day long-term cultured bone tissue-engineering construct viewed from two different angles: Gray, PLA nonwoven fiber mesh scaffold; green, cells; yellow, soft tissue; and red, mineralized tissue. Color images available online at
MSCs, mesenchymal stem cells; PLA, polylactic acid.
Discussion
In this study, we demonstrated that, as a proof of concept, conventional high-resolution μCT combined with image-processing techniques and a clever choice of geometry can be used to study spatial cell arrangement and tissue formation within scaffolds, which are of fundamental importance to developing tissue-engineering strategies. For our test sample, we chose a BTE nonwoven PLA fiber mesh scaffold seeded with rat MSCs. The choice of the PLA fiber mesh was strategic: the characteristic cylindrical fiber shape and PLA radiolucency both assist in the image segmentation process. Since the cells are the smallest, and therefore, the most challenging objects to capture accurately, we initially tested the proposed approach by using noncultured scaffolds that were seeded with MSCs. The cell/scaffold constructs were removed from the bioreactor immediately after the dynamic seeding to prevent the cells from proliferating and producing tissue. The motivation to try this simple case first was that by having just two different materials in the image (scaffold and cells) would allow for a more stringent validation of the algorithm's accuracy against experimental methods.
Although, a typical cell-seeding density for a BTE culturing experiment is 500,000 cells per scaffold, we purposely overseeded the noncultured scaffolds with twice the density: 1 million cells per scaffold. This was done to make the problem more challenging by having a larger number of cells that are closely spaced to each other. Assuming a typical seeding efficiency of about 20%–30%, a total of ∼250,000 cells were expected to be attached to the scaffold. 27 This would imply that if we further assume a uniform cell distribution within the scaffold volume that comes from the dynamic seeding technique that we employed, 27 one would expect that a 2D slice of the scaffold with the dimensions of the disc shown in Figure 3 (left) to roughly have single digits of cells, which is consistent with our findings. When compared the cellularities obtained from the PicoGreen® assay (reported here as the mean over six scaffolds±standard error) and the μCT virtual histology reconstructions (reported here as the mean over eight scaffolds±standard error), their means are within 8% of one another. This is well within the noise range commonly observed in the measurement of cell numbers in biological specimens. The slightly higher average given by the virtual histology is attributed to the fact that the subvolumes were scanned near the centers of the scaffolds, while the PicoGreen® assay takes into account the more porous scaffold periphery where there can be less cells. Also, some DNA is lost during the processing of constructs for the PicoGreen® assay. Finally, when we performed the two-sample Komogorov–Smirnov tests for both of the spatial comparison criteria, ESD and NND, we were able to show that the null hypothesis that the distributions are not different from one another could not be rejected at the 5% significance level for either case, further validating the reliability of the algorithm to identify cells on fibers. Although small differences exist between the μCT and the SEM results, they are likely due to the fact that the former is a true 3D measurement, while the latter results are inferred from 2D images.
The next step after validation of the algorithm for the simple case of noncultured scaffolds was to test it on a realistic scenario of a BTE-cultured sample. To do this, a scaffold was seeded at the typical seeding density of 500,000 cells per scaffold and cultured for 16 days. Once cultured, the imaging algorithm was again put to the test. This sample had significant amounts of soft and mineralized tissue present in their μCT images (see Fig. 1). In this case, the isolated cells and the fibers were segmented as before, while the mineralized tissue was segmented based solely on the significantly higher intensity difference relative to anything else in the images. The soft tissue and cells embedded into it, however, required special attention. As is depicted in Figure 7, we identified that cells embedded in soft tissue can be accurately picked out by their characteristic morphology (roughly 4–15 μm in diameter with a mostly circular cross section) and intensity (higher than ∼1.2 times the average surrounding soft tissue, or > 25,000 intensity). Using this strategy, cells embedded into the soft tissue were also successfully segmented. The resulting 3D reconstruction depicted in Figure 8 showed that soft tissue is present in larger amounts and seems to cover the fibers, while also making connections between them. The mineralized tissue was identified to be present in large locally concentrated globular chunks, near the soft tissue, and the cells were mostly isolated on fibers, with a few of them being embedded in the soft tissue. The relative amounts of volume occupied by each material (summarized in Table 1) showed that the nonwoven fiber mesh scaffold became compressed from its original 85% porosity down to ∼77.4% due to the flow perfusion seeding and culturing. All of these observations are consistent with what is expected from in vitro bone-like tissue formation and demonstrate the usefulness of the tool proposed in this publication in monitoring the intra-BTE construct microenvironment. Since the goal of this article is simply to show as the proof of concept that virtual contrast-free histology is possible, we leave the reader with the following final thoughts, without submerging into further analysis of the cultured BTE sample beyond the intentions of the article.
We have proposed and validated an approach to perform 3D virtual histology by conventional means and without X-ray contrasts. The usefulness of this method is that tissue engineers could study the in vitro culturing process nondestructively and without resorting to burdensome techniques such as histology by sectioning. It is also important to note that our algorithm makes minimal assumptions about the cell size and shape when segmenting them from fibers or from soft tissue (arguably, the most challenging image processing task in this method). Thus, it is able to capture cells that have assumed a nonspherical shape, even when they are embedded in soft tissue. Having said that, there is still room for improvement to the algorithm; for example, separating cells in larger globule formations (25+ cells) remains an unsolved issue. There are also several limitations to the proposed approach. Namely, it is currently limited to scans of small subvolumes (∼1/5th of total scaffold volume per scan) due to the intense computational power that is required to process images at such fine resolution. The approach is also prone to errors such as irregularities in scaffold manufacturing, or contaminants/foreign objects in the sample. However, application of rigorous manufacturing methods, development of machine-learning imaging algorithms, and advances in supercomputing; all of these obstacles can be overcome in the near future. Additionally, even though fine resolutions can be achieved and almost all of the mass of cells and tissue are observed, some features of cells and tissue smaller than the highest achievable resolution of the μCT machine could be potentially missed. Yet, even at the current state of things, we believe that this methodology offers a valuable insight into the in vitro tissue growing process at the ease of conventional means. Therefore, we foresee it becoming an integral part in the future development of tissue-engineering techniques.
Conclusion
In this work, we have demonstrated as proof of concept the ability to perform 3D histological analysis by using conventional μCT equipment without the use of X-ray contrasts. Critical to this approach is the use of a fiber mesh scaffold whose regular cylindrical geometry is known a priori. Although there is more work to be done on improving this approach, we expect that the ability to nondestructively image new tissue formation within polymer scaffolds will propel advancements in tissue engineering and will allow for an objective comparison between the numerous tissue-engineering protocols that exist today. To the best of our knowledge, this is the first study of its kind where virtual histology via conventional high-resolution μCT has been used to directly measure the relative amounts of cells and soft and mineralized tissue within BTE scaffolds. We hope that this methodology incorporating conventional high-resolution μCT, which is becoming increasingly available, will encourage the use of virtual histology on a wide variety of cell/tissue/scaffolds and improve the evaluation of tissue-engineering strategies.
Footnotes
Acknowledgments
Financial support from NSF is gratefully acknowledged (CBET-070081). The Xradia μCT scans were made by Mark E. Curtis. Fiber fabrication was performed by Taren Blue and Venkatesh Meenakshisundaram. We gratefully acknowledge their expertise and assistance.
Disclosure Statement
No competing financial interests exist.