
Abstract
Cell seeding is a critical step in tissue engineering. A high number of cells evenly distributed in scaffolds after seeding are associated with a more functional tissue culture. Furthermore, high cell densities have shown the possibility to reduce culture time or increase the formation of tissue. Experimentally, it is difficult to predict the cell-seeding process. In this study, a new methodology to simulate the cell-seeding process under perfusion conditions is proposed. The cells are treated as spherical particles dragged by the fluid media, where the physical parameters are computed through a Lagrangian formulation. The methodology proposed enables to define the kinetics of cell seeding continuously over time. An exponential relationship was found to optimize the seeding time and the number of cells seeded in the scaffold. The cell distribution and cell efficiency predicted using this methodology were similar to the experimental results of Melchels et al. One of the main advantages of this method is to be able to determine the three-dimensional position of all the seeded cells and to, therefore, better know the initial conditions for further cell proliferation and differentiation studies. This study opens up the field of numerical predictions related to the interactions between biomaterials, cells, and dynamics media.
Introduction
Since human cells are often available in short supply, 9 maximization of the cell-seeding process is necessary. Studies on seeding efficiency by static deposition have reported results ranging from 18% to 85%.3,4,6,10–12 Static seeding also presents the disadvantage of leading to a nonuniform cell distribution.3,4,10 Dynamic cell seeding with bioreactors has proven to provide a higher efficiency and more even distribution of cells, 13 more particularly within 3D scaffolds, where perfusion systems were reported to lead to greater efficiency and better cell distribution. 14 Cell-seeding efficiency achieved by the perfusion method can be between 40% and 90%, with a cell concentration ranging from 105 to 107 cells/mL.3,10,11,15 The main challenge of dynamic cell seeding is the proper selection of parameters.9,16 On this topic, Wendt et al. 3 concluded that for oscillating perfusion, high fluid flow velocities were detrimental for cells to adhere to the material, but for extremely low velocities, the cells did not move (static regime)—hence the importance to optimize fluid flow rate.
Dynamic cell seeding combines two complex phenomena, cellular adhesion and fluid flow, into one challenging system where multiple parameters can influence the general outcome. Experimental studies require a large number of experimental runs to optimize the seeding process. Theoretical models, on the other hand, offer a better controlled and systematic alternative for the optimization process. Li et al. 4 first used a mathematical model to describe their experimental results. The model evaluated the maximum seeding density achievable within a scaffold when using cell filtration. Galban and Locke 17 suggested analytically that spatial variations of cell densities can lead to spatial variations of nutrient concentration and metabolic products within 3D constructs. Other theoretical models of cell seeding were proposed by Vunjak-Novakovic et al., 18 and included the kinetics and possible mechanisms of cell seeding for cell-aggregated formation of cartilage tissue using spinner flask bioreactors.
Few dynamic cell-seeding simulations were created, even though computational fluid dynamics (CFD) is commonly used to characterize fluid flow fields in tissue engineering.19–22 Recently, a system model to control the perfusion cell seeding was proposed. 20 The fluid shear stress on a scaffold surface computed by CFD showed a close relationship with the distribution of cells in an in vitro experiment under the same seeding conditions. 20 The approach proposed previously enabled evaluation of the final seeding stage, but did not allow selecting the optimal parameters related to the dynamic environment. As a step forward to this work, we have developed a new methodology capable of describing, predicting, optimizing, and controlling the dynamic cell seeding under oscillating perfusion conditions. A multiphase model was proposed to mimic the cell seeding under perfusion. Our hypothesis is based on the possibilities to simulate the seeding phenomenon taking to account only the physical description, similar to other engineering phenomena.
Materials and Methods
Generation of models and experimental procedure
The cell-seeding protocol used in this study is based on a previous in vitro experimental study that looked at cell seeding in two scaffolds of different architecture but made of the same material and under the same fluid flow conditions.
20
Briefly, a total of 5 million of human articular chondrocytes were suspended in culture media and 400 cycles of oscillating fluid flow were applied for 16 h (corresponding to a period of 144 s for each cycle). Two scaffolds with gyroid pore design21,23,24 were fabricated by stereolithography with photo-polymerizable poly(
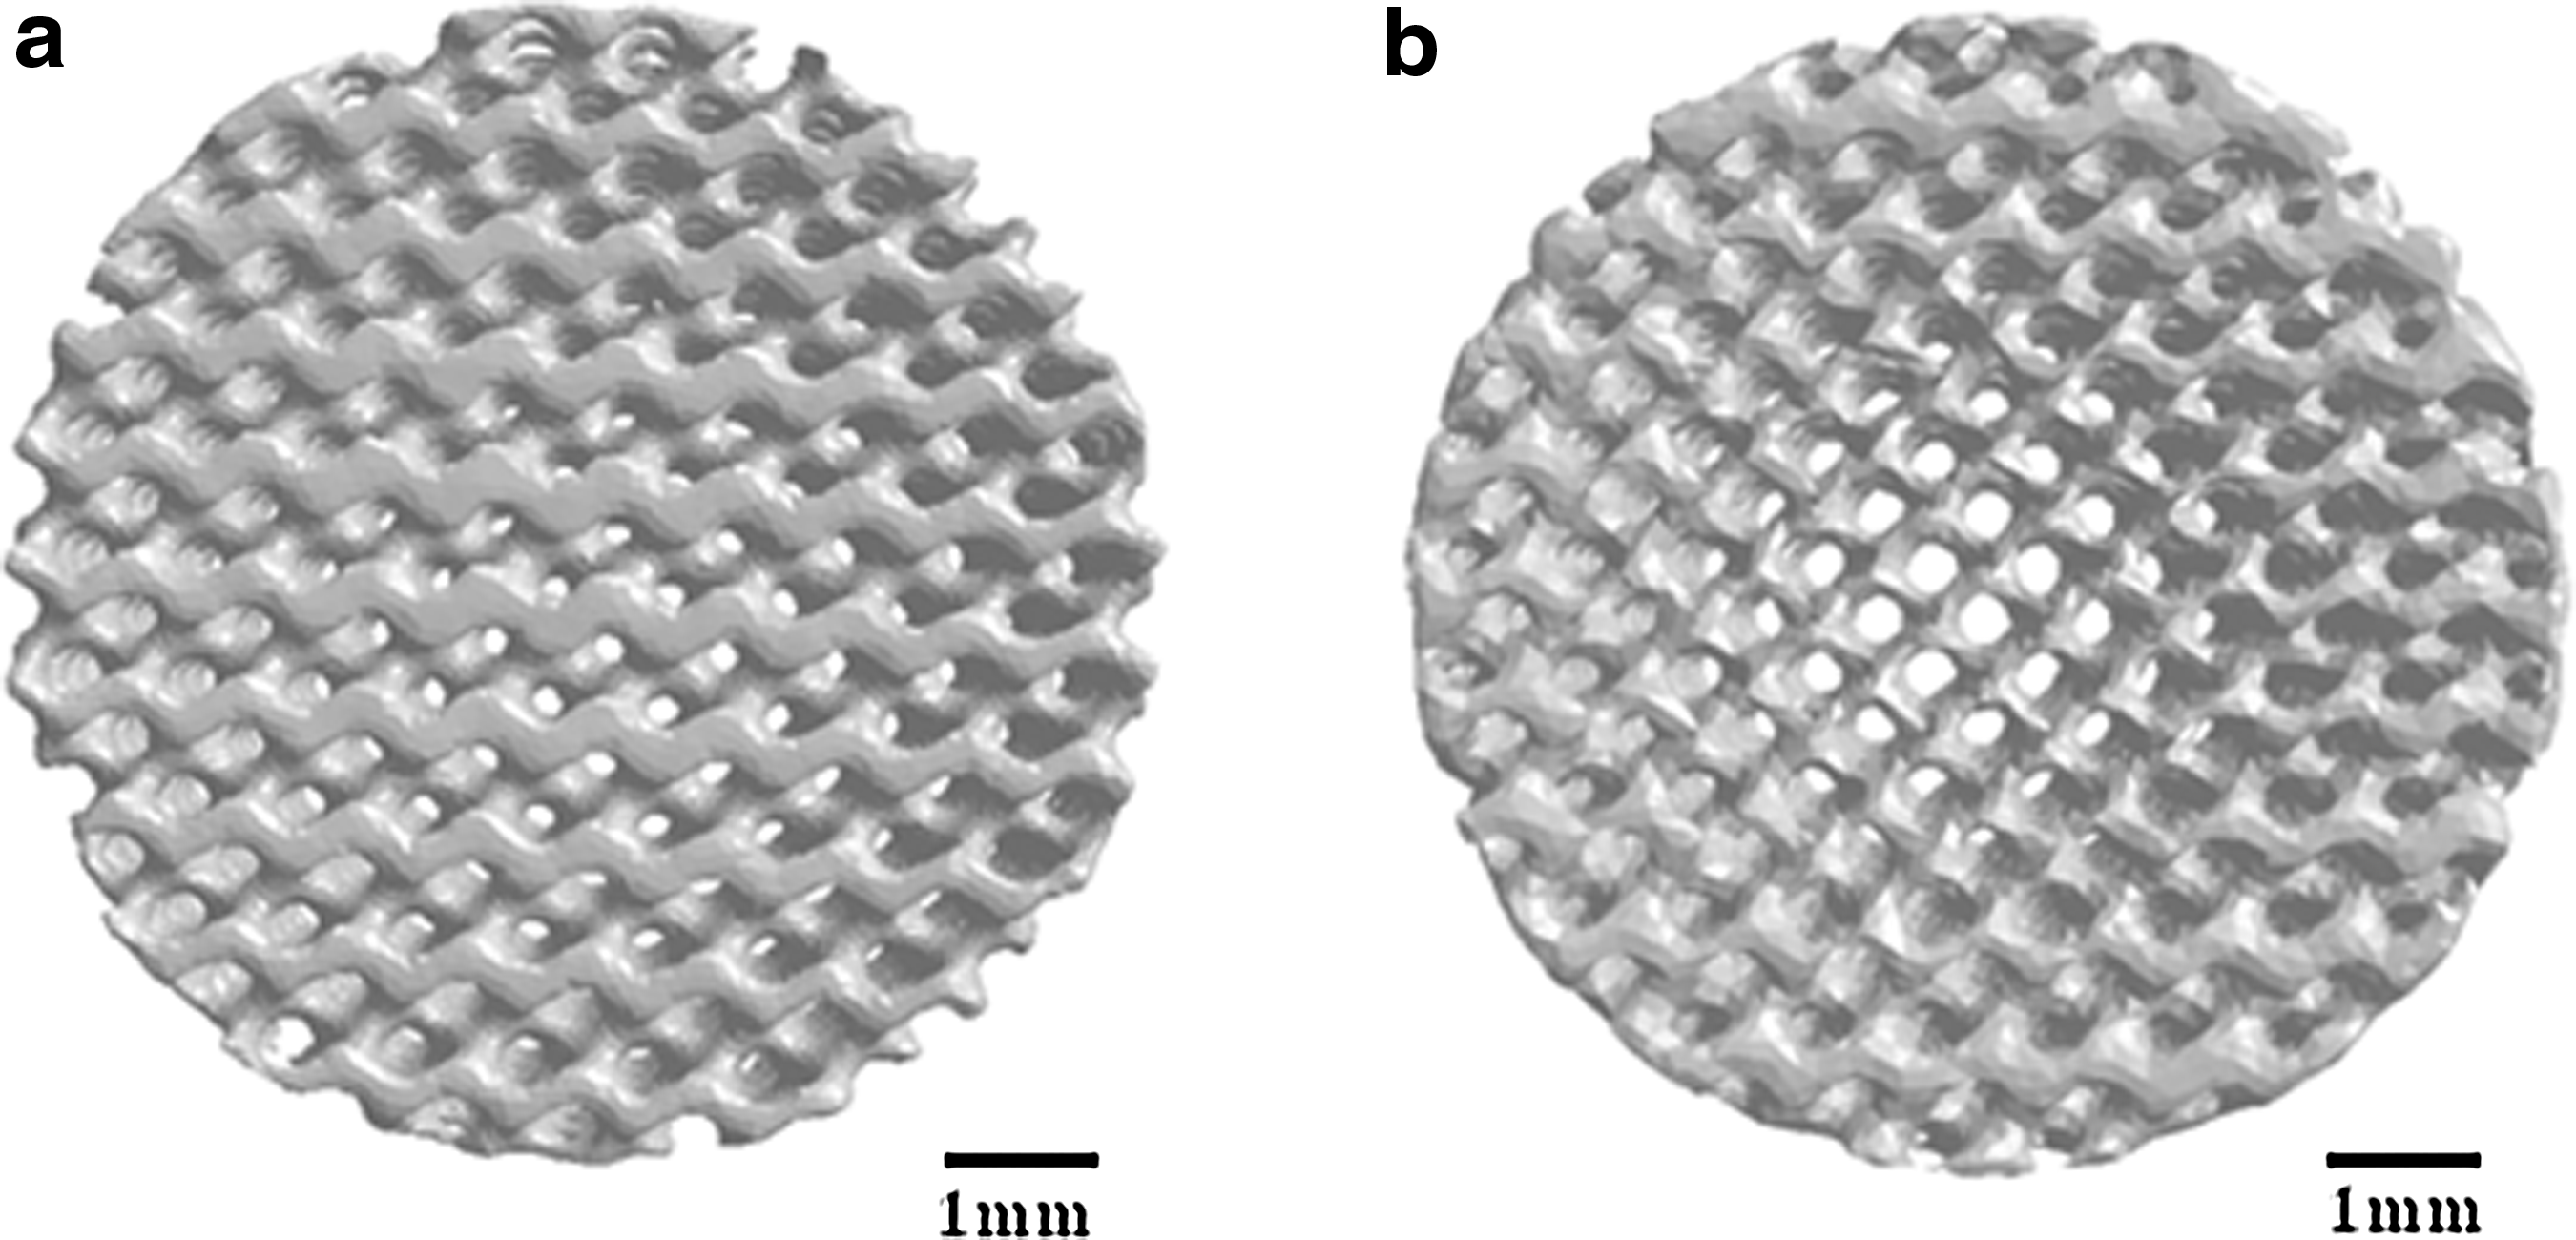
Images of scaffold surface reconstructed from the micro-computed tomography after its fabrication by stereolithography.
Multiphase methodology applied
The cell-seeding process was simulated using a Lagrangian discrete multiphase model in Ansys Fluent 12.1 following an Euler-Lagrange numerical approach. The culture medium Dulbecco's modified Eagle's medium, at 37°C (with a viscosity η of 10−3 Pa-s and density ρ of 103 kg/m3),
25
was treated as a continuous medium solved by the Navier-Stokes equation (Eq. 1) and the continuity equation (Eq. 2), where u and ▿p are the fluid velocity and pressure gradient, respectively.
The fluid was the main phase that carries and drives the motion of the dispersed phase representing the cells. The motion of the cells in the fluid was governed by the translational motion, determined by the Newton's second law (Eq. 3). For this phase, inert spherical particles with diameter dc of 10 μm (average size of a simple chondrocyte
18
), viscosity ηc of 5×10⁻³ Pa-s,
26
density of 103 kg/m3,
27
and surface tension γ of 0.03 N/s
28
were used to mimic the cells. In Eq. 3, u is the fluid velocity, p is the local pressure, uc is cell velocity, FD is the drag force, and FL is defined as the lift force per unit cell mass. The spherical drag force (FD) is the main force to govern cell motion. This force depends on fluid and cells' properties, Reynolds number (Re), and drag coefficient (CD) (Eq. 4).
Gravitational forces or forces generated by the impact between particles are neglected since the volume represented by the particles is very low (0.026 mL) compared to the fluid volume (9 mL). Brownian and thermophoresis forces were not included either since the temperature was considered constant at 37°C. However, the Saffman lift force was accounted for providing more stability on the particle deposition in the viscous model depending of the shear parameter. 29
Transient fluid perfusion conditions
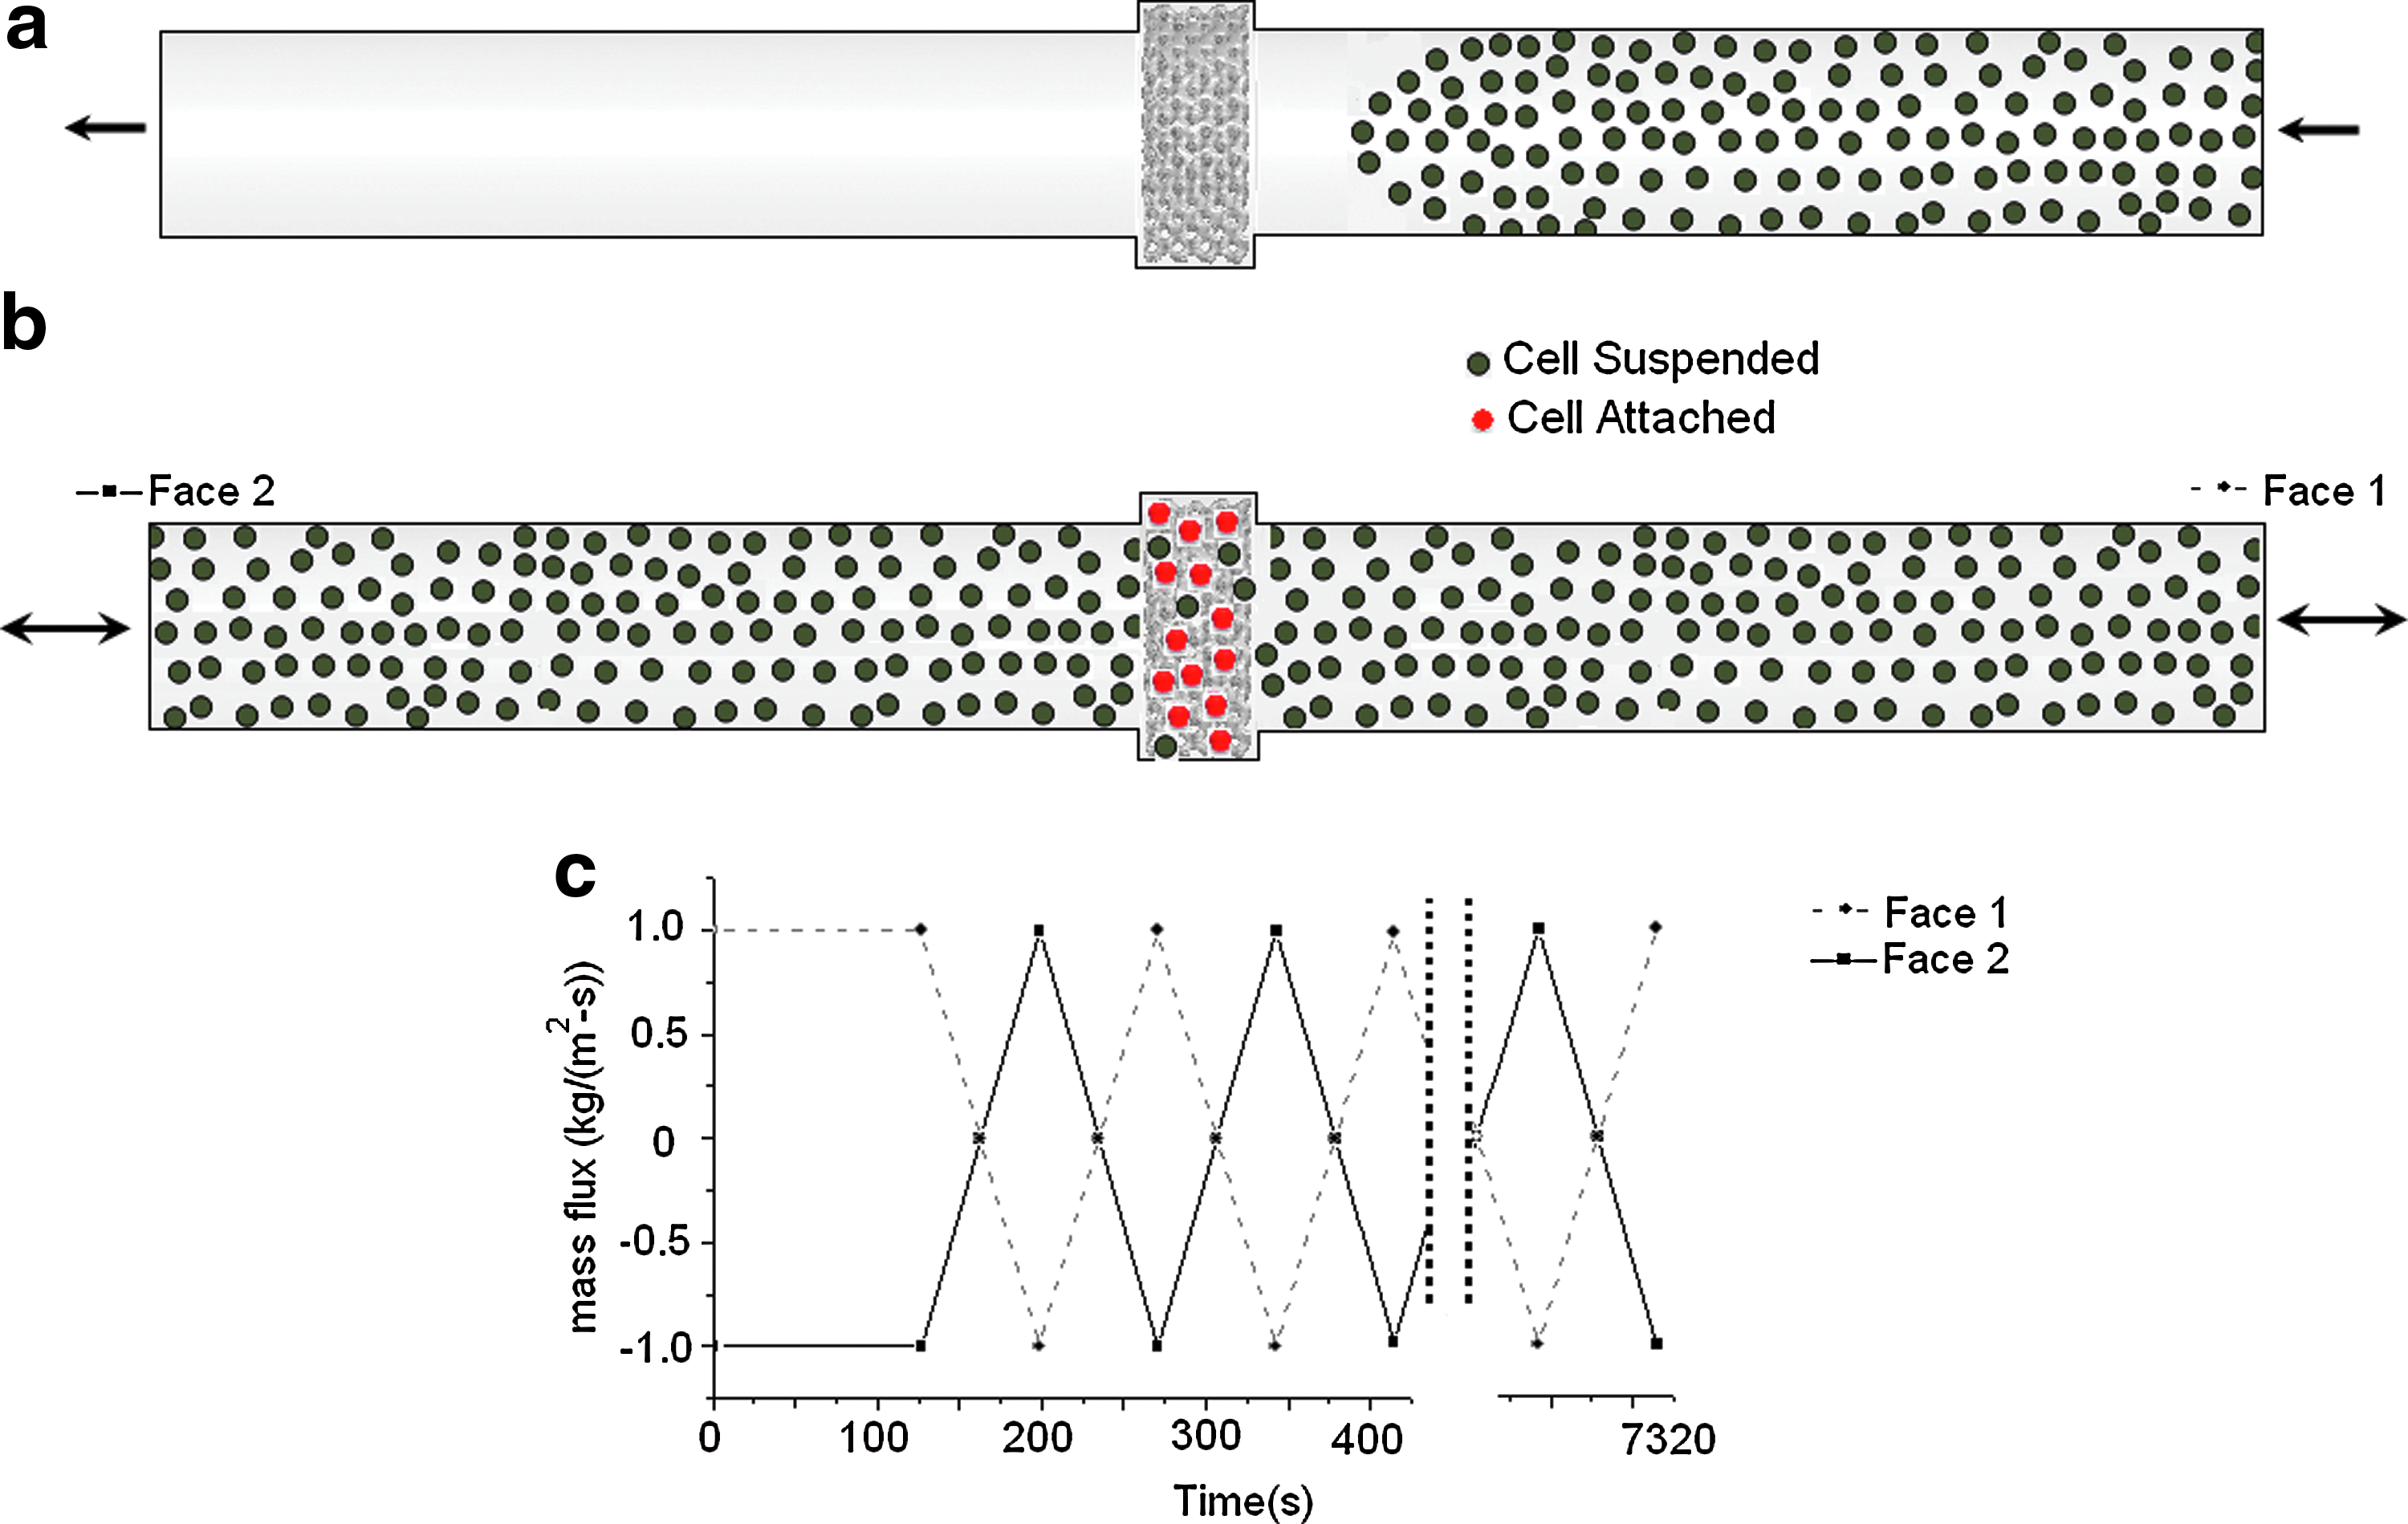
Transient, laminar, and incompressible fluid flow were assumed. Initially, a total of 5 million particles were suspended in the medium through 845 periodic injections every 0.15 s under a constant velocity of 1 mm/s (Fig. 2a). The injected cells did not reach yet the scaffold after the last injection (Fig. 2b). The velocity in the tube was controlled with the imposition of mass-flux mf conditions (Eq. 5) at both ends of the tubes (Fig. 2b), where mfmax is the maximum mass flux (see condition for both face plotted on Fig. 2c). The period T used was equal to 144 s.
20
Dynamic conditions.
Cell–material interactions
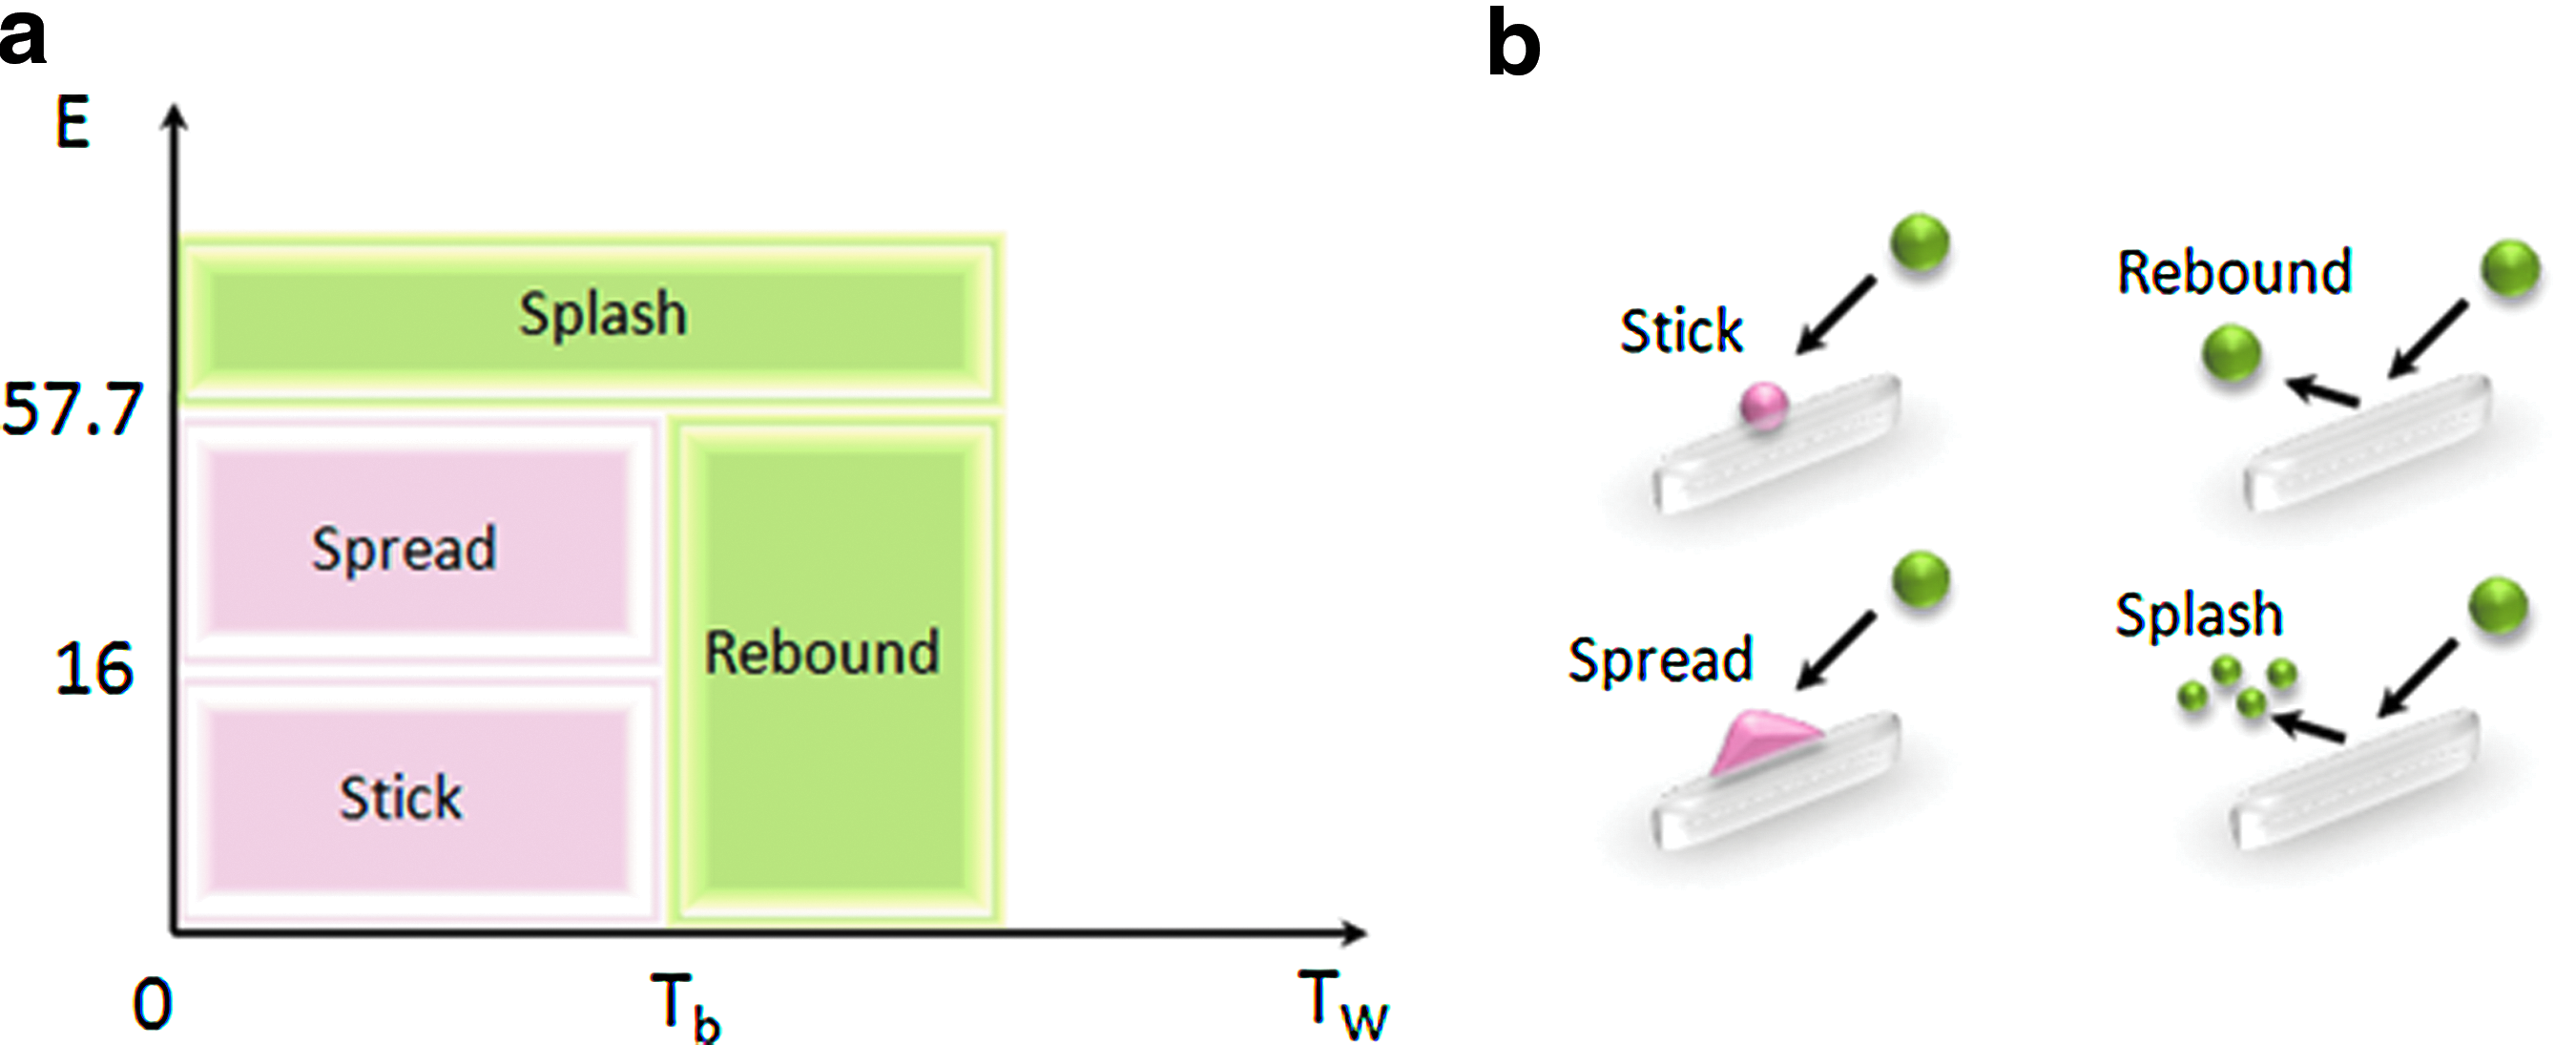
Simplifications were made to simulate cell–material interactions. Nonslip and nonadherence conditions were applied for the silicone tubes and the bioreactor chamber walls. On the scaffold wall, nonslip conditions were applied and cell adhesion was simulated through the wall film formulation30,31 implemented on Fluent 12.1 (ANSYS). The wall film theory was originally designed for the simulation of fuel particles deposited under combustion regime. 30 This phenomenon depends on the wall temperature (Tw) and impact energy (E, dimensionless) of fuel particles under hot (boiling temperature, Tb) and aggressive conditions (high combustion energy) (Fig. 3a). In a biological analogy, both parameters have a low value; therefore, using this approach we can model a stick condition when a particle hits the scaffold wall (Fig. 3b). For these reasons every time a cell hits with the scaffold surface, the cell maintains a spherical shape as reported for the adhesion of chondrocytes. 18 Other cell behaviors can be included when these hit with the scaffold surface, such as they can spread (i.e., attach), splash (i.e., die), or rebound (i.e., not attach or die). However, these conditions were not studied in this study.
Cell-seeding cycle analysis
A total time of 2 h was simulated. For each time step of 36 s, the cell-seeding efficiency was calculated (Eq. 6) as a percentage of the adhered cells Na over the initial suspended cells Nc. The variation of cell concentration C suspended in the fluid volume Vt was also calculated (Eq. 7).
The distribution of cells in the scaffold after simulation was compared with the confocal images reported in the experiment reported by Melchels et al. 20 In both cases, the cell density distribution was normalized in concentric rings of 100 μm of thickness. The difference is that the experiments are analyzed through the confocal images and the values of density are normalized by the area represented by each surface ring. However, from the results of this study, the cell densities were analyzed from positions of cells adhered by each 3D ring.
Results
Kinetics of the perfusion cell seeding
The cell-seeding efficiency after 2 h (or 50 cycles) was 47.5% for type I scaffold and 43.1% for type G scaffold (Fig. 4). The densities of cells attached have always a higher rate for the type I scaffold than for the type G scaffold. For both structures, during the first 30 min the number of cells deposited increases quickly; thereafter, the process reaches a plateau.

Cell seeding efficiencies simulated for 2 h of experiment.
The cell concentration remaining in the fluid for both scaffolds was plotted in Figure 5, assuming that the final cell concentration in the scaffold did not increase after 2 h. Cell concentration decreased with an exponential tendency with time with an R2>0.9 (Fig. 5). Exponential equations were calculated for both structures as shown in Eq. 8, where C0 is the initial cell concentration in the fluid, Ca is the concentration of cells that represents the cells attached, t is time, and k is a kinetic constant related to scaffold design parameters and adhesion factors.

Kinetics of cell concentration in fluid during 2 h of experiment. Exponential tendency from correlations described for two scaffolds.
Cell spatial distributions
The distribution of cells attached onto the scaffolds is shown at different time points (4.8 min, 15 min, 30 min, 1 h, and 2 h) (see Figure 6). A uniform cell distribution was obtained for the isotropic scaffold, and a gradual radial variation of cells attached was observed for gradient scaffold. The number of attached cells increases over time, but it is predicted that cells attach quickly in the initial part of the simulation. It can also be observed how cells are dispersed within the medium in the tube and that the cell distribution in the tube varies depending on the course of oscillation. Under the given fluid flow conditions, it is also predicted that there is insufficient oscillation of the fluid to move the cells from the extreme parts of the tube to the vicinity of scaffold entrance (Fig. 6).

Superior view of cells attached in the type I (top) and type G (bottom) scaffolds. The evolution of increment of cell numbers deposited in each time selected.
Across the depth of the scaffold, the cells were distributed uniformly for both scaffolds (Fig. 7). However, more cells were predicted at the entrance of the scaffold close to the injection side. The effect of having larger pores in the center than at the periphery is clearly shown in a transverse section (Fig. 7).

Cell spatially distributed in scaffold height.
The final cell concentration at 2 h for both scaffolds compares well with the distribution obtained experimentally (Fig. 8). In both cases, cells are distributed evenly for the type I scaffold, while more cells are present in the center than at the periphery for type G scaffold. A quantitative comparison between numerical and experimental results shows that the distribution of cells in the radial direction follows the same trend (Fig. 8). The normalized cell densities for type I scaffold are between 11% and 31% for the experiment and between 6.5% and 14% for the model (Fig. 8). The normalized cell densities for type G scaffold are between 7% and 74% for the experiment and between 2% and 99% for the model (Fig. 8). For low cell density, the experimental cell density is higher than the numerical cell density, while for high cell density, the experimental cell density is lower than the numerical cell density.
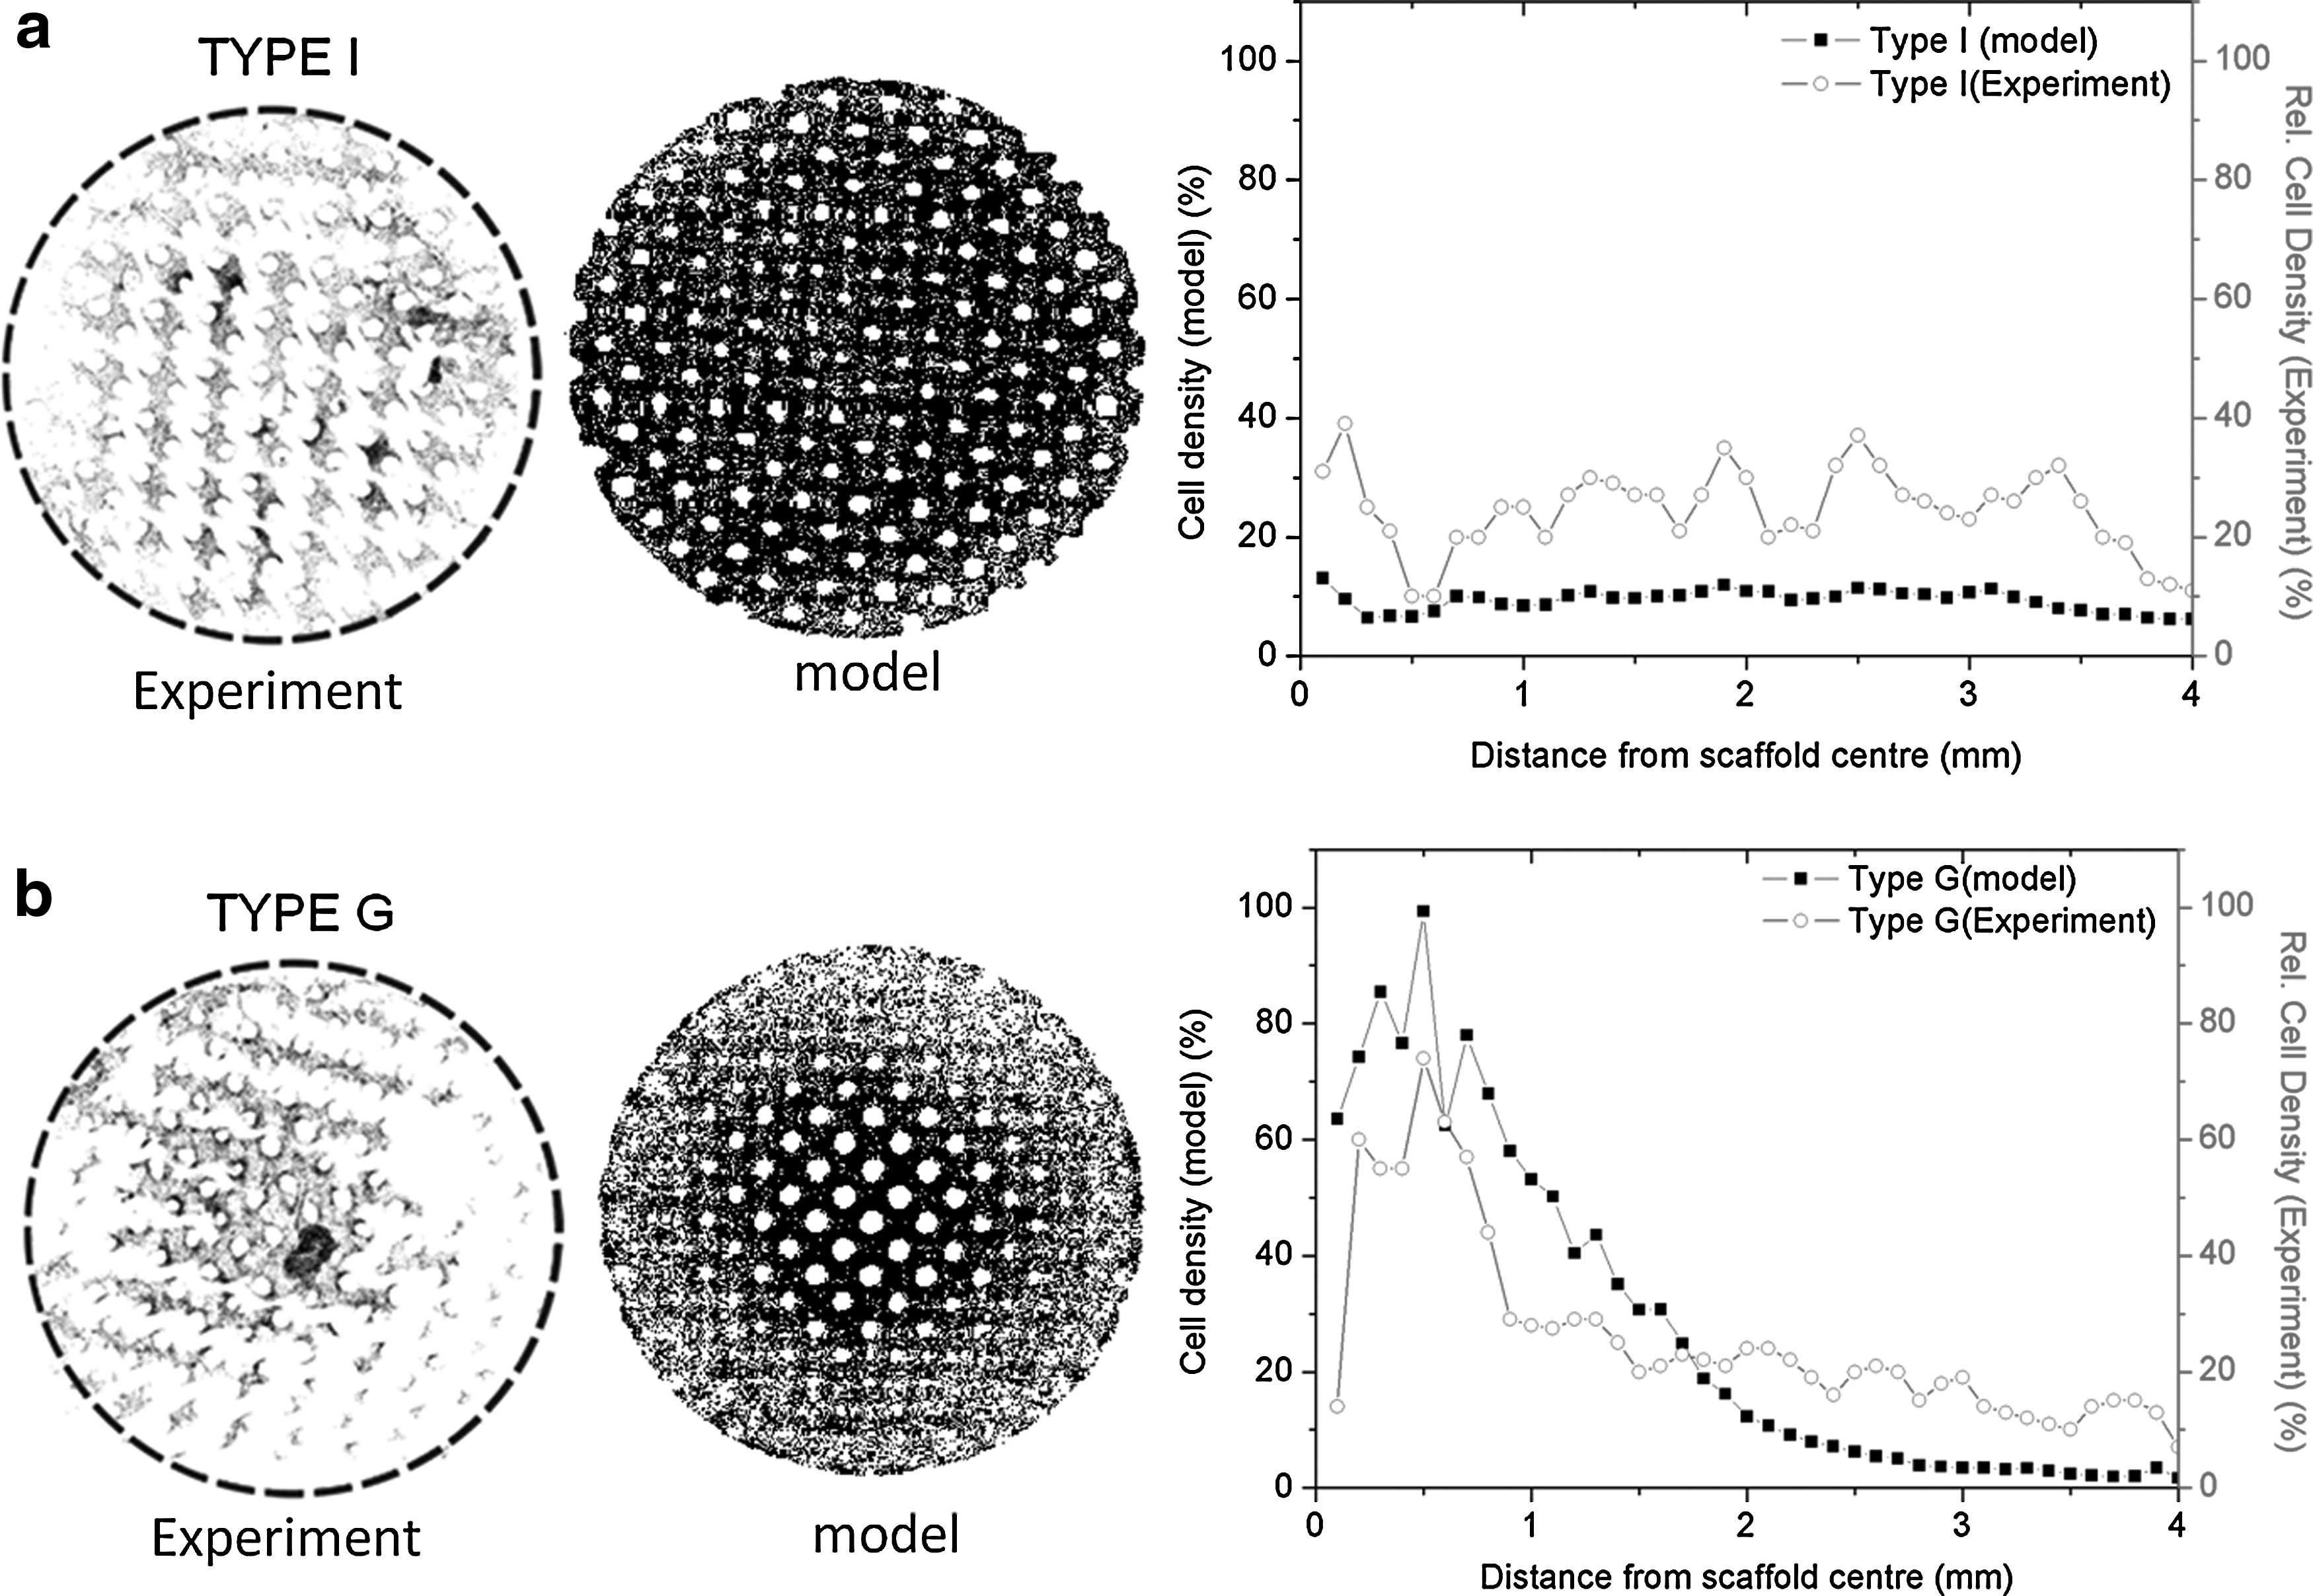
Comparison of radial cell distributions between experiments20 and models with the methodology proposed:
Discussion
A new methodology to simulate cell seeding based on a multiphase approach considering cells as particles was presented in this study. It was shown that the spatial and temporal distributions of cells attached onto two different scaffolds could be predicted. These predictions agree well qualitatively and quantitatively with experiments performed under the same conditions. 20 The results were compared at two distinct time points (2 h for this study and 16 h for the experimental study). Our results indicate that a plateau was reached quickly; therefore, the seeding efficiency is similar at 2 h and at 16 h. Experimentally, 20 the seeding efficiency reported for both designs was between 40% and 60% for a representative number of experiments replicated (three test for scaffold design). 20 To better validate the seeding efficiencies, more time points would be needed for the experimental study. We found similar efficiency values than the perfusion experiment, but under less time of perfusion. This opens the possibility to optimize the seeding process.
Differences between numerical and experimental studies are most related to a lower prediction of cell density for low-level cell density and higher prediction of cell density for high-level cell density. This can be explained by the different methodologies used to measure and calculate the cell number in the experimental and numerical studies, respectively. In the experimental study, cells were counted on a 2D section based on a microscope image. In the numerical study, cells were counted on a 3D section of a total thickness. Thus, the experimental study could overestimate the number of cells when there are few cells, as these cells could be distributed through a thickness and not solely in 2Ds. For high cell density, cells can aggregate; therefore, by sectioning the scaffold it may underestimate the number of cells seen in 2D.
The cell concentration in the fluid decreased in an exponential manner over time for both scaffolds. A similar behavior has been reported by others using other cell-seeding methods (filtration 4 and spinner flask 18 ). This finding enables to optimize the experimental cell seeding of 3D scaffolds by determining numerically the initial cell concentration and optimum seeding time. Another advantage of such methodology is that the oscillation periods of fluid flow, experimental time, and scaffold morphology can be related on a same equation. In this study, it was found that the difference between the total fluid volume with the fluid volume inside the scaffold with the given distance of the tubes and the fluid velocity did not allow sufficient drag for all cells to go through the scaffold at each time step under the experimental condition applied. Such configuration in this study can explain the decrease in the number of deposited cells over time. Nonetheless, the use of dynamic seeding in this study enabled to obtain a uniform cell distribution through the thickness of the scaffold except at the entrance of the scaffold beside the injection side. This may have implications, in particular for scaffolds having low permeability, where seeding might be more difficult to be achieved.
As expected, it was shown that the scaffold design has a critical effect over the cell distribution inside the scaffold. More cells were predicted in the isotropic scaffold than in the gradient scaffold, although both had a similar surface area and overall porosity. This indicates that there may be a lower pore size below which seeding is not effective and that would correspond to the pore size close to the periphery of the gradient scaffold. It was also found that a high number of cells were found in the center of the gradient scaffold with large pore diameter. Since pore-size diameters between 100 and 400 μm 32 have been recommended and that the pore-size diameter was up to 500 μm in this study, it is possible that there is no such pore-size optimization. 33 Instead, the permeability of the scaffold in relation to the scaffold pore morphology may be more important than the actual pore size, since it is more directly related to mass transport and fluid flow distribution. 20
The main limitations of this new method are related to the biomaterial–surface effect. Cells were assumed to attach as soon as they hit the scaffold wall. In reality, the cell–biomaterial interactions are more complex and depend to a large extent on the biochemical and biophysical properties of the scaffold surface-like hydrophobicity, potential charge, chemical composition, material stiffness, or material functionalization. However, we have shown that with this first approach, the main patterns of cell adhesion could be predicted; therefore, the bioreactor fluid conditions might be the main factor driving cell adhesion once the biomaterial is biocompatible to the type of cells used. Further work could include such interactions by customizing the adhesion properties of the particles by allowing bouncing of the particles depending on the energy, angle of incidence, or velocity of the particle when it hits the scaffold wall. It also remains to be confirmed whether the local velocity of the particles is similar to the velocity of a cell. Such comparison could be made by tracing the cells in a transparent scaffold using a particle imaging velocimetry. 34 For example, Meinders and Busscher 35 suggested that dynamic phenomenon of adhesion depends on the velocity near the scaffold wall.
This study opens the possibility to apply this methodology to other bioreactor conditions, scaffold microstructures, or cell concentrations. This new method can, therefore, be used before any in vitro cell seeding to reduce the amount of in vitro tests and improve the reliability of the cell-seeding protocol under a given set of conditions. In the future, the influence of the fluid shear stress on cell adhesion with respect to different types of biomaterial surfaces could be studied in a realistic 3D bioreactor environment.
This new methodology to simulate cell seeding is an important advance in the application of numerical methods to tissue engineering, because it allows the prediction of the fundamental initial stage of cell attachment, which triggers cell migration, proliferation, and differentiation. The output of such simulation could also be used to simulate the subsequent cellular processes of proliferation and differentiation to simulate functional tissue formation.21,36–39 Therefore, this opens up the development of novel mechanobiological models that are able to predict the tissue formation within tissue engineering scaffolds with more accuracy. The idea presented in this study leads to oncoming of the numerical-prediction biomedical application (i.e., drug delivery, infection through wear particles in the joint prosthetic joint [hip], or control of surface coating with molecules).
Footnotes
Acknowledgments
The present study was funded by the European Research Council (ERC grant agreement no. 258321) and the Spanish International Agency of Cooperation.
Disclosure Statement
No competing financial interests exist.