
Abstract
This study instituted a simple approach to stimulate alveolar bone regeneration for tooth tissue engineering by controlling effects of low fluid dynamic shear stress (LFDSS) on growth and differentiation in vitro. Human alveolar bone-derived mesenchymal stem cells (hABMSCs) harvested from human mandibular alveolar bone were cultured with LFDSS to generate cultures containing bone-like formations. To distinguish between osteodifferentiation and bone-like formation, cells were cultured either with or without fluid shear stress. The calcium content and alkaline phosphatase (ALP) activity of hABMSCs were used as indicators of osteogenesis. Cell viability and proliferation after stimulating with LFDSS for 10–60 min/day were higher than with longer stimulations. Mineralized nodules formed when osteoblasts were cultured with an induction medium, a marker of osteogenic differentiation. ALP activity tended to increase after 10 and 60 min/day of stimulation. In addition, LFDSS conditions also increased gene expression of IBSP, RUNX2, COL-I, ALP, OCN, and OPN, as shown by reverse transcriptase–polymerase chain reaction. From the results of a proteomics array, LFDSS groups were intensely expressed with several factors (EGF, HGF, IGF, TGF, and PDGF). Furthermore, CD146 and Stro-1 expression increased in cells treated with 30 min/day and decreased in cells treated with 120 min/day, as determined by cell surface antigen analysis by fluorescence-activated cell-sorting analysis. These results strongly showed that LFDSS at the proper intensity and time enhanced the differentiation and maturation of hABMSCs. In conclusion, an appropriate level of LFDSS can potently and positively modulate proliferation and differentiation in hABMSCs.
Introduction
To date, many studies have correlated the magnitude of the interfacial shear stress with cell behaviors, such as metabolite production and alkaline phosphatase (ALP) activity in osteoblasts.1,2 In bone cells, mechanical loading stimulates bone formation, suppresses bone resorption, and leads to increased bone mass. Mechanical loading strains the mineralized matrix of bone in a manner that is thought to generate interstitial fluid flow. 3 This fluid flow exerts shear stress at surfaces of osteoblasts and osteocytes lining these spaces. This shear stress generates biochemical signals in the nucleus of bone cells to exert biological effects.4,5 Fluid shear affects the expression of osteogenic signals in mesenchymal stem cells (MSCs).6–8 Mechanical stimulation also increases the expression of connexins, both in vitro and in vivo. Connexins allow intercellular communication about a cell's mechanical environment. 9
Many studies reported that fluid shear stress, in particular as low as 0.01 dyn/cm2, during short periods could be affected to osteogenic signal expression. Fluid shear stress is considered to be one of the most key stimuli for activating mechanotransduction. This fluid flow exerts a shear stress at surfaces of osteoblasts and osteocytes lining these spaces, and the shear stress then generates biochemical signals that transduce to the nucleus of bone cells to exert biological effects. 7 These signaling pathways include to activation of more members of the mitogen-activated protein kinase (MAPK) family, which indicate extracellular signal-regulated kinases (ERK)-1 and 2, and interaction with the integrin-signaling pathway. 7
These former studies indicated that cells exposed to shear stress could produce more calcium, collagen, and something like as well as components of the bone extracellular matrix. As many studies reported that fluid shear stress, in particular as low as 0.01 dyn/cm2, during short periods could be affected to osteogenic signal expression, fluid shear stress is thought to be one of the most important stimuli for activating mechanotransduction.10,11
There are primary theories of how mechanosensing occurs, which involve activated ion channels, integrins, deformed cytoskeleton, and connexins.9,12 Shear stress in cells can strain the cell membrane, causing Ca2+ channels to open. The influx of Ca2+ ions activates intracellular enzymes such as phospholipase C and protein kinase C, and depolarizes the membrane, leading to more voltage-gated channels opening and more ions entering. 12 Integrins also play a role in mechanotransduction by transmitting external forces to the cytoskeleton. As the cytoskeleton is deformed, there are more sites where focal adhesions can form and mechanically link to the extracellular matrix.
Thus, the purpose of our research was to investigate the ability of an appropriately characterized LFDSS treatment to easily enhance the growth and differentiation of hABMSCs in vitro. Alveolar bone cells have a unique origin and functionality, but may resemble skeletal osteoblasts. This article reports preliminary findings of how stimulation by LFDSS affects cell proliferation and differentiation.
Materials and Methods
Culture of hABMSCs
hABMSCs were collected by the Intellectual Biointerface Engineering Center, Dental Research Institute, College of Dentistry, Seoul National University. Cells were cultured in an α-minimum essential medium (MEM) containing 10% fetal bovine serum (FBS; Welgene. Inc.), 10 mM ascorbic acid (L-ascorbic acid), 100 U/mL penicillin, and 100 μg/mL sodium bicarbonate at 37°C in a humidified atmosphere of 5% CO2 (Steri-Cycle 370 Incubator; Thermo Fisher Scientific). The medium was changed every other day. hABMSCs were cultured for 24 h to facilitate attachment. Before the cells became confluent, they were detached with 1 mL trypsin–ethylenediaminetetraacetic acid (EDTA), counted, and passaged. Cells were generally used between three and five passages.
All protocols for human tissue handling were developed under the guidance of the legal regulations for human tissue and organs of an experimental protocol approved by the Institutional Review Board (IRB No. CRI05008) of Seoul National University Dental Hospital (Seoul, South Korea). Dental tissues were cultured according to the method described. 13
Figure 1A showed representative fluorescence images of hABMSCs, indicating the cell morphology. Figure 2B also was a fluorescence-activated cell-sorting (FACS) analysis of the positive surface markers, Stro-1 and CD146, and the negative marker CD34. A mineralized bone matrix was induced as described previously. 14 Briefly, for the differentiation study, 3×10⁴ hABMSCs/well were plated in a 24-well dish and cultured in an α-MEM supplemented with 10% FBS, 100 U/mL of penicillin, 100 mg/mL of streptomycin, and 10 mM ascorbic acid for 1 day. Then, the cells were incubated with an osteogenic medium (100 nM dexamethasone, 50 μg/mL ascorbic acid, and 10 nM β-glycerophosphate; Sigma) for another 14 or 21 days.

Representative immunocytochemistry images of human alveolar bone-derived mesenchymal stem cells (hABMSCs)

A mathematical model for quantifying low fluid dynamic shear stress (LFDSS) in a rocking culture method
27
: schematic diagram of a simple rocking culture method as wave motion
Stimulation treatment of LFDSS
LFDSS condition was conducted using a rocking culture system (Vision Ltd.). We calculated the wall shear stress using the mathematical model described by X. Zhou et al. (2010) with culture dishes fixed on a platform in the vertical plane to prevent slipping. 15 Schematic diagram of a simple rocking culture method as wave motion is as shown in Figure 2A, indicating the side view of a culture dish (a), the entire bottom of dish covered by the medium (b), and peripheral regions as rocking (c). There were six treatment groups, stimulated for 5, 10, 30, 60, and 120 min/day. Culture dishes were separated by at least 10 mm. A Nunc dish of culture medium, rocking up and down±20°C at 0.5 cycles per second, generated a moderate LFDSS condition, from 0.01 to 0.0205 dyn/cm2 (max. 0.00205 Pa).
Figure 2B shows computational fluid-dynamic simulations of the shear stress profiles within the rocking culture model. The parabolic velocity profile is reflected by the higher fluid flow (red pixels) in the center (blue pixels) of the rocking culture model. The column scale bar indicates the shear stress magnitudes (Pa).
Cell viability, FE-SEM morphological analysis, in vitro cell migration assay, and DNA analysis
Cell viability was measured by the WST-1 assay (EZ-Cytox Cell Viability Assay Kit®; Daeillab Service Co., Ltd.), a colorimetric assay that measures the cleavage of a tetrazolium salt added to the culture medium. The tetrazolium salt, WST-1, is cleaved into water-soluble formazan by the succinate–tetrazolium reductase system, which is only active in the mitochondria of viable cells. Therefore, the amount of the formazan dye is directly proportional to the number of living cells. 16 The formazan dye produced was quantified by a multiwell spectrophotometer (Victor 3; Perkin Elmer) by measuring the absorbance at 460 nm.
Cell morphologies of hABMSCs were observed by a field-emission scanning electron microscope (FESEM; JEOL, JSM-5410LV) at a 2-kV accelerating voltage. An in vitro migration study was also used to make sure that the cells are moving in determining cell proliferation.
In vitro cell migration was assessed by CytoSelect™ Wound Healing Assay as the manufacture's protocols. Wound closure was measured by microscopy for up to 72 h, and photographs were taken. Cells were cultured with or without LFDSS, and the cell morphology was periodically observed by phase-contrast microscopy (Nikon TS100).
DNA concentration was quantified by fluorometry using the CyQUANT® Cell Proliferation Assay Kit (Invitrogen) and the λ DNA standard (Invitrogen). The CyQUANT is based on a strong increase in fluorescence of the CyQUANT GR dye when it binds cellular nucleic acids. To prevent CyQUANT dye from binding to RNA, samples were pretreated with DNAse-free RNAse (Sigma), 17 although some protocols use CyQUANT-GR reagent binding to both DNA and RNA to determine cell viability. This method is rapid and does not rely on cellular metabolic activity, unlike procedures that rely on tetrazolium dyes or 3H thymidine incorporation. Fluorescence was measured using a Cytofluor II fluorescence multiwell plate reader with excitation of 485 nm and emission of 530 nm. 18
Reverse transcriptase–polymerase chain reaction analysis
Reverse transcriptase–polymerase chain reaction (RT-PCR) was used to measure the expression of various osteogenic factors. After 2 weeks or 3 weeks in LFDSS culture, total RNA was isolated with TRIzol reagent (Invitrogen) and used to synthesize cDNA using a first-strand cDNA synthesis kit (Invitrogen) according to the instructions of the manufacturer. The human primers used in this study are listed in Table 1. The products were separated by electrophoresis on a 1% agarose gel (SeaKem ME; FMC Bioproducts) and visualized by ultraviolet-induced fluorescence. Band intensities were quantified using ImageJ software. Each band was normalized to the control group.
ALP, alkaline phosphatase; GAPDH, glyceraldehyde-3-phosphate dehydrogenase; COL-I, collagen type I; RUNX2, runt-related transcription factor 2, OPN, osteopontin; IBSP, integrin-binding sialoprotein, OCN, osteocalcin.
ALP activity assay, mineralized nodule formation of alizarin red, and von Kossa staining
ALP is another marker of osteoblastic differentiation. It is a marker of early osteoblastic differentiation and commitment of marrow stromal cells toward the osteoblastic phenotype. 19 Also, we also examined the cell behavior of LFDSS on ALP activity. ALP activity assay was quantified spectrophotometrically using the SensolyteTM ALP Assay kit (AnaSpec®) according to the manufacturer's instructions. Cells were centrifuged at 2500 g for 10 min at 4°C, and enzyme activity was calculated by measuring the yellow p-nitrophenol product formed based on the absorbance at 405 nm (Victor 3; Perkin Elmer).
Cells were placed in a culture dish and cultured for 14 days in an osteogenic medium, with and without LFDSS. Cell conditions and nodule formation were checked routinely by phase-contrast microscopy. The presence of mineralized nodules (calcium deposition) was determined by alizarin red staining, as described. 19 Briefly, cells were fixed with 10% formalin, then rinsed with DW (distilled water), and finally stained for 1 h with 40 mM alizarin red-S (pH 4.2), and extensively rinsed with water. After obtaining differentiation images of the cells, the bound stain was eluted with 10% (wt/vol) cetylpyridinium chloride, and the alizarin red-S in the samples was quantified by measuring the absorbance at 562 nm. Vitamin C, β-glycerophosphate, alizarin red-S, and cetylpyridinium chloride were obtained from Sigma-Aldrich.
hABMSCs were also cultured for 14 days in an osteogenic medium to investigate assessment of mineralization using von Kossa staining, with and without LFDSS. Cells were fixed with 4% (wt/vol) formaldehyde in phosphate-buffered saline (PBS) during 15 min, and the cells were incubated in 5% (wt/vol) silver nitrate (Sigma-Aldrich) for 1 h on the UV light condition, followed by incubation in 5% (wt/vol) sodium thiosulfate (Sigma-Aldrich) for 5 min. The wells were finally rinsed with twice DW and air-dried, and captured mineralization images using an optical microscope.
Sodium dodecyl sulfate–polyacrylamide gel electrophoresis and human growth factor antibody array analysis for LFDSS
The Laemmli buffer system was carried out to cast a 5% stacking gel and 6% to 15% gradient-resolving gel. After denaturation at 100°C for 3 min, proteins were resolved at a constant 120V in Bio-Rad mini-Protein II apparatus until the bromophenol blue reached the bottom of the gel and visualized with Coomassie blue. For the highly concentrated protein bands at 250–75, 37–25, and 20–15 kDa, the band area was 20 times diluted and reloaded on the same sodium dodecyl sulfate–polyacrylamide gel electrophoresis (SDS-PAGE). 20
The human growth factor antibody array analysis was performed according to the manufacturer's protocols (RayBio™ Human Growth Factor Antibody Array; RayBiotech, Inc.). The positive control was four spots (red box) each, and located in upper left and lower right of each membranes, whereas the negative control was also four spots located in upper positive spots alongside of each membrane.
Fluorescence microscopy analysis
Cells were washed in PBS (Sigma-Aldrich), fixed in a 4% paraformaldehyde solution (Sigma-Aldrich) for 20 min, and permeabilized with 0.2% Triton X-100 (Sigma-Aldrich) for 15 min. Cells were incubated with TRITC-conjugated Phalloidin, anti-Vinculin (millipore FAK100), its secondary antibody (Millipore; Cat. No. AP124F), and 4, 6-diamidino-2-phrnykinodole (DAPI; Millipore) for 1 h to stain actin filaments, focal contracts, and nuclei, respectively. Cells were mounted in glycerol/buffer on a glass slide after extensive washing with PBS. Images of labeled cells were acquired by a fluorescence image restoration microscope (Applied Precision).
Vascular endothelial growth factor quantification using enzyme-linked immunosorbent assay
For the measurement of levels of vascular endothelial growth factor (VEGF) production of hABMSCs, an ELISA kit with antibodies (Quantikine human VEGF; R&D Systems) was used. The culture supernatants were collected to quantify the levels of VEGF produced by hABMSCs in vitro after 24 h. The assay's protocol was carried out according to the instructions of the manufacturer. Absorbance was measured using a microplate reader (Sunrise™; TECAN) at 450 nm. Each sample was measured in triplicate.
FACS analysis
The expression of cell surface markers was determined by FACS analysis. Cells were prepared as a single-cell suspension at 1.0×10⁶ cells/mL in their third passage. After digesting with trypsin–EDTA, cells were fixed with 4% PFA for 10 min. Cells were resuspended in 1% BSA (ICN Biomedicals) blocking buffer, and incubated with a primary STRO-1 antibody (sc-47733; Santa Cruz Biotechnology, Inc.). An antibody against the human antigen CD146 was purchased from BD Sciences, and the antibody against CD34 was purchased from Ancell. About 1.0×10⁶ cells were resuspended in 200 μL of PBS and incubated with fluorescein isothiocyanate (FITC)-conjugated antibodies for 20 min at room temperature (or for 45 min at 4°C). The fluorescence intensity of the cells was evaluated by a flow cytometry (FACScan; BD Sciences, Inc.), and the data were analyzed using the CELLQUEST software (BD Sciences, Inc.).
Statistical analysis
SAS Statistical Analysis System for Windows v8.2 (SAS Institute, Inc.) was used for statistical analysis. Statistical significance between control and treatment groups was compared with two-way analysis of variance and Duncan's multiple range tests at p<0.05. The data are reported as mean±standard deviation.
Results and Discussion
Cell morphology, FE-SEM morphological analysis, and cell viability
For investigating stem cell information, we measured the cell morphologies of hABMSCs via immunocytochemistry, and analyzed positive markers using FACS. The hABMSCs were cultured in a normal culture medium. Representative immunocytochemistry images of hABMSCs are shown in Figure 1A. The cultured cells showed the cell shape of hABMSCs, indicating cell nuclei (a), actin filaments (b), vinculin (c), and merged images (d) of the fluorescence stains.
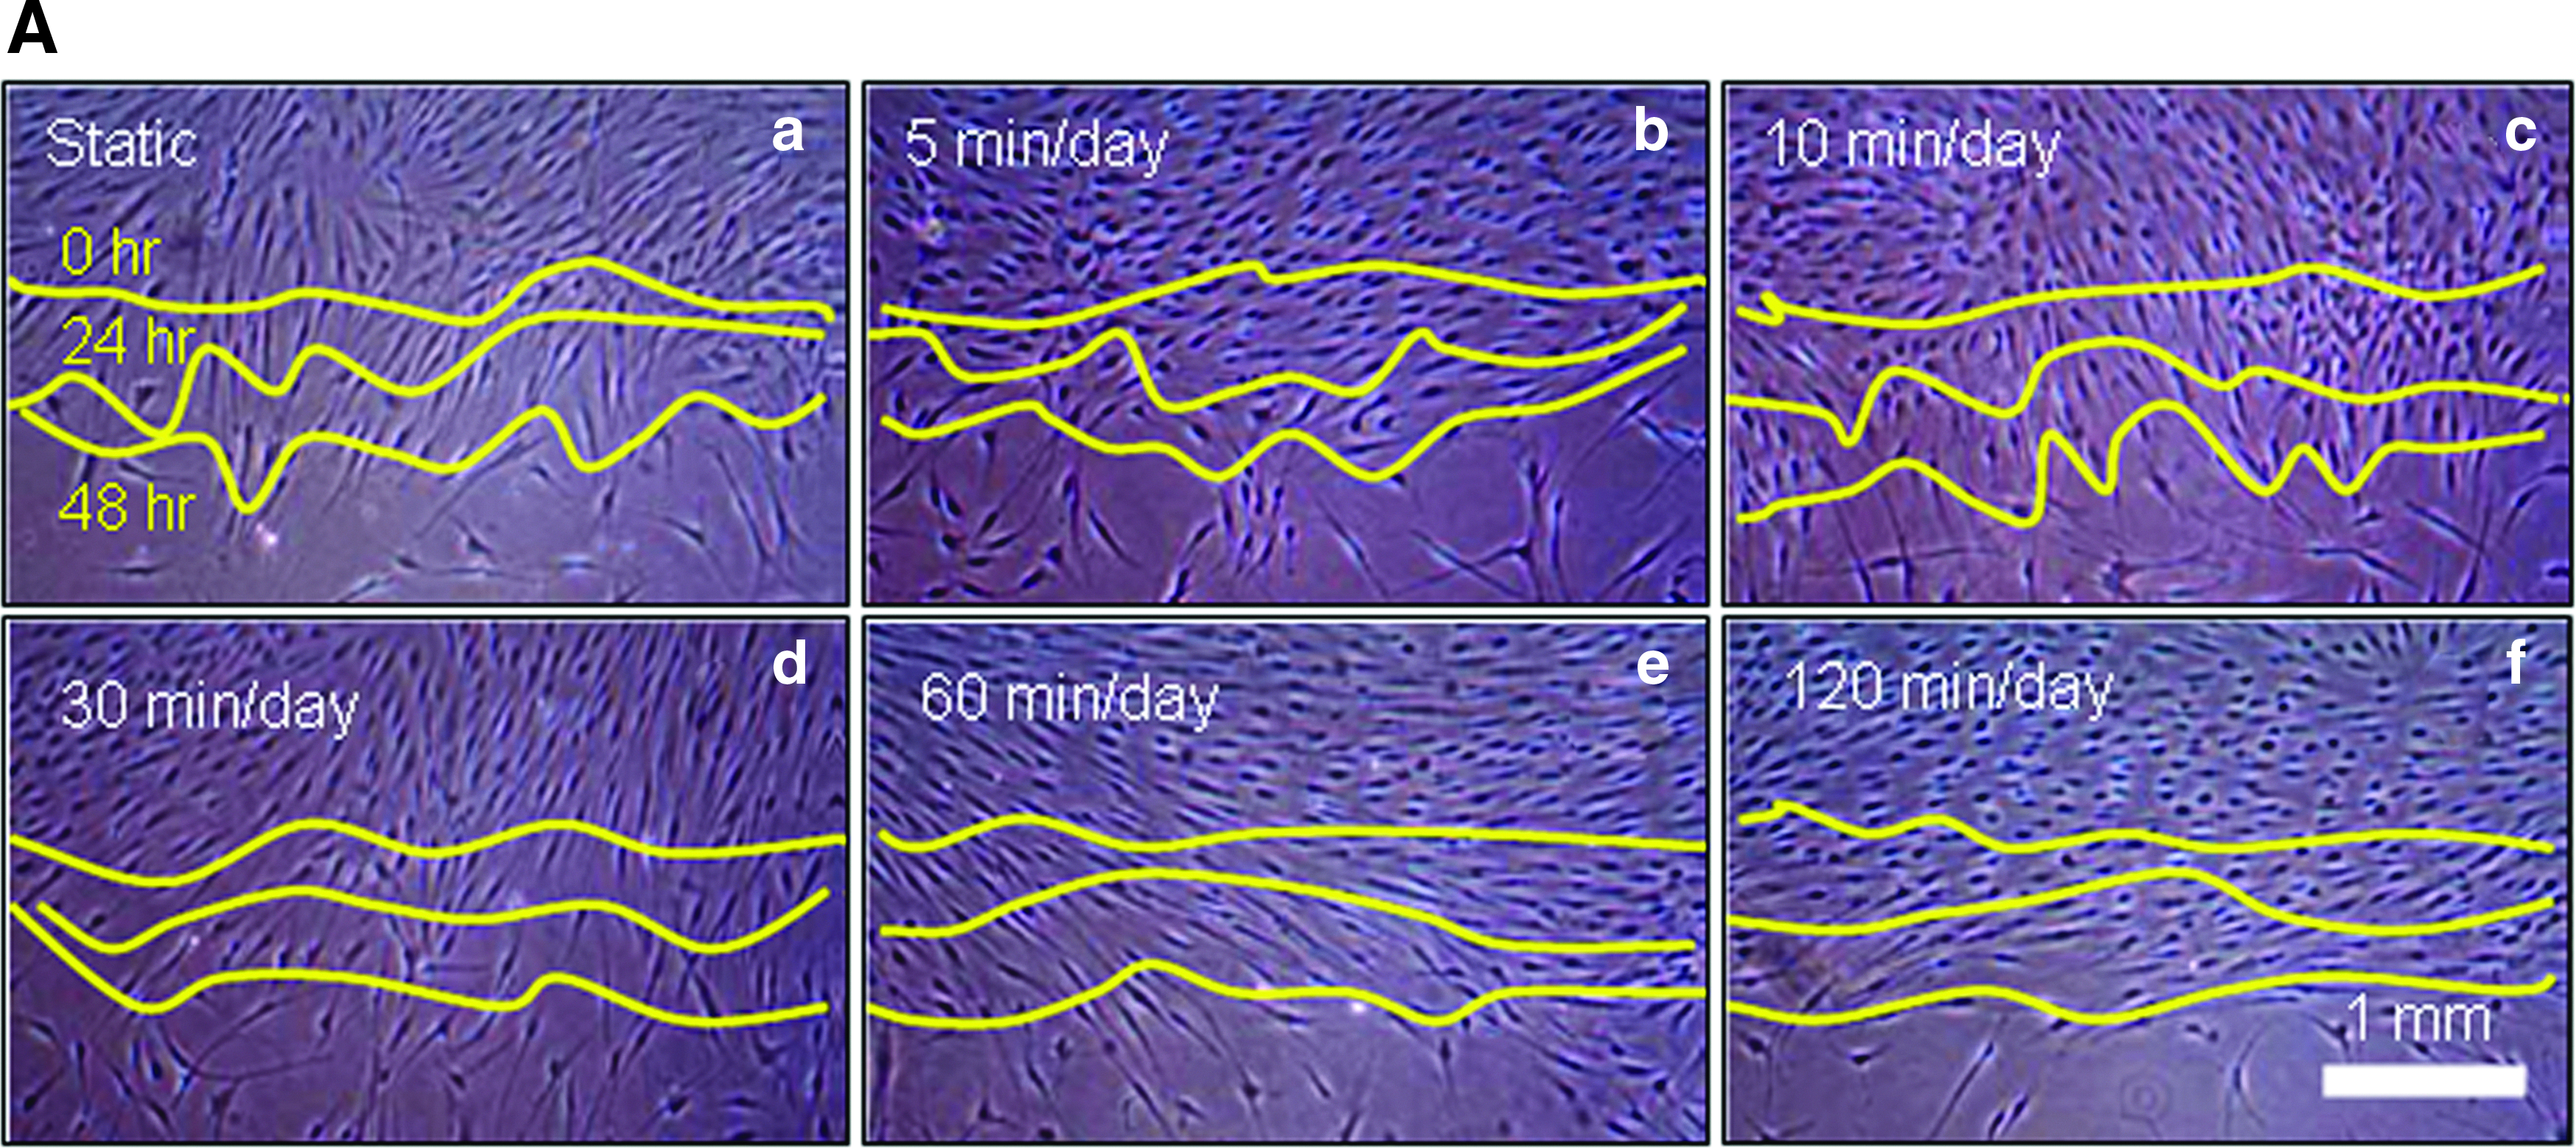
FACS analysis of the surface markers used in this study was the positive markers, Stro-1 and CD146 and the negative marker, CD34 (Fig. 1B). Stem cells from hABMSCs also expressed CD146 (c) and Stro-1 (d) as an MSC marker. When stimulating hABMSCs, cell morphologies showed representative optical microscopic images of hABMSCs stimulated for 4 days in a static condition (a) or at 5 min/day (b), 10 min/day (c), 30 min/day (d), 60 min/day (e), and 120 min/day (f) LFDSS condition (Fig. 3A).

Representative optical microscopic images of hABMSCs stimulated for 4 days in static condition (a) or at 5 min/day (b), 10 min/day (c), 30 min/day (d), 60 min/day (e), and 120 min/day (f) LFDSS condition
In addition, we obtained representative FE-SEM morphologies of hABMSCs stimulated for 2 days in a static condition (a) or at 5 min/day (b), 10 min/day (c), 30 min/day (d), 60 min/day (e), and 120 min/day (f) LFDSS condition (Fig. 3B). As shown in the cell images of LFDSS compared to those in the static culture, stimuli groups, in particular 10 min/day and 30 min/day, were much higher cell density than static culture, while the long-time LFDSS group, 120 min/day, showed significantly lower cell density image.
Besides, representative FE-SEM morphologies of hABMSCs showed cell shape stimulated for 2 days in static condition (a) or at 5 min/day (b), 10 min/day (c), 30 min/day (d), 60 min/day (e), and 120 min/day (f) LFDSS condition (Fig. 3B). White arrows indicated behavior as cell direction. Cell metabolic viability as optical density of hABMSCs measured using WST-1 (Fig. 3C). Overhead brackets with asterisks indicate statistically significant differences between groups. This value indicated not much higher than control group, while LFDSS group, 10 min/day, was statistically significant.
Cell proliferation and in vitro migration
Cell proliferation as shown in Figure 3D was indicated as a DNA concentration (percent of initial) of hABMSCs measured using the CyQuant cell proliferation assay kit (Fig. 3D). The proliferation of cells stimulated for the 10 min/day LFDSS group increased by 10% compared to the control (p<0.05). As a consequence, both cell viability and cell proliferation were statistically significant at the 10 min/day LFDSS group. In vitro migration assay of hABMSCs also is shown in Figure 4A.
In vitro cell migration as representative optical microscopic images with LFDSS stimulus groups compared to static culture
In vitro cell migration as representative optical microscopic images with LFDSS stimulus groups compared to static culture indicated that the stimulation group exposed at the 10 min/day LFDSS group was statistically significantly different (*p<0.05) among groups (Fig. 4B). Stimulation of cells has been associated with increased collagen deposition, enhanced ion transport and amino acid uptake, fibroblast migration, and ATP and protein synthesis. Therefore, LFDSS treatment may affect the control of intracellular ions, especially Ca2+, as well as mRNA expression, protein synthesis, and gene expression. 11
Fluorescence microscopy analysis
Representative optical fluorescence microscopy images (Fig. 5) of hABMSCs cultured for 4 days were obtained in static conditions (a1–d1) or at 5 min/day (a2–d2), 10 min/day (a3–d3), 30 min/day (a4–d4), 60 min/day (a5–d5), and 120 min/day (a6–d6) LFDSS stimulus groups: cell nuclei (a1–d6), actin filaments (b1–b6), vinculin (c1–c6), and merged images (d1–d6) of the fluorescence stains. Fluorescence images showed more lining-up observation at stimulation groups compared to the control group (arrows: cell motion). Actin and vinculin were imaged to investigate possible rearrangements, reorientations, or both of cytoskeleton elements in hABMSCs exposed to LFDSS. Overall, actin microfilaments and vinculin intermediate-filament structures were somewhat changed under LFDSS treatment. Vinculin filaments were also normally distributed around the nucleus.
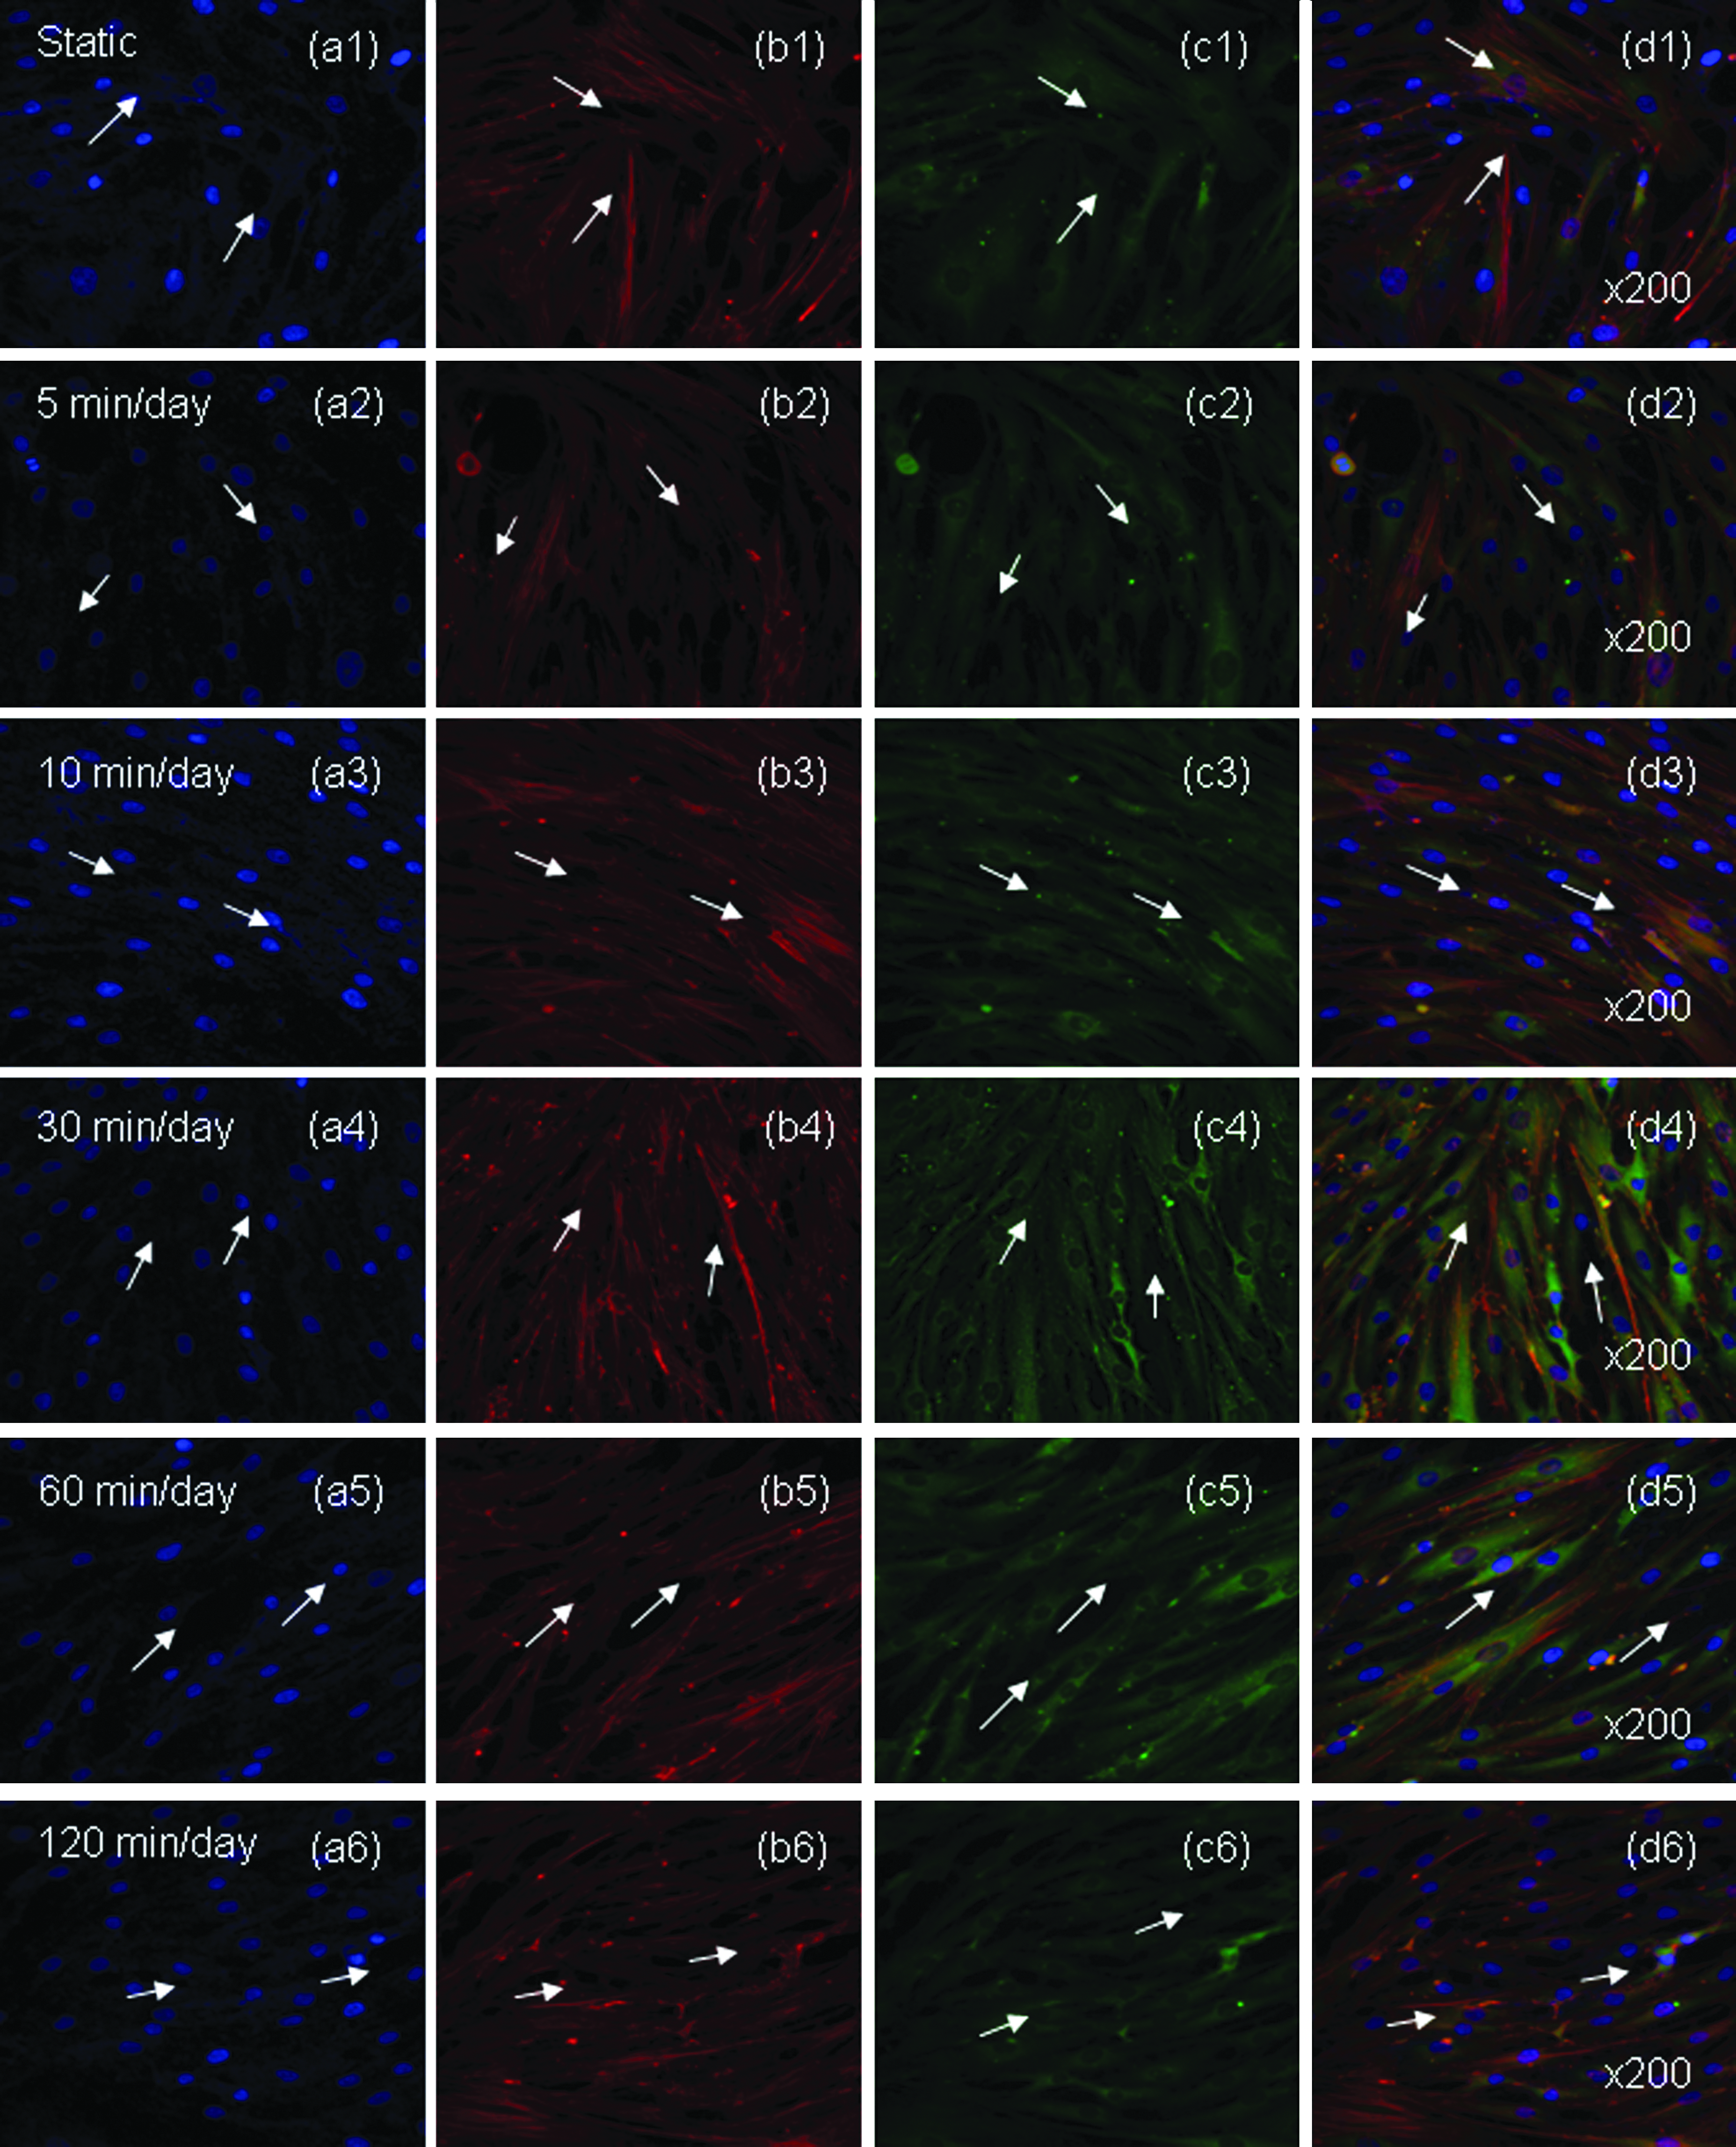
Representative optical fluorescence microscopy images of hABMSCs cultured for 4 days in static conditions (a1–d1) or at 5 min/day (a2–d2), 10 min/day (a3–d3), 30 min/day (a4–d4), 60 min/day (a5–d5), and 120 min/day (a6–d6) LFDSS stimulus groups: cell nuclei (a1–d6), actin filaments (b1–b6), vinculin (c1–c6), and merged images (d1–d6) of the fluorescence stains. Fluorescence images showed more lining-up observation at stimulation groups compared to the control group (arrows: cell direction). Color images available online at
This result indicates that hABMSCs differentiating toward the osteogenic lineage may acquire a variety of different functional states, determined by the coupled effects of fluid flow and culture substrate, and characterized by specific expression patterns of bone-related genes. 11 Interestingly, cytoskeletal contraction can direct the differentiation of precursor cells in vitro. When cultured on a hard surface, cells spread out, and cytoskeletal contraction pulls on the surface, generating high levels of tensile force. These changes promote the differentiation of stem cells toward the osteoblast lineage. 21 Recently, nanostructured substrates have been used to control the growth and differentiation of hMSCs, often without any chemical supplements.22–24 Simply modulating the disorder or dimensions of nanostructures controlled hMSC differentiation similar to soluble cues.23,24
For these applications, however, the direction of hMSC growth25,26 is often as critical as the differentiation.27,28 For example, when differentiated bone cells align and secrete collagen, they can enhance the mechanical strength of bone structures.29–31 Flow-induced shear has been previously reported to induce changes in actin microfilaments and intermediate filaments, leading to changes in the cell morphology. 32 We did not observe any change in the cytoskeleton structure or cell morphology in response to the LFDSS condition, possibly because these effects require higher levels of flow-induced shear. 33
The osteoblastic phenotype was assessed by measuring the expression of ALP and collagen I (Col I) using RT-PCR in hABMSCs simulated with LFDSS. These results show that LFDSS conditions may promote osteogenic differentiation, accompanied by increased extracellular matrix metabolite production. All experiments included a negative control to check for contamination.
Gene expression of osteoblastic differentiation markers
Figure 6 shows RT-PCR analysis of cell cultures between stimulus conditions (from 5 min/day to 120 min/day) and static culture for 2 weeks or 3 weeks. RNA was extracted from the cell cultures at 14 and 21 days after the addition of the differentiation medium. These extracts were subjected to RT-PCR analysis with IBSP, RUNX2, COL1, ALP, OCN, OPN, and GAPDH as the positive control. PCR products were separated on an agarose gel, stained with ethidium bromide, and visualized over a fluorescent light. Expression of genes associated with the osteoblastic differentiation was examined using real-time PCR to investigate the effect of the stimuli with LFDSS on gene expression at 2 weeks (Fig. 6C c1–c6) and 3 weeks (Fig. 6D d1–d6). Expression levels of BSP (Fig. 6C c1), RUNX2 (Fig. 6C c2), COL1 (Fig. 6C c3), ALP (Fig. 6C c4), OCN (Fig. 6C c5), and OPN (Fig. 6C c6) at 2 weeks were significantly higher in LFDSS stimulus conditions on cells than in LFDSS stimulus conditions on cells (Fig. 6D d1–d6) due to high expression of static culture at 3 weeks.

Reverse transcriptase–polymerase chain reaction (RT-PCR) analysis of cell cultures between stimulus conditions (from 5 min/day to 120 min/day) and static culture for 2 weeks
While the levels of expression of BSP, RUNX2, COL1, ALP, OCN, and OPN at 2 weeks were increased by LFDSS treatment, the level of expression at 3 weeks was relatively not much higher on stimulation groups than short-term stimulus groups at 2 weeks. Stimulation groups exposed at 5, 10, 30, and 60 min/day were statistically significantly different (*p<0.05 and **p<0.001) among groups. Expression levels of gene areas were measured using ImageJ 1.45s (National Institutes of Health). Through this cell behavior, we carried out to measure the level of expression of osteogenic differentiation at 2 weeks.
Enhanced osteogenic differentiation of hABMSCs via LFDSS
ALP activity was maintained during the 14 days of culture (Fig. 7). Stimulation groups exposed at 10 min/day, 30 min/day (p=0.00112), and 60 min/day were statistically significantly different (*p<0.05) among groups.
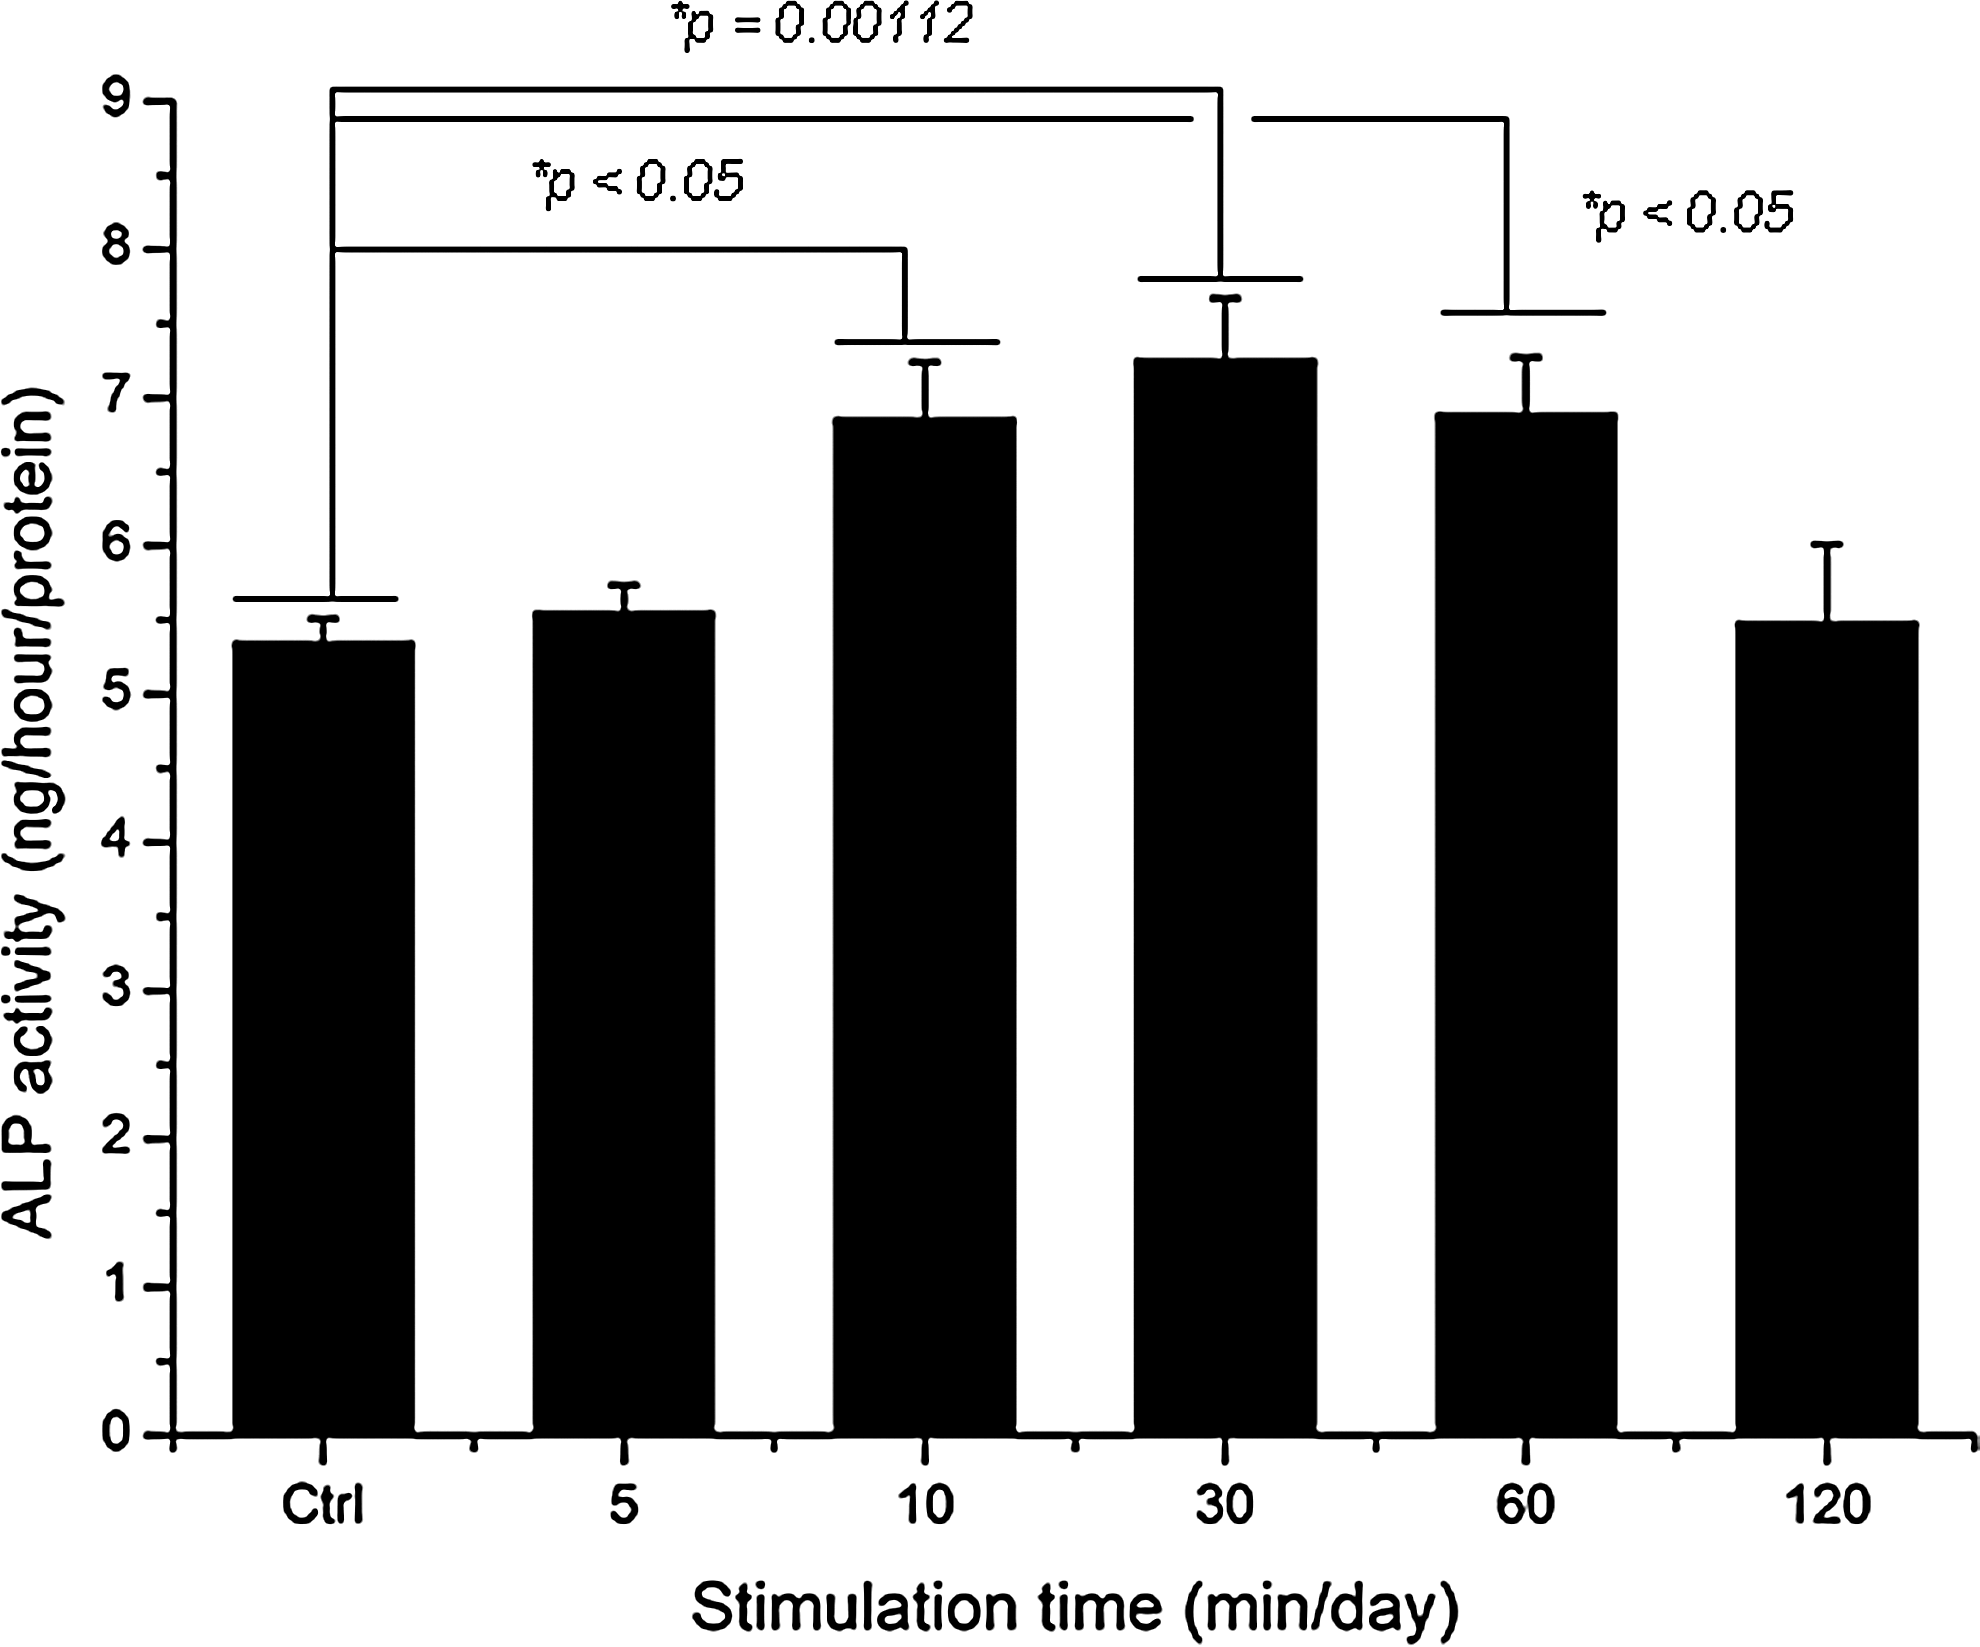
ALP activity cultured in different types of hABMSCs stimulated with LFDSS for 2 weeks. Stimulation groups exposed at 10, 30, and 60 min/day were statistically significantly different (*p<0.05) among groups. (n=3)
Figure 8A indicates representative optical microscopic images of hABMSCs after alizarin red staining treatment with static condition (a) or at 5 min/day (b), 10 min/day (c), 30 min/day (d), 60 min/day (e), and 120 min/day (f) LFDSS condition at 2 weeks after the addition of differentiation media. LFDSS groups at 10 min/day (c), 30 min/day (d), and 60 min/day were way too much intense compared to control, while 120 min/day group was a bit generated (white arrows: mineral nodules stained in red).
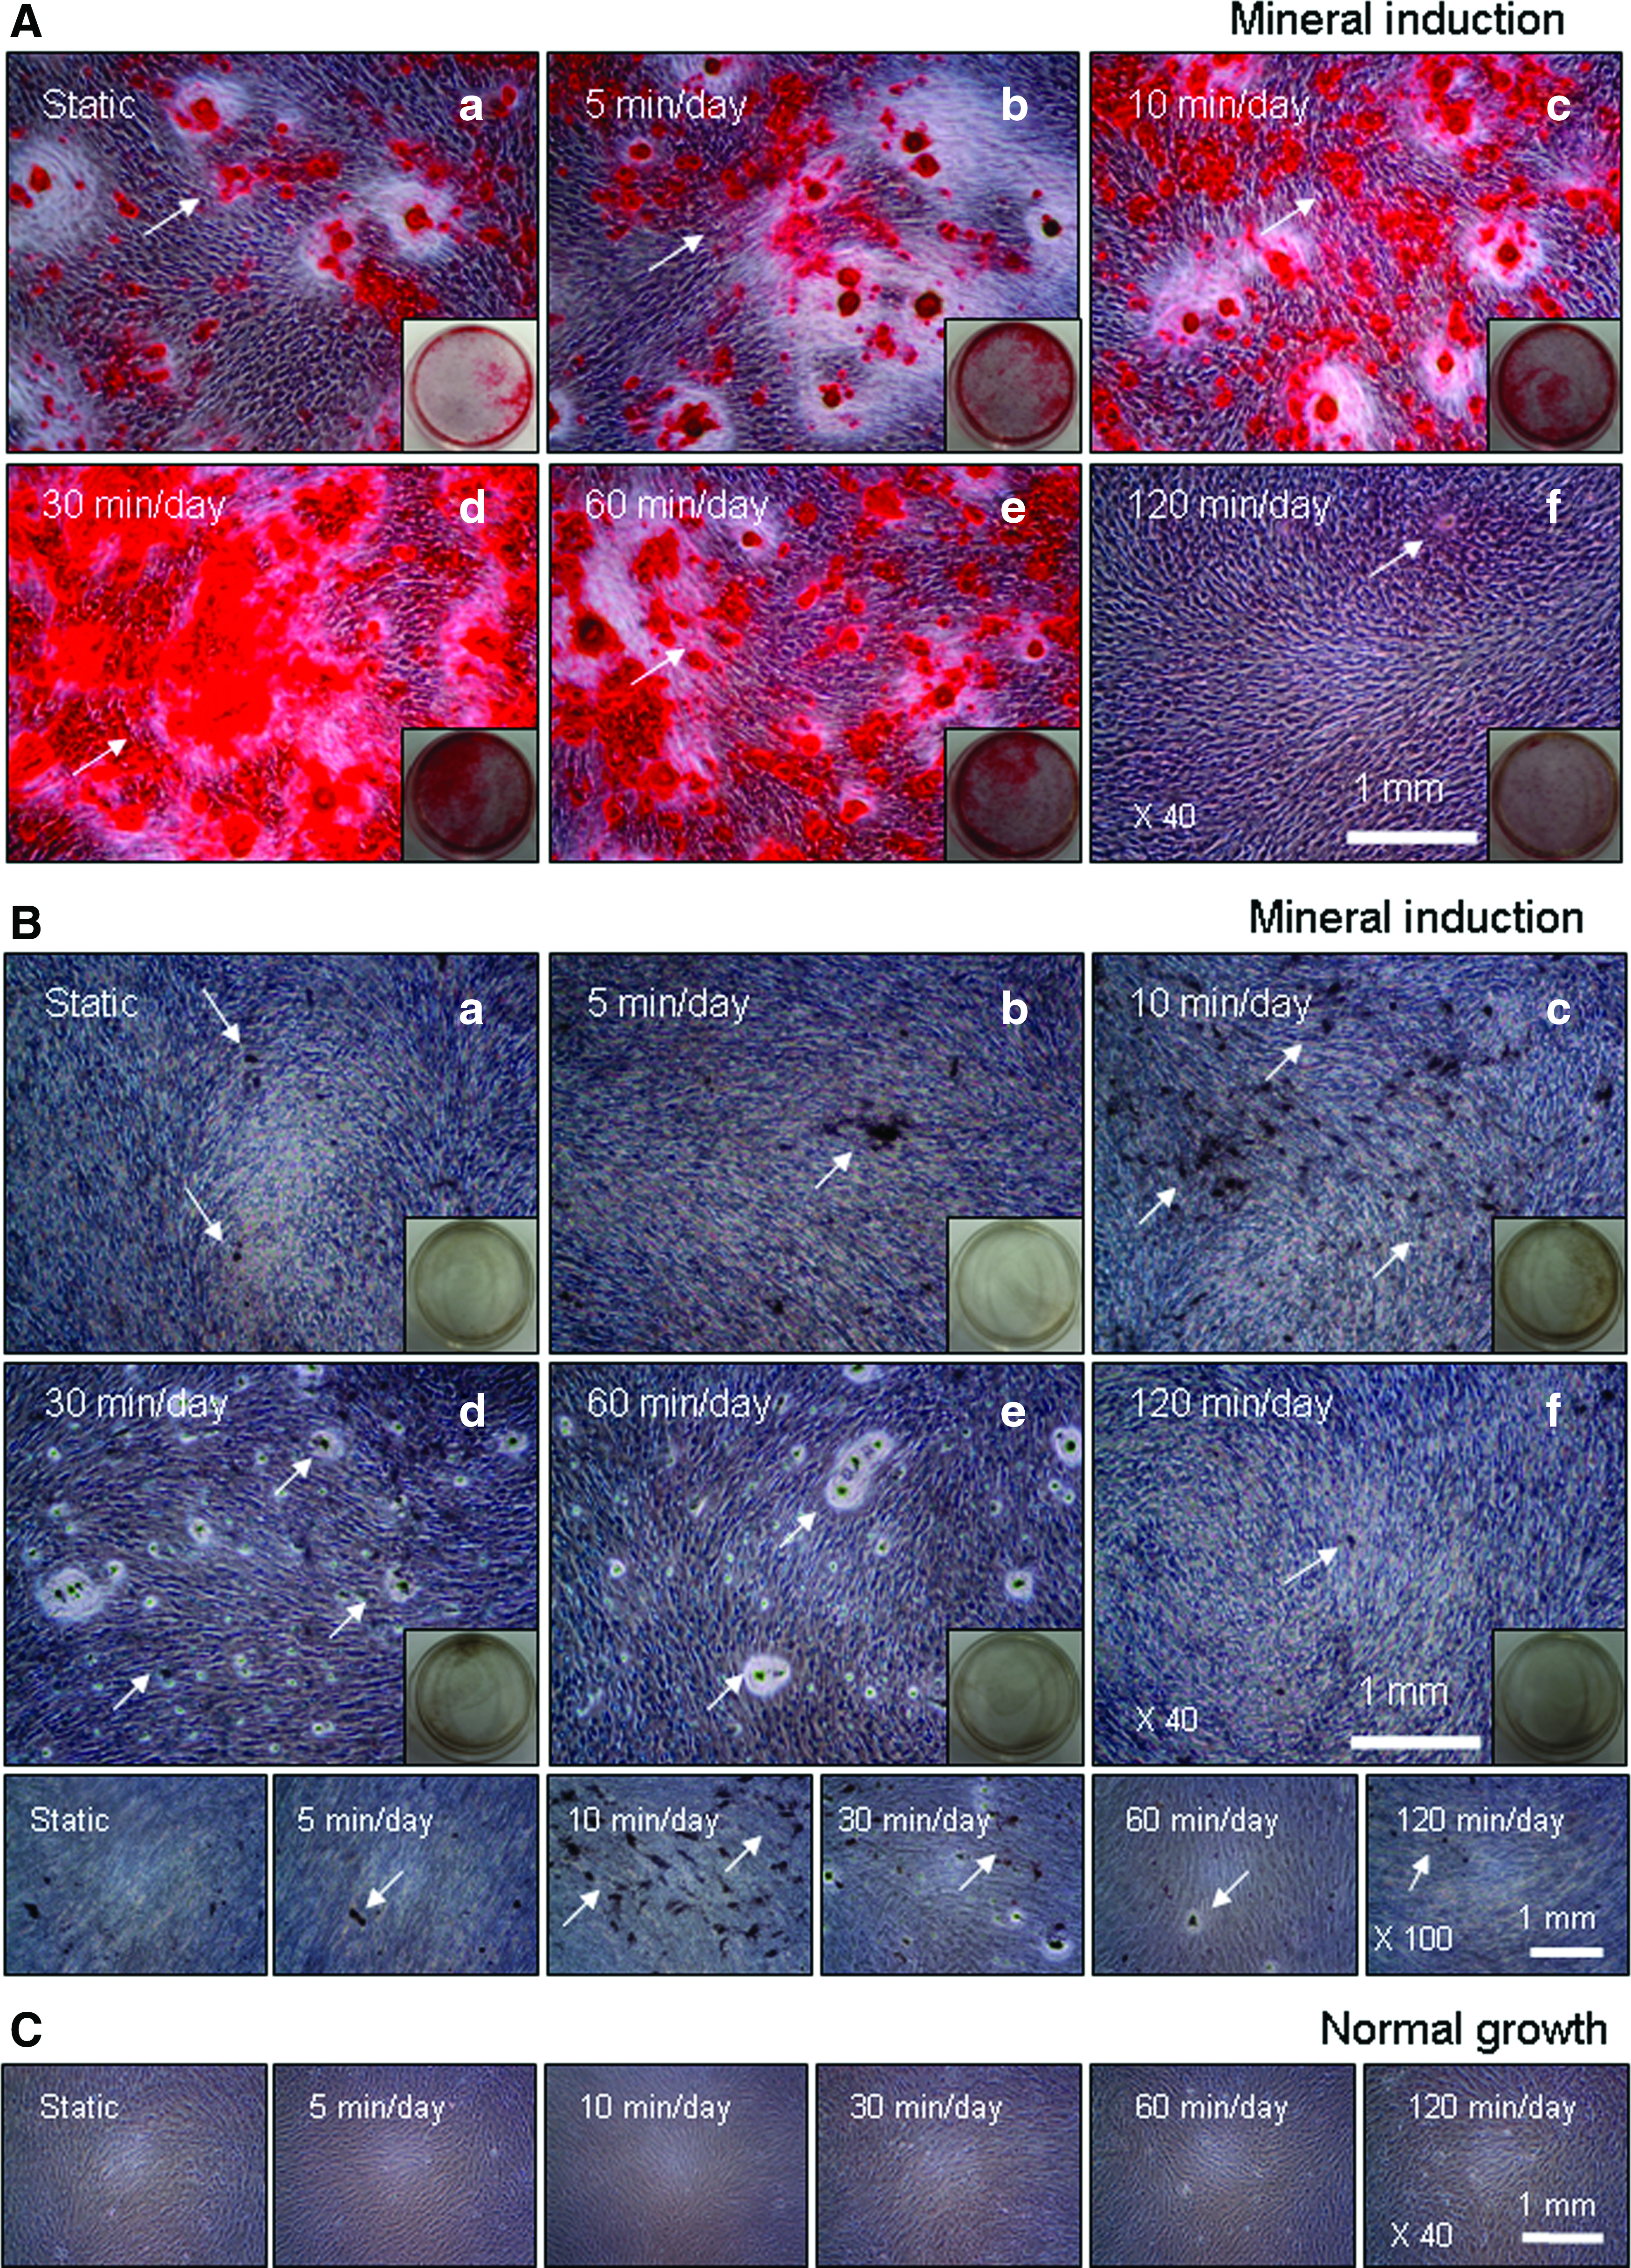
Representative optical microscopic images of hABMSCs after alizarin red staining treatment
Figure 8B shows representative optical microscopic images of hABMSCs after von Kossa staining treatment with static condition (a) or at 5 min/day (b), 10 min/day (c), 30 min/day (d), 60 min/day (e), and 120 min/day (f) LFDSS condition at 2 weeks after the addition of differentiation media. LFDSS groups at 10 min/day (c), 30 min/day (d), and 60 min/day were much intense than static group (white arrows: calcium deposition stained in black). hABMSCs cultured with LFDSS under conditioned media showed increased calcium contents, whereas the cells cultured under normal growth media showed no or a low increase of calcium despite LFDSS treatment (Fig. 8C).
Figure 8D shows an optical density value of mineralized nodule (absorbance of 562 nm) measured after destaining treatment. LFDSS groups exposed at 5 min/day, 10 min/day, 30 min/day, and 60 min/day were statistically significantly different (*p<0.05 and **p<0.001) among groups. This result shows that optimal LFDSS with the proper intensity and time could enhance the differentiation and maturation of hABMSCs.
Proteomic analysis via LFDSS
An investigation of key molecules related to LFDSS compared to the control group was indicated as shown in Figure 9A and B. Secretion media between LFDSS (5, 10, 30, 60, and 120 min/day) and control group treatments for comparative proteomic analysis were loaded on the gradient sodium dodecyl sulfate–polyacrylamide gel electrophoresis gel, and the coomassie blue-stained bands were analyzed. A different band pattern according to LFDSS conditions (time/day) was clearly showed between LFDSS groups and static culture, and red arrows indicate some unique proteins in the LFDSS experiment groups. For the intensely concentrated protein bands at 250–100 kDa, 37–25 kDa, and 20–15 kDa, the samples were about 20-times diluted, reloaded, and are shown in the Figure 9A (a–c).
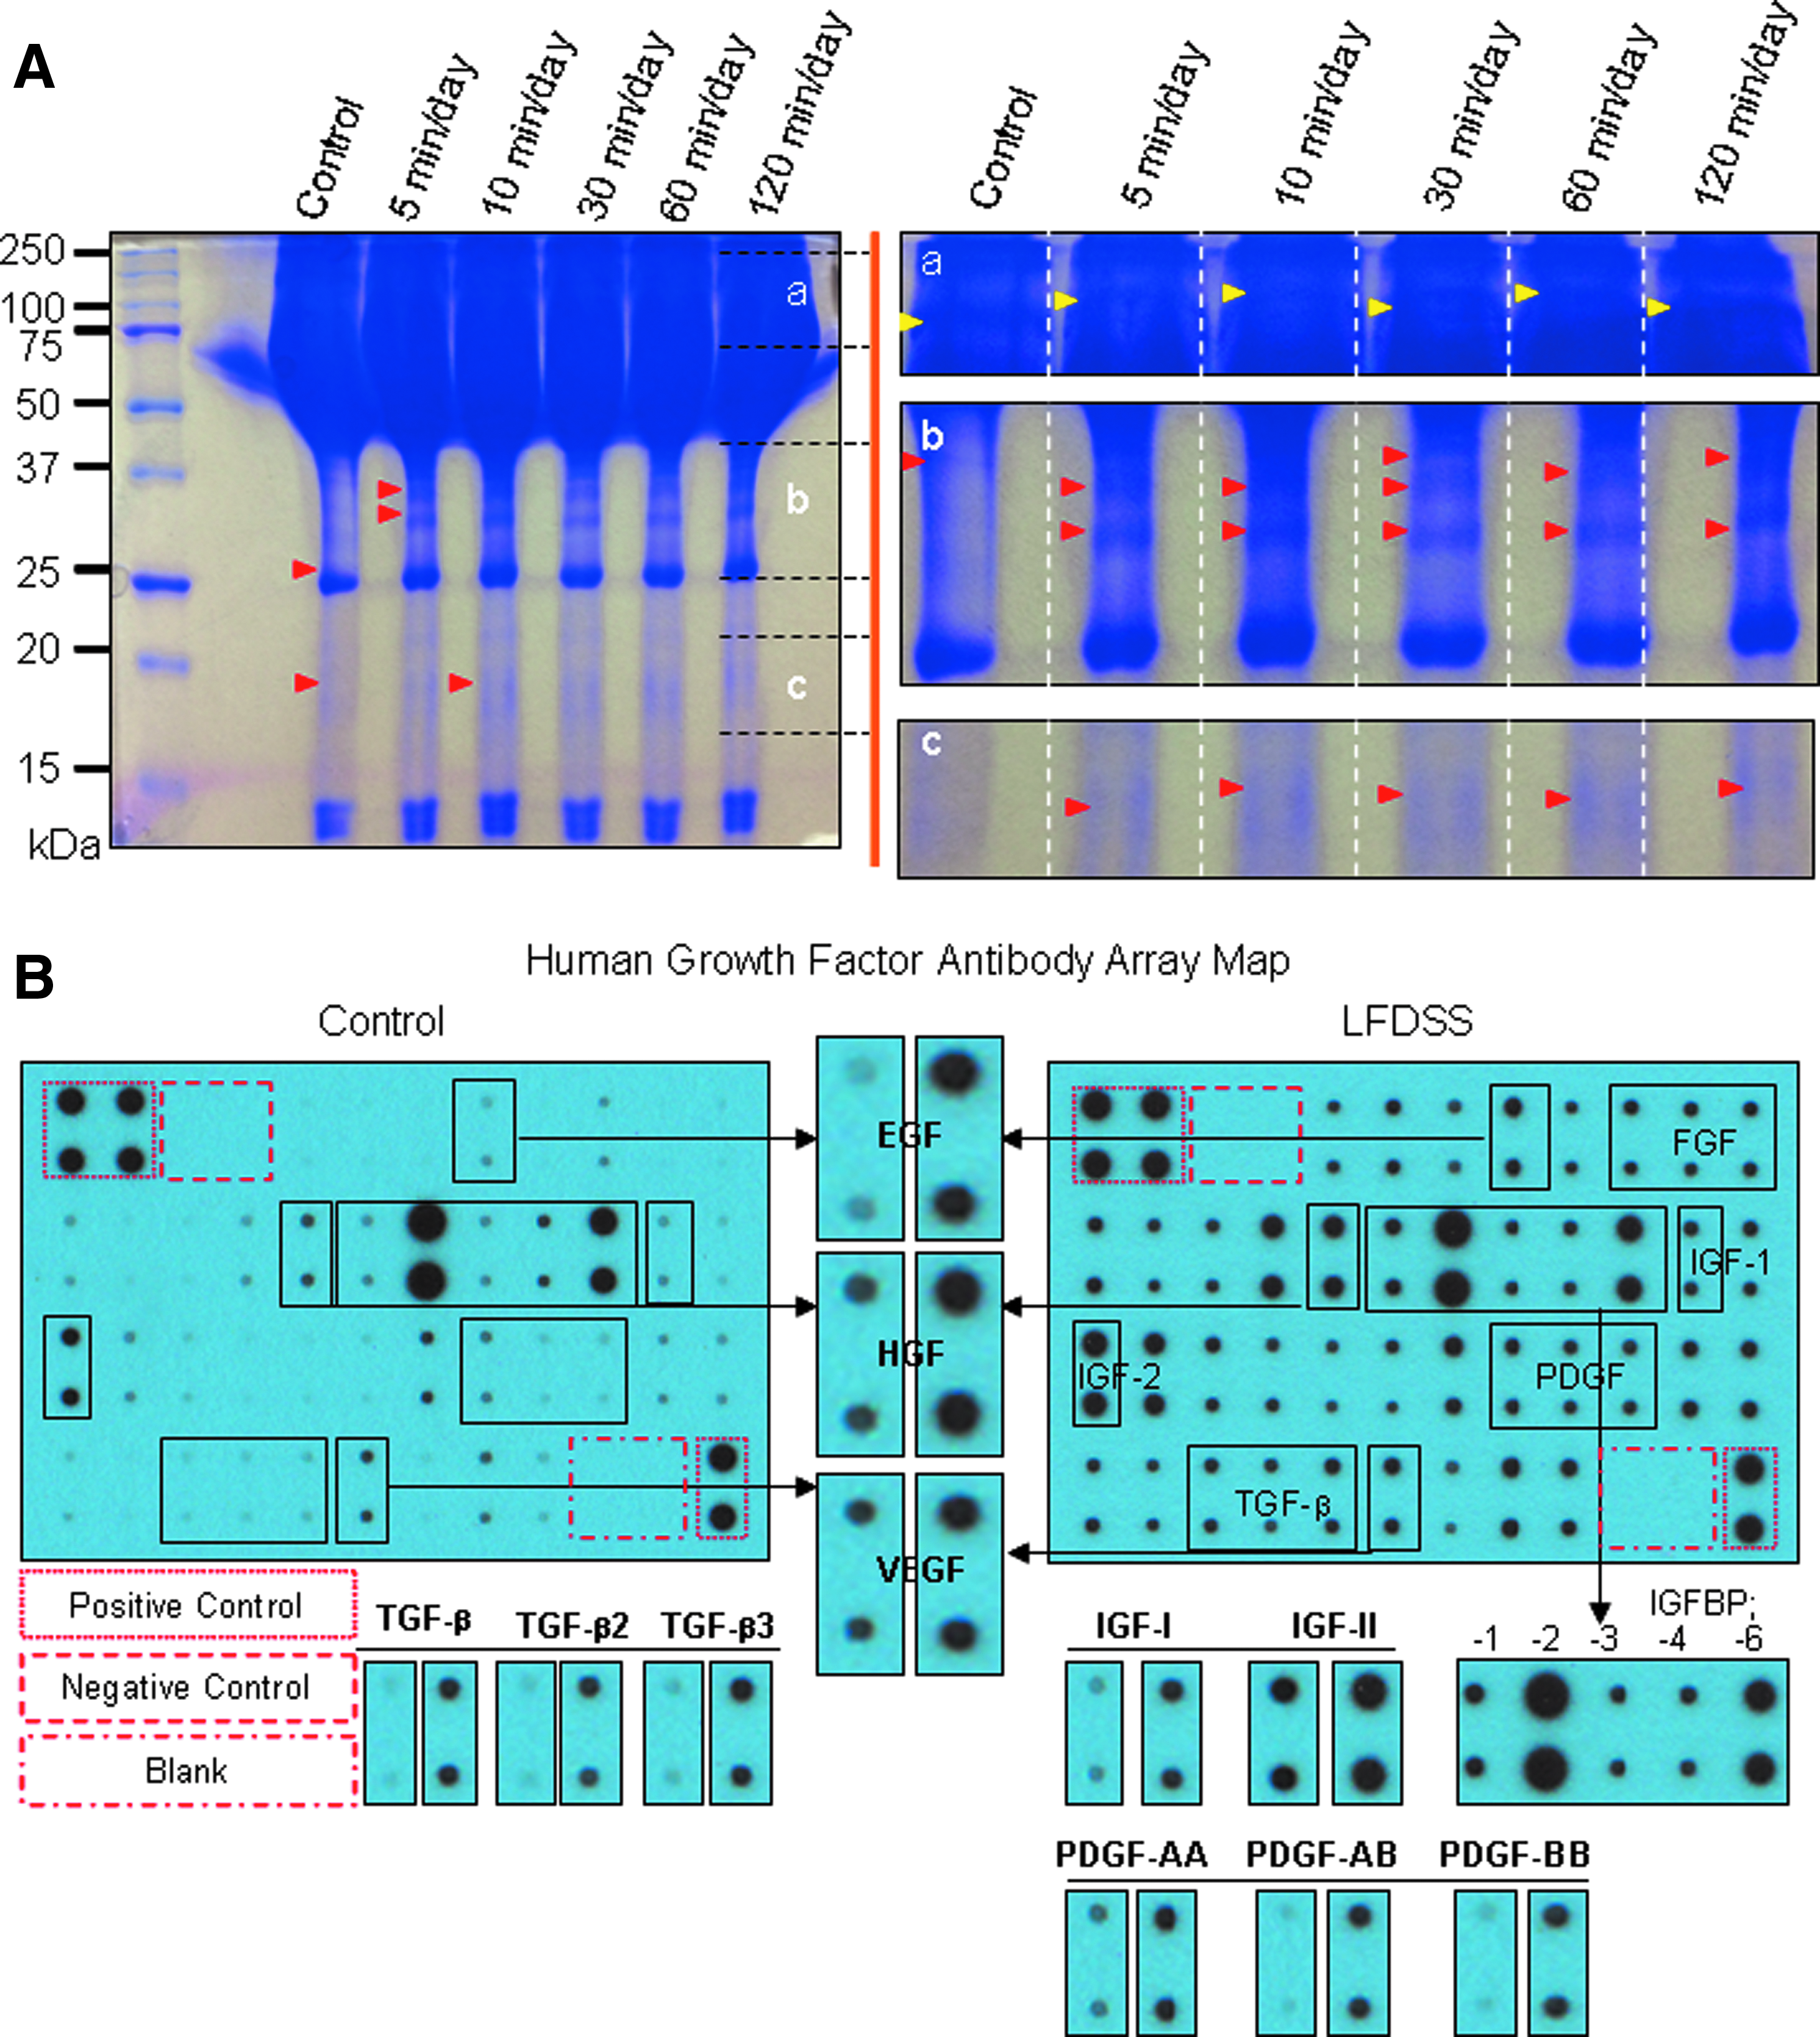
An investigation of key molecules related to LFDSS compared to control group. Proteomic analysis of LFDSS (5, 10, 30, 60, and 120 min/day) groups were loaded on the gradient sodium dodecyl sulfate–polyacrylamide gel electrophoresis gel, and the coomassie blue-stained bands were analyzed. Different band patterns according to LFDSS conditions (time/day) were clearly showed between the LFDSS groups and static culture, and red arrows indicate some unique proteins in the LFDSS experiment groups. For the intensely concentrated protein bands at 250–100 kDa, 37–25 kDa, and 20–15 kDa, the samples were about 20 times diluted, reloaded, and are shown in the
As known widely, cytokines and growth factors are extracellular signaling molecules that regulate cell-to-cell intercommunication. The extracellular signaling proteins include proteins often referred to as cytokines (for instance, IFN-a, IFN-P, IFN-y, and the interleukins) or growth factors (for instance, epidermal growth factor, platelet-derived growth factor, growth hormone, and ciliary neurotrophic growth factor). 34
Cytokines and growth factors are released from the hABMSCs, and therefore they play critical roles in a lot of cell culture processes (including adhesion, and spreading, cellular proliferation, differentiation, migration, secretion, immunity, and inflammation). 35
To ascertain which growth factors may play a role in protein profiles between static culture and LFDSS, both extracts were loaded on the gradient SDS-PAGE gel, and the coomassie blue stained-bands were analyzed. Different band patterns among LFDSS from 5 min/day to 120 min/day with control groups were investigated between the control and LFDSS groups, assuming that some growth factors with response to specific makers may indicate in the LFDSS group.
The human growth factor array consisted of a kit (Cat# AAH-GF-1) for quantitative measurement of 40 human growth factors. The growth factors included amphiregulin, bFGF, b-NGF, EGF, EGF R, FGF-4, FGF-6, FGF-7, GCSF, GDNF, GM-CSF, HB-EGF, HGF, IGFBP-1, IGFBP-2, IGFBP-3, IGFBP-4, IGFBP-6, IGF-I, IGF-I SR, IGF-II, M-CSF, M-CSF R, NT-3, NT-4, PDGF R a, PDGF R b, PDGF-AA, PDGF-AB, PDGF-BB, PLGF, SCF, SCF R, TGF-a, TGF-b, TGF-beta 2, TGF-beta 3, VEGF-A, VEGF R2, VEGF R3, and VEGF-D.
The human growth factor-related protein array kits revealed mainly 9 factors that were intensely expressed in the LFDSS group compared to the control, EGF (a), HGF (b), VEGF (c), IGF-1 (d), IGF-II (e), TGF-β (f), TGF-β3 (g), PDGF-AA (h), and PDGF-BB (i), indicating that all the rest proteins among antibody array kit also highly expressed compared to control. ERK1/2 phosphorylation induced by EGF was found to be involved in cell expansion in human MSCs. 36
More recently, EGF has also been shown to promote osteogenic differentiation of human multipotent MSCs. 37 One such mechanism is the paracrine secretion of growth factors and cytokines. MSCs are known to have a strong paracrine capability of various growth factors and cytokines such as VEGF or hepatocyte growth factor (HGF), which promotes angiogenesis and wound healing.38,39 Indeed, a conditioned medium of MSCs was also shown to promote angiogenesis or wound healing in animal models, suggesting the crucial role of MSC's paracrine action in promotion of angiogenesis and wound healing.39,40 Platelet-rich plasma (PRP), which is developed from autologous blood with a cell separator, is rich in platelets and contains several growth factors, including platelet-derived growth factor (PDGF), insulin-like growth factors (IGF-I and IGF-II), and transforming growth factors (TGF-β1, β2, and β3). 41
These growth factors enhance cell proliferation and protein synthesis and accelerate the normal bone regeneration pathways42,43 Growth factors associated with significant factors widely known to stimulate bone formation were uniquely detected in the LFDSS group, indicating that the properly stimulated stress factors might exert key roles as well as synergy effect in tooth tissue engineering. The proteomics data were developed on X-ray films after exposure to chemiluminescent reagents (B). The levels of expression of representative growth factors in the antibody array kit (human growth factor array kit, RayBiotech Inc.) with the LFDSS group were statistically significant differences (**p<0.001).
VEGF protein was quantified with a conditioned medium between the control and LFDSS groups (Fig. 10). Overhead brackets with asterisks indicate statistically significant differences between groups. Protein levels of 10 min/day, 30 min/day, and 60 min/day LFDSS groups were statistically significantly different (*p<0.05). Expression levels of gene areas were measured using ImageJ 1.45s (National Institutes of Health).

Vascular endothelial growth factor (VEGF) protein was quantified with a conditioned medium between the control and LFDSS groups. Overhead brackets with asterisks indicate statistically significant differences between groups. Besides, LFDSS groups (10 min/day, 30 min/day, and 60 min/day) were statistically significantly differenct (*p<0.05).
Flow cytometric analysis via LFDSS
To determine whether LFDSS alters the expression of surface antigens in hABMSCs, CD146 and Stro-1, which are known markers of hABMSCs, were analyzed by FACS. The expression of CD146 and Stro-1 changed to some degree in all groups. Expression of CD146 and Stro-1 somewhat increased at 30 min/day, whereas the long-term LFDSS group (120 min/day) decreased. (Fig. 11). This suggests that an appropriate level of low shear stress stimulation may alter the expression of surface antigens in hABMSCs. Stimulating hABMSCs with LFDSS for 10–30 min/day increased proliferation, type I collagen production, and expression of ALP, CD146, and Stro-1. LFDSS is likely a potent positive modulator of hABMSC proliferation and differentiation.

FACS analysis. hABMSCs were labeled with FITC-conjugated antibodies and analyzed in a flow cytometer (
Conclusions
This study investigated the effects of stimulation with LFDSS on the in vitro growth and differentiation of human alveolar bone-derived MSCs. We studied cell proliferation and migration, mineralized nodule formation, von Kossa, and ALP activity as indicators of osteogenesis. The results presented above indicated that stimulation with fluid dynamic shear stress is an important stimulus for activating mechanotransduction. Here we report preliminary findings of the effects of stimulation with LFDSS on cell proliferation and differentiation. The viability of cells stimulated for 10 min/day increased by 10% compared to controls (p<0.05). The proliferation of cells stimulated for the 10 min/day LFDSS group increased by 10% compared to the control (p<0.05). As a consequence, both cell viability and cell proliferation were statistically significant at the 10 min/day LFDSS group.
Expression of genes associated with the osteoblastic differentiation was examined using real-time PCR to investigate the effect of the stimuli with LFDSS on gene expression at 2 weeks and 3 weeks. Expression levels of BSP, RUNX2, COL1, ALP, OCN, and OPN at 2 weeks were significantly higher in LFDSS stimulus conditions on cells than in LFDSS stimulus conditions on cells due to high expression of static culture at 3 weeks.
We also investigated the effects of shear stress on the differentiation of hABMSCs. Alizarin red staining showed that mineralized nodules formed when osteoblasts were cultured in a prepared induction medium. LFDSS groups at 10 min/day, 30 min/day, and 60 min/day were way too much intense compared to the the control, while the 120 min/day group was a bit generated. Mineralized nodules formed when osteoblasts were cultured with a prepared induction medium, indicating osteogenic differentiation. ALP activity exposed at 10 min/day, 30 min/day (p=0.00112), and 60 min/day were statistically significantly different (*p<0.05) among groups. Also, LFDSS groups after von Kossa staining treatment at 10 min/day (c), 30 min/day (d), and 60 min/day were much intense than the static group.
To ascertain which growth factors may play a role in protein profiles between static culture and LFDSS, both extracts were loaded on the gradient SDS-PAGE gel, and the coomassie blue-stained bands were analyzed. Different band patterns among LFDSS from 5 min/day to 120 min/day with control groups were investigated between the control and LFDSS groups, assuming that some growth factors with response to specific makers may indicate in the LFDSS group. The human growth factor-related protein array kits revealed mainly 9 factors that were intensely expressed in the LFDSS group compared to the control, EGF, HGF, VEGF, IGF-1, IGF-II, TGF-β, TGF-β3, PDGF-AA, and PDGF-BB, indicating that all the rest proteins among antibody array kit also highly expressed compared to control.
VEGF protein was quantified with a conditioned medium between the control and LFDSS groups. Protein levels of the 10 min/day, 30 min/day, and 60 min/day LFDSS groups were statistically significantly different (*p<0.05).
To determine whether LFDSS alters the expression of surface antigens in hABMSCs, CD146 and Stro-1 were analyzed by FACS, which are known markers of hABMSCs. The expression of CD146 and Stro-1 changed to some degree in all groups. Expression of CD146 and Stro-1 somewhat increased at 30 min/day, whereas the long-term LFDSS group (120 min/day) decreased.
These results show that stimulating hABMSCs shear stress at the proper intensity and time can enhance their differentiation and maturation. In conclusion, the present findings suggest that LFDSS stimulation under optimized conditions can enhance the bone formation by promoting differentiation and maturation.
Footnotes
Acknowledgments
This study was carried out with the financial support of the Korea Health 21 R&D Project, Ministry of Health & Welfare, Republic of Korea (A085021).
Disclosure Statement
No competing financial interests exist.