
Abstract
The initial attachment of cells to biomaterials is an important indicator of longer term cell–substrate biocompatibility. To study and quantify this interaction, we have developed a protocol for measuring temporal changes in the three-dimensional (3D) morphology of mammalian cells seeded onto different substrates using fluorescence confocal laser scanning microscopy and image processing techniques. This method has been used to investigate how morphology parameters, such as cell thickness, volume, and the footprint area, change over time for osteosarcoma cells on uncoated glass control, fibronectin-coated glass, and titanium substrates. Consistent with other studies, our results show that the presence of a fibronectin coating significantly increases the rate of cell spreading, judged by an increase in the cell footprint area and a decrease in cell thickness, indicating enhanced biocompatibility. Using similar criteria, the same cell line was observed to spread faster on titanium than on uncoated glass. We propose that 3D cell morphometry is a valuable multiparametric tool for quantifying initial cell–substrate interactions providing data which has important applications in quality control for ensuring product/batch consistency and for developing tailored surface finishes.
Introduction
During cell spreading and adhesion to a substrate, a cell undergoes morphological alterations, driven by active reorganization of the cytoskeleton,9,10 which are an important determinant of later cellular behavior. In vitro, anchorage-dependent cells change from being approximately spherical to a flattened, spread morphology, which is important for cell proliferation.11,12 At a given instant in time, the shape of a cell provides both qualitative and quantitative information about its physiological and structural state, and the rate at which morphology changes occur may provide greater insight into the underlying interactions and processes that are taking place. For example, studies have shown that changes in the actin cytoskeleton influence the cell volume regulatory mechanism,13–15 and an increase in the cell surface area can be associated with increased uptake of facilitated oxygen and nutrients. 16 Changes in cell volume, swelling and shrinkage, may be indicators of the onset of cell death. 17
Due to the availability and widespread use of 2D microscopy modalities, such as epi-fluorescence, brightfield, and phase contrast, the majority of morphology analysis is performed using 2D images. The total cell number, the combined cell spread area, and confluency (the fraction of the substrate covered by cells) are widely used to assess cell–substrate interactions. Here, a greater number of adherent cells, larger spread area, and higher cell confluency are indicative of enhanced biocompatibility between the cells and the substrate. 18 Other approaches seek to examine the shape variation among individual cells using a number of different representations. 19 Confocal and other optical sectioning microscopes (such as two-photon excitation) offer the ability to image cells in 3D at high spatial resolution, providing a fuller description of the morphology and deeper insight into cell behavior. Confocal microscopy, in particular, has been used to characterize and measure the 3D shape of a variety of cell types20,21 and also subcellular structures, inside tissue.22–24 However, to our knowledge, the present work represents the first attempt to use time- resolved 3D morphometry analysis to quantify the interaction of an individual cell line with a substrate.
In this article, we outline a fast, simple procedure for acquiring accurate 3D images of fixed cells on different substrates using a fluorescence confocal laser scanning microscope (CLSM) and immunofluorescent staining. 3D morphology parameters are computed for each cell from the acquired images and used to compare trends in behavior over time. We have used this approach to study temporal morphology changes in MG63 osteosarcoma cells seeded onto uncoated glass, fibronectin-coated glass, and titanium substrates. Fibronectin plays an important role in regulating cell adhesion, and numerous studies have shown that the biocompatibility of materials can be significantly improved by fibronectin coating.25–31 Titanium alloys are widely used in orthopedic and dental implants and have been shown to offer superior biocompatibility to alternative materials.32–34
Materials and Methods
Preparation of cells
MG63 osteosarcoma cells (HPA Culture Collections) were cultured in Eagle's minimum essential medium (MEM) with 1 mM L-glutamine and 1% nonessential amino acids supplemented with 10% heat-inactivated fetal bovine serum (FBS), 10 μg/mL gentamicin and 0.25 μg/mL amphotericin B (Invitrogen). Cell cultures were maintained at 37°C under a humidified atmosphere of 5% CO2/95% air. Following trypsinization, the cells were counted, seeded onto the substrates at a density of ∼100 cells cm2, and cultured in MEM with 10% FBS. Nonadherent cells were then removed by washing with phosphate buffer solution (pH 7.4), and the remaining cells were fixed with neutral-buffered formalin solution (Sigma-Aldrich) at 10, 20, 30, 40, 50, 60, 75, and 90 min after seeding. This fixation procedure has been shown to maintain the cell integrity and minimize effects on the overall morphology.35,36 Furthermore, any effects resulting from fixation will be similar across different groups of cells, allowing a comparison of cell morphology across different cell-seeded substrates. The fixed adherent cells were then stained with DAPI (Molecular Probes), for DNA, and wheat germ agglutinin (WGA) conjugated to Alexa Fluor 488 (Molecular Probes), for the plasma membrane. Finally, a few drops of antifade solution (Prolong gold, Invitrogen) were added to reduce photobleaching during imaging.
Preparation of substrates
All fixed cell samples were imaged inside Lab-Tek twin-chambered borosilicate sterile chamber slides (Fischer Scientific). Cells on uncoated glass substrates were prepared by seeding directly into the chamber slides. Fibronectin-coated glass samples were prepared by spontaneous adsorption of fibronectin derived from bovine plasma (Invitrogen) from 100 μg/mL solution onto the base of the chamber slides for 1 h before cell seeding.
Titanium substrates were prepared by coating 12×12 mm glass sections cut from microscope cover glass (no. 1.5, Corning). The sections were initially cleaned by sonicating in ethanol for 20 min at 50°C, rinsed in ethanol followed by deionized water, and then air dried and exposed to UV-ozone for 20 min. The final treatment was a further ethanol rinse followed by air-drying. The glass sections were then mounted on a microscope slide and coated with titanium (medical grade II titanium; Allegheny Technologies Ltd.) using a Nordiko 5050 evaporator. The thickness of the deposited films was about 100 nm. The chemistry and topography of the titanium coating was examined using X-ray photoelectron spectroscopy and reflected light confocal laser scanning microscopy, respectively (data not presented). The expected chemical elements were detected, that is, titanium (Ti 2p), oxygen (O 1s), and carbon (C 1s). The surface topography reflected that of the glass substrates with an average roughness, Ra (the arithmetic mean of the absolute departure distance from the center line), measured from 2D-profiles to be ∼5 nm. After cell seeding, incubation, fixation, and staining, each titanium-coated glass section was inverted and mounted in a chamber slide on top of two 125-μm thick glass spacers. This ensured that the separation between the upper surface of the chamber slide and the titanium layer was sufficiently large that the cells were not subject to significant mechanical stress during mounting, but small enough to allow imaging to the titanium layer.
Image acquisition
All images were acquired using an inverted fluorescence CLSM (FV-1000, Olympus). CLSM is widely used for cell imaging as it offers high spatial resolution in three dimensions. Immunofluorescent staining allows imaging of specific cellular components, in this case, the plasma membrane, with a much higher contrast and signal-to-noise than is typically possible using label-free techniques. High contrast is essential to allow reliable image segmentation and accurate quantitative analysis. The use of fixed over live cells was preferred for our study as it allowed the use of a bright, photostable fluorophore and antifade reagent to provide optimal, stable imaging conditions. In principle, 3D cell morphometry may be performed using live cells and an appropriate fluorophore; however, in practice, live cell behavior may be altered by phototoxic or photothermal effects resulting from light illumination, and live cell compatible fluorophores tend to be more prone to photobleaching. Such effects tend to increase with specimen light exposure and are difficult to avoid when acquiring high-resolution images with a high-signal noise-to-noise ratio required for accurate image analysis.
The WGA-Alexa Fluor 488 plasma membrane stain was excited at 488 nm and the resulting fluorescent emission detected between 500 and 600 nm. DAPI (excited at 405 nm) was used to aid identification and counting of cells and was not excited during acquisition of plasma membrane images. Images of cells on fibronectin-coated glass and uncoated glass control substrates were obtained with a 60x/1.35 oil immersion objective lens (UPLNAPO, Olympus). Cells on titanium and uncoated glass control substrates were imaged using a 40x/1.2 oil immersion objective (UPLNFLN, Olympus) due to its longer working distance. For each sample, corresponding to a given substrate with cells fixed at a given post-seed incubation time, a series of (x-y) images covering the entire cell depth (z stack) were acquired for the first 20 cells entering the microscope field of view starting from a position close to the center of a chamber. If the fluorescent staining was highly nonuniform, the cell was in direct contact with a neighboring cell or was surrounded by a large quantity of bright fluorescent debris, then it was not imaged. However, one or more of these conditions was typically encountered only once or twice per sample. All acquired images were 320×320 pixels in size and the microscope zoom was adjusted such that the field of view was slightly larger than the cell being imaged; as a result, the image pixel size varied between 0.04 and 0.35 μm depending on the level of cell spreading. The separation between adjacent x-y image slices in a z-stack was set at 0.4 μm, slightly less than half the full width at half maximum of the nominal diffraction-limited microscope point spread function (PSF) for both objective lenses. The typical acquisition time for each z-stack was between 5 and 40 s depending on the number of x-y image slices. In principle, the image acquisition could be further automated either by imaging larger areas containing multiple cells and segmenting the image before further analysis, or by employing a feature recognition algorithm to locate and image cells without operator input.
The excitation laser power was set as low as practically possible to minimize photobleaching and photothermal heating, while providing an acceptable signal-to-noise ratio. The low illumination intensity, combined with the high photostability of the Alexa Fluor 488 dye, and the use of antifade solution, meant that no significant reduction in fluorescent signal was observed during image acquisition. The analogue gain of the confocal photomultiplier tube was adjusted such that only a small fraction of image pixels were saturated in intensity. Initial manual thresholding (background subtraction) was carried out before image acquisition to remove any low-intensity light signal due to noise or light scattered from the surface of the substrate. Figure 1 shows an example of a z-stack for an MG63 cell on fibronectin-coated glass, fixed 20 min after seeding. When acquiring images of cells on titanium and corresponding uncoated glass control substrates, a second detection channel was used to record light reflected from the substrate. This additional information was used in the analysis to locate the surface of the substrate at the z coordinate, which corresponded to the x-y image with the highest total intensity of reflected light.
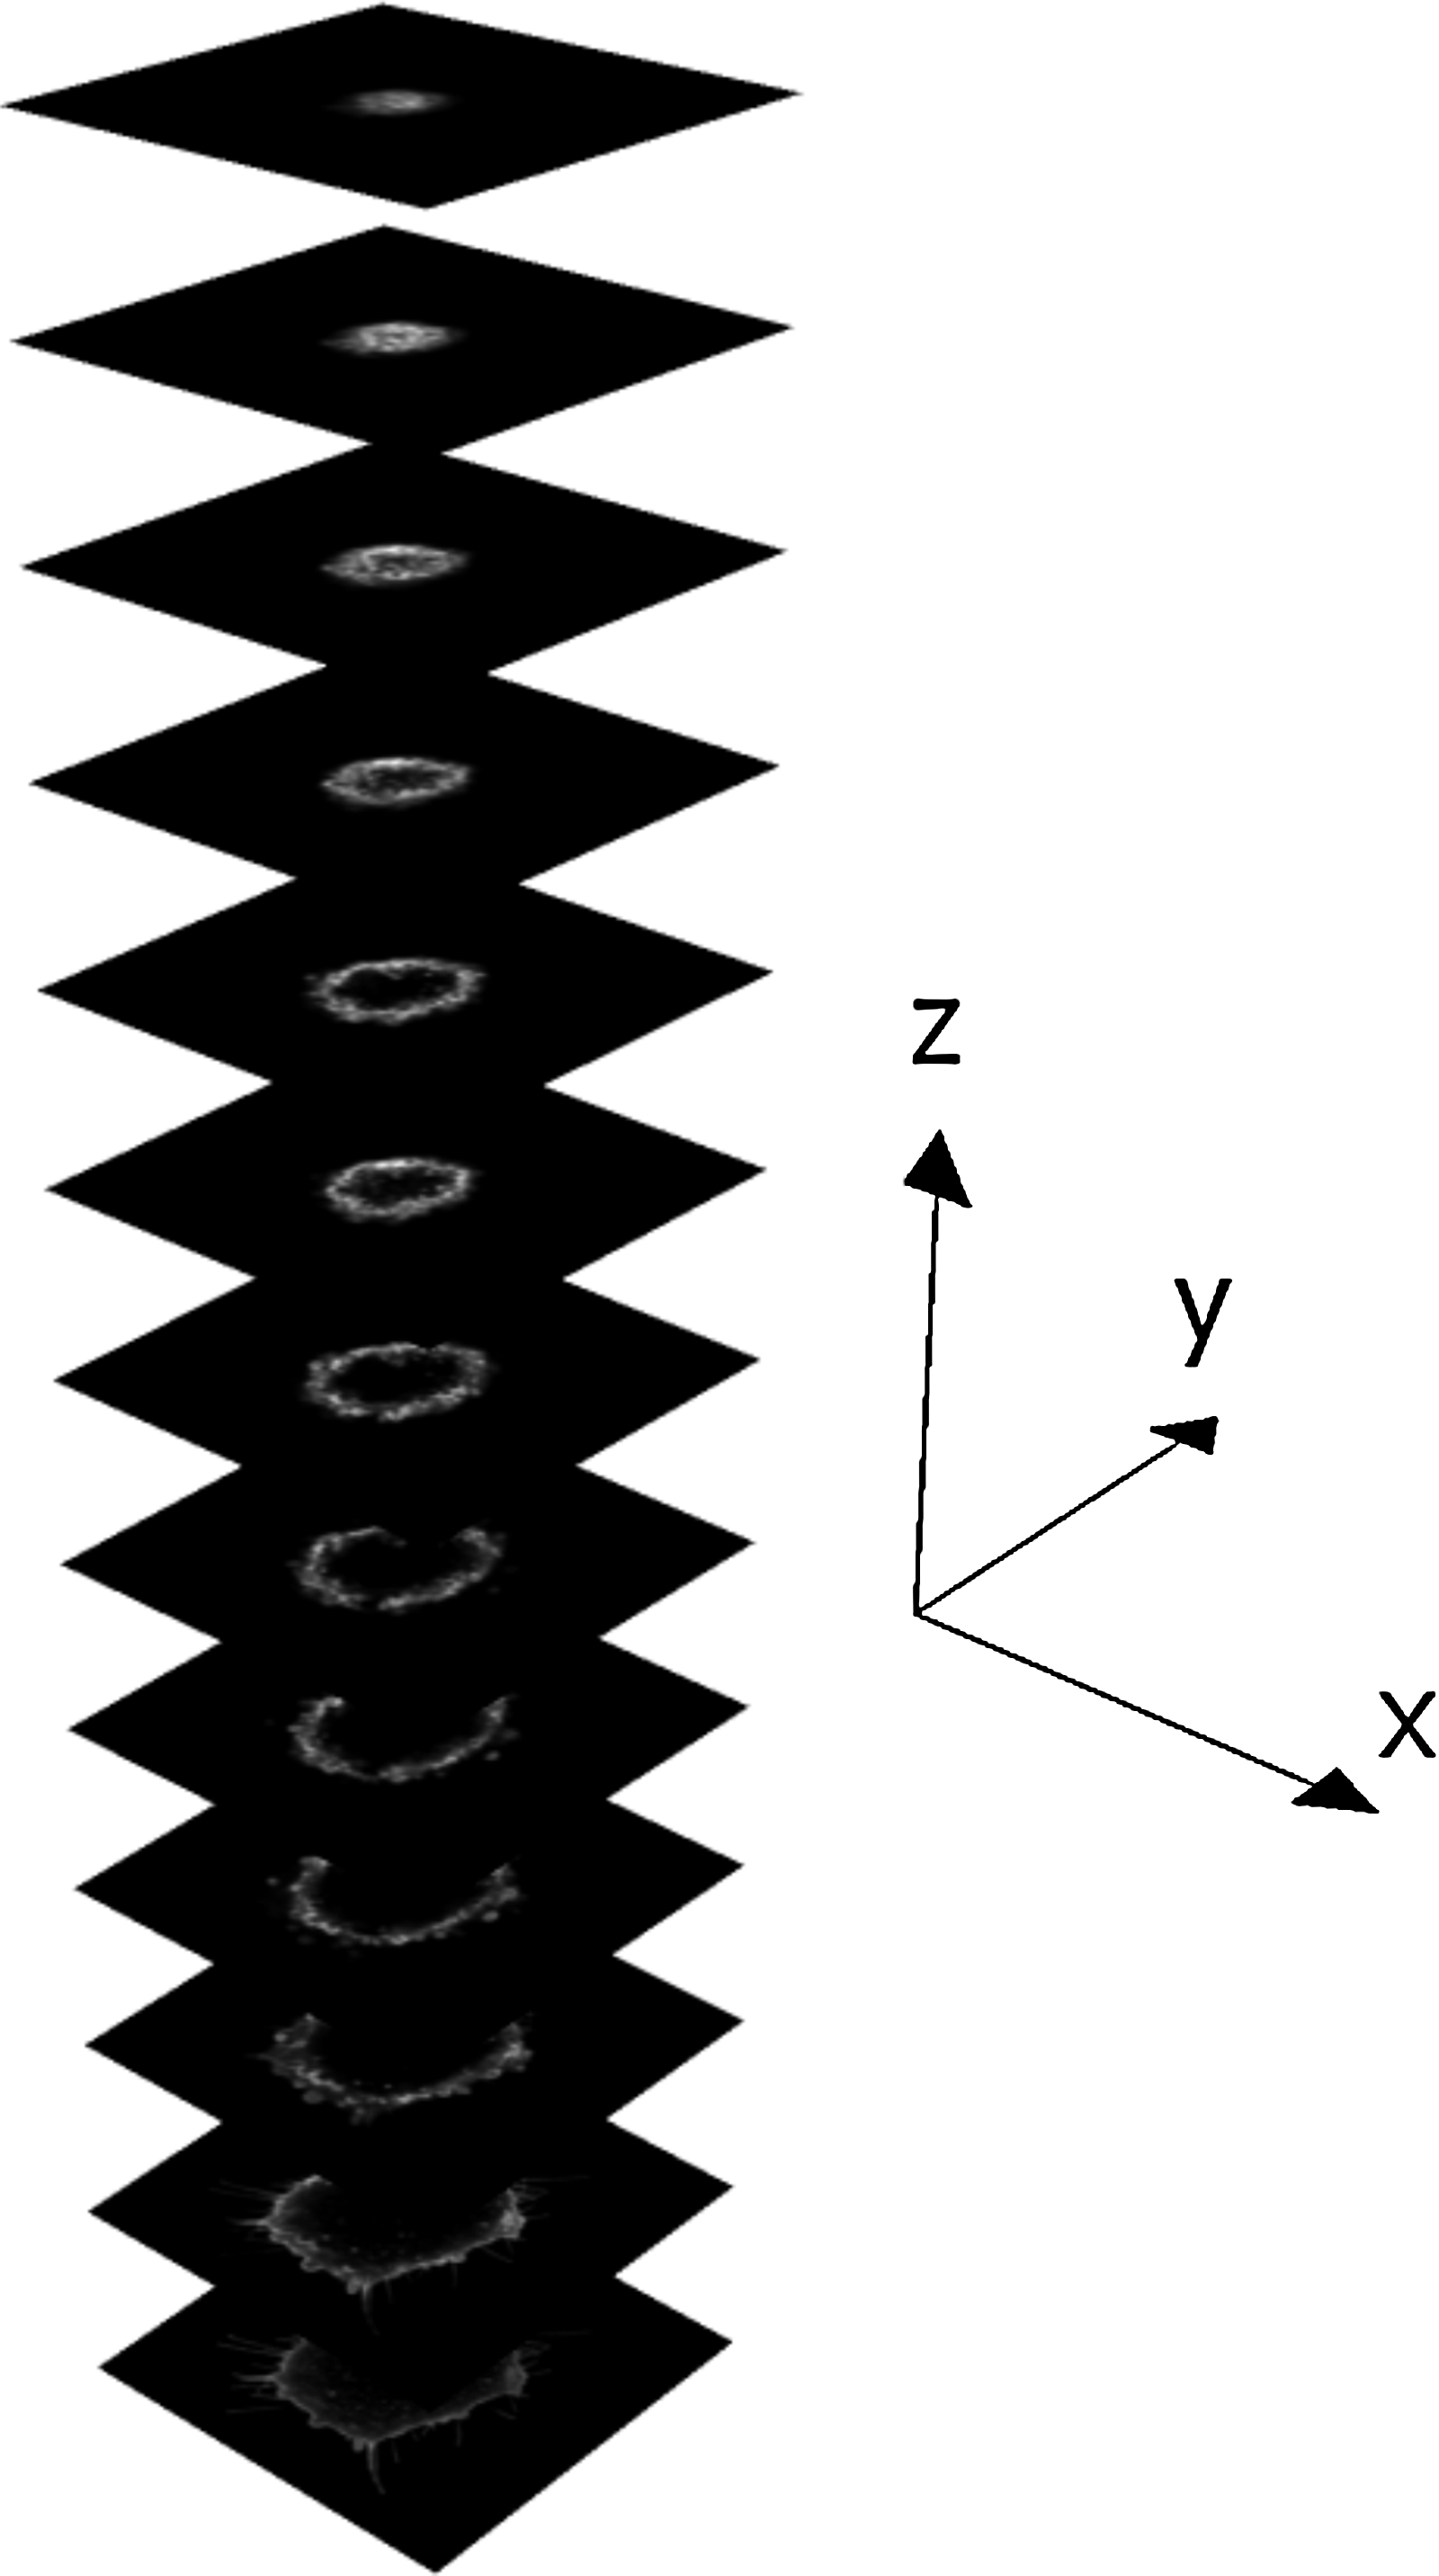
Example series of raw confocal images (z-stack) of a single MG63 osteosarcoma cell. For this example, each image corresponds to an area of 42×42 μm in the specimen.
Image processing and analysis
In order to render the raw images into a form suitable for quantification of the cell shape, several image-processing operations were applied to the raw 12 bit data generated by the microscope. After converting the raw images to 8 bit TIFF format, a 3×3 pixel median filter was applied to remove high spatial frequency (“salt and pepper”) noise and a very low level background signal was subtracted from the image. Next, the image was binarised using a Canny edge detection algorithm, 37 before the cell boundary was closed using dilation and erosion operations and the internal holes were filled. The combined effect of these operations is to convert each transverse (x-y) image slice of the cell from a greyscale outline into a filled binary object as shown in Figure 2a. The cross sectional area of the cell at a given height is then simply obtained from the product of the total number of nonzero pixels in the corresponding transverse image slice and the pixel dimensions in the x and y directions. Figure 2b shows an example isosurface representation of an MG63 cell after the image processing steps have been applied.
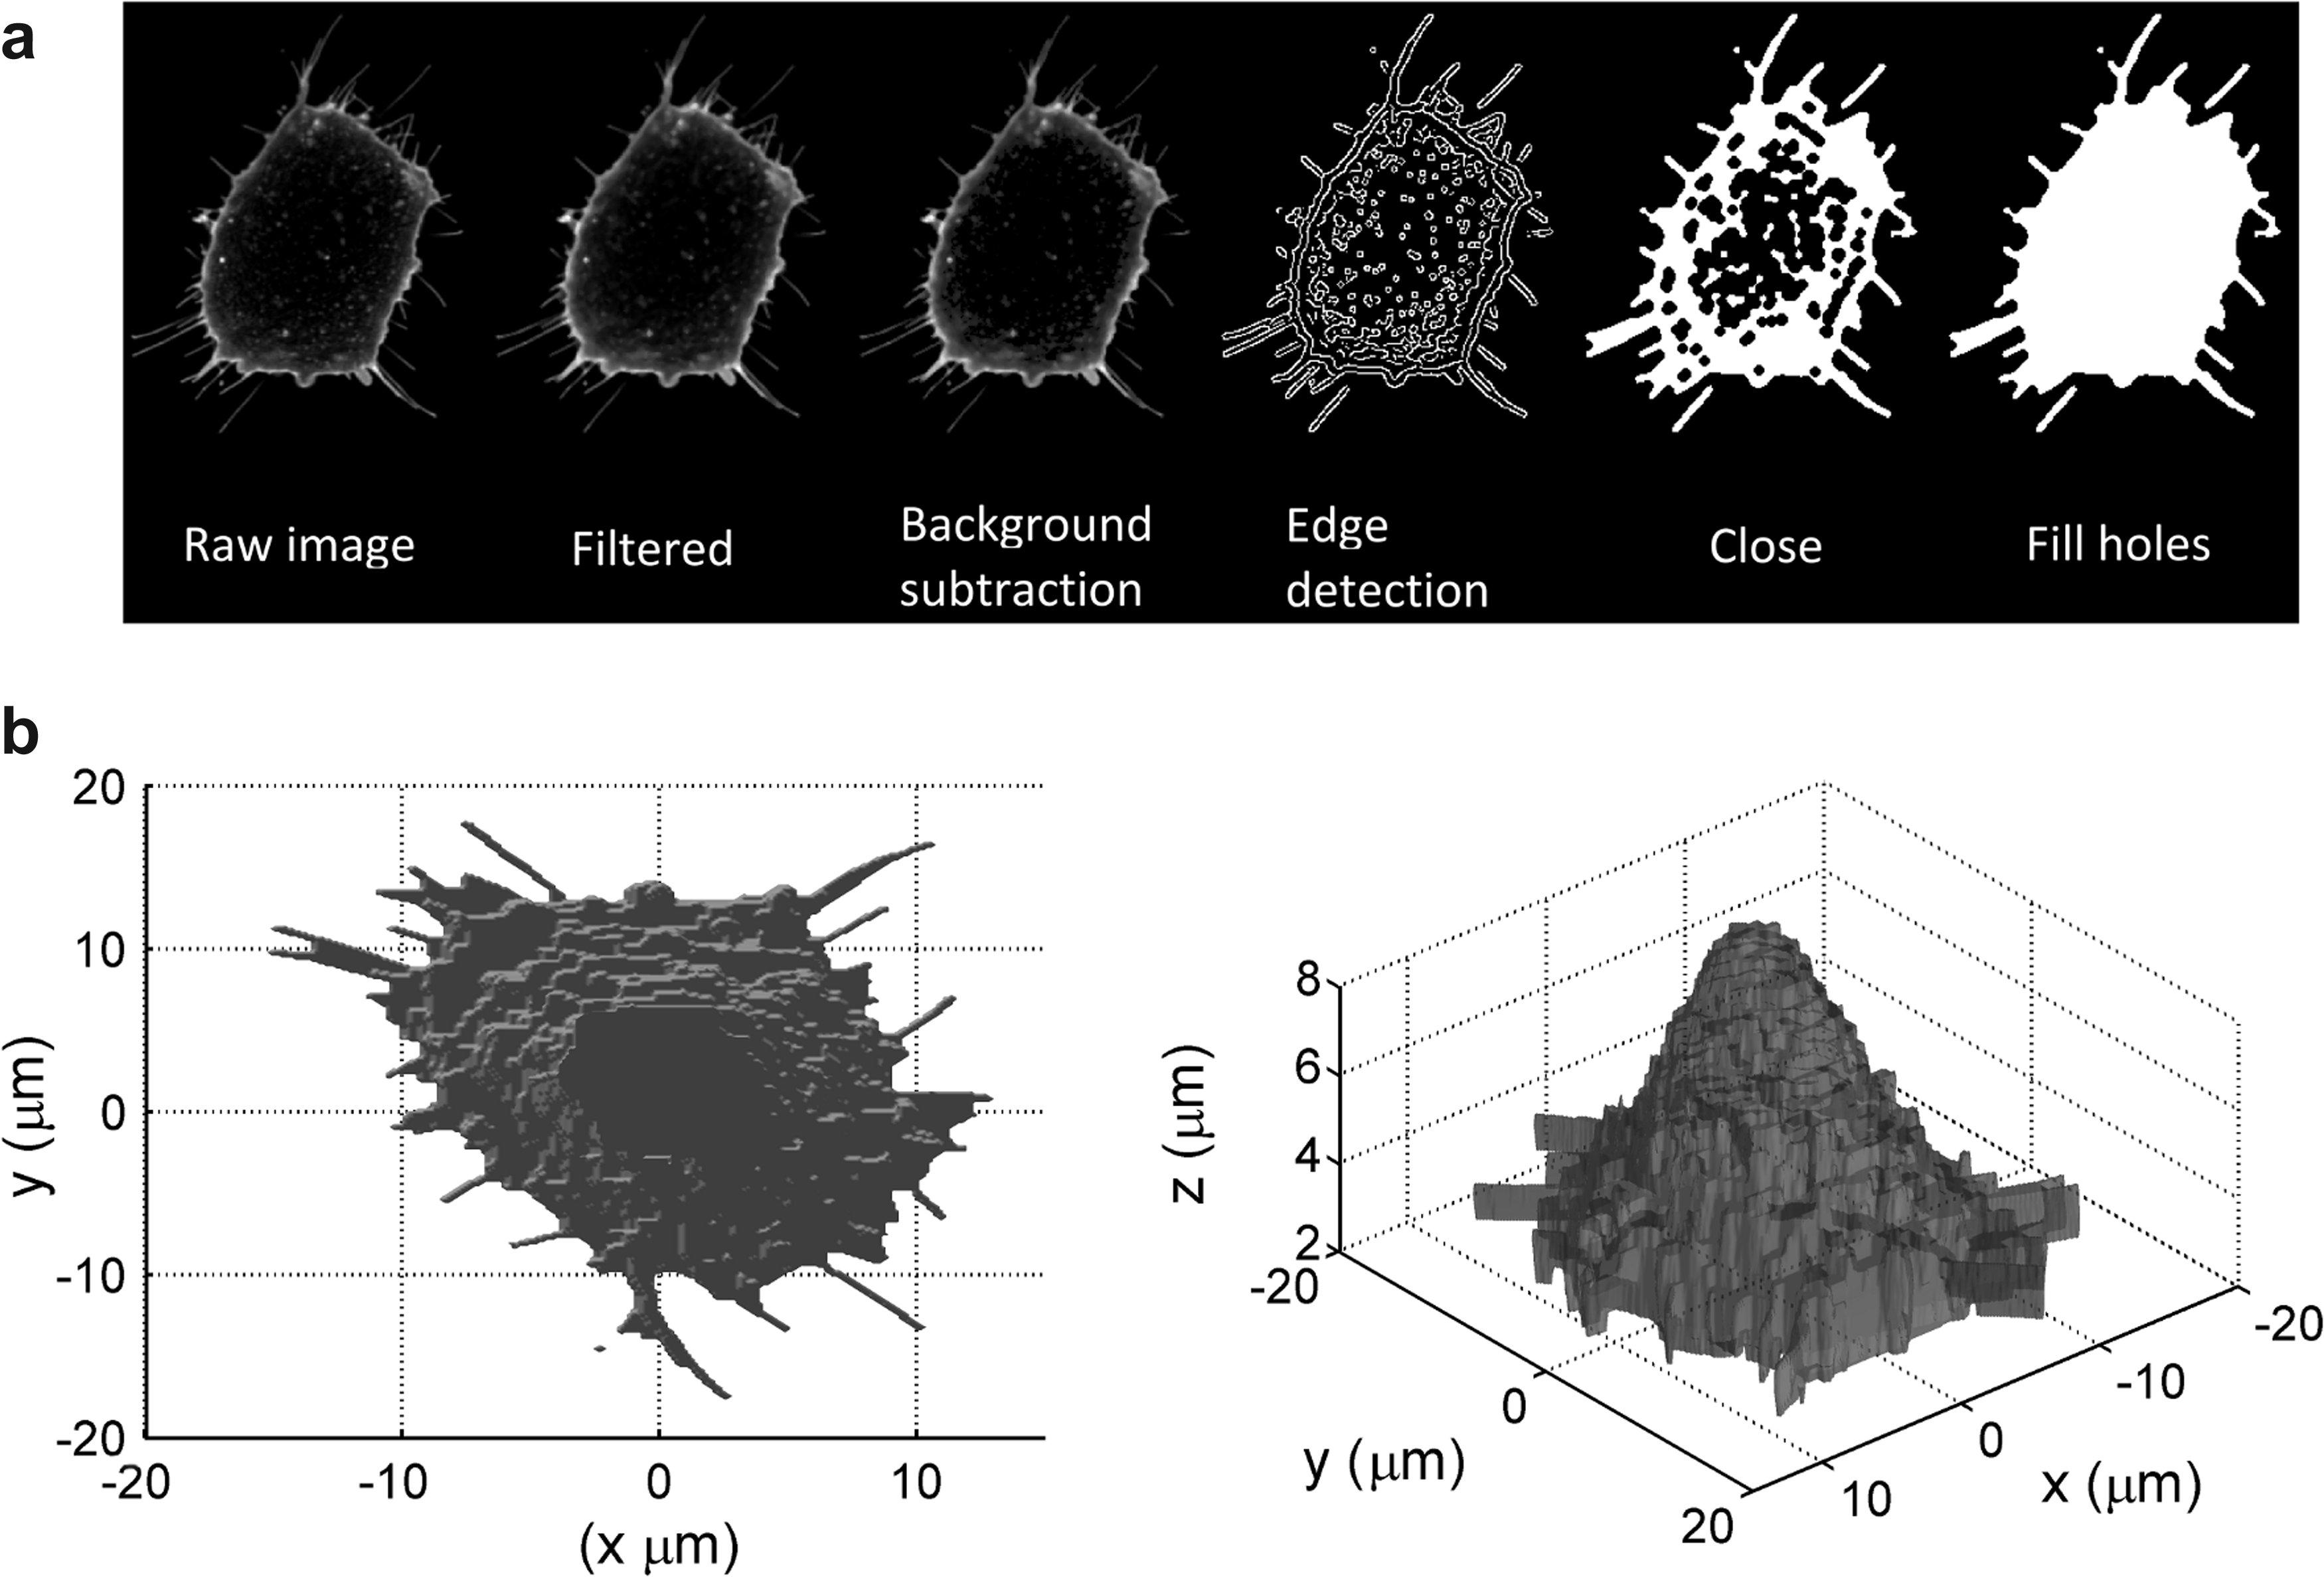
The measured cross-sectional area of the cell versus height gives a 2D representation of the 3D cell shape from which it is possible to extract simple quantitative shape metrics such as the maximum cross sectional area or cell footprint, the cell thickness and volume. The use of cell footprint area rather than cell contact area means that it is not necessary to precisely define the location of the substrate surface, which is challenging using a CLSM due to its limited axial resolution. Furthermore, for highly textured or patterned materials it is difficult to define the “surface” of the substrate. We define the cell thickness as the height interval over which the cross sectional area of the cell is greater than 5% of the maximum. This “area thresholding” helps to exclude the effect of noise or small fragments or debris in the image field from the measurement of the cell thickness.
Validation of morphometry
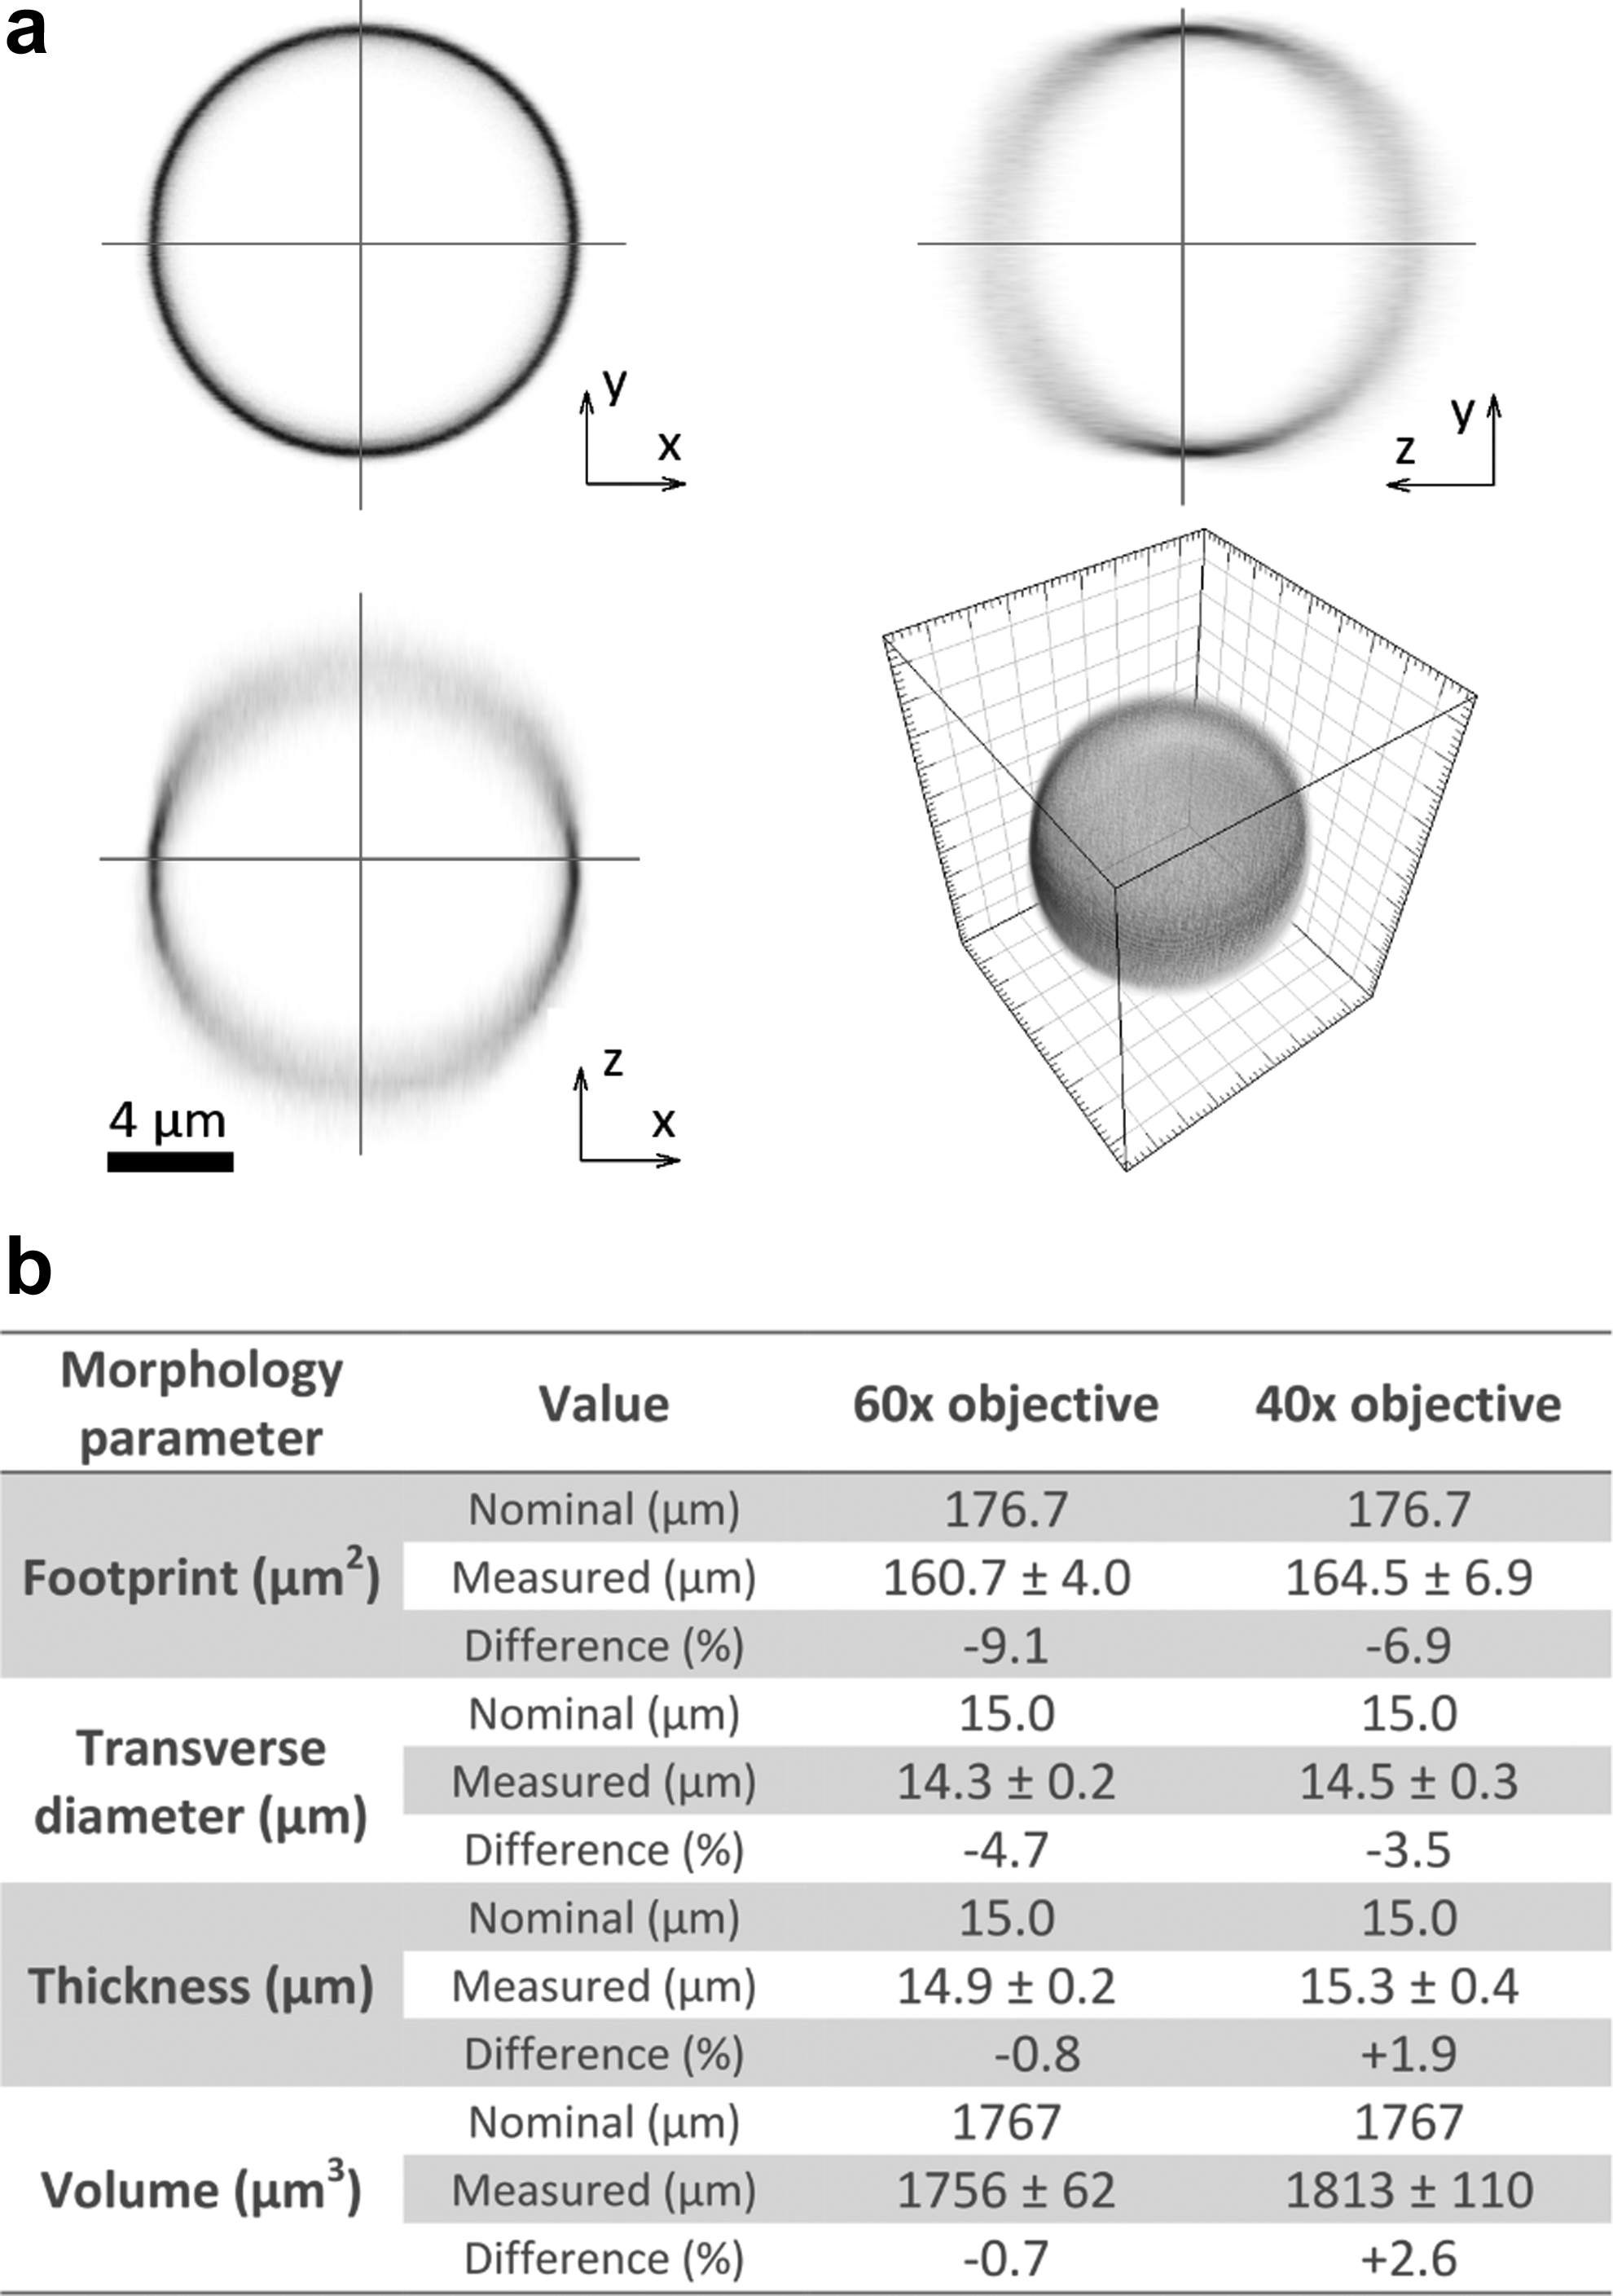
To validate our morphometry technique, we imaged five fluorescent microspheres (FocalCheck; Invitrogen) with the 40×and 60×microscope objectives used for cell imaging. The microspheres have a nominal diameter of 15 μm and their outer shell is stained with a fluorescent dye, which is efficiently excited at 488 nm. The images were acquired using the same protocol as that used to image the MG63 cells on the fibronectin-coated and uncoated glass control substrates. Figure 3a shows a reconstructed 3D image of one of these microspheres along with 2D slices in three mutually orthogonal planes through the center of the microsphere. Figure 3b shows a comparison of nominal morphometry results for the FocalCheck microsphere with those computed from confocal z-stacks. In general, there is good agreement between the measured and nominal values. The PSF of a confocal microscope is extended in the axial direction compared with the transverse direction, 38 which explains why the measurement of the axial diameter (thickness) of the microspheres is generally greater than the transverse diameter. In principle, the blurring effect of the PSF can be compensated by performing a deconvolution operation on the acquired images 38 ; however, in practice, this can lead to a degradation in the signal-to-noise ratio of the images, and we have not used such a technique in this study.
Results and Discussion
A: MG63 cells on uncoated glass and fibronectin-coated glass substrates
Figure 4 shows the mean cell footprint area, thickness, and volume results for MG63 cells on uncoated glass and fibronectin-coated glass substrates along with sample 2D image projections, which show visually how the cell morphology changes over the first 90 min after seeding. Shortly after seeding, the mean footprint and thickness values are similar for both substrates; there then follows a rapid and pronounced difference in the way these parameters change over time. The cells spread significantly faster on the fibronectin-coated substrate than on glass, this is apparent from both the fast rate of increase in the cell footprint and decrease the cell thickness. The mean cell volume (Fig. 4e) appears to increase slightly over time, but this trend is not significant given the large standard deviation in the measured values at each time point. The measured cell volume is systematically greater for cells on fibronectin, this may indicate a systematic measurement bias for cells with a more spread out shape, that is, with a larger footprint area and a smaller thickness, or potentially volume changes caused by reorganization of the cytoskeleton.
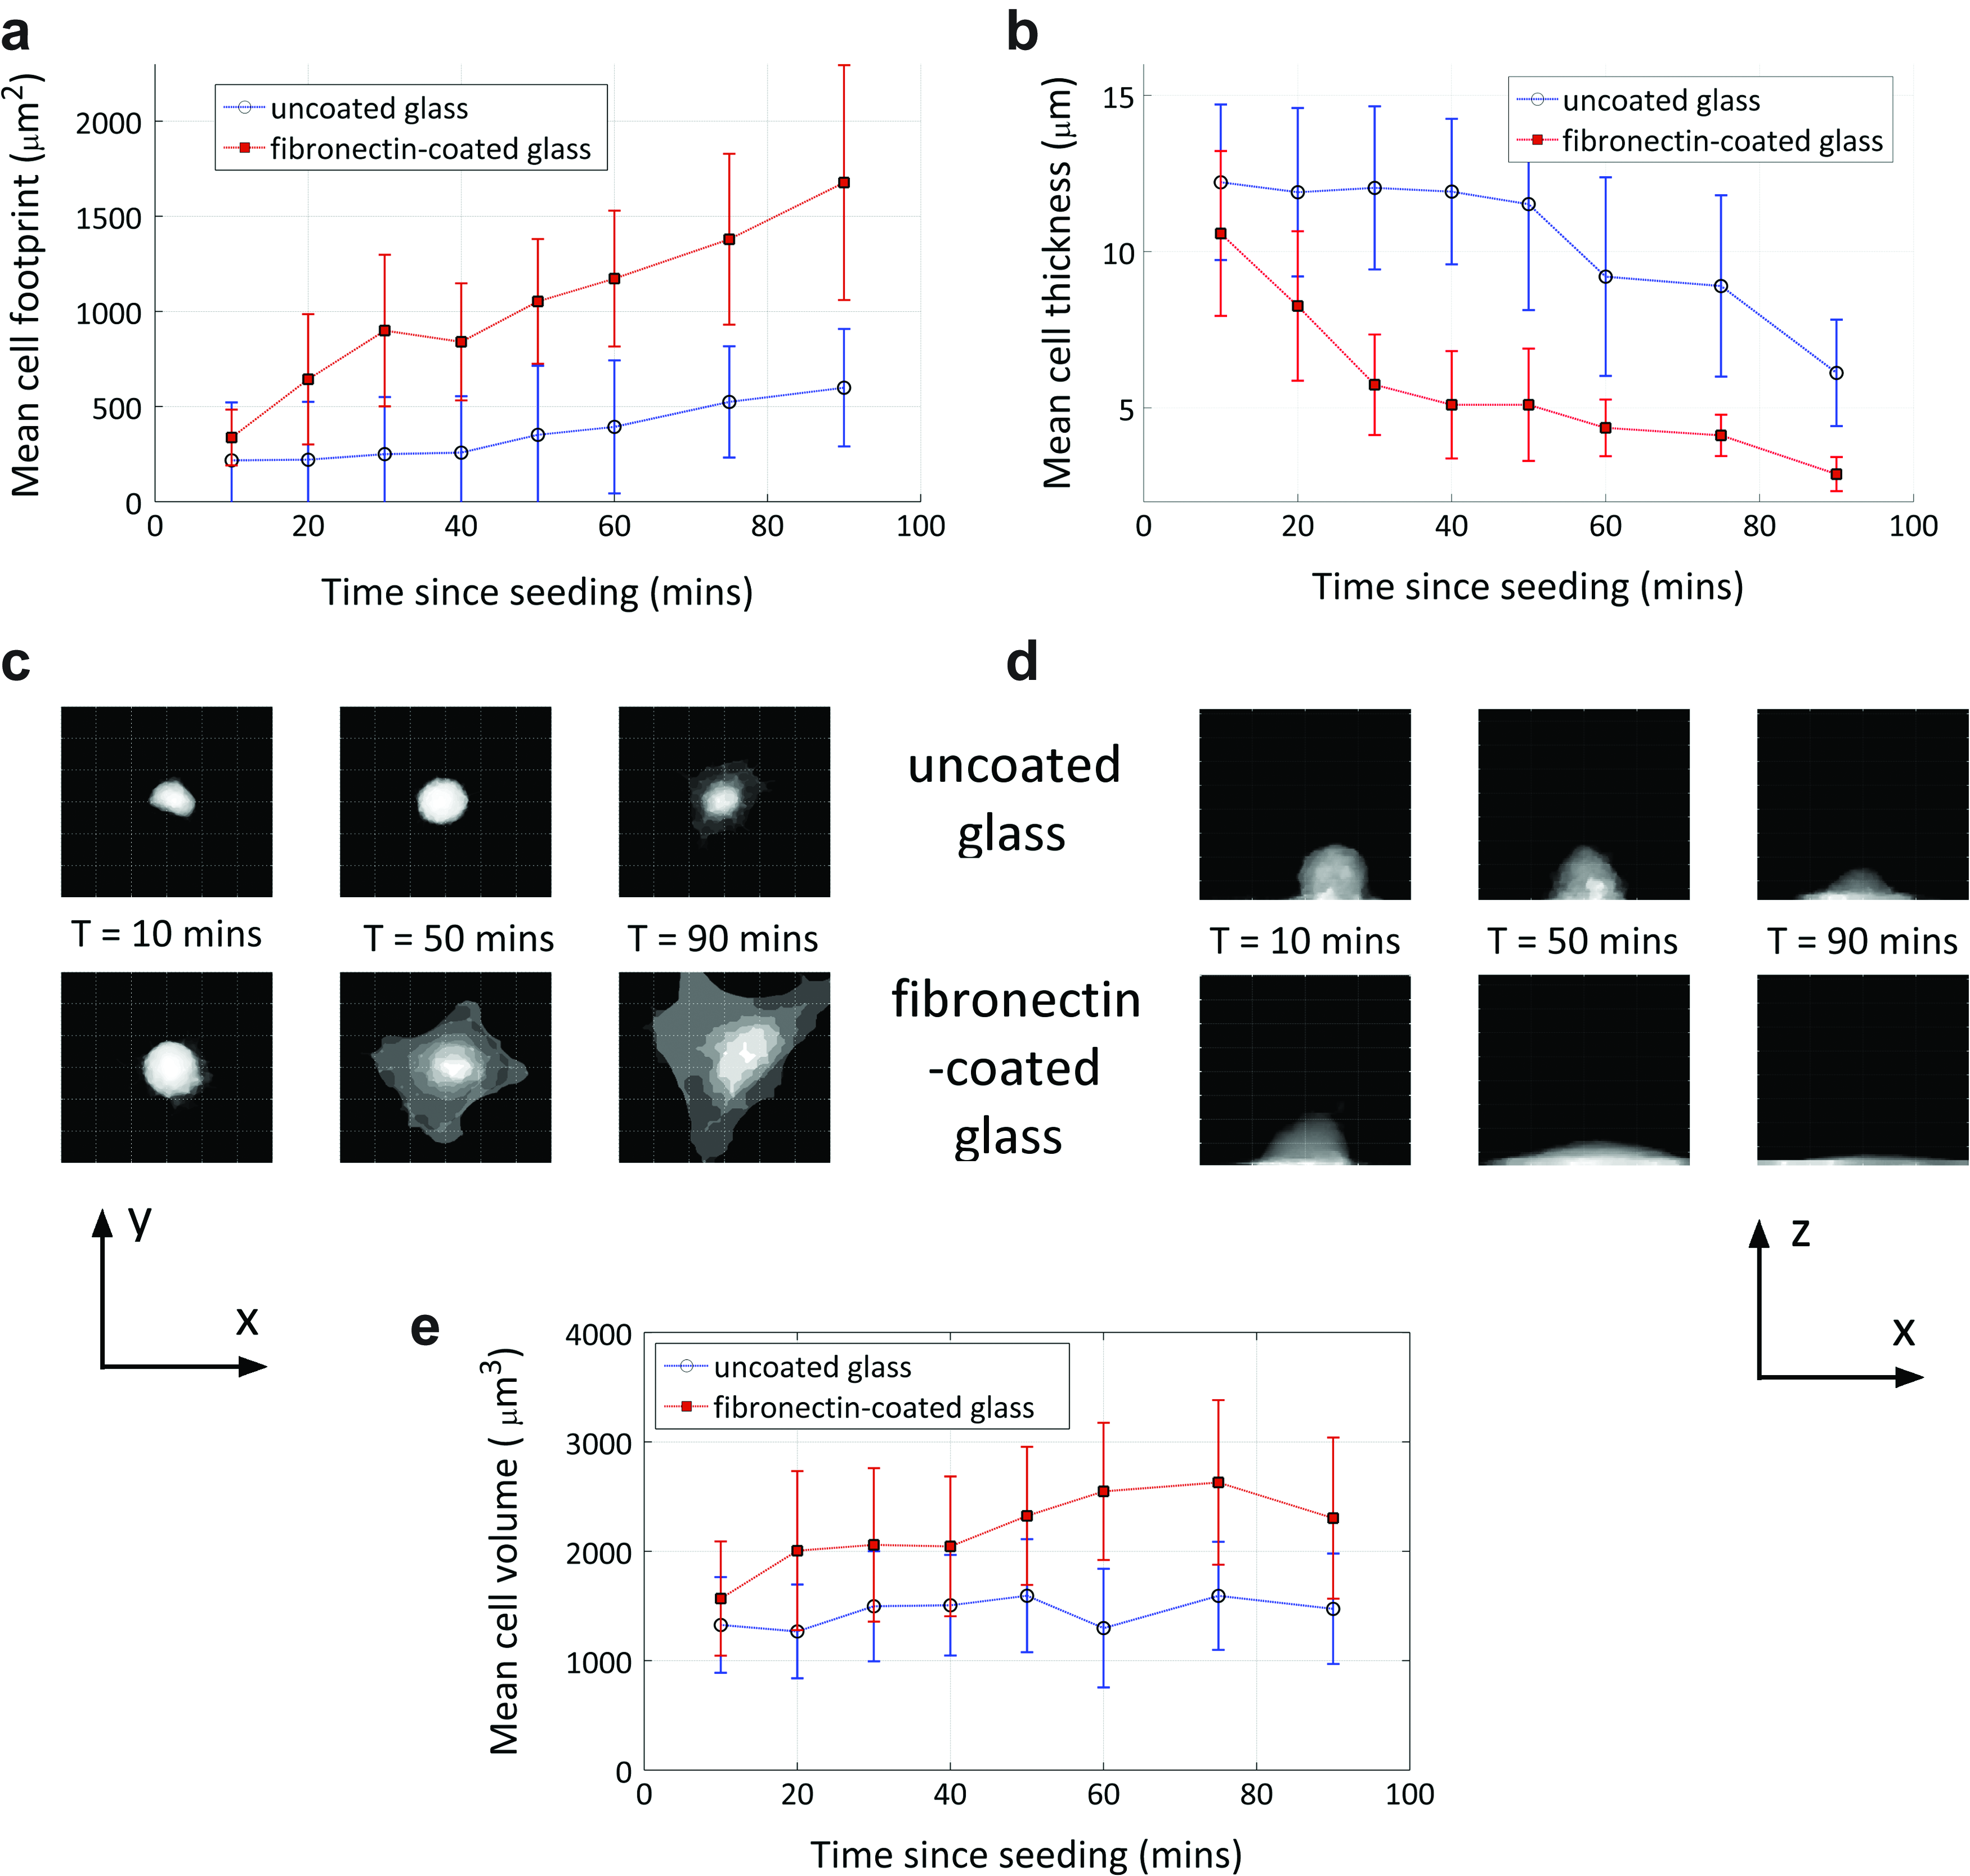
Mean cell morphometry results for 20 MG63 cells on uncoated and fibronectin-coated glass substrates:
The differences in cell thickness and footprint on the coated and uncoated substrates are clearly discernible outside the statistical variation in cell behavior for each substrate. To quantify and compare the ability of these two metrics to discriminate between differences in cell morphology, we performed paired, two-sided Student's t-tests for each metric on both substrates. The resulting probability, p, that the measurements of a given metric on both substrates are drawn from the same distribution was then used to compute the self-information, I, of each metric according to:
A confidence level of 95% (p=0.05), thus corresponds to a self-information of 4.32. Self-information is useful for comparing metrics when the cells exhibit large differences in morphology and p-values are very small.
Figure 5 shows the self-information in the footprint area and thickness data at each time point. Thirty and 40 min after seeding cell thickness has a substantially higher self-information, while at later times both metrics are similar. This suggests that thickness may be a better metric for detecting differences in cell morphology. Although for uncoated and fibronectin-coated glass, both metrics perform well, our results suggest that cell thickness is a better differentiator of cell morphology than cell footprint area.
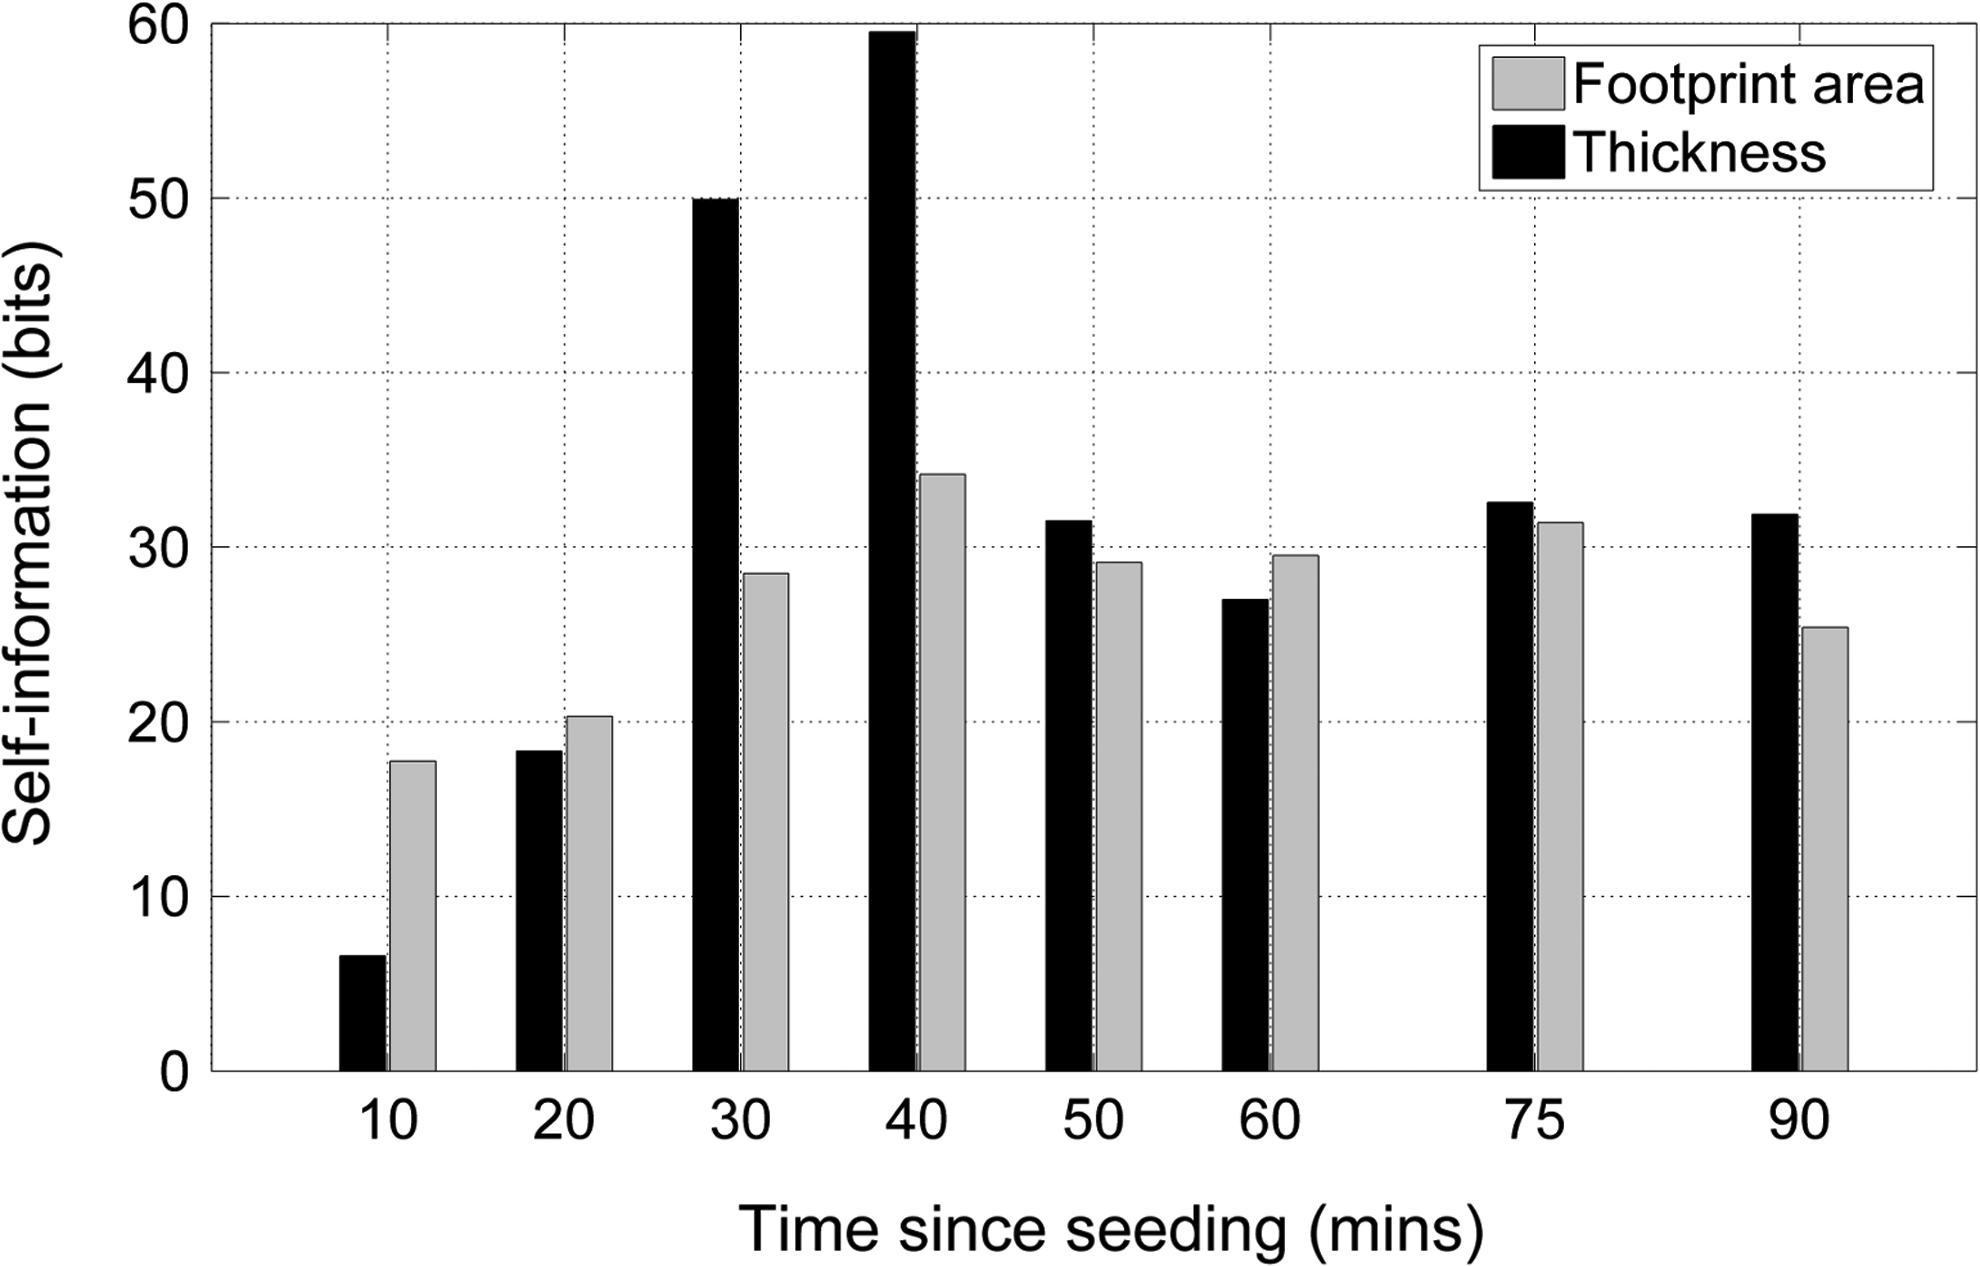
Comparison of self-information of footprint area and thickness data for MG63 cells on uncoated glass and fibronectin-coated glass substrates.
B: MG63 cells on glass and titanium substrates
Figure 6 shows the temporal evolution of measured morphological parameters for MG63 cells on titanium and uncoated glass substrates. MG63 cells spread faster, as judged by an increase in cell footprint and reduction in cell thickness, on titanium than on the uncoated glass substrate and this difference is most pronounced in the thickness data. As with the data for fibronectin-coated and uncoated glass, the cell volume does not vary significantly over time; however, measured volumes are systematically larger for cells on the titanium substrate. 10 min after seeding, the cells on glass have a larger thickness than those on titanium, whereas the volume and footprint area are similar, suggesting a difference in overall cell morphology between the two substrates at this time. These differences in cell morphology may be attributable to differences in surface chemistry or topography between the substrates. However, the focus of our work has been to develop a reliable procedure for quantifying 3D cell morphometry, and the detailed mechanisms of change in cell morphology are beyond the scope of this article.
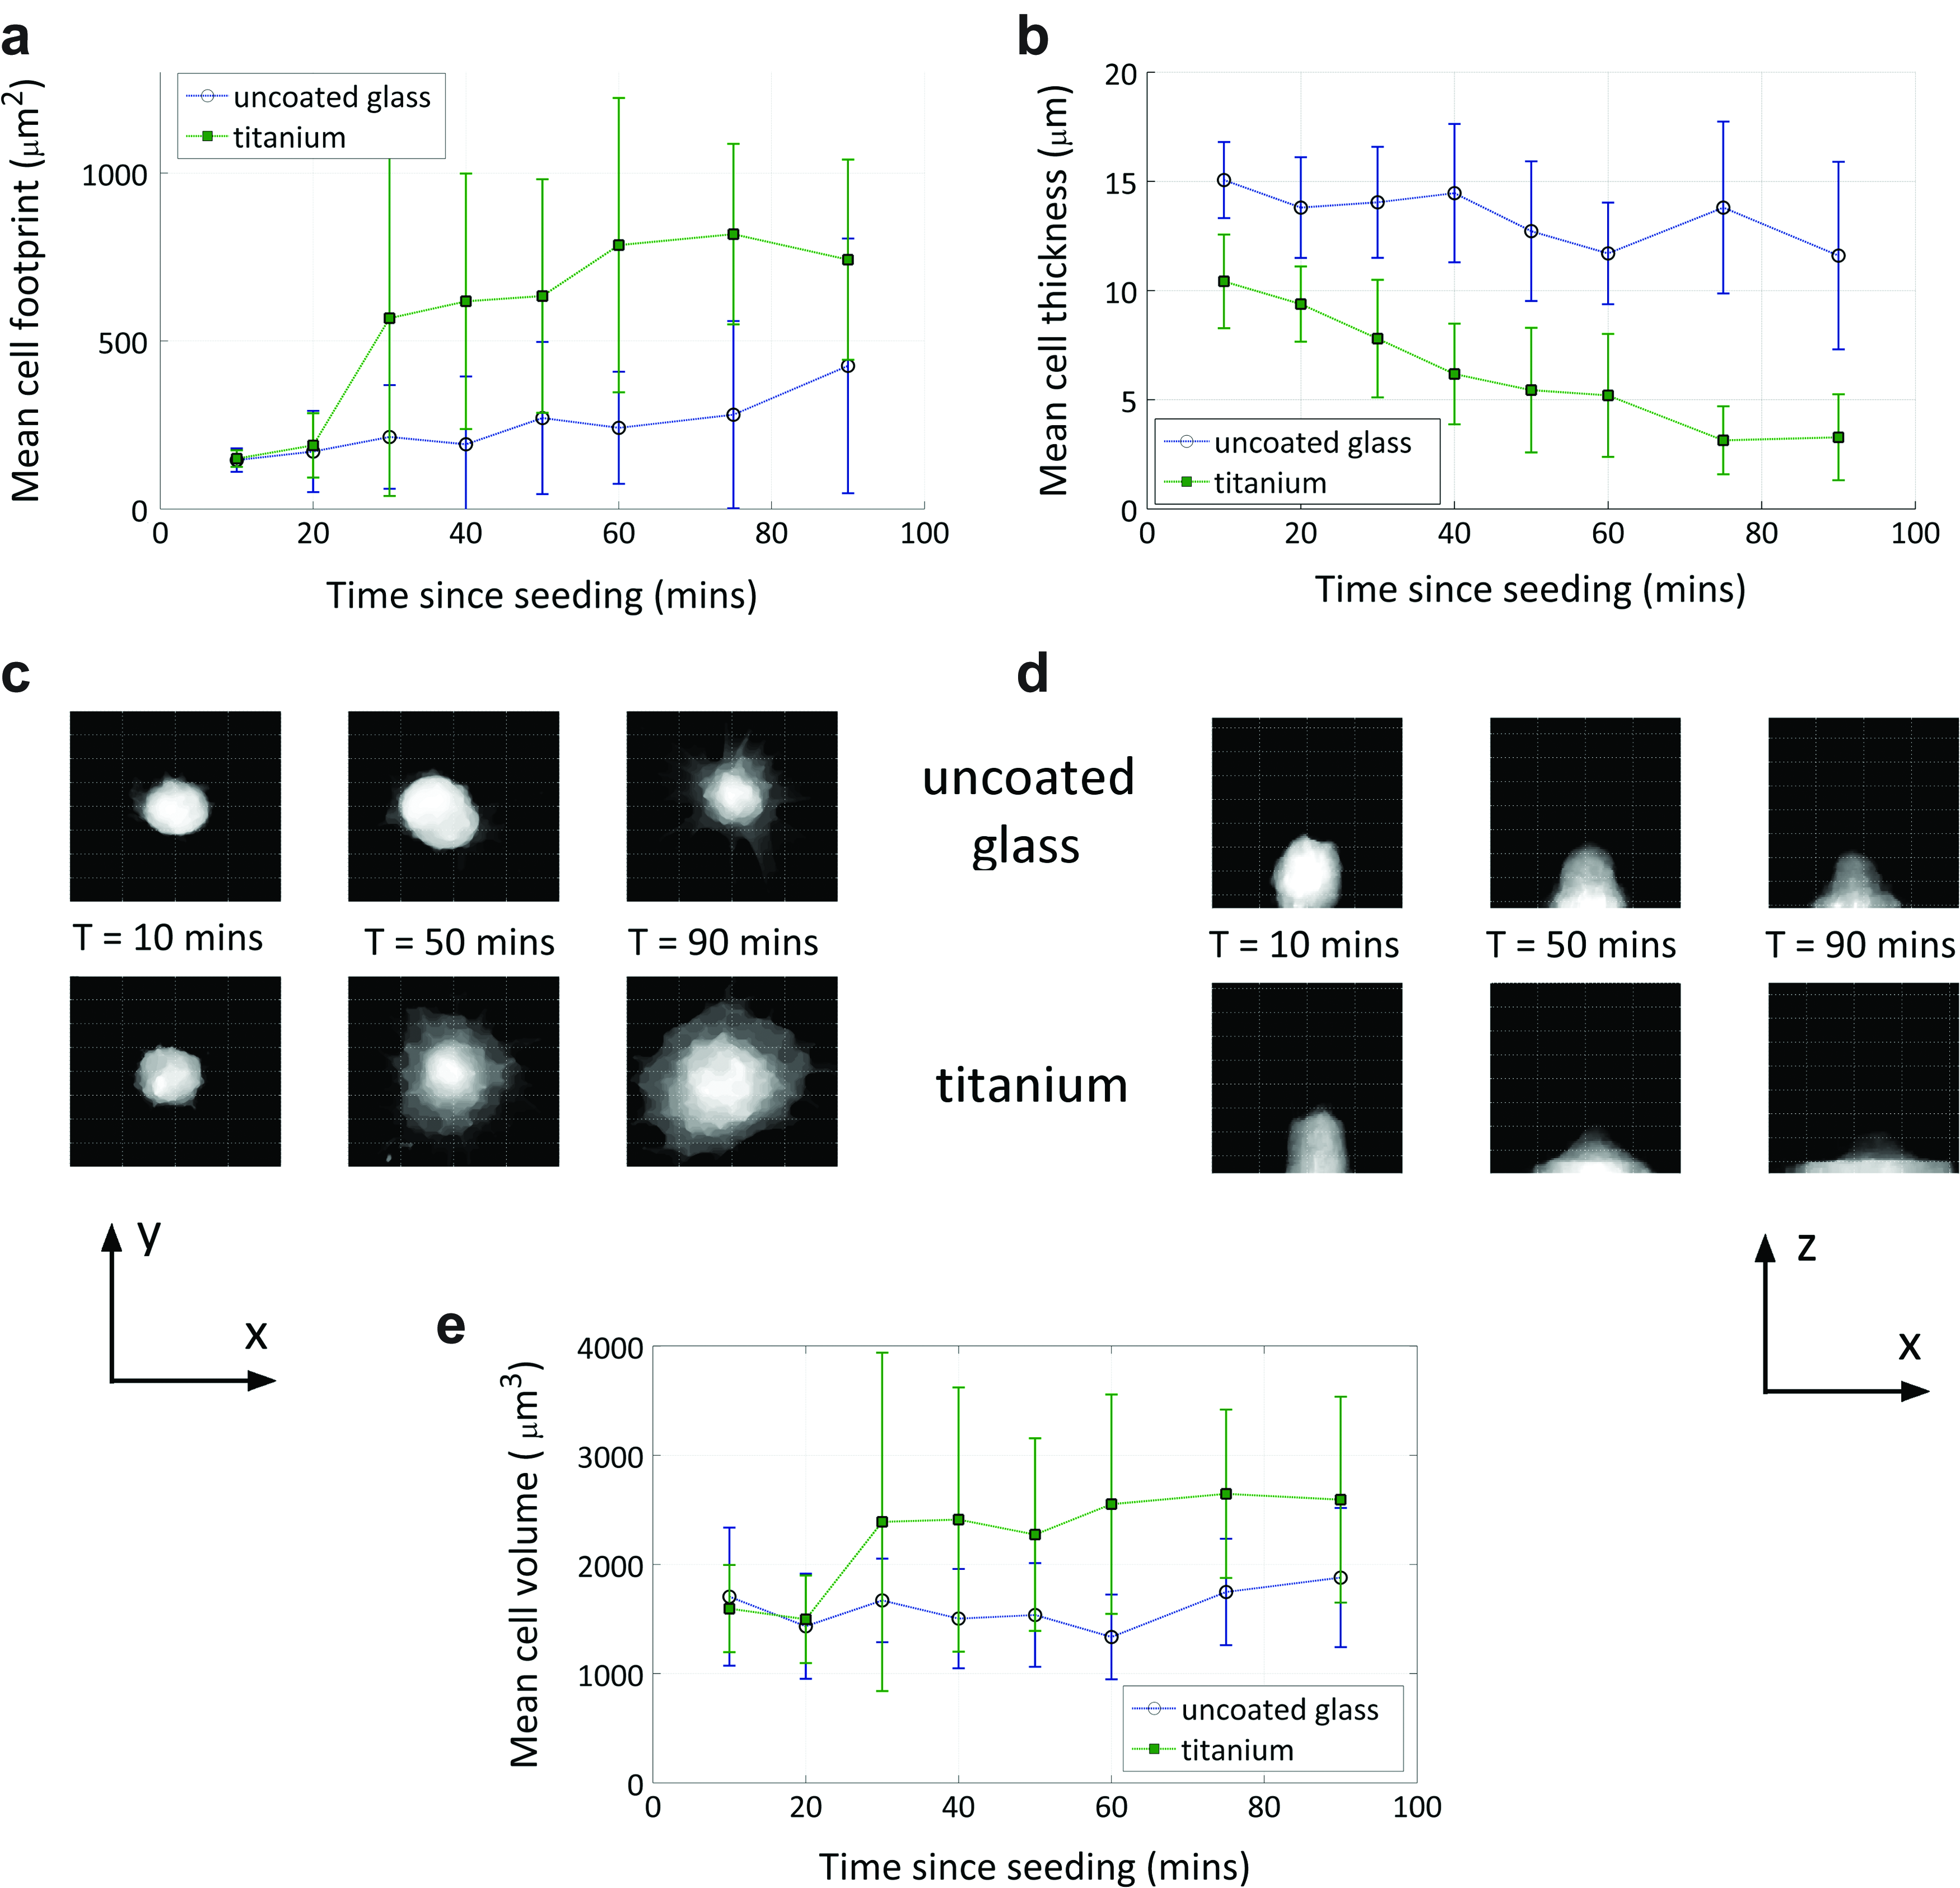
Cell morphometry results for MG63 cells on uncoated glass and titanium substrates:
Due to differences in the processing and analysis of the acquired images and the fact that different batches of cells were used, a direct comparison between dataset A (uncoated glass and fibronectin-coated glass substrates) and dataset B (uncoated glass and titanium substrates) is not possible; although, the qualitative trend of a gradual increase in the footprint area on uncoated glass is apparent in both sets of data. In general, such differences can be minimized by preparing all of the different cell-seeded substrates simultaneously using the same batch of cells. The rate of decrease in cell thickness on uncoated glass is noticeably slower in dataset B. As for dataset A, we compared the footprint area and thickness metrics using a paired, two-sided Student's t-test. The results (Fig. 7) show a clear difference in the two metrics, with the cell thickness metric having a much higher self-information at all times postseed. This suggests that, using our measurement method, cell thickness appears to be a better (more sensitive) discriminator of differences in cell morphology than the cell footprint area.
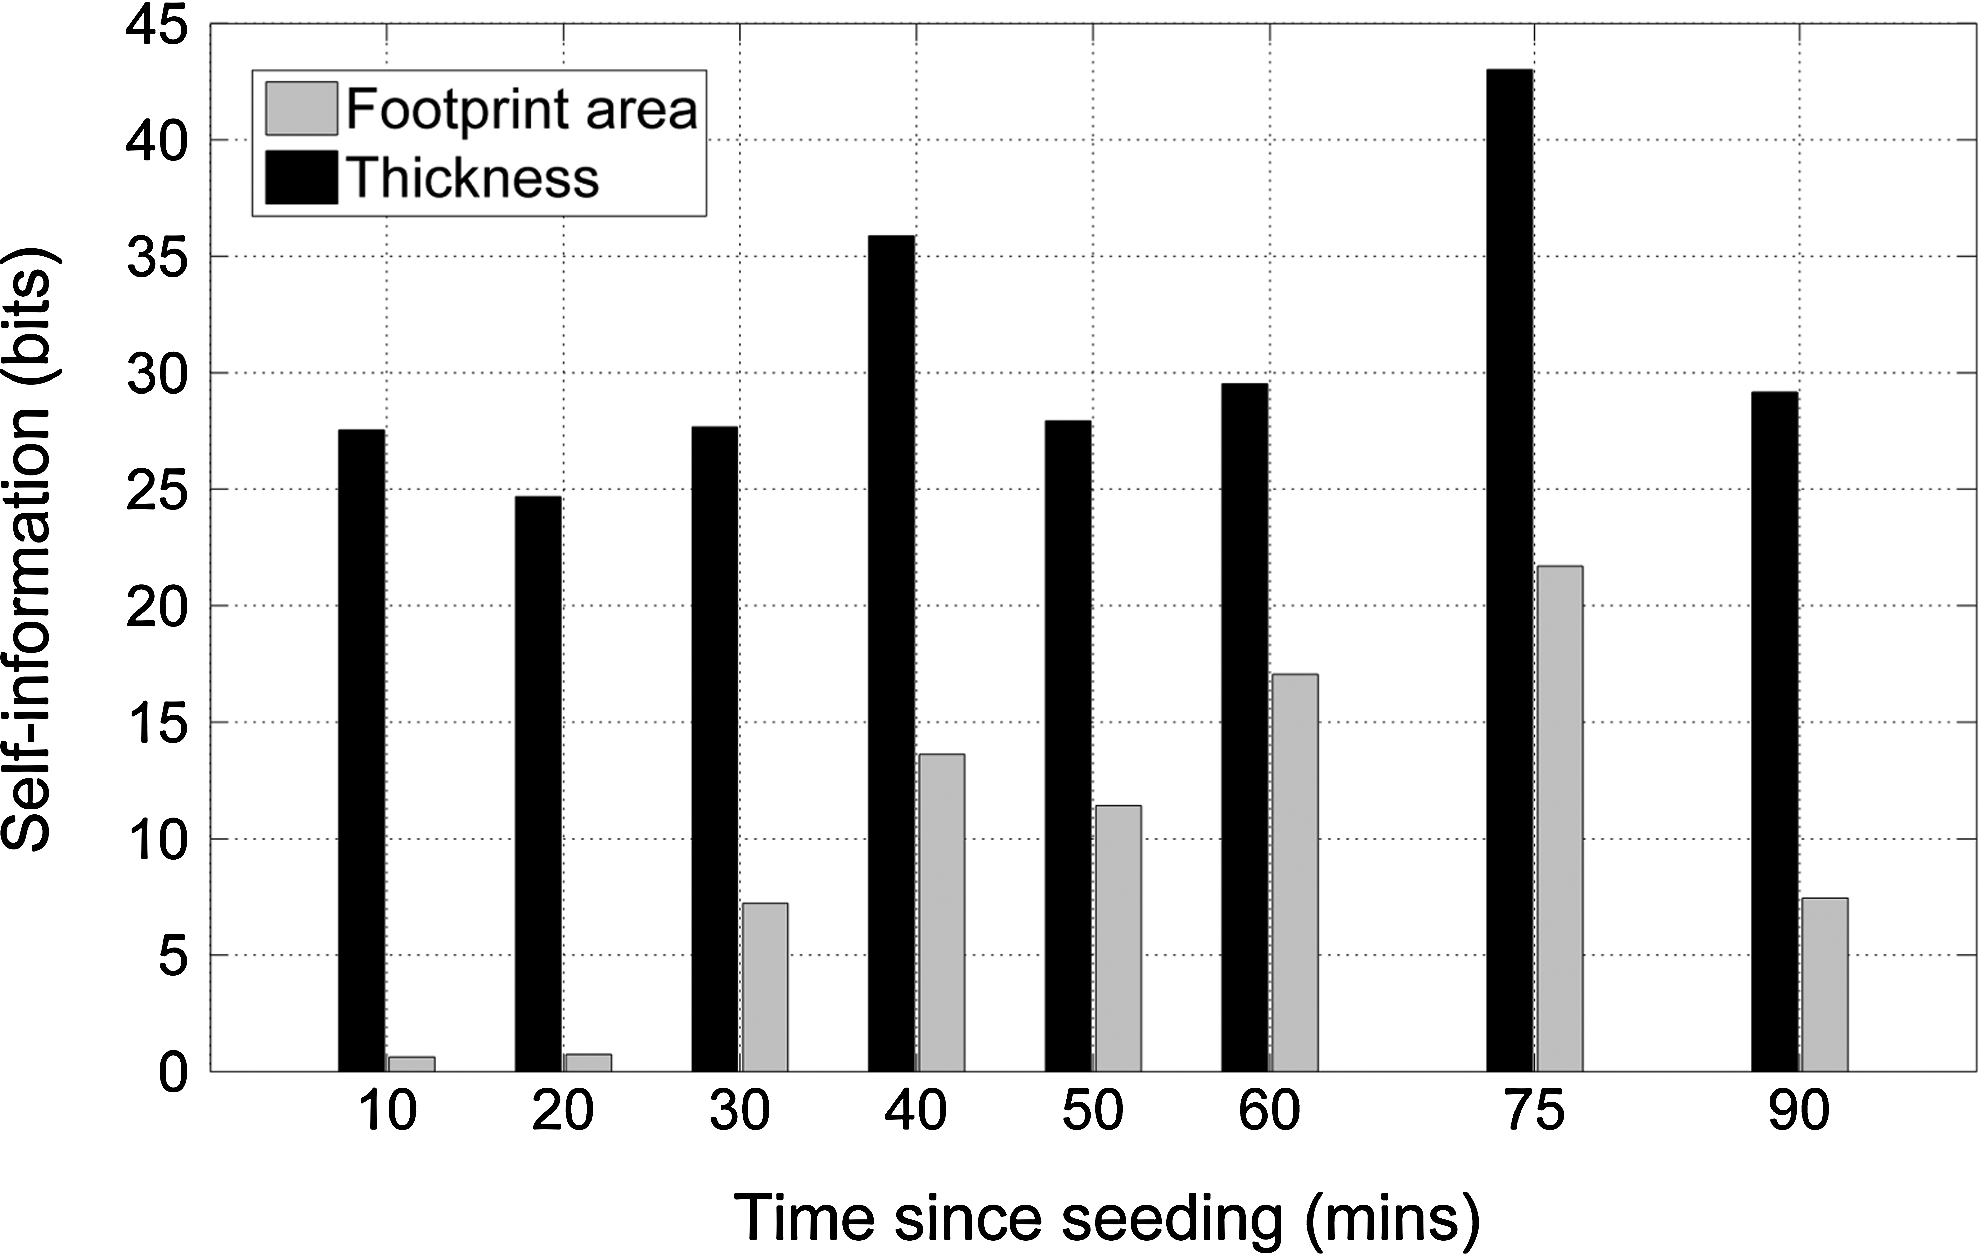
Comparison of self-information of footprint area and thickness data for MG63 cells on uncoated glass and titanium substrates.
As with dataset A, both metrics clearly indicate significant differences in cell morphology; however, the larger self-information for cell thickness suggests that this metric is able to discriminate between smaller morphological differences. High sensitivity is important when assessing cell behavior on substrates with similar topography and chemistry. In such cases, measuring both cell footprint and cell thickness together would provide an improved ability to detect smaller differences in cell morphology with a greater degree of confidence.
Conclusions
We have demonstrated a procedure for measuring the 3D morphology of cells on different substrates using confocal laser scanning microscopy and image processing techniques. This procedure was tested on samples of MG63 osteosarcoma cells sparsely seeded onto uncoated borosilicate glass, fibronectin-coated glass, and titanium substrates. Consistent with other studies, our results indicate that osteosarcoma cells spread significantly faster on fibronectin-coated glass and titanium substrates than on uncoated glass. Although large differences in both the cell footprint area and cell thickness were measured for both fibronectin-coated glass and titanium substrates when compared with uncoated glass, we found that differences in cell thickness were, in general, more statistically significant than those in the footprint area. This suggests that cell thickness is a more sensitive discriminator of differences in cell morphology. In practice, when comparing cell behavior on substrates with similar topological and chemical properties, measurement of both metrics would allow detection of smaller morphological differences with a greater degree of confidence.
Three-dimensional cell morphometry also allows the monitoring of other morphology parameters, for example, changes in cell volume that can provide an early indication of the onset of cell death. Such a method has significant potential use as a tool for quality control and for selecting and optimizing surface coatings and finishes for a variety of biomaterials applications.
The morphometry method described in this article could in principle be applied to track the surface attachment of living cells in real time providing sufficient image contrast is available without inducing adverse phototoxic or photothermal effects. This could be achieved through the use of live cell compatible fluorescent labels or alternatively by exploiting a label-free optical sectioning modality such as third harmonic generation microscopy. 39 In recent years, a number of super-resolution optical microscopy techniques have been demonstrated for cellular imaging with a spatial resolution below the diffraction limit,40–42 allowing the possibility of more accurate cell morphometry. In particular, structured illumination microscopy allows rapid 3D imaging with a variety of fluorescent labels and has been applied to image live cells. 43 Such methods have significant potential to detect and quantify smaller morphological differences leading to a better understanding of cell–substrate interactions.
Footnotes
Acknowledgments
This work was funded by jointly by the European Metrology Research Programme (Project JRP4) and the UK National Measurement Office.
The identification of certain commercial equipment does not imply recommendation or endorsement by NPL, nor does it imply that the equipment identified is the best available for the purpose.
Disclosure Statement
No competing financial interests exist.