
Abstract
Smooth muscle cells (SMC) play a central role in maintaining the structural and functional integrity of muscle tissue. Little is known about the early in vitro events that guide the assembly of ‘bioartificial tissue’ (constructs) and recapitulate the key aspects of smooth muscle differentiation and development before surgical implantation. Biomimetic approaches have been proposed that enable the identification of in vitro processes which allow standardized manufacturing, thus improving both product quality and the consistency of patient outcomes. One essential element of this approach is the description of the SMC secretome, that is, the soluble and deposited factors produced within the three-dimensional (3D) extracellular matrix (ECM) microenvironment. In this study, we utilized autologous SMC from multiple tissue types that were expanded ex vivo and generated with a rigorous focus on operational phenotype and genetic stability. The objective of this study was to characterize the spatiotemporal dynamics of the first week of organoid maturation using a well-defined in vitro-like, 3D-engineered scale model of our validated manufacturing process. Functional proteomics was used to identify the topological properties of the networks of interacting proteins that were derived from the SMC secretome, revealing overlapping central nodes related to SMC differentiation and proliferation, actin cytoskeleton regulation, and balanced ECM accumulation. The critical functions defined by the Ingenuity Pathway Analysis included cell signaling, cellular movement and proliferation, and cellular and organismal development. The results confirm the phenotypic and functional similarity of the SMC generated by our platform technology at the molecular level. Furthermore, these data validate the biomimetic approaches that have been established to maintain manufacturing consistency.
Introduction
Continued progress in the clinical development of SMC-based tissue engineering and regenerative medicine is linked to the establishment of safe and consistent manufacturing methods13,16–19 and the use of biomimetic approaches in process design and qualification.17,19,20–22 Standardized manufacturing includes the use of well-controlled processes and controls in addition to product release specifications, to collectively impart product quality. Biomimetic approaches are considered a rational methodology for designing in vitro processes based on a molecular understanding of what makes a tissue different from a three-dimensional (3D) construct or conventional 2D culture.17,19,21 Moreover, it has been argued that unless in vivo developmental processes can be recapitulated in vitro, the quality of the engineered tissues will be uncertain and inconsistent.19,21 Thus, the new paradigm in tissue engineering is based on the design of intermediate tissue forms that mimic the developmental events of the native tissue.2,17,19,21,23 In particular, the focus has now shifted to the first stages of tissue development, for example, the subsets of moldable functional ontogeny mechanisms at the initiation of bioartificial tissue formation in vitro. The reason for this shift is that the setting of optimal conditions early may enable the seeded cells to adopt their in vivo characteristics in the 3D tissue context and, thus, accurately activate the complete set of subsequent differentiation pathways which leads to neo-tissue remodeling.2,17,19,22 Process development could, therefore, define and implement parameters for each relevant in vitro stage to promote the desired stable cell state and tissue fate. 19 To this end, a platform technology that incorporates 3D-engineered tissues and bioreactor strategies in the development of bioartificial tissue in vitro may be a robust strategy for mimicking in vivo counterparts before surgical implantation.
Several preclinical or clinical studies designed to evaluate smooth muscle tissue development have determined that engineered implants made with progenitor cells (autologous SMC and/or urothelial cells from native healthy or diseased tissues) seeded on biodegradable biomaterial consistently give rise to durable regenerative healing.4,8,10,11,24 On retrieval, the regenerated tissues showed a normal cellular composition, consisting of a trilayer of authentic urothelium, submucosa, and smooth muscle. Jayo and colleagues 4 demonstrated that engineered cellular implants were transformed to regenerated bladder with greater detrusor muscle, native viscoelastic stromal composition, and less fibrous connective tissue than their acellular counterparts in preclinical studies. The smooth muscle layer was predominantly populated by morphologically and phenotypically native SMC. Functionally, the regenerated bladders possessed larger volume capacity and near-normal bladder compliance 9 months after augmentation. 4 In light of this, emphasis has evolved to simplify and enhance manufacturability using a platform technology.1,19
Inspired by the preclinical and clinical success in the development of neo-tissues from target tissues or organs,4,8,10,11,24 the current study was designed to investigate the critical parameters that guide early events in the manufacturing of smooth muscle tissues (contructs) before implantation. We hypothesized that SMC secrete and deposit bioactive molecules at biologically relevant concentrations during the manufacturing of a bioartificial tissue using our platform technology, mimicking the spatiotemporal dynamics of native tissue development. We were also intrigued by the potential impact of the tissue source of the SMC (i.e., whether healthy or diseased, and homologous, or heterologous) on the secretome. To address these questions, we used functional proteomics that identify the topological properties of the networks of interacting proteins which were derived from the secretomes of SMC in 3D models (and 2D controls) of cellular implants that were constructed with homologous or heterologous SMC. These results highlight the key attributes of the SMC that are most closely associated with neo-tissue development: A concerted progression in the differentiated phenotype, genetic stability, spatiotemporal organization, and biological potency within the extracellular matrix (ECM) of the newly developing microenvironment. To our knowledge, this is the first report that comprehensively documents the native tissue-like characteristics of a bioartificial tissue constructed on a 3D platform using well-controlled manufacturing technology. This study adds important new information to our knowledge of smooth muscle tissue development and has multiple clinical implications for tissue engineering and regenerative medicine.
Materials and Methods
Preparation of SMC
SMC were obtained from the following human tissues: adipose tissue that was obtained via elective subcutaneous harvest or liposuction from healthy subjects (ages 25 to 51; 14 women and 1 man; Zen-Bio); neurogenic bladder tissue from affected live patients (ages 3 to 42; 8 women and 8 men) obtained with the consent of the patients or their parents and institutional review board approval (clinical trials.gov: NCT00419120); non-neurogenic bladder from live adult patients (ages 55 to 77; 4 men) obtained with their consent and institutional review board approval (clinicaltrials.gov: NCT00615043, NCT00577785); and three cadaveric biopsies (ages and genders unknown; National Disease Research Interchange).
Primary ex vivo cultures of Ad-SMC (n=68) were generated from the stromal vascular fraction of adipose tissue as previously described. 12 The initial Ad-SMC culture and subsequent expansions (both of which are plastic adherent) were grown in high-glucose Dulbecco's modified Eagle's medium (DMEM-HG) containing 10% fetal bovine serum and 5 μg/mL gentamicin (defined as “growth medium with gentamicin”; all from Invitrogen™-Life Technologies™). The resultant Ad-SMC were either evaluated for consistency for approximately eight passages (p0 to p4 and p8), or used at p2 for secretome analysis.
Primary ex vivo cultures and expansions of Bl-SMC were generated from full-thickness bladder biopsies using standard explant culture methods 4 . The resultant non-neurogenic (n=31) and neurogenic (n=18) Bl-SMC were either cultured in growth medium and characterized for approximately seven passages (p3 to p5 and p7), or used at p2 for secretome analysis.
Characterization of SMC
The SMC phenotypes were confirmed using immunocytochemistry and flow cytometry to determine the qualitative and quantitative expression of cytoskeletal (contractile) proteins, and cell health was evaluated by cell-cycle distribution and karyotype analyses.
Phenotype
Cell cultures were probed for cytoskeletal (contractile) marker proteins that are specific or highly expressed by SMC (SMA, CaP, CaD, and SM22α) using the antibody pairs described in Table 1. SMC were evaluated in culture by immunocytochemistry (qualitative and quantitative) and by flow cytometry (after trypsinization). Nuclear counterstaining was performed with Hoechst 33342, trihydrochloride, trihydrate (1 μg/mL; Invitrogen), or 4′,6-diamidino-2-phenylindole dihydrochloride (DAPI, FluoPure™; Invitrogen). Cells were viewed using Leica DMI 4000 B/CTR 4000 fluorescence microscopes (Leica Microsystems) with Simple PCI 6 software (Hamamatsu). The numbers of smooth muscle a-actin (SMA)-positive cells in Ad-SMC (n=12) were counted and compared with the positive control (non-neurogenic Bl-SMC standard cultures ≥95% SMA positive).
All secondary antibodies used at 1:500 dilution.
ECM, extracellular matrix; SMC, smooth muscle cells.
Flow cytometric analysis was performed using Guava® EasyCyte™ Mini and Express Plus software (Millipore). One to three SMC-specific biomarkers in SMC cultures (n=64, Ad-SMC; n=18, neurogenic Bl-SMC) were scored and compared with the positive control (non-neurogenic Bl-SMC cultures [n=23]).
Cell health
The Guava® Cell Cycle Reagent was used according to the manufacturer's instructions to analyze the cell-cycle distribution of the SMC cultures. DNA ploidy was assessed based on the distribution of the diploid (2N, at G0/G1) and tetraploid (4N, at G2/M) populations.25,26 The percentages of resting (%2N) and doubling (%4N) cells were calculated using the mean total number of counted cells (G0/G1+S+G2/M) from two replicates of each sample as the denominator. The DNA content in Ad-SMC (n=39) at p0 to p4 was scored and compared with that in the positive control (non-neurogenic Bl-SMC standard cultures [n=10] at p3 or p4).
Cytogenetic karyotyping by G-band analysis 27 was performed according to a standardized protocol established to support product development. G-banded chromosomes from a metaphase spread (minimum of 20 for each sample) were analyzed using light microscopy (Leica DM4000 B) and mapped into karyograms using Applied Spectral Imaging software, and the resultant karyotype was reported according to the recommendations of the International System for Human Cytogenetic Nomenclature. 28 The diploid chromosome number (2n=46) was normal. Changes in chromosome number were considered to be within the normal range; polyploidization (i.e., ∼4n) was within the reported frequency of 0.5% to 20% in human tissues,26,29,30 and the loss of the X or the Y chromosome was within the expected range based on the elevated frequency in the elderly.31–33 Structural and/or numerical alterations were scored, and their sums were used to calculate the ratio of structural and numerical alterations as a measure of these types of changes. 34 The total number of alterations was used to determine the relative prevalence of the “46XX/XY karyotype” and an “altered karyotype” expressed as percentages of the whole. 34 The overall frequency of chromosomal alterations is an estimate of chromosomal instability.35–37
Tissue engineering of SMC microenvironments
The microenvironments used to evaluate the SMC secretome were constructed as described in Table 2. Cryopreserved SMC cultures were obtained from two different patient samples from each of the three tissues, all at p2, and were either directly pipetted onto PLGA scaffolds to create a 3D in vitro-like microenvironment, or seeded in six-well tissue culture plates to create a 2D in vitro microenvironment for a comparison. Three cell densities were evaluated in 3D constructs, and these were denoted as 3D-2, 3D-4, and 3D-8, respectively. One cell density was evaluated on a 2D surface and was denoted as 2D. Unseeded scaffolds or plate wells coated with a growth medium were used as negative controls.
Total surface area (based on poly[lactic-co-glycolic acid] (PLGA) coupon weight) ∼40 cm2, equivalent to a 1:10 scale of full-sized scaffold application using tabular platform technology.
3D, three-dimensional; Ad-SMC, smooth muscle-like cells derived from the stromal vascular fraction of human adipose tissue; BI-SMC; CM, conditioned medium; EIA, enzyme immunoassay; pg, picograms.
The conditioned medium (CM) from all the 3D and 2D models was collected twice during the culturing (at day 3 and day 6). Aliquots of all CM samples (0.5 mL per culture system) were preserved at ≤−20°C.
Spent scaffolds were collected for immunofluorescent staining, and the plate wells were used for cell counting and viability analysis by trypan blue dye exclusion.
Immunofluorescent staining of 3D microenvironment
The deposition of ECM proteins on the 3D constructs was qualitatively evaluated by immunofluorescence microscopy. Table 1 describes the primary antibodies used to visualize fibronectin (FN) and collagen (Col) I and III. Hoechst 33342 was used as a counterstain.
Measurement of bioactive molecules secreted by SMC
A total of 31 bioactive molecules were identified based on their putative roles in SMC tissues (e.g., bladder, adipose, vascular tissue; Table 3). The assessed secretome is representative given (1) the potentially wide dynamic range (i.e., the ratio of the most abundant protein to the least abundant92,93) and (2) the number of quantifiable secretory proteins that were reported in the literature for related cell populations (i.e., 15 to 30).55,56
ELISA kit contact, aQuantikine Immunoassays, R&D Systems; bBioVendor; cTakara/Clontech; dMD Bioproducts; eRayBiotech; fMillipore; gBender MedSystems/eBioscience; hAssaypro.
The levels of bioactive molecules in the CM of the 3D and 2D cultures were measured with commercially available ELISA kits (Table 3) according to the manufacturers' protocols. A full assay plate typically held 28 samples, including replicates, and additional wells were used as standards and positive controls. Expression analysis was conducted in undiluted samples for 22 of the 31 kits; for the remaining analyses, some or all of the sample sets were diluted between 5 and 100 times based on the expected expression levels as determined by earlier quantification experiments. For example, analysis of the day 6 set was used to adjust the input concentration for the day 3 set. Immunoassays were conducted using a product development-qualified EIA instrument platform that combines automated plate washing with an ELx405 (BioTek Instruments) and measurement by a FLUOstar Omega plate reader managed by MARS data analysis software (BMG Labtech). The concentrations of each bioactive molecule, which ranged from picograms (pg) to micrograms (μg) per ml, were calculated from the standard curves (correlation coefficient r2>0.98) generated using a minimum of five data points each measured in triplicate. Data were expressed as the mean concentrations of the secreted bioactive molecules in pg per 103 cells and were normalized for the 3D or 2D cultures (Table 2). The data shown for the 3D samples were from three replicates each, while those from the 2D samples were from a single sample. Data were visualized by transformation into relative colors (i.e., heat maps) using the Matrix2png software. 94
Additional evaluation of the SMC 3D microenvironment
The elaboration of elastin by SMC was quantitatively and qualitatively assessed using the methods described in Table 4.
Statistical analysis
All values are presented as the mean±standard error of the mean or, where appropriate, as the mean±variability, with the latter expressed as a percent coefficient of variability (%CV) that was calculated as [SD÷Mean]×100%. Statistical analyses were performed with commercial software (Excel® and JMP®). Post hoc analysis of variance and Student's t-tests for pair-wise comparisons were used as appropriate. A p-value of <0.05 was accepted as statistically significant. Pearson's correlation coefficients were calculated to determine the degree of linear relationships between groups (score between+1 and −1).
Protein pathway analysis
The secretome data were analyzed with Ingenuity Pathway Analysis (IPA®; Ingenuity® Systems;
Results
Defining the SMC
The SMC that were obtained from adipose or bladder tissue, and expanded ex vivo, contained an abundant complement of highly organized, actin-associated protein filaments (stress fibers) which were associated with early- or late-stage SMC-specific differentiation markers (SMA, h1-CaP, h-CaD, and SM22α) in a spindle-like shape or “hill and valley” morphology (Fig. 1A). Quantitatively, the population of marker-positive cells was homogeneous, as assayed by immunocytochemistry and flow cytometry (Fig. 1B). The shared expression of all SMC markers was 96.4% in Ad-SMC (n=106 mean observations) and 96.8% in the non-neurogenic Bl-SMC (n=54 mean observations; p>0.05; with a variability of the mean <4.1% CV). Each individual SMC marker was expressed in ≥95% of the Ad-SMC and Bl-SMC (non-neurogenic and neurogenic), often without significant differences between the sizes of the SMC marker-positive populations for these two cell types (Fig. 1B). The only two statistically significant differences (p<0.05) observed were for the expression levels of SMA and CaD in the non-neurogenic Bl-SMC sample set, which was generated from a large sample set (n=31) and was also reflective of the limited cadaveric biopsy source (in terms of sample number, n=3, and small size of each biopsy). Overall, from the perspective of acquisition and maintenance of morphological and phenotype markers, all isolated and expanded SMC in 2D were considered equivalent.
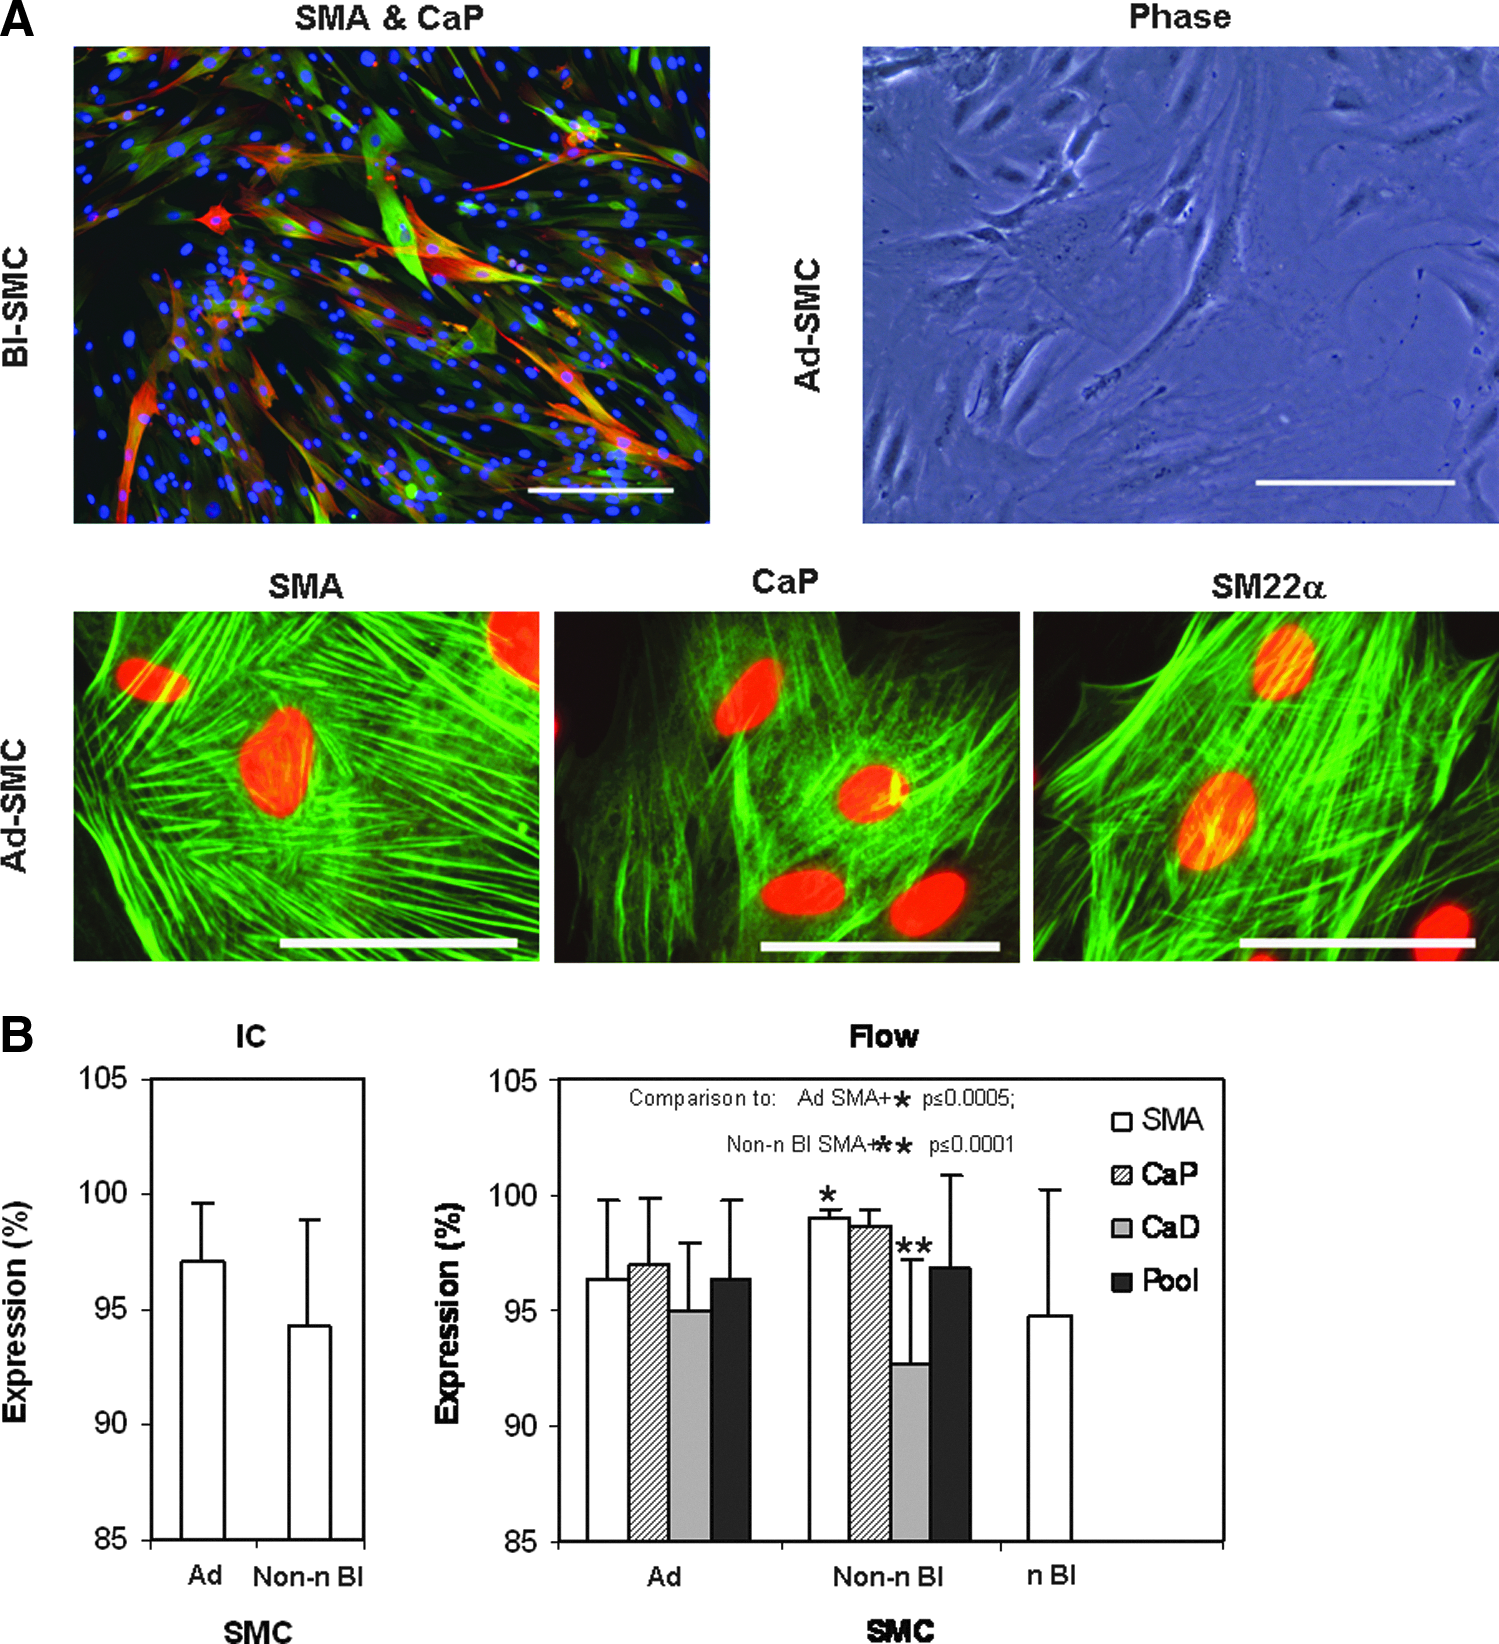
Ex vivo expansion of SMC cultures produces comparable phenotypes.
Expanded cultures that consistently displayed >95% viability (data not shown) were analyzed for their DNA content. The populations of Ad-SMC (n=39, p0 to p4) and Bl-SMC (n=10, p3 or p4) were each distributed across the cell cycle but primarily in the G0/G1 phase (p>0.05 for all comparisons; Fig. 2A). These cell populations possessed stable and consistent ploidy with ∼80% of cells in the resting (“2N”) phase and 20% in the dividing (“4N”) phase. A cytogenetic characterization of late-stage passage cultures indicated that chromosomal changes were predominantly numerical in nature (Fig. 2B) and were associated with random chromosome loss, age-related depletion of sex chromosomes, or common polyploidization (Fig. 2C). Structural changes were nonrecurring and were generally associated with common fragile sites and copy number variations (i.e., ∼80% overlap of typical breakpoints, Justewicz et al., personal communication). Overall, the frequency of chromosomal alterations was <0.01 in the Ad-SMC (n=238 metaphases) and<0.04 in the non-neurogenic Bl-SMC (n=141 metaphases). This result indicates that minimal manipulation and limited stress are associated with the SMC preparation. Thus, SMC derived from various tissues exhibit comparable and reproducible DNA ploidy and chromosomal stability.

Ex vivo expanded SMC cultures show comparable genetic stability.
Operationally, the working population of ex vivo expanded mature SMC-like cells from adipose (≤p4) and bladder (≤p5) tissues are spindle-shaped, high-expressor (SMA+/h1-CaP+/h-CaD+/SM22α+), proliferative (4:1 %2N:%4N ratio), and DNA-stable cells.
Outlining the SMC microenvironment
SMC matching was limited by the balance in cell amplification at p2, which was linked to differences in the initial biopsy size (i.e., the abundance of adipose tissue, and the limited availability of bladder tissue), as well as by expansion profiles and cell yield, rather than other factors (e.g., age, gender, or tissue source). In addition, light microscopy analysis (i.e., of 3D models) showed that cell dispersion, viability, and culture confluence were comparable between replicates and tissues after 3 or 6 days of incubation (i.e., viability >95%; cell dispersion and culture confluence equivalence illustrated later, see Fig. 7). Analyses of the 3D and 2D CM were normalized to 103 cells based on the initial cell seeding density.
Qualifying the secretome assay
The CM from the 3D and 2D experiments and the negative controls were assayed using commercial kits representing a wide dynamic range (from 3.1×10⁻³ to 5.0×10³ ng/ml; Table 5). Mock medium and medium controls produced either no signal (i.e., for 29 of 31 kits on all assay days reported in Table 5) or a signal that was well below the lower limit of quantification for the assays and the sample quantity measured (i.e., for 3 of 31 kits reported in Table 5: FN, Procol 1, and bFGF), and the kits did not require an adjustment of the CM concentration. The reproducibility of the assay kits was confirmed by the global variability of the standards at <10% CV. Kit qualification was further confirmed by accuracy controls (n=30; with one exception owing to the lack of a positive control). Spike levels nested within the standard curve scored within a range of 90.0% to 121.4% (mean 102.8% and variability <10% CV). Sample quantifications were achieved for 17 of the 31 target proteins, with the highest concentration for any sample reported at 2.58×10⁴ ng/mL and the lowest at 3.50×10⁻⁴ ng/mL, generating a dynamic range of 9 logs. The sample concentrations (ng/mL) were grouped as “High” (>100), “Moderate” (>6.0), “Medium” (>0.5), and “Low” (>0.1). The 14 molecules that were below the limit of detection (<lowest standard and ≤negative controls) were identical in each of the four assay groups. Thus, the secretome assay method was valid.
Dynamic range, with upper (“High”) and lower (“Low”) limits of quantification of Standards for each EIA kit.
Variability of Standards, calculated as the average of the %CV for each mean at five to seven Standard levels across the dynamic range. Each mean is the result of two replicates.
Quantification range, with highest (“High”) and lowest (“Low”) sample quantities for each factor, each the mean of two assay replicates, assessed by the standard curve, adjusted for dilution factor(s) used in each assay, without final transformation. Quantity reported with three significant figures.
Accuracy, calculated as the % Recovery of one to four levels of assay spikes (`Positive controls') across the dynamic range, each tested with at least two replicates. % Recovery reported with three or four significant figures (precision to one decimal place).
Historical record of MCP-1 Positive control across six levels within the dynamic range, with 3 to 12 replicates at each level.
ND, sample not detected using qualified assay; NA, not available, or applicable; %CV, percent coefficient of variability.
Defining the SMC secretome
Quantification of the day 3 and day 6 CM revealed a common profile of bioactive molecules that were secreted (i.e., the secretome) by the SMC from the three sources, as shown by the spatiotemporal pattern of accumulation of proteins in Figure 3. The CM included ECM components (procol 1, col I, FN, and OPN), pro-inflammatory and chemotactic cytokines (MCP 1, IL 6, and IL 11), remodeling proteases (Pro-MMP 1, MMP 2, and tPA), growth factors (VEGF, bFGF, HGF, KGF 1, and PIGF), and apoptotic factors (FasL and CLU). Notably, the ECM proteins FN and procol 1 were the highest among any protein (mean >4.4 log pg/103 cells, <7.1% CV) by day 3. Significant amounts of the remodeling proteases Pro-MMP 1 and MMP 2 (mean >2.7 log pg/103 cells, <9.9% CV) were also associated with the ECM.

Comparison of SMC secretomes. Heat map representations of protein production in the conditioned medium from 2D and 3D microenvironments that were seeded with Ad-SMC or Bl-SMC (non-neurogenic or neurogenic). Data are shown for 17 target proteins detected on day 3 and day 6. The scale for protein quantity ranges from 10−2.6 pg/103 cells (bright green) to 105.7 pg/103 cells (bright red). Gray cells represent the absence of detectable signals (n=3), or samples that were unavailable for testing (day 6, 2D, non-neurogenic Bl-SMC, replicate 2, FN). 3D, three-dimensional; FN, fibronectin; pg, picograms.
Of the target proteins, IL 6 (mean >2.2 log pg/103 cells, 18% CV), IL 11 (mean 0.9 log pg/103 cells, 36% CV), FasL (mean −0.19 log pg/103 cells, >2-fold% CV), and OPN (mean −2.1 log pg/103 cells, 12% CV) were detectable on day 3. The protein profiles for six other proteins (namely, MCP 1, tPA, VEGF, bFGF, KGF 1, and CLU) were similar among the SMC types. However, some of these proteins (namely VEGF, bFGF, and CLU) were secreted at lower levels (2.7- to >100-fold) by the Ad-SMC than the Bl-SMC, suggesting a spatial difference among SMC types in their secretome on day 3. Differences in the tissue-specific secretion of HGF and PIGF were also observed.
An evaluation of the day 6 network showed a protein profile and secretion pattern comparable to that on day 3 (Fig. 3), which was confirmed by correlation analysis using the data acquired for the three SMC types (Fig. 4; r≥0.90, p<0.0001). A significant temporal difference between the day 6 and day 3 secretome was observed, particularly in the appearance of considerable quantities of col I (mean >4.1 log pg/103 cells, 5.4% CV; Fig. 4), and increased levels (∼3-fold difference) of FN, Procol 1, and MMP 2 (Fig. 3) on day 6. A >2-fold increase in mean protein level was seen for 6 out of 17 proteins (i.e., FN, Procol 1, Col I, OPN, MMP 2, and HGF) by day 6. Smaller increases (between 1- and 2-fold) were observed for five proteins (MCP 1, tPA, VEGF, KGF 1, and FasL). Five proteins exhibited lower levels on day 6 (<1-fold; Pro-MMP 1, IL 6, IL 11, bFGF, and PIGF). The spatial difference between SMC types on day 6 was limited to HGF and PIGF.

Correlation of the SMC secretome in tissues from different origins. The Pearson correlation coefficients (r), statistical significance (p-values), and equations for the regression lines for comparing
An analysis of the accumulation of the target proteins in each sample on day 6 compared to day 3 revealed threefold increases (x ≥3) in >19% of test samples and twofold increases (2<x<3) in >14% of test samples (Fig. 5). Marginal increases (1<x<2) were scored in >23% of test samples, whereas >32% of test samples showed decreases in protein concentration (x<1). The temporal increase or decrease was statistically significant (p<0.05) over time for 11 proteins (FN, Procol 1, Col I, OPN, MMP 2, IL 6, IL 11, bFGF, HGF, FasL, and PIGF). For the remaining six, four showed significant temporal differences (within two SMC types). Two showed only marginal changes (VEGF and KGF 1 in the Ad-SMC, tPA and Pro-MMP 1 in the neurogenic Bl-SMC); one protein was significantly elevated in one SMC type (MCP 1 in the Ad-SMC), and one protein (CLU) remained at similar levels throughout. In total, 82% of the day 6 CM samples were significantly different from the day 3 samples; that is, changes were observed in 41 of the 50 comparisons performed between the three SMC types for each target protein within the secretome. These results underscore the temporal differentiation of the SMC secretome, and highlight the similarities among the three SMC types.

The temporal pattern of SMC secretome expression. Heat map representations of the increases in secretion (day 6 compared with day 3) of each target protein (pg/103 cells) within the 2D and 3D microenvironments. The color scale indicates the fold change in expression: Near 0 (bright green) to 3 (bright red). A threefold maximum increase was chosen as the upper bound, to enable the graphical representation of smaller-fold changes. The total number of observations of each SMC source was 111 to 113. Non-neurogenic Bl-SMC exhibited the largest increase in secretion, with 43% at 2-fold and 24% at threefold. The significance scale (p-value) of the comparisons ranged from <0.0001 to <0.05 (white to light gray) to >0.05 (dark gray). Not assessable comparisons are shown in black.
Correlation analysis of the aggregate day 3 and day 6 data for each SMC type and the microenvironment (Fig. 6) indicated a statistically significant (r≥0.94, p<0.01, n=6) temporal difference between the non-neurogenic and neurogenic Bl-SMC. The absence of a clear statistical temporal difference (r=0.74, p<0.10, n=6) for the Ad-SMC was due to the higher expression values on day 3 in comparison to the Bl-SMC. The collective secretome output for each 3D model is cell-density dependent for each SMC type, as shown by the ∼1.7-fold increase in secretion for each twofold increase in seeding density (3D-2 to 3D-4 and 3D-8; r≥0.87, p<0.05).
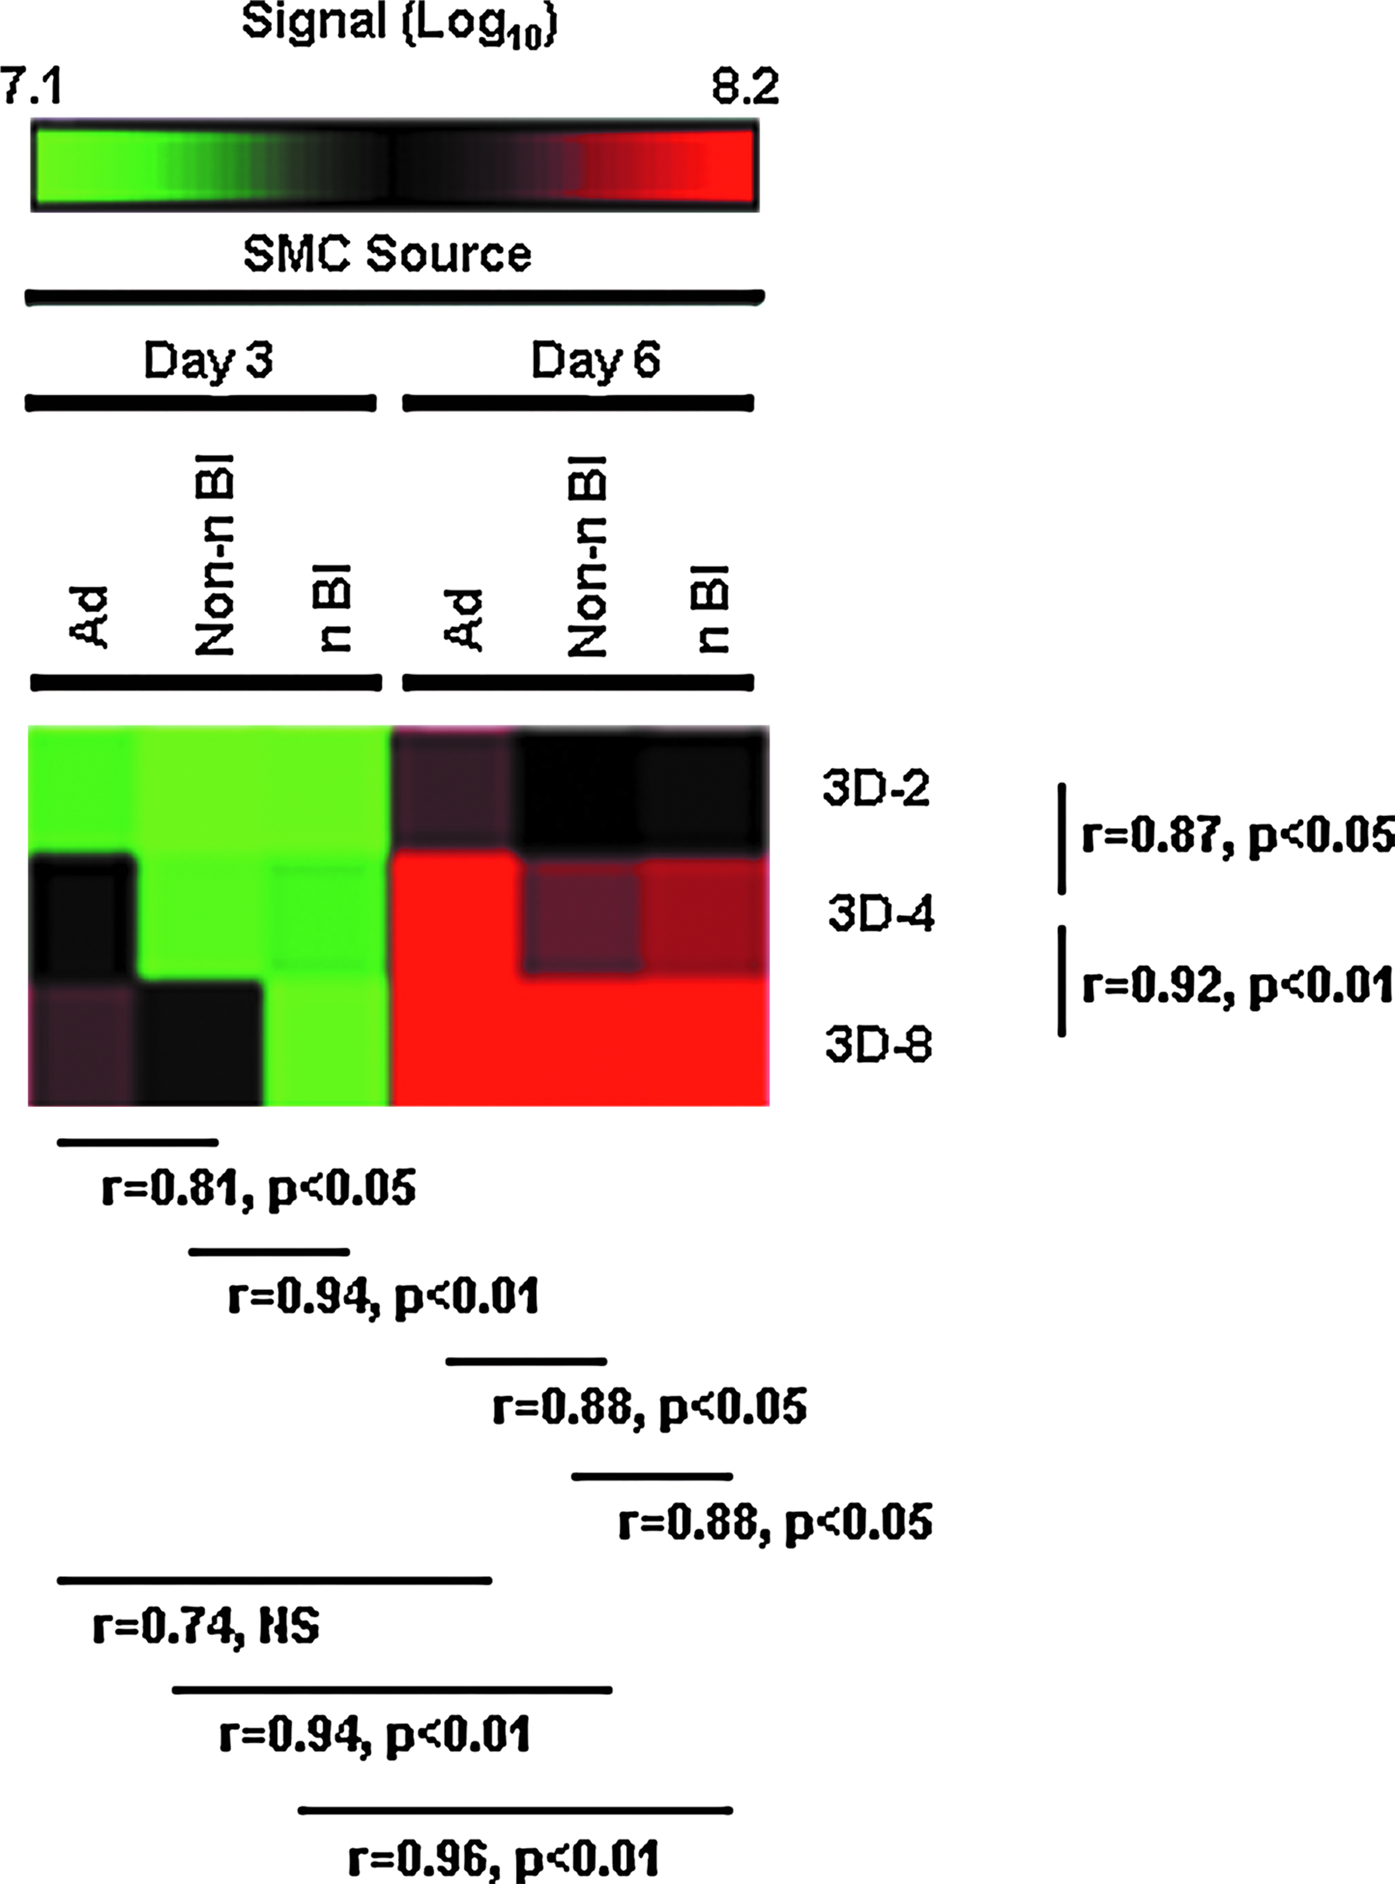
Temporal output of the 3D SMC secretome. Heat maps of the aggregated quantity of protein secreted in each 3D microenvironment (pg per cells seeded accumulated on day 3 and day 6). Scale: 107.1 (bright green) to 108.2 (bright red). The significance (p-value) of the relationships was determined from the Pearson correlation coefficient, r. Overall, the SMC secretome output on day 6 was significantly different from that on day 3 for 12 to 15 of the target proteins shown here.
The absence of detectable levels of 14 putative bioactive molecules from the SMC secretome, including ECM proteins (col II and BMP4), remodeling enzymes (MMP 7 and 9), cytokine (IL 5), adipokines (adiponectin and leptin), and other proteins with varied functions (NGAL, PDGF AA and BB, IGF 1, and NGF), provided further indications of the protein pathways that may be common to SMC derived from different tissues. First, this analysis confirmed the lack of endogenous production of these proteins, in both early and late stages of the 2D or 3D models. Second, it confirmed the absence of potentially contaminating cell types or changes in the morphologies of the cultures (i.e., as indicated by the convergence of the flow cytometry and immunocytochemistry phenotype data, see Fig. 1), which is consistent with the relative homogeneity of the isolated cell populations and subsequent expansion cultures.
Structure of the SMC microenvironment
The accumulation of soluble FN and Col I in the CM produced by differentiated SMC type in the various 3D microenvironments, especially the higher amounts produced later in culture, suggested that these proteins might be deposited into the ECM within the constructs. As shown by the immunofluorescence microscopy images in Figure. 7, FN and Col I were clearly visible within and outside of cells, as well as on scaffold fibers, without a qualitative difference between SMC types by day 6. This was observed on scaffolds that were seeded with 4×10⁵ cells/cm2 (Fig. 7) and in those seeded with lower (3D-2) or higher (3D-8) cell densities (summarized in Table 6). An additional histological analysis of the constructs on day 3 qualitatively verified the decreased staining intensity and an irregular pattern of expression of collagen in comparison to FN (Table 6). Together, these data indicate that protein secretion, particularly in the 3D environment, may result in ECM deposition, which is a necessary step in the establishment of nascent neo-tissue.

The visualization of extracellular matrix proteins on constructs built with the three SMC types. The expression of FN (red fibrillar matrix) and Col I/III (punctuate red fluorescence) within cells on day 6 highlights the deposition on PLGA fibers and on 3D-4 Ad-SMC or Bl-SMC (non-neurogenic or neurogenic) scaffolds. Unseeded scaffolds that were processed in parallel served as controls and did not produce a detectable signal (data not shown). Scale bars: 50 μm. All images were taken at an original magnification of 20×.
Estimated % of cells expressing FN and/or Col I/III by immunofluorescence:±,<25%; +, 25 to 50%; ++, >75%.
Additional characterization of the SMC microenvironment
An analysis of CM for the synthesis of elastin within constructs (e.g., 3D-4 scale-down model) generated with the three SMC types revealed quantifiable production by day 6 (Table 7). The low level of soluble but not deposited elastin (i.e., undetectable by immunofluorescence) was in contrast to the elevated col I (Table 7, and earlier in Fig. 7). These results highlight the spatiotemporal similarity among SMC types in the development of ECM.
Output from 3D-4 models for three SMC types determined by ELN EIA only. Quantification by Fastin Binding Assay (dynamic range 1×10⁶ to 6.25×10⁴ ng/mL, with variability of Standards, n=5, at 4.9% CV) below background observed due to fetal bovine serum with this method. In addition, low elastin quantity precluded detection by immunofluorescence using overnight staining with specific mAb (3D-4 and 2D-4 models).
Normalized elastin quantity by ELN EIA (dynamic range 0.2 to 0.0031 ng/mL, with variability of Standards, n=7, at 13% CV). No interference observed.
Elastin quantity compared with collagen type I measured by Col I EIA.
Common protein pathways in SMC
Additional insights into the SMC secretome (3D and 2D models) were gained by pathway analysis, which organized 17 target proteins (not including elastin though likely inclusive) into functional networks using IPA. The resultant complex network consisting of nodes or protein interaction clusters (Fig. 8) shows both direct and indirect interactions, including physical binding, enzyme-substrate relationships, and cis-trans transcriptional control relationships. The most statistically significant sub-networks (pathways) for the three SMC types were associated with six general functions: cell-to-cell signaling and interaction (score of 13.4, containing 13 target proteins), cellular movement (score of 12.5, containing 15 target proteins), cellular growth and proliferation (score of 12.5, containing 15 target proteins), cardiovascular system development and function (score of 12.4, containing 10 target proteins), organismal development (score of 12.4, containing 10 target proteins), and cellular development (score of 11.7, containing 12 target proteins). Collectively, a score of 38 was generated for 16 target proteins.

SMC pathways defined based on an ingenuity analysis of the secretome data. The SMC secretome dataset was overlaid onto a molecular network developed from the IPA knowledge base. A network of central nodes shows the connectivity between molecules, with each representing a target protein that was either derived from the secretome (day 6, 3D-4) or inferred by IPA. (Note that the data are for 16 target proteins, with Procol 1 and Col I considered together.) The nodes are displayed using various shapes that represent the functional class of the gene product (see explanatory insert), and are colored to represent the relative levels of each target protein: Red symbols represent elevated production, and green symbols denote low production. White symbols represent molecules that were predicted by IPA. Bars within brackets next to the colored nodes indicate relative levels (log pg/103 cells) for each replicate per SMC type (Ad, neurogenic-Bl, non-neurogenic-Bl). The interactions and directionality are shown using dotted lines with arrowheads, and solid lines without arrowheads indicate binding. Abbreviations for the target proteins are defined in Table 3, and those for the other proteins are included in an insert. IPA, Ingenuity Pathway Analysis.
Discussion
In this study, we have applied a rigorous operational definition for the phenotype and functionality of human Ad-SMC in the manufacturing of smooth muscle constructs for the support of urological tissue development. In particular, we evaluated the spatiotemporal characteristics of SMC response to the extracellular environment during the formation of a bioartificial tissue in vitro to recapitulate, at least in part, the in vivo developmental process (previously described by Jayo et al. 4 ). The bioactive molecules that were secreted and deposited by Ad-SMC in the ECM were quantified and directly and simultaneously compared with the developmental capabilities of functionally validated human SMC sources representing SMC cultures derived from normal (non-neurogenic) and diseased (neurogenic) bladder tissues. To accomplish this goal, we utilized a well-defined and controllable in vitro-like 3D engineered microenvironment scale-down model of a validated cell-biomaterial construct that has been shown to support scaffold-guided SMC-based tissue regeneration for the reconstitution of native bladder tissue in vivo. 4 The performance of the 3D model was compared with that of conventional 2D monolayer cultures with SMC alone using a similar experimental setup. To our knowledge, these studies are the first of their kind.
On the basis of the characterization of a large number of development samples (n=68), Ad-SMC that were isolated and expanded by a validated process represent a homogeneous and genetically stable population of proliferative primary cells. The Ad-SMC are >96% positive for the expression of actin-associated cytoskeletal markers of mature differentiated SMC (SMA+/h1-CaP+/h-CaD+/SM22α+), with a DNA content of 4:1 (resting:dividing cells), and a <0.01 frequency of chromosomal alterations. Significantly, this profile did neither vary significantly among donors (n=15) or across cell passages (p0 to p4), nor was it dissimilar to the typical profile of Bl-SMC (Figs. 1 and 2). Furthermore, with the proven ability of PLGA scaffolds to guide tissue regeneration,3,4,96 and the standardization of the method to quantify protein components in CM from the 2D and 3D microenvironments, 17 extracellular proteins (bioactive molecules) were identified as a part of the Ad-SMC secretome associated with the growth and formation of healthy bioartificial 3D engineered tissue during the first week of culture. This profile did neither vary significantly between donors and tissue of origin, nor the disease state of the SMC (n=2 for each of the three SMC sources; Figs. 3 and 4). These findings demonstrate that with the implementation of manufacturing consistency, as was achieved by our platform technology, SMC from various tissues of origin can release a common set of proteins; this secretome is, thus, representative of the regenerative potential of SMC.
Dynamics of the secretome
The most striking aspects of the SMC secretome are the spatiotemporal patterns of extracellular protein secretion and the hierarchy of these bioactive molecules. We had hypothesized that the SMC, incorporated into the 3D models, would be capable of releasing factors to support cell growth, migration, and survival in vitro in a reproducible manner, and that this could consistently trigger regenerative healing in vivo and a reproducible temporal sequence of cellular infiltration, blood vessel in-growth, and site-specific differentiation of complete mucosal, stromal, and parenchymal tissue layers. 4 Here, we showed that by day 3 of seeding, 16 of the 17 proteins of the SMC secretome were detectable within a concentration range of 9 logs, with a predominance of ECM proteins (Procol 1 and FN), remodeling enzymes (Pro-MMP 1 and MMP 2), and pro-inflammatory cytokines (IL 6 and IL 11) in both the 3D and 2D models. On the sixth day of culture, we observed a marked increase in the accumulation of ECM proteins (soluble Procol 1 and Col I, and FN), remodeling enzymes (MMP 2 and tPA), and growth factors (HGF and VEGF) (Figs. 5 and 6). We detected more moderate yet significant increases in the proteins associated with the ECM (OPN), chemotaxis (MCP 1 and KGF 1), and apoptosis (FasL). The lower levels of IL 6, IL 11, and the angiogenesis factor bFGF decreased over time, indicating the dynamic nature of the secretome in our models.
Col I and FN serve as the primary scaffolding matrix for SMC in tissues.51,52 Consistent with this role, these proteins were deposited in the ECM of our 3D models (Fig. 7). Our data indicate that the polymerization of FN in the ECM is required for the codeposition and stability of col I. 50 The relative proportions of FN and Col I in the ECM influence tissue formation, shape, and stability.49,51,52 Our data may also reflect the impact of FN polymerization on the orchestrated secretion of bioactive molecules associated with cell migration, proliferation, survival, differentiation, tissue remodeling, and angiogenesis.48,52 Collectively, the temporal distribution of extracellular proteins is likely to be critical for the development of healthy bioartificial tissues by using our platform technology.
The evolution of the secretome in developing neo-tissue
To examine the key elements that guide the evolution of neo-tissue using our platform technology, we took advantage of the reproducibility achieved through the manufacturing of a 3D-engineered tissue. Recent findings showed that SMC behavior is more reproducible in a physiologically relevant 3D model that closely emulates the complex 3D microenvironment of the natural ECM than in a 2D culture.17,22,23 To construct scale models of a compositional and structural environment that mimics natural smooth muscle, we used the synthetic scaffold (PLGA) as a matrix for seeded SMC because of its known cell affinity and biocompatibility.3,24,97,98 Notably, scaffold topology is a critical factor in SMC adhesion and ECM production.17,97,98 The scaffold serves as a carrier for the SMC and provides mechanical support for the binding of provisional matrix proteins, on which bioartificial tissue can develop.8,17 It also needs to promote the synthesis of ECM components by resident SMC within a 3D context in a manner similar to that in vivo, to accurately replicate a native tissue. It is important that the ECM, such as that in the matrix of the bladder and the vasculature, can serve as a reservoir for bioactive factors (e.g., bFGF, IGF 1, KGF, PDGF BB, VEGF, MMP 2, BMP4, and FasL).8,57,63,70,99 The receptor-ligand interactions between the ECM and SMC determine the success of cell seeding; the effects of primary ECM promotes tissue remodeling and the creation of a secondary ECM to replace it, which occurs on implantation via the infiltration of several types of endogenous cells that then populate the niche microenvironments.2,17,68,83,99
The identification of a common SMC secretome is significant, given that bladder and adipose SMC likely vary considerably in their developmental origins and lineage history.100,101 The normalization of SMC function using a standardized platform technology could limit the impact of any biological and genetic differences due to their tissue of origin or disease state.13,61,67,75,100,102 For example, the SMC secretome described for Ad-SMC in this study is comparable to the selected proteomes that have been reported for stromal vascular cells.9,15,55,56,70 Expanding the comparison to all SMC revealed a similar finding6,57,61,77–79,83,99; the secretomes are clearly associated with regenerative healing by endocrine, paracrine, and autocrine mechanisms. The broad repertoire of SMC functions includes pro-angiogenic, pro-survival (e.g., anti-apoptotic), protective (e.g., modulating SMC proliferation, and tissue remodeling), and healing-promoting activities14,55,64,65–70 as well as pro-inflammatory roles.54,55,70 Interestingly, IL 6 and MCP-1 are central mediators in the response to injury in multiple types of human SMC (e.g., bronchial, colon, vascular, and uterine).77–80 Notably, none of the tissues in this study exhibited the maladaptive response that is associated with diseased tissue (e.g., MMP 7, MMP 9, and non-native or degraded Col I, Col III, and IL 18).51,53,61,67,75,76,80,83,103,104 Thus, the SMC secretome described here may reflect standard SMC behavior in a natural microenvironment.
Phenotype in developing neo-tissue
All the in vitro 3D models displayed a common SMC phenotype. It is generally acknowledged that the phenotype of SMC in culture lies somewhere along the spectrum between fully contractile (nonproliferating and quiescent) and fully secretory (proliferative) and that the key traits of these two SMC phenotypes overlap.6,41,100,101 Fully differentiated SMC are typically characterized by their distinct morphology, which includes their array of organized cytoskeletal contractile protein filaments, and their behavior, which includes a lack of migration or proliferation within their microenvironment, contraction and relaxation responses to stimuli, and their limited secretome (e.g., TGFβ1, MCP 1, VEGF, collagen deposition, and the absence of tissue remodeling factors).2,5–7,99,101 SMC may be biased toward a “more-secretory” phenotype in response to in vitro culture (or tissue injury in vivo), because the experiment requires the population of the scaffold and the induction of ECM deposition/tissue remodeling6,41 to support the fabrication of smooth muscle tissue, as minimally demonstrated by reentry into the cell cycle. A complex cascade of events is associated with the modulation of the SMC phenotype.67,80,83,100 In this study, antibody staining clearly showed a homogeneous cell population that preserved the hallmarks of the “contractile” phenotype (Fig. 1A). This population remained stable (Fig. 1B) as confirmed by cell cycle (Fig. 2A) and cytogenetic (Fig. 2B, C) assessments at multiple culture passages. These findings support the assertion made in several studies that there are limited phenotypic or functional differences between SMC cultures obtained from disparate tissues.5,8,105 Similarly, the significant shift from a contractile to a synthetic phenotype in SMC from diseased tissue (e.g., bladder)41,104,106 was reversible with minimal ex vivo manipulation by our platform technology, which would allow SMC from any origin to be engineered into normal tissue (e.g., bladder).8,10.105 However, it is likely that SMC with particular inherent genetic abnormalities, as indicated in earlier reports,63,75,106,107 would be less suitable for implantation. Thus, the clinical potential of autologous regenerative therapy is technically enhanced with the use of a platform technology that is equipped to provide a reliable source of phenotypically and genetically stable SMC, such as derived from the patient's own normal adipose tissue.
Molecular networks in developing neo-tissue
We were considerably interested in the identification of protein-protein interactions and the major signaling pathways based on input from the secretome analysis of our 3D models. Consistent with recently proposed models,102,108,109 the canonical pathways utilized by our SMC (Fig. 8), as determined based on the collective scientific evidence included in the IPA Knowledge Base®, include considerable functional redundancy; signals are dispersed among multiple parallel pathways that also partially overlap with each other. The pathways that are predicted to be involved are related to SMC differentiation or proliferation (e.g., ERK-ELK, PI3K-Akt, ERK-JNK-p38 MAPK, lymphotoxin α1β2, NFκB, calcineurin inhibitors, IL 12, and PDGF BB),99,102,108,110 actin cytoskeleton regulation (e.g., Talin-FAK integrin regulatory proteins to translate environmental and molecular cues), 102 and balanced matrix accumulation (e.g., the DDR1 collagen receptor which negatively regulates SMC biology),111,112 supporting our proposed mixed contractile/synthetic SMC phenotype. These pathways contribute to the critical functions identified by IPA: cell-to-cell signaling, cellular movement, cellular proliferation, and cellular and organismal development. The up-regulation or down-regulation of these bidirectional signaling pathways is thought to induce a cascade of quantitative and qualitative changes, including changes in the expression levels of various proteins linked to signaling, contractility and adhesion, proliferation and migration, and cell proliferation and survival (e.g., cell cycle and apoptosis).
Other cytoskeleton-related pathways that are associated with SMC differentiation or proliferation are implied by the molecular network (Fig. 8) or may not be included in the IPA Knowledge Base®. The most important of these are the serum response factor/myocardin-dependent pathways that directly regulate the gene expression of key SMC contractile proteins,100,102,113 which produce either SMC differentiation or proliferation: High h1-CaP is induced via stimulation by TGFβ, and low h1-CaP is induced via stimulation by NFκB and/or PDGF BB to relieve the repression of cell quiescence.7,99
The common nature of the molecular networks in SMC derived from different tissue sources and the equivalence in the number of central nodes highlights the striking similarities among an otherwise heterogeneous panel of SMC. This may reflect a combinatorial nature of SMC-selective transcription linked to phenotype switching in response to specific molecular and environmental cues. 101
Perspectives
Some limitations of the current study should be addressed. In particular, although we present in vitro data on the development of biomimetic constructs using standardized in vitro-like 3D cellular models of our platform technology, in vivo experiments that focus on the early implantation stage are needed to address the underlying molecular mechanisms of smooth muscle tissue development and confirm the preclinical studies which have shown normal cellular composition and durable regenerative healing.4,8 Such follow-up experiments should evaluate the effects of well-defined molecular and environmental cues on contractile competence.17,114,115 For example, how does the addition of exogenous biomolecules (e.g., optimized delivery of TGFβ, PDGF, IGF-1, IL 10, or other modulators)41,80,86,114 affect smooth muscle tissue development? Similarly, how does the addition of endothelial cells in co-culture,6,80,90 or the incorporation of spatial distribution and mechanical stimulation,18,98,99 or the use of other strategies115–118 enhance the elaboration of native ECM components (e.g., fibrillar crosslinked elastin and laminin integrated with well-developed FN and collagen structures)? These studies are likely to significantly add to our understanding of the synthetic-to-contractile progression of the SMC phenotype during neo-tissue development. The next steps would focus on translating the knowledge gained to the manufacture of reliable smooth muscle-based implants derived from a range of SMC subtypes for a variety of customized applications.
Conclusions
This article describes the use of initial intermediate tissue forms, which were derived from scaffolds seeded with SMC and were established by validated well-controlled manufacturing processes (our platform technology). These were used to investigate the modular and robust in vitro biomimetics that guide the assembly of neo-tissue and recapitulate the necessary aspects of smooth muscle differentiation and development in vivo. We addressed the first stage of neo-tissue development, because it sets the critical conditions for the correct spatiotemporal patterning during later stages, including the coordination of stable intracellular interactions.19,21 We show that SMC, derived from various tissue sources, including healthy adipose and bladder tissue, and diseased bladder tissue, follow a common yet dynamic developmental pathway in vitro during the establishment of ‘bioartificial tissue’ in 3D models of the smooth muscle tissue microenvironment. These assessments were based on the quantitative secretome data and a predictive modeling analysis of the protein-protein associations and overlapping intracellular signaling pathways that are active in these tissues. This work represents an important step toward identifying the essential early in vitro biological characteristics of engineered cellular constructs that result in the successful remodeling of neo-tissue, which is necessary for the development of native tissue, and for its long-term survival and functionality in regenerative medicine applications.
Footnotes
Acknowledgments
The authors thank Rich Payne Ph.D. and Toyin Knight M.S. for supplying them with biomaterials and for the help rendered in the small-scale bioreactor studies.
Author Contributions
D.M.J., J.E.S., and S.A.B. conceived the study and designed research. J.E.S., S.A.B., B.R., and T.B.B. performed experiments. D.M.J., T.B.B., and J.E.S. analyzed the data. D.M.J. wrote the article with participation from J.E.S. All authors commented on the article.
Disclosure Statement
Tengion employees have direct ownership of shares in Tengion, Inc.