
Abstract
In the field of human mesenchymal stromal cell (MSC) research, quantitative real-time reverse transcription–polymerase chain reaction (qPCR) is the method of choice to study changes in gene expression patterns upon differentiation, application of stimuli, or of factors such as inhibitors or siRNAs. To reliably detect small changes, the use of a reference gene (RG) that is stably expressed under all conditions is essential. The large number of different RGs used in the field and the lack of validation of their suitability make the comparison between studies impossible. Therefore, this work aims to establish one single RG for mesodermal differentiation studies that use MSCs. Seven commonly used RGs (glyceraldehyde-3-phosphate dehydrogenase [GAPDH], ribosomal protein L13a [RPL13a], beta-actin [ACTB], tyrosine 3-monooxygenase/tryptophan 5-monooxygenase activation protein, zeta-polypeptide [YWHAZ], eukaryotic translational elongation factor 1 alpha [EF1α], β2-microglobulin [B2M], and 18S ribosomal RNA [18S]) were investigated concerning their mRNA expression stability during expansion of bone marrow-derived MSCs up to four passages as well as during their adipo-, chondro-, and osteogenenic differentiation on days 9, 16, and 22 after induction. RPL13a was validated for qPCR studies of MSCs (bone marrow- and placenta-derived) and, additionally, for primary human bone cells (HBCs) and the osteosarcoma cell line MG-63. GAPDH and ACTB, the two most frequently used RGs, showed the highest expression variance. The superior performance of RPL13a should make it the RG of choice for all MSC studies addressing mesodermal differentiation.
Introduction
In this study, we aim to establish one single RG for all three mesodermal differentiation lineages in human bone marrow-derived MSCs (hBM-MSCs) as well as other human MSCs and bone progenitor cells. Seven commonly used RGs (18S ribosomal RNA, β2-microglobulin B2M, eukaryotic translational elongation factor 1 alpha EF1α, ACTB, GAPDH, RPL13a and tyrosine 3-monooxygenase/tryptophan 5-monooxygenase activation protein, and zeta polypeptide YWHAZ) were analyzed based on different stability parameters.
Materials and Methods
Cells
hBM-MSCs, primary human bone cells (HBCs), and human placenta-derived MSCs (hPD-MSCs) were freshly isolated (see protocols below) and expanded in an MSC-proliferation medium composed of a minimal essential medium (α-MEM; Invitrogen, #22561) supplemented with 10% fetal bovine serum (FBS; Lonza), 1% penicillin–streptomycin–neomycin antibiotic mixture (100×) (PSN; Gibco™), and 1 ng/mL human basic fibroblast growth factor (FGF-2; Sigma, #F0291) in a humidified incubator at 37°C with 5% CO2 and 95% air. Bone marrow-derived MSCs were also purchased from Lonza (Lonza MSCs, Lonza, #PT-2501), and the MG-63 human osteosarcoma cell line was from ATTC (#CRL-1427). Lonza MSCs were expanded according to the manufacturer's protocol, and MG-63 in the MG-63-proliferation medium comprised the Dulbecco's modified Eagle's medium (DMEM; Gibco, #41965) supplemented with 10% FBS, 1% PSN, 1%
Isolation of human primary cells
Isolation of hBM-MSCs
The MSCs were isolated from femur-derived bone marrow samples that were obtained during surgical hip replacement of otherwise healthy patients (two women and one man, age between 44 and 79 years) after having received informed consent. The protocol was approved by the ethics board of the Kantonspital St.Gallen, Switzerland (ethics committee approval number EKSG08/014/1B). The bone marrow samples were incubated in 20 mL isolation medium [25 mM HEPES (Fluka, #54459), 128.5 mM NaCl (Fluka, #71380), 5.4 mM KCl (Fluka, #60130), 5.5 mM
Isolation of HBCs
Primary HBCs were isolated from the same samples as hBM-MSCs (see above). After the hBM-MSCs were collected, the pieces of trabecular bone were further cleaned from remaining tissue and cells under microscopic observation using forceps and thorough rinsing with isolation medium. Five to 10 pieces of bone (∼25 mg) were placed in a T75 flask together with 20 mL MSC-proliferation medium, which was changed for the first time after 1 week and later biweekly. The bone pieces were left in the culture flask until the outgrowing cells reached 70% confluency.
Isolation of hPD-MSCs
hPD-MSCs were isolated according to Semenov et al. 14 following the protocol approved by the ethics committee of the district of Zurich (study Stv22/2006). Placentas were collected from two donors immediately after an elective caesarean section and the isolated cells suspended in a T75 flask containing 15 mL MSC-proliferation medium.
Multilineage differentiation assay
Adipogenic differentiation
For adipogenic induction, MSCs were seeded at an initial density of 26,000 cells/cm2 and were first cultivated in an adipo-maintenance medium consisting of the α-MEM supplemented with 10% FBS, 1% PSN, and 10 μg/mL insulin (dissolved in 0.01 M HCl [pH 2–3]; Sigma, #I-6634) for 1 day followed by cultivation in the adipo-induction medium consisting of the α-MEM supplemented with 10% FBS, 1% PSN, 1 μM dexamethasone (Sigma, #D-4902), 10 μg/mL insulin, 0.5 mM isobutyl-1-methylxanthine (Sigma, #I-5879), and 200 μM indomethacin (Sigma, #I-7378) for 3 days. The alteration of those two media was repeated over the whole cultivation period of 22 days. Control cultures were performed in the MSC-proliferation medium (see above).
Chondrogenic differentiation
Chondrogenic differentiation of MSCs was induced by pellet culture for which 250,000 cells were placed in a 15-mL polypropylene tube and centrifuged at 250 g for 5 min. The pellet was cultured at 37°C with 5% CO2 in 500 μL of the chondrogenic medium that consisted of high-glucose DMEM (Gibco, #41965) supplemented with 100 ng/mL bone morphogenetic protein 2 (BMP-2; kind gift from F.Weber, University Hospital Zürich, Switzerland), 10 ng/mL transforming growth factor β3 (TGF-β3, Peprotech, #100-36E), 100 nM dexamethasone, 50 μg/mL ascorbate-2-phosphate (Sigma, #A8960), 40 μg/mL proline (Fluka, #81709), 100 μg/mL sodium pyruvate (Fluka, #15990), and 1% ITS+Universal Culture Supplement Premix (6.25 μg/mL insulin, 6.25 μg/mL transferrin, 6.25 ng/mL selenious acid, 1.25 mg/mL serum albumin, and 5.35 μg/mL linoleic acid; BD Biosciences, #354352). The medium was replaced every 3–4 days for 22 days. As a control, pellets were cultivated in a chondrogenic medium lacking dexamethasone, BMP-2, and TGF-β3.
Osteogenic differentiation
To induce osteogenic differentiation of MSCs and HBCs, the cells were seeded at an initial density of 2000 cells/cm2 and cultivated in an α-MEM supplemented with 10% FBS, 1% PSN, 10 nM dexamethasone, 50 mM ascorbate-2-phosphate, 2 mM β-glycerophosphate (Sigma, #G-9891), and 10 nM 1,25-dihydroxyvitamin D3 (Sigma, #D-1530). MG-63 cells were osteogenically induced in an MG-63-proliferation medium (composition see above) further supplemented with 50 nM 1,25-dihydroxyvitamin D3, 50 μg/mL ascorbate-2-phosphate, 10 nM β-glyercolphosphate, and 10 nM dexamethasone. The differentiation media were replaced every 3–4 days for up to 22 days (for MSCs) or for 7 days (HBCs and MG-63). As a control condition, cells were cultured in MSC- respectively MG-63-proliferation medium (composition see above).
RNA isolation and quantification
Cells grown in monolayer were detached using trypsin-EDTA (Sigma, #T3924, 1×) and centrifuged at 250 g for 5 min to form a cell pellet. Cartilage pellets were digested with 3 mg/mL collagenase II (Sigma, #C6885) for 2 h to break down the abundant negatively charged extracellular matrix and thereby increasing the RNA yield using affinity column-based extraction. Afterward, the pellet was washed in phosphate-buffered saline (PBS), and total RNA was prepared using the Qiagen Micro Kit (Qiagen, #74004) according to the manufacturer's protocol. All samples were treated with DNAse I (Qiagen, #79254, 1500 Kunitz units). The RNA concentration was determined using a Nanodrop ND-1000 Spectrophotometer (Nanodrop). Only RNA with an optical density (OD) 260/280 ratio between 1.9 and 2.1 was used for PCR analysis. RNA was stored at −80°C until further use.
Quantitative real-time reverse transcription–polymerase chain reaction
qPCR was performed on the CFX96™ Real-Time PCR (Biorad Laboratories, #185-5096). 200 ng total RNA with oligo(dT) and random primers was reverse transcribed to cDNA using iScript™ (Biorad Laboratories, #170-8891) in a total reaction volume of 20 μL. A temperature program of 5-min priming at 25°C followed by the reverse transcription at 42°C for 30 min and the reverse transcription inactivation at 85°C for 5 min was run. After a final cool-down to 4°C, the cDNA was stored at −80°C for subsequent use. The oligonucleotides (purchased from Microsynth AG) displayed in Supplementary Table S1 (Supplementary Data are available online at
Results were exported to Microsoft Excel for analysis. Results are presented as mean values from triplicate measurements, and variances are calculated according to the laws of uncertainty propagation. 15
Expression of differentiation markers
All qPCR data differentiation markers were analyzed using the 2−ΔΔCq method 16 (assuming that the amplification efficiency equals 100%) and normalized against an RG. Day 2 of control culture was designated as the calibrator in each experiment. Each gene was evaluated in independent PCR runs, including the complete set of samples of one donor and passage (i.e., donor 1, passage 1, and days 2, 9, 16, and 22 of control and differentiation culture).
Immunofluorescent staining
For immunofluorescent staining, the cells were washed twice with PBS without glucose (PBS w/o glucose; Gibco, #18912-014), treated with 4% paraformaldehyde (Sigma, #16005) plus 0.2% Triton-X for 8 min, and then washed again twice with PBS w/o glucose. Nonspecific binding of antibodies was blocked with PBS w/o glucose-containing 5% goat serum (Sigma, #G6767) and 1% fetal calf serum for 30 min.
The osteogenic characterization was determined using the bone-specific marker anti-collagen I (1:1000; Sigma, #C2456) and goat α-mouse immunoglobulin G Alexa Fluor 546 (1:400; Molecular Probes, #A11030). The antibody was diluted in 1.5% skim milk/PBS and incubated for 1 h at room temperature (RT). The cell nuclei were stained with DAPI (4′-6-diamidino-2-phenylindole, 10 mg/mL; Sigma, #D9542) together with the secondary antibody.
Adipogenic differentiation was determined by Oil Red O staining. Briefly, cells were fixed with 4% paraformaldehyde (as described above) and washed twice with distilled water; after one washing step with 60% isopropanol, the cells were incubated in 60% isopropanol for 5 min at RT. Further, the cells were incubated in an Oil Red O working solution (2 mg/mL Oil Red O in isopropanol and double-distilled water, ratio 3:2) for 10 min at RT. Before fluorescence microscopy (Axio Imager.M1; Carl Zeiss AG) imaging was performed, the cells were washed with distilled water till optimal contrast of red-stained lipid droplets was achieved.
Histology
Cell pellets were fixed with 4% formalin, embedded in paraffin, and sectioned at 2 μm. Tissue sections were then deparaffinized using xylene followed by a graded alcohol series and stained with hematoxylin/eosin to identify histologic features and Alcian blue/periodic acid Schiff (PAS) for proteoglycan.
Evaluation of RGs
The expression stability of seven common RGs (18S, ACTB, B2M, EF1a, GAPDH, RPL13a, and YWHAZ) was analyzed based on four different parameters:
(1) Interquartile range (IQR) representing the distribution of the Cq values. The IQR spans between the 75th and the 25th percentile of the boxplots delimiting with the whiskers, the maximum and minimum values; with the horizontal line, the median; and the outliers with a point, respectively.
(2) Variation between differentiation culture and control culture (p-value) established by an unpaired one-way t-test with a 95% confidence level. The null hypothesis (differentiation equals control culture) is rejected if the p-value<0.05 showed statistically significant difference between control and differentiation cultures.
(3) Average fold changes (AFC) calculated by subtracting the mean Cq value for each time point in control or differentiation culture from the mean Cq value corresponding to the control culture at day 2. ΔCq is further transformed into fold differences with the formula 2−ΔCq.13,17
(4) Maximum fold change (MFC) calculated similarly to the AFC though considering the maximum/minimum instead of the mean Cq value.13,18
(1) and (2) were calculated of the entire dataset of Cq values of three different donors at two different passages in control as well as in differentiation culture. (3) and (4) were calculated at each time point, using day 2 of control culture as calibrator. The obtained values of all time points and conditions of the entire dataset are in the case of AFC averaged, and for MFC, the highest one is represented in Table 2. The calculation of AFC and MFC assumes a primer efficiency of 100%. The perfect RG would show no variation in the Cq value during the process of differentiation and would result in AFC and MFC values equal to one, p-value >0.05, and IQR of zero. The statistical analysis was performed using R Project for Statistical Computing software (
In addition to the statistical evaluation of RG stability using the above-described criteria, geNorm, 11 Normfinder, 19 and BestKeeper 20 algorithms were applied. Cq values were put into the data file of Normfinder and BestKeeper software, whereas AFC values were used for geNorm analysis.
Results
Multilineage differentiation potential
The MSC multilineage differentiation potential of all donors was confirmed by qPCR (Fig. 2 and Table 1) as well as immunofluorescent and histochemical stainings (Fig. 1). Adipogenic differentiation is marked by the appearance of oil droplets stained by Oil Red O on day 16 (Fig. 1A). The adipogenic markers fatty acid-binding protein 4 (aP2) and peroxisome proliferator-activated receptor gamma (PPARγ) were expressed significantly at day 22 in all donors and were at passage 4, sometimes even more abundant than at passage 1 (Table 1). Chondrogenic differentiation was visualized using Alcian blue/PAS staining, revealing a light-blue color upon the appearance of proteoglycans starting on day 16 (Fig. 1B). Aggrecan and collagen II, the chondrogenic marker genes, are upregulated in all donors (Table 1). In the osteogenically differentiated samples, collagen I staining increased during the entire 22-day culture period (Fig. 1C), which goes in line with the qPCR data (Fig. 2 and Table 1). Osteocalcin, a later marker of osteogenesis, was expressed around day 9 and steadily increased thereafter. The qPCR data show that all three donors are exhibiting a multilineage differentiation potential (Fig. 2) with a certain interpatient variability typical for MSC studies (Table 1). The MSC-proliferation medium, containing FGF-2 to preserve the stem cell character, 21 was used as the control condition for adipo- and osteogenesis, exhibiting no Oil Red O or collagen I staining on day 21, respectively. The appropriate control condition for chondrogenesis was confirmed by the absence of Alcian blue staining in pellet cultures after 14 days.

Multilineage differentiation potential of MSCs.
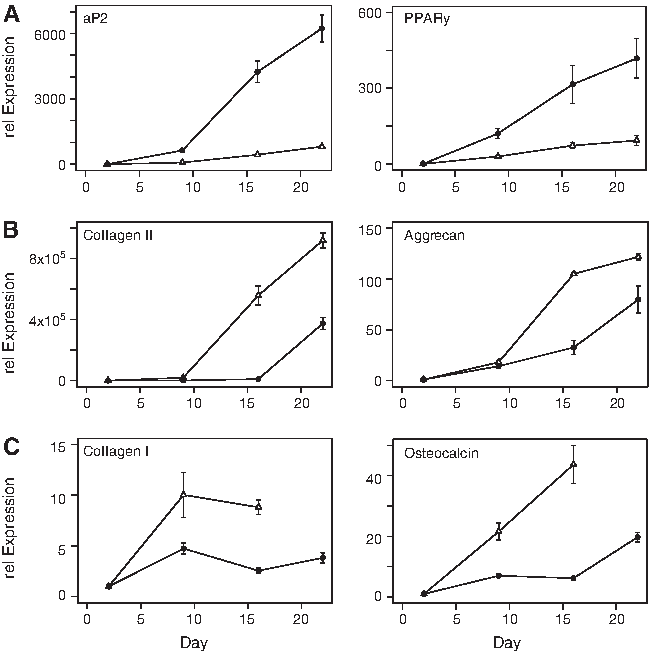
Gene expression profile of key differentiation markers. Gene expression profile of donor 2 at passages 1 (triangle) and 4 (circle) during
Relative expression (2−ΔΔCq) of differentiation markers of all donors at passages 1 and 4 at day 22 of induction of adipogenesis (adipo), chondrogenesis (chondro), and osteogenesis (osteo). RPL13a used as a normalizer and control culture day 2 as calibrator of all data. aP2, fatty acid-binding protein 4; PPARγ, peroxisome proliferator-activated receptor gamma; Coll II, collagen II; Coll I, collagen I; RPL13a, ribosomal protein L13a.
Evaluation of RG expression stability
Expansion and differentiation of hBM-MSCs
To study the expression stability of the seven RGs selected (for overview, see Supplementary Table S1) during differentiation, we analyzed several parameters summarized in Table 2. The distribution of the Cq of all donors was graphically depicted in boxplots (Fig. 3), which delimit the 25th and 75th percentile of the dataset also known as the IQR (Table 2). Further, a t-test was performed to assess the change between control and differentiation cultures represented as side-by-side boxplots in Figure 3A–C (right). The resulting p-value (Table 2) reflects the probability that the Cq values for differentiated samples are statistically different compared to control cultures. In addition, AFC and MFC13,17 were calculated (Fig. 4). The selection criteria applied in this work are IQR <0.7, p-value >0.05, AFC <2 (Fig. 4), and MFC <2.2. On the basis of these criteria, 18S (IQR=0.43, p-value=0.35, AFC=1.6, and MFC=1.92), EF1a (IQR=0.67, p-value=0.68, AFC=1.39, and MFC=1.48), and RPL13a (IQR=0.52, p-value=0.07, AFC=1.46, and MFC=1.57) are possible RGs to normalize adipogenic differentiation studies (Figs. 3A and 4A). For chondrogenesis (Figs. 3B and 4B), RPL13a (IQR=0.35, p-value=0.22, AFC=1.9, and MFC=2.11) as well as YWHAZ (IQR=0.43, p-value=0.42, AFC=1.53, and MFC=1.85) fulfilled the selection criteria, whereas only RPL13a (IQR=0.68, p-value=0.06, AFC=1.65, and MFC=1.83) was concluded to be a stably expressed RG during osteogenic differentiation (Figs. 3C and 4C). On the other hand, the two most unstably expressed RGs were ACTB and GAPDH with MFC reaching up to 8.35 (ACTB during adipogenesis) and 20.05 (GAPDH during chondrogenesis). This unstability was confirmed in the analysis of all differentiation lineages together, resulting in the two highest IQRs for ACTB (1.21) and GAPDH (1.43) (Fig. 3D and Table 2). Taken together, RPL13a shows the lowest variability across donors, passage numbers, as well as differentiation conditions with an IQR of 0.59, p-value of 0.56, and MFC smaller than 2. Based on these results, we ranked the genes according to their IQR (the lower, the more stable). This ranking represented in Table 3 places RPL13a in the first place for chondrogenesis and osteogenesis and on the second place for adipogenesis. The algorithms of geNorm, NormFinder, and Bestkeeper all support the first rank of RPL13a for the analysis of chondrogenic induction experiments, whereas for adipogenesis and osteogenesis, always two out of three show RPL13a in the first rank (Table 3).
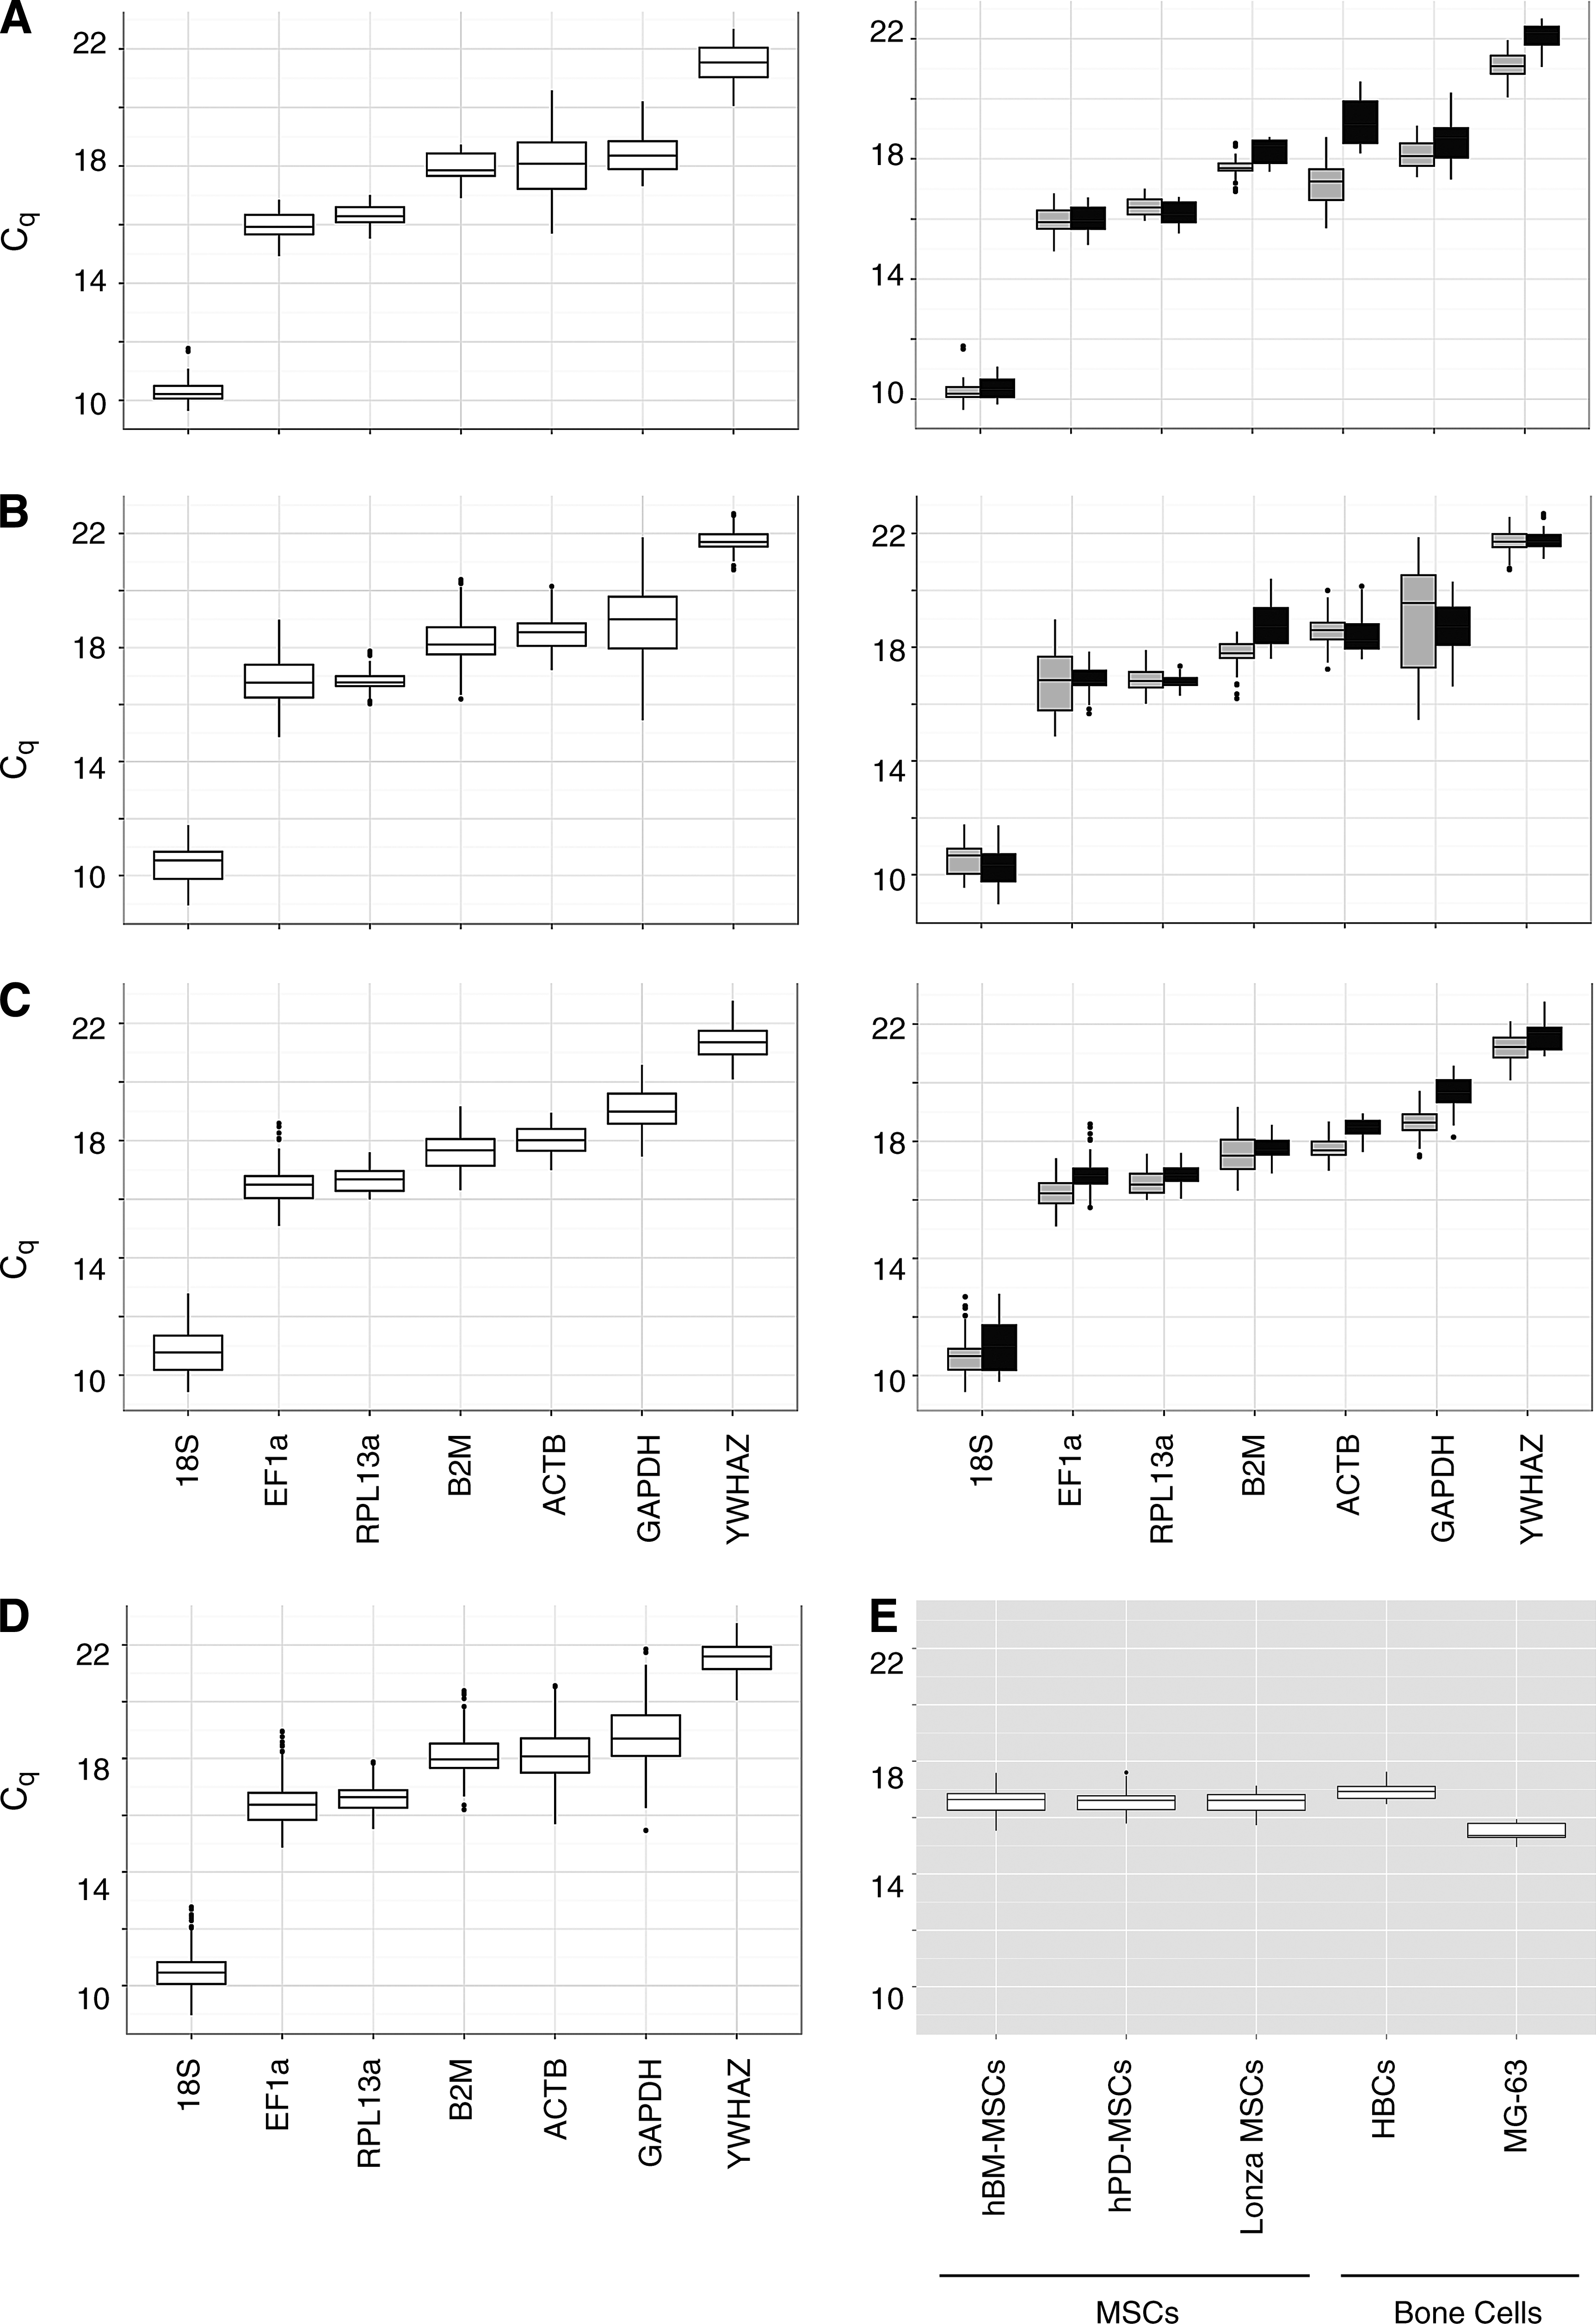
Distribution of Cq values.

Fold changes (2−ΔCq) in RG expression. Average (columns) and maximum fold change (error bars) of
Coefficient of variation (%) calculated by the SD divided by the mean, p-value of the t-test showing the variation between the ct values of control and differentiation cultures, inter quartile range (IQR), average fold change (AFC), and maximum fold change (MFC). For AFC and MFC, the highest value of the whole dataset is represented. The reference genes fulfilling the selection criteria (IQR <0.7, p-value >0.05, AFC <2, and MFC <2.2) during adipo-, chondro-, and osteogenesis are highlighted in gray. The analysis of all quantification cycle values of adipo-, chondro-, and osteogenesis together (labeled as all) resulted in only RPL13a fulfilling the criteria.
EF1α, eukaryotic translational elongation factor 1 alpha; B2M, β2-microglobulin; ACTB, beta-actin; GAPDH, glyceraldehyde-3-phosphate dehydrogenase; YWHAZ, tyrosine 3-monooxygenase/tryptophan 5-monooxygenase activation protein, zeta polypeptide; SD, standard deviation.
Rating based on different algorithms yielding expression stability values (shown in parenthesis). Algorithms used: geNorm (M value), NormFinder, BestKeeper (SD[±CP]), and IQR rating. Ranking of RPL13a highlighted in gray.
SD[±CP], standard deviation of crossing point.
MSCs of different sources and bone cells
Once RPL13a was selected as the RG of choice for hBM-MSCs, we further tested its expression stability on commercially available hBM-MSCs (Lonza MSCs) as well as hPD-MSCs during adipo-, chondro-, and osteogenesis. The differentiation experiments using Lonza MSCs were performed with purchased cells from one donor and the hPD-MSCs cells from two donors. RPL13a showed a similar distribution for these two MSCs (Fig. 3E) as it does for the freshly isolated hBM-MSCs and is therefore considered stably expressed throughout mesodermal differentiation of MSCs. In a subsequent step, we analyzed the RPL13a stability in gene expression during osteogenic differentiation of bone cells. Primary HBCs as well as the MG-63 (human osteosarcoma cell line) were therefore induced over 7 days (time points analyzed: day 1, 4, 7) in an induction medium. The HBCs show a comparable Cq distribution to that of MSCs (Fig. 3E), whereas MG-63 cells, the only nonprimary cells, are expressing RPL13a at a higher level. Although exhibiting a lower Cq mean, the distribution is narrow, indicating a high expression stability of RPL13a during osteogenic differentiation.
Effect of RG expression stability on marker gene expression
The effect of the RG variance on the expression pattern of the adipo-, chondro-, and osteomarkers was analyzed (Fig. 5). For clarity, only the relative expression of the marker genes from the donor 2 at passage 1 is shown using GAPDH, RPL13a, and ACTB as RGs. The instability of ACTB during adipogenesis leads to an increase of 281% of the relative expression of aP2 at day 22 compared to RPL13a. GAPDH, being less variable, only shows an error of 28% (Fig. 5A). The expression of collagen II during the chondrogenic differentiation process is affected by a smaller degree by ACTB (40%), but more pronounced by GAPDH (222%) (Fig. 5B). This increase would be even higher when relating to the control cultures of the chondrogenic lineage (Fig. 4B). The normalization of the osteogenic-specific genes shows a resulting error in collagen I expression of 186% for ACTB and 55% for GAPDH (Fig. 5C).
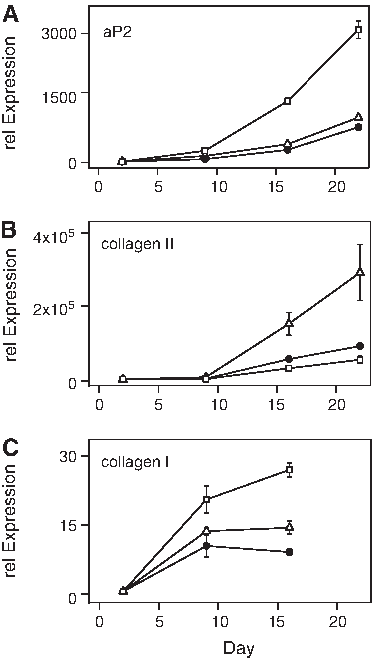
Effect of RG stability on marker gene expression. Relative gene expression of
Discussion
In the present study, we have established RPL13a, a member of the L13 ribosomal protein family and a structural component of the large 60S ribosomal subunit, as the RG of choice for MSC studies. Among the seven RGs—18S, GAPDH, RPL13a, ACTB, YWHAZ, EF1a, and B2M—RPL13a showed the lowest expression variability throughout adipogenic, chondrogenic, and osteogenic differentiation of MSCs. We have studied the stability in gene expression of the RGs of three different donors at passages 1 and 4, proving that RPL13a expression is stable not only during differentiation but also during expansion to higher passages. This result is confirmed by at least two out of three algorithms (geNorm, NormFinder, and BestKeeper) known for the gene expression stability analysis. The discrepancy in the resulting stability ranking shows the difficulty of the RG stability analysis, which is based on different arbitrarily chosen parameters. The majority of three out of four analysis methods supporting RPL13a as the RG of choice is striking evidence for its stability.
Next to freshly isolated hBM-MSCs, we applied RPL13a to studies with commercially available and hPD-MSCs, where its suitability for comparison studies between different MSCs was confirmed. These findings are in agreement with several studies on qPCR normalization. de Jonge et al. 18 performed a meta-analysis on 13,629 human gene array samples (including stem cells) and identified RPL13a as one of the top 15 candidate RGs. The ranking based on the coefficient of variation (CV) placed ACTB on position 57 and GAPDH on 139. Vandesompele et al. 11 studied different human tissues and cells (including bone marrow) and concluded that RPL13a and Ubiquitin C are the RGs with the smallest variation in bone marrow samples. These two publications, studying the stability of RGs in a wide variety of tissues, are lacking the analysis of their variance during differentiation events. The work of Curtis et al. 12 focused on endothelial differentiation of bone marrow-derived MSCs as well as their expansion under different conditions. They have shown EF1a and RPL13a expression to be stable under all studied experimental conditions, but missing the differentiation into the common mesodermal lineages. Quiroz et al. 13 demonstrated the stability of RPL13a expression for osteogenic differentiation of bone marrow-derived MSCs, applying the selection criteria of AFC and MFC <2. Their study was performed using cells from one donor at passage 5, thereby neglecting the interpatient variability. We decided, in the present work, to use cells from three patients, to address this variability. Our results show that the gene expression stability of RPL13a in the osteogenically induced cultures fulfills the criteria proposed by Quiroz et al., 13 including not one, but three donors at different passages. Osteogenesis though showed to be the mesodermal differentiation lineage that was the least affected by changes resulting from RG expression instability. Taking adipogenesis and chondrogenesis in consideration as well, the selection criteria had to be slightly alleviated to AFC <2 and MFC <2.2. Additionally, our data confirm the use of RPL13a as an RG in bone research, showing its stability not only under osteogenic differentiation of MSCs but also of MG-63 and primary bone cells. The higher abundance of RPL13a in the osteosarcoma cell line MG-63 might be related to their tumor-related origin as previously described for immortalization processes known to affect cellular processes.23,24
GAPDH and ACTB, the two most widely used RGs in MSC studies,12,25 showed the highest expression variability of all seven RGs analyzed in bone marrow-derived MSCs. GAPDH has been shown to play a role in many cellular processes such as nuclear RNA export, DNA replication, DNA repair, exocytotic membrane fusion, cytoskeletal organization, and phosphotransferase activity; 26 therefore, its mRNA level is prone to be affected by events such as differentiation. The expression level of ACTB, a structural protein associated with cell shape and motility, is expected to be altered during adipo-, chondro-, and osteogenesis, the three processes involving a major change in cell morphology.27–30 The use of ribosomal RNA genes such as 18S, on the other hand, is not only problematic due to their proven instability (see Table 2)9,31,32 but also due to their high abundance and the different transcription mechanism that, compared to mRNA, is not carried out by RNA polymerase II, but RNA polymerase I.31,33 We therefore highly recommend abandoning the normalization based on these RGs in the field of human MSC research.
The expression variability of RGs used in the MSC community hinders a conclusive comparison between different studies and therefore puts their value into question. Our work showing the instability in gene expression of commonly used RGs under expansion, adipo-, chondro-, and osteogenic differentiation as well as between different MSCs further demonstrates the necessity of establishing a common RG to be used by all investigators working on MSCs. We propose the use of RPL13a as a single RG instead of the multiple-RG approach proposed by others, 11 as the stability of RPL13a is sufficiently high.
Footnotes
Acknowledgments
This work was supported by the Swiss National Science Foundation (Grant CR23I2_130678) and the European Union Seventh Framework Program (FP7/2007–2013) under the grant agreement no. NMP4-SL-2009-229292 (Find&Bind). The bone marrow samples employed in this work were kindly provided by the Clinic of Orthopedic Surgery, Kantonsspital St. Gallen, Switzerland, and BMP-2 was provided by F. Weber, University Hospital Zürich, Switzerland.
Disclosure Statement
No competing financial interests exist.
References
Supplementary Material
Please find the following supplemental material available below.
For Open Access articles published under a Creative Commons License, all supplemental material carries the same license as the article it is associated with.
For non-Open Access articles published, all supplemental material carries a non-exclusive license, and permission requests for re-use of supplemental material or any part of supplemental material shall be sent directly to the copyright owner as specified in the copyright notice associated with the article.