
Abstract
Human embryonic stem cells (hESCs) are a promising cell source for tissue engineering and regenerative medicine, but before they can be used in therapies, we must be able to accurately identify the state and progeny of hESCs. One of the most commonly used methods for identification is flow cytometry. Many flow cytometry applications use antibodies to detect the amount of antigen present on/in a cell. This allows for the identification of unique cell populations or the tracking of expression changes within a population during differentiation. The results are typically presented as a percentage of positively expressing cells (%Pos) for a marker of choice, relative to a negative control. However, this reporting term is vulnerable to distortion from outliers and inaccuracy from loss of information about the population's fluorescence intensity. In this article, we describe an alternate strategy that uses the normalized median fluorescence intensity (nMFI), in which the MFI of the stained sample is normalized to the MFI of the negative control, as the reporting term to more accurately describe a population of cells in culture. We observed that nMFI provides a more accurate representation for the quality of a starting population and comparing data of different experimental runs. In addition, we demonstrated that the nMFI is a more sensitive measure of pluripotent and differentiation markers expression changes during hESC differentiation into three germ layer lineages.
Introduction
One of the easiest methods of optimization is using flow cytometry. This method is simple, sensitive, and well-established. It is able to identify rare subpopulations,1–3 track the percentage of transient cell types during differentiation,4,5 and assess marker expression. Flow cytometry relies on the use of dyes or antibodies to detect cell-specific surface, intracellular, or nuclear markers. Several antibodies can be used in conjunction, as long as they are conjugated to different fluorochromes or are of different animal species. Thus, differentiation progress and efficiency can be tracked by monitoring the changes in the cell population's expression of intermediary and final cell types.
Current methods of flow cytometry analysis rely on gating strategies based on a negative control. One of the most common methods is to create a gate based on the negative control so that only a small percentage of events (less than 1%) are considered within the gate. This gate is then applied to the corresponding samples, and the events within the gate are termed the percentage of positively expressing cells (%Pos). %Pos, unfortunately, has two major limitations due to its reliance on the negative control. The first is the loss of resolution—the gate sums the number of events that occurs within a range of fluorescence intensity (usually 3 logarithmic units) and does not account for any fluorescent intensity shifts within the gating range. However, these small shifts in fluorescence intensity are important indications of changes within the cell population. These changes may be an indication of how differentiation is progressing by an upregulation or downregulation of marker expression, and a more accurate indication of the cell state. The second limitation of %Pos is vulnerability to skewing. The gate of %Pos is created based on a small percentage of positive cells in the negative control, which often has outliers. As the number of outliers increase, the gate becomes more skewed to the right, thereby resulting in an inaccurately low %Pos. These small shifts of the gate due to the slight increase of outliers in the negative control may conceal a difference between two populations, or indicate a difference between two equivalent populations.
To overcome some of the limitations of %Pos, we propose an alternate analysis method based on median fluorescence intensities (MFIs) that have been normalized to the negative control. Using the changes to pluripotent marker expression during hESC differentiation as a model, we found that the normalized MFI (nMFI) is less susceptible to being skewed from outliers within the negative control and the sample itself—hence, it is less prone to artificial low values and false changes. We have also found that the nMFI is a more indicative term to track subtle changes of expression within the population that are missed by the %Pos, due to the large range of fluorescence intensities. This article will highlight the limitations of %Pos and the way in which nMFI overcomes these limitations.
Materials and Methods
hESC culture
The hESC cell line, HES-3, was obtained from ES Cell International (ESI,
The H7 hESC line, obtained from the WiCell Research Institute (
Differentiation
Hepatic,
8
chondrogenic,
9
and neurogenic
10
differentiation was performed as described in Supplementary Fig. S1 and Supplementary Materials and Methods (Supplementary Data are available online at
Flow cytometry
Flow cytometry was performed as described in Supplementary Materials and Methods.
Results
In this study, we explored two methods of flow cytometry analysis—MFI or the conventional 1% gating strategy. The 1% gating strategy, or a variation of it, is one of the most common methods of analyzing flow cytometry data. This analysis is done by creating a gate on the negative control so that only 1% of the population is considered to positively express the marker, and then applying this gate to all the stained samples of the same cell type (Fig. 1). The resulting percentage of positively expressing cells for the stained sample is the reported value, termed %Pos.
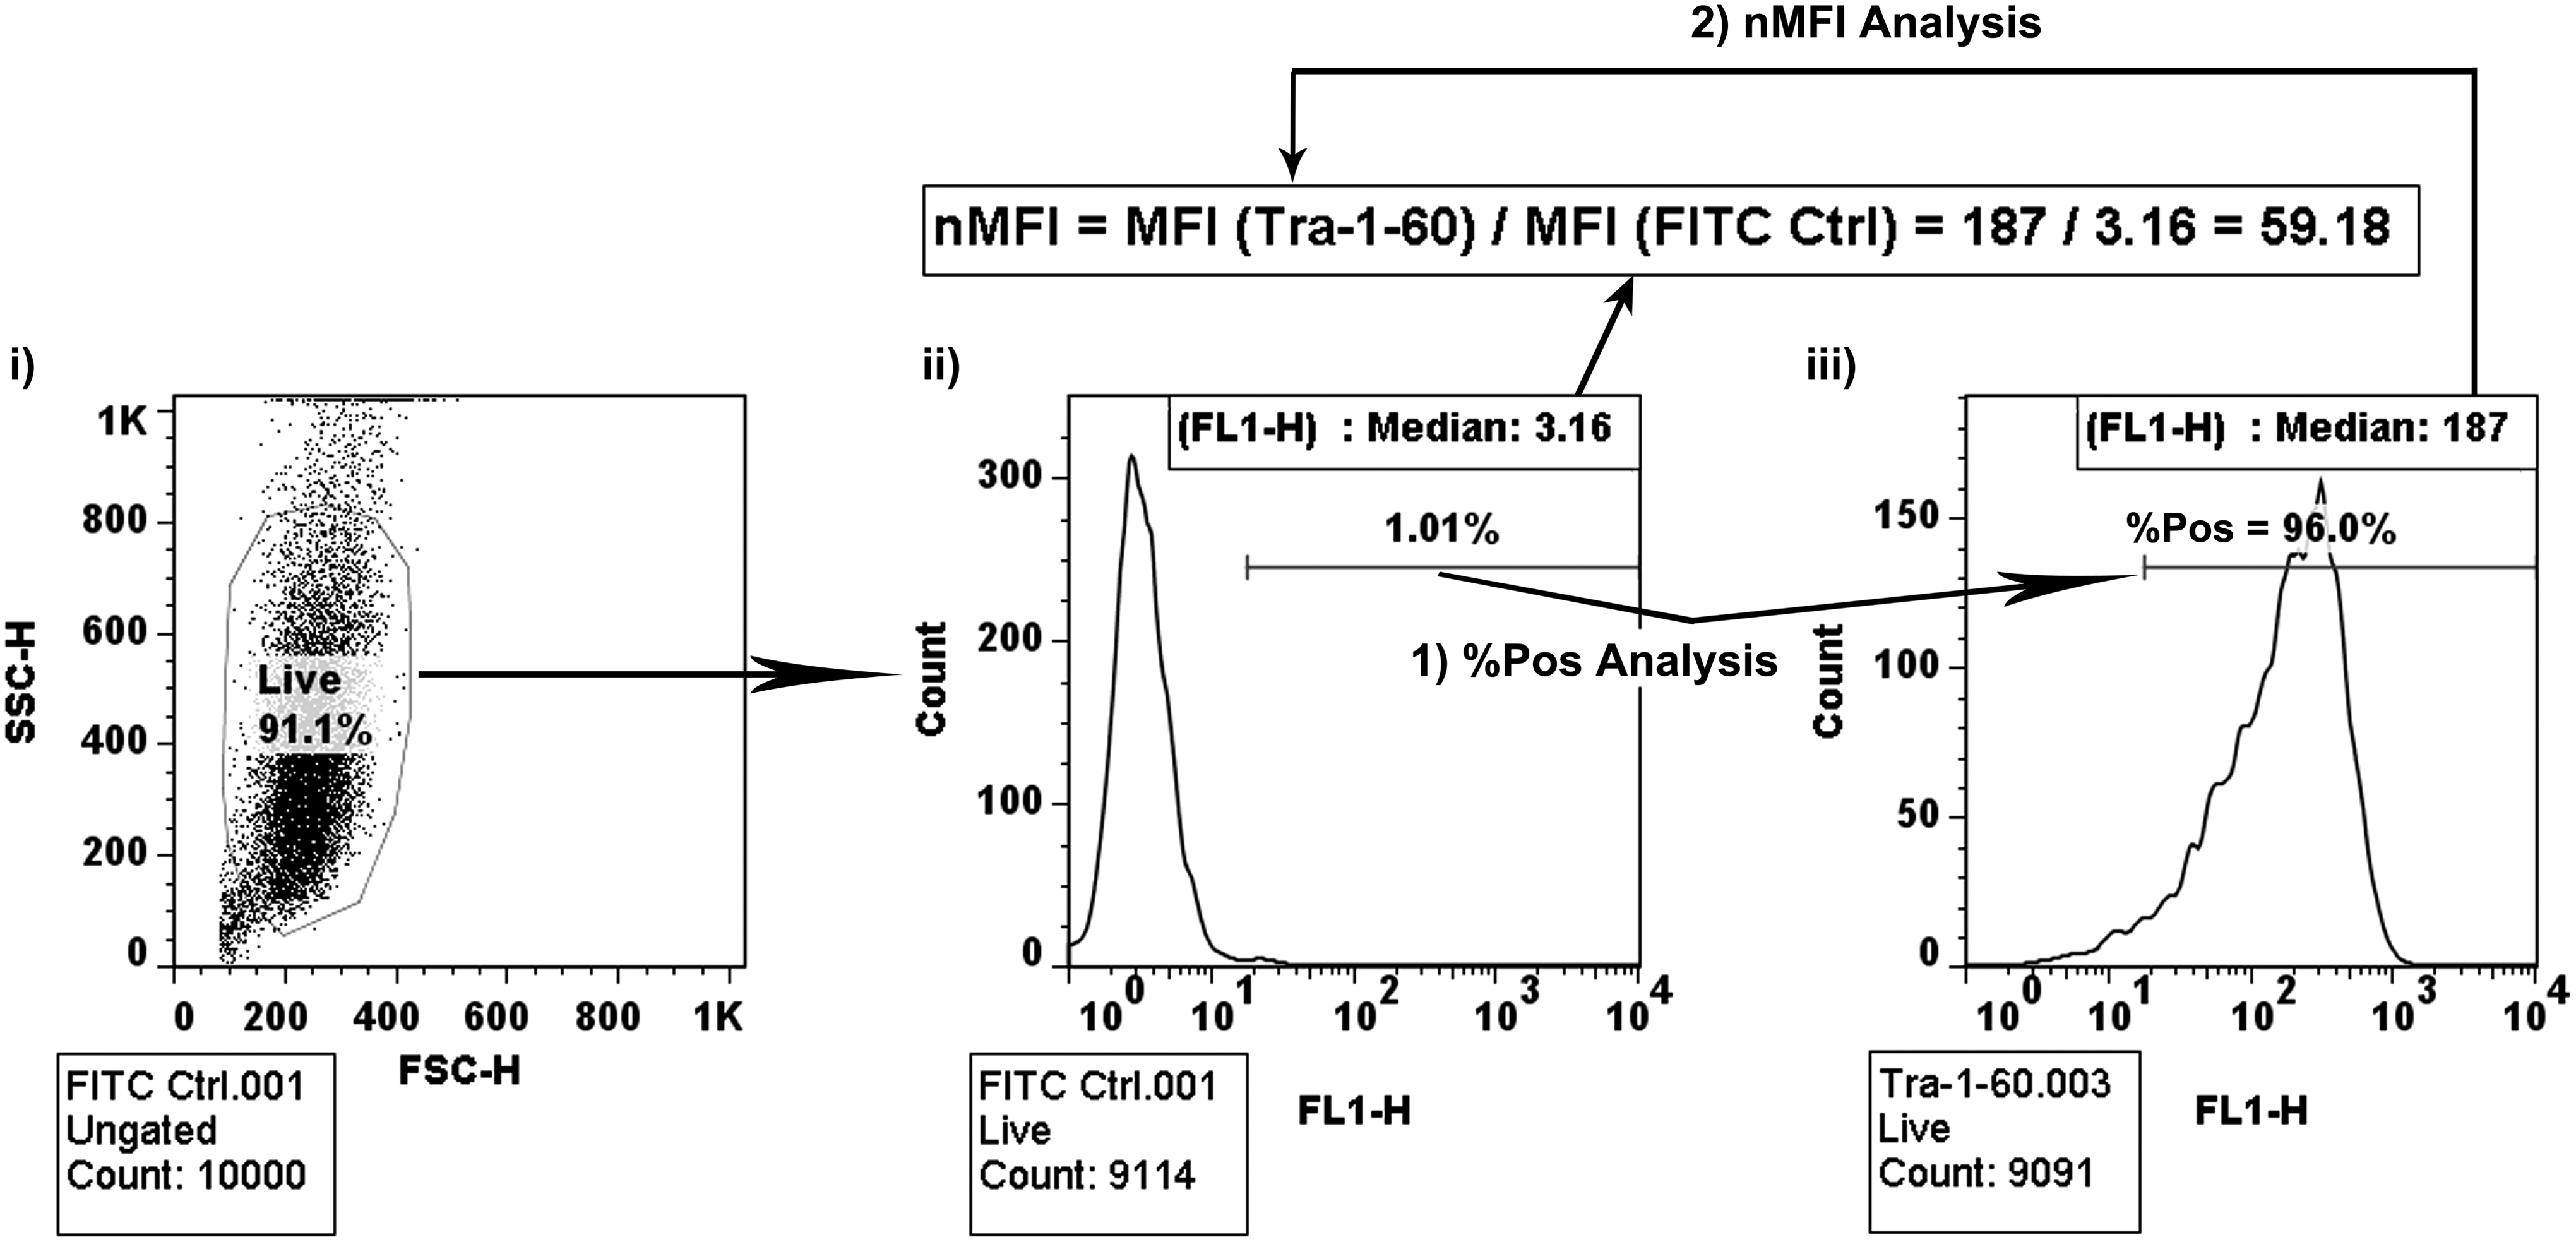
Schematic of two flow cytometry analysis methodologies. After collecting 10,000 events using the BD FACSCalibur,
The reporting term, %Pos, is highly susceptible to skewing by outliers in the negative control, and is unable to account for shifts in the fluorescent intensity of the cell population within the gated area (typically 3 logs)–this may result in misinterpretation of the data. The MFI is able to resolve these two issues. To analyze the data using the MFI, we take the MFI of the stained sample and normalize it to the MFI of the negative control (Equation 1 and Fig. 1). The resulting value is the nMFI. The nMFI accounts for shifts in the fluorescent intensity of the entire population, partially accounts for the shifts in the population's fluorescent intensity range, and will not be skewed by outliers within the population. The following sections clearly demonstrate the increased sensitivity of using the nMFI as the reporting term as compared to %Pos.
Increased robustness: outliers do not alter the nMFI
As previously mentioned, one of the main limitations of %Pos is its vulnerability to outliers in the negative control. To evaluate the susceptibility of nMFI to outliers as compared to %Pos, hESC were differentiated into the three germ lineages—hepatocytes, chondrocytes, or neurons. The pluripotent (Fig. 2A, Supplementary Fig. S2A) and lineage-specific (Fig. 2B, Supplementary Fig. S2B, C) markers expression were evaluated at multiple time points. During these differentiation runs, there were two examples of %Pos being highly skewed by outliers. On day 3 of chondrogenic differentiation (Fig. 2A, black circle) and on day 14 of neurogenic differentiation (Fig. 2B, black circle), the %Pos of Tra-1-60 and PSA-NCAM, respectively, were artificially lower than the bracketing time points. This was due to an unusually large number of positive outliers in the negative control that shifted the 1% gate to the right by at least 0.5 logs (Fig. 2C, shaded area). This small shift resulted in misleadingly low percentages of positively expressing cells (Fig. 2 and Supplementary Figs. S3–S5). These outliers, however, did not cause a similar dip in the nMFI. An additional example of how the nMFI does not indicate false changes can be seen in the tracking of Tra-1-60 expression during hepatic differentiation between day 0 and day 6 in Figure 2A. The %Pos indicated that there was a sudden drop in positively expressing cells at day 4; however, based on nMFI (Fig. 2A) and the histograms (Supplementary Fig. 6), the population of cells did not demonstrate such a drastic shift from day 0 to day 4 to day 6. Hence, we conclude that the nMFI is a more reliable reporting term because it has increased sensitivity as compared to %Pos.

Change in pluripotent and differentiation markers during hepatic, chondrogenic, and neurogenic differentiation. Graphical representations of the changes in expression of
Increased accuracy: nMFI is a better indicator of the starting hESC state
Figure 3 displays the histograms of the two pluripotent markers, mAb 84 (an antibody against PODXL 11 ) and anti-Tra-1-60, for three biological replicates of HES-3 cells. As indicated by the changes in fluorescence intensity, there was a high variability in marker expression; however, because all of the shifts in fluorescence intensity occur within the 1% gate, the variability was not accounted for in %Pos, which remains above 90% (Fig. 3, panel i and iii). This loss of information by %Pos can lead to the inaccurate conclusion that two different populations were similar. For example, it could be concluded that Sample #1 and Sample #2 were equally pluripotent because 96.3% and 96.6%, respectively, of the population stained positive with mAb 84 (Fig. 3, panel i). However, when the histograms were compared, Sample #1 clearly had a higher expression of PODXL, as indicated by the rightward shift in the histogram and the nMFI (73.06 and 23.12 for Sample #1 and Sample #2, respectively, panel ii). The information lost with %Pos could also indicate that two populations were different, when they were quite similar. This was demonstrated by comparing the expression of Tra-1-60 in Sample #1 and Sample #3 in Figure 3 (panels iii and iv). The %Pos was 93.4% and 96.0% for Sample #1 and Sample #3, respectively, which would indicate that Sample #3 was more pluripotent; however, when comparing the histograms and the nMFI (59.44 and 59.18 for Sample #1 and Sample #3, respectively), we could see that the expression of Tra-1-60, relative to the negative control was similar. Thus, when determining the state of hESC culture by flow cytometry, the nMFI provides a more robust indication of a population's state, as compared to %Pos.

Pluripotent marker expression varies in three starting HES-3 cultures. The pluripotent markers, mAb 84 and Tra-1-60, of the three biological replicates of HES-3 before differentiation show different levels of expression according to nMFI, but not by %Pos. In each histogram, the negative control (dashed) is displayed with the stained sample (solid).
Increased accuracy: nMFI is a more sensitive tracker of differentiation
Based on the increased robustness and accuracy, we hypothesized that the nMFI would be a more sensitive tracker of hESC differentiation. We first established this by quantifying pluripotent marker expression of mAb 84 at 3-day intervals with flow cytometry during chondrogenic differentiation of HES-3 cells. The differences between nMFI and %Pos as reporting terms can be seen in Figure 4A, based on the loss of PODXL expression as chondrogenic differentiation progresses. Although both nMFI and %Pos demonstrated a loss of marker expression, the initial point of decrease and the rate of change were different. The nMFI indicated a decrease in marker expression immediately, whereas the %Pos remained above 95% before indicating a significant drop in population expression at day 9 of differentiation. From the raw data, PODXL expression began decreasing by day 3, as indicated by the increasing quantity of differentiating cells (i.e., cells with a lower PODXL expression) at each subsequent time point (Fig. 4B, arrows) and the population's increasing heterogeneity (i.e., the increased range of fluorescent intensities from 1.5 logs at day 0 to 2 logs at day 6). This was reflected by the decreasing nMFI, but not %Pos, as these changes occurred predominantly within the fluorescent intensity range covered by the 1% gate (Fig. 4B). This clearly demonstrates the increased sensitivity of nMFI to subtle, but significant changes in a population's marker expression during early differentiation as compared to %Pos and the ability of nMFI to capture the early commitment of the cells toward a particular cell fate.
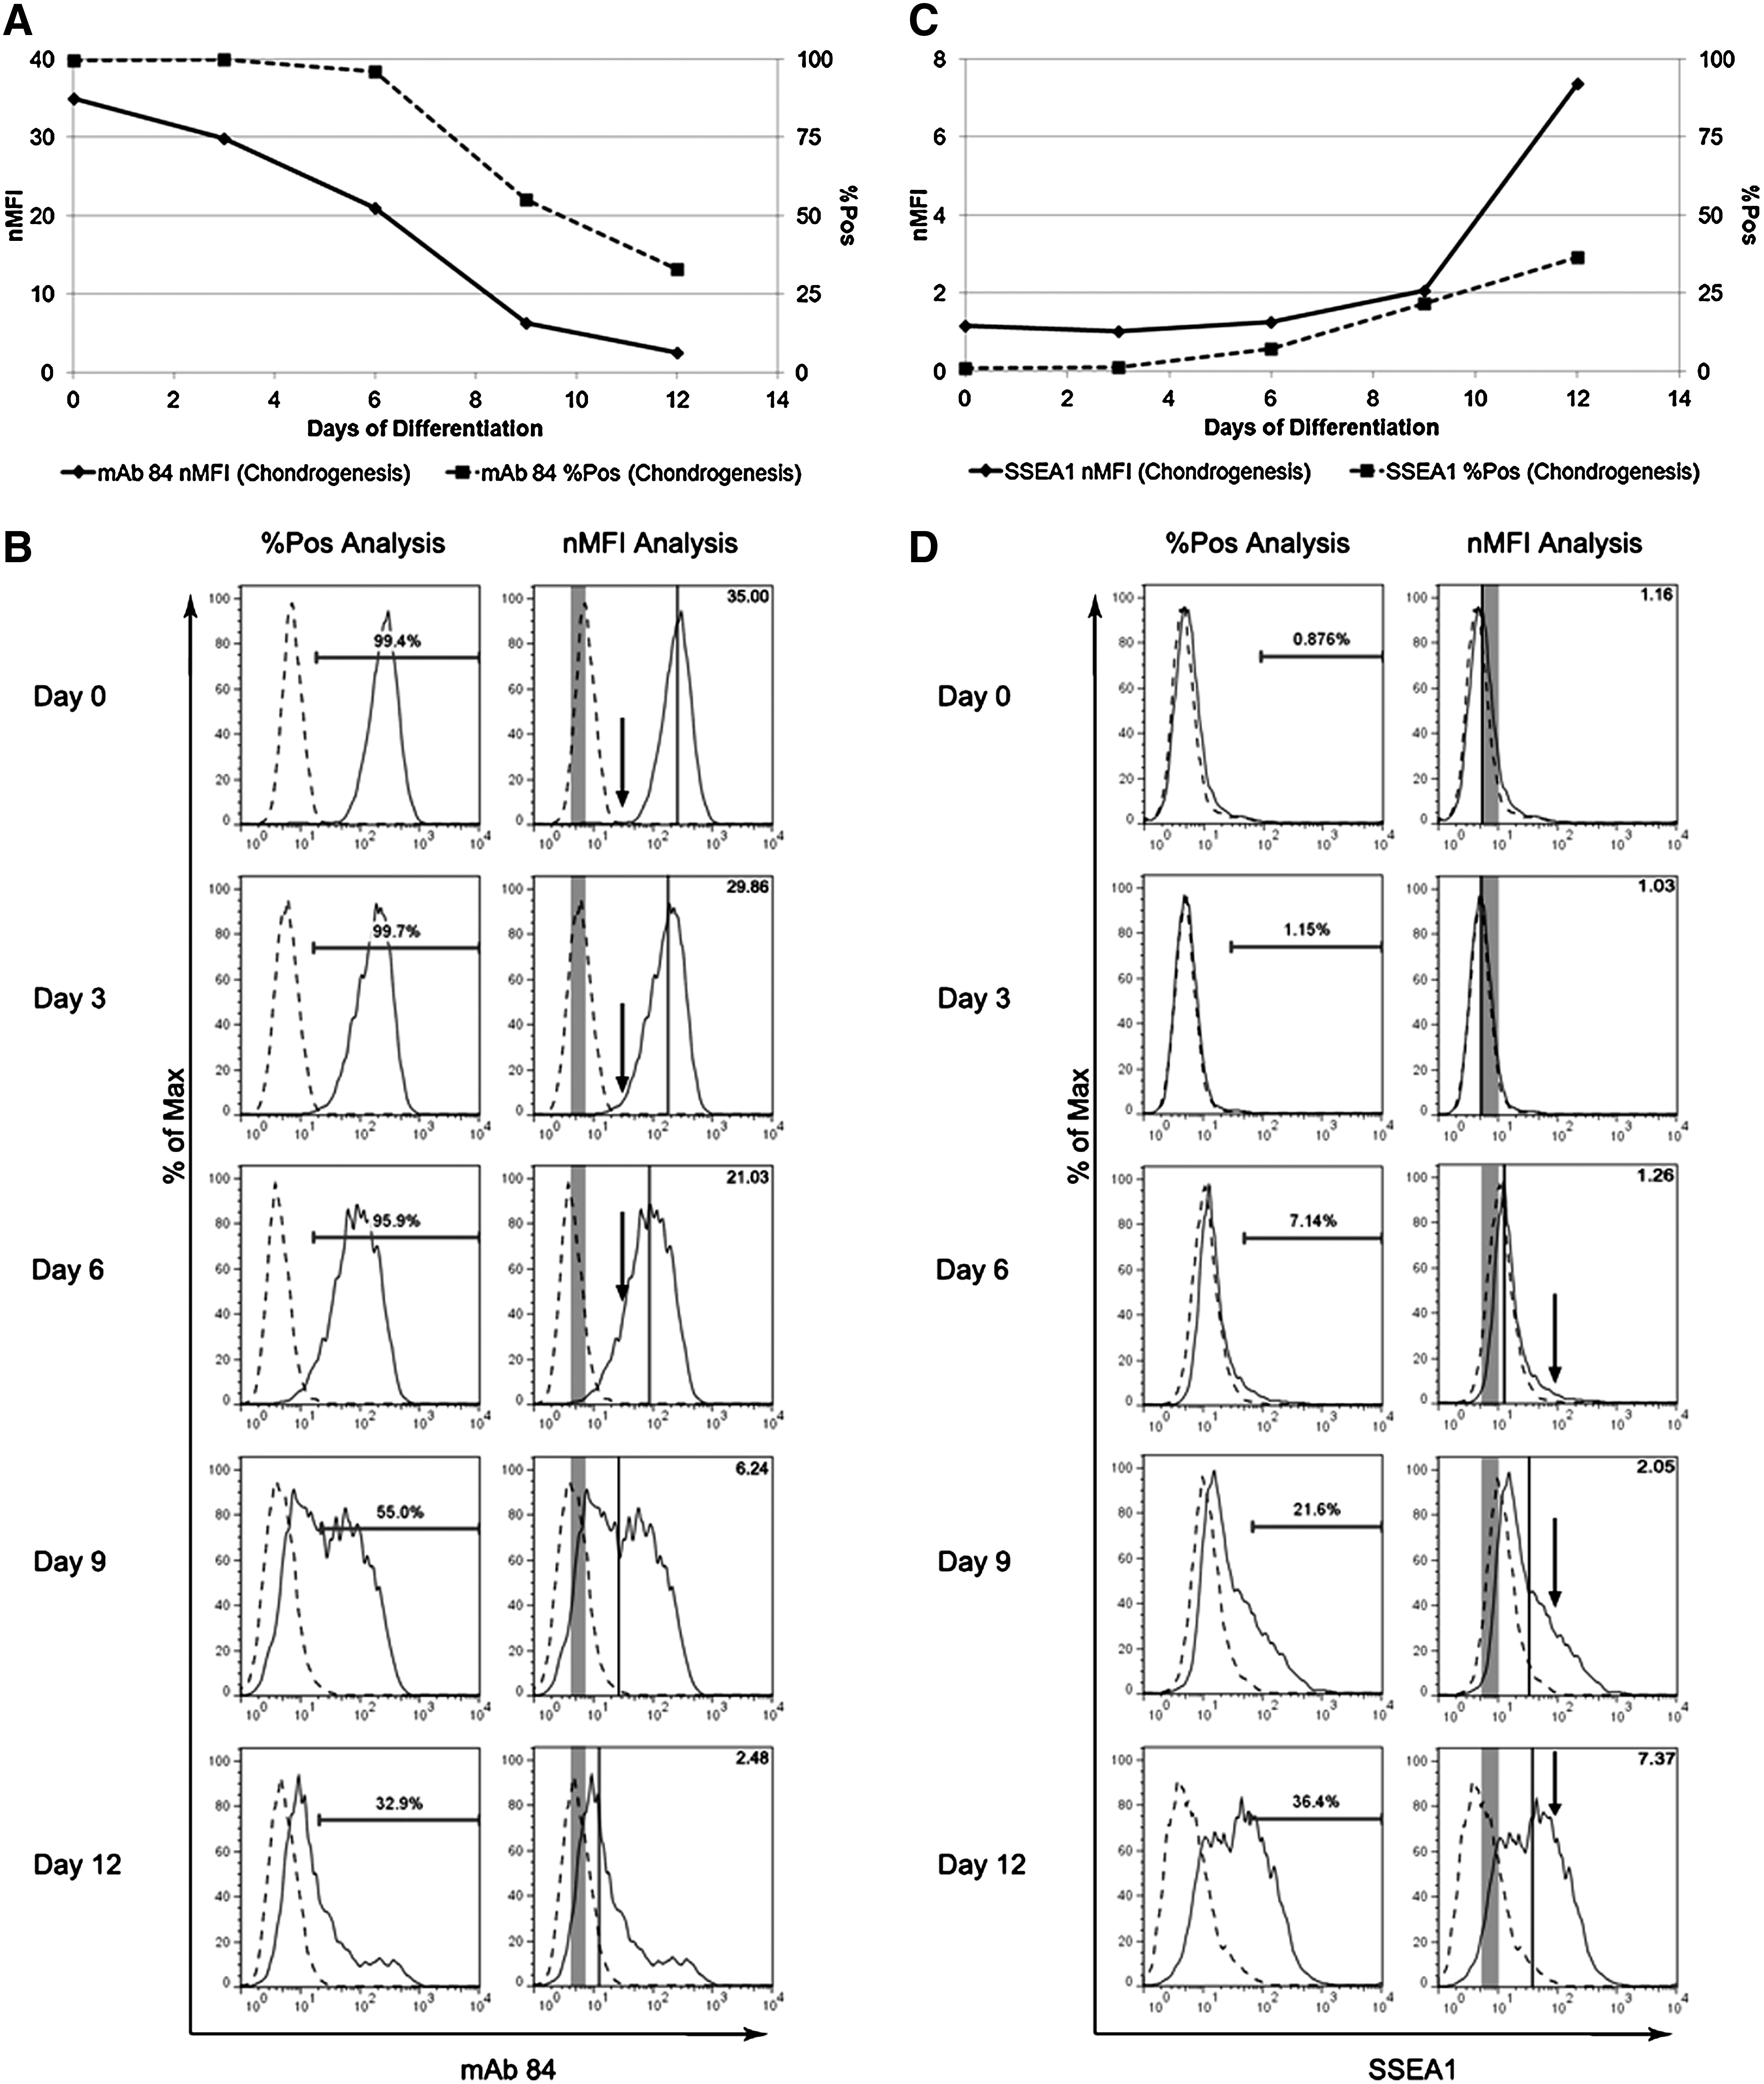
Comparison of nMFI and %Pos tracking pluripotent and differentiation marker expressions during chondrogenic differentiationofHES-3 cells andneurogenicdifferentiationofH7 cells. Ashuman embryonic stemcells (hESCs)weredifferentiated into the chondrogenic or neurogenic lineages,
As the marker expression changes became more apparent, both nMFI and %Pos reflected the changes similarly. The sharp decrease in both nMFI and %Pos between day 6 and day 9 (Fig. 4A) clearly indicated that a greater proportion of the population had differentiated and no longer expressed PODXL (Fig. 4B). Overall, nMFI was able to detect both subtle and large shifts in a heterogeneous population, thus providing a faster and more accurate indication of changes in pluripotent marker expression during hESC differentiation.
Similarly, the nMFI was able to detect the upregulation of SSEA1, a marker of differentiation, during HES-3 chondrogenesis (Fig. 4 C, D). While both nMFI and %Pos were able to track the upregulation on days 6, 9, and 12, we observed that the nMFI emphasized the relative upregulation more accurately. On day 6, the upregulation (Fig. 4D, black arrows) of SSEA1 was relatively subtle, as demonstrated by the small increase in both nMFI and %Pos. By day 9 and day 12, however, the upregulation of SSEA1 was much faster and a greater percentage of cells were fluorescing at a higher intensity (Fig. 4D, black arrows). While both nMFI and %Pos were able to capture the upregulation of SSEA1, the nMFI better represented the large change in marker expression between days 9 and 12; therefore, the nMFI continued to be a more accurate tracker of expression change during hESC differentiation.
We then investigated the accuracy of nMFI as compared to %Pos during HES-3 cells differentiation into the three germ layers using a variety of positive and negative markers of differentiation. The nMFI was consistently more sensitive to subtle and earlier changes. We tracked the changes in expression of mAb 84, Tra-1-60, SSEA1, and a lineage-specific marker during neurogenic, chondrogenic, and hepatic differentiation. The changes based on nMFI and %Pos are illustrated in Figure 2 and Supplementary Figs. S2–S6.
While both nMFI and %Pos were able to track the overall trend of increasing or decreasing marker expression, there were clear instances, where nMFI proved to be more sensitive. In all three lineage differentiations, the change in Tra-1-60 expression was better tracked with nMFI. At the start of differentiation, Tra-1-60 expression slowly decreased (Supplementary Figs. S3, S4, and S6), which was captured by the nMFI, but a decrease in %Pos was only observed much later in differentiation. This was evident between day 0 and day 4 during hepatic differentiation (nMFI: 14.09 to 5.92, %Pos: 89.2% to 81.2%), between day 0 and day 6 during chondrogenic differentiation (nMFI: 40.65 to 19.46, %Pos: 95.6% to 94%), and between day 4 and day 10 during neurogenic differentiation (nMFI: 90.50 to 8.68; %Pos: 95.8% to 82.0%) (Fig. 2A). A clear shift in the cell population to those with a lower marker expression was evident from the histograms (Supplementary Figs. S3, S4, and S6), but this shift was only distinct with nMFI. This disconnection between %Pos and marker expression was also evident at the end of differentiation when examining Sox9 and PSA-NCAM, for chondrogenic and neurogenic differentiation, respectively. When examining Sox9 expression at days 6, 9, and 12 during chondrogenic differentiation (Fig. 2B), the %Pos indicated that the Sox9-positive population was decreasing; however, the nMFI (Fig. 2B) and the histogram (Supplementary Fig. S3) indicate that the population of cells was actually expressing higher levels of Sox9 at each subsequent time point. A similar event occurs during neurogenic differentiation—the cells began to express higher levels of PSA-NCAM at days 14, 17, and 21 (Supplementary Fig. S4), but only the nMFI indicated the steadily increasing expression (Fig. 2B).
We then investigated whether the nMFI would continue to be a more sensitive tracker than %Pos when the H7 hESC line underwent neurogenic differentiation. We found that it continued to be a more sensitive tracker for the pluripotent marker, SSEA4, and lineage-specific markers, SSEA1, FORSE-1, and CD133/2 (Fig. 4E, H, Supplementary Figs. S2C and S5). The nMFI, unlike %Pos, was able to detect the consistent downregulation of SSEA4 as differentiation progressed (Fig. 4E, F). This can be seen by the growing population of cells expressing a lower level of SSEA4 at each time point, as indicated by the lower fluorescence intensity (Fig. 4F, arrows). Similarly, the nMFI, unlike %Pos, was able to detect that the beginning of SSEA1 downregulation after day 10 (Fig. 4G), as shown by the decreasing cell population at the higher fluorescence intensities (Fig. 4H, arrows). We also observed that the nMFI was not skewed by outliers during the detection of CD133/2 (Supplementary Fig. S2C and S5). From this data, we are confident that the nMFI is a robust and accurate analysis methodology between hESC cell lines.
Increased accuracy: nMFI better measure for comparing differentiation runs
In addition to being able to more accurately track differentiation, nMFI is also a better term to compare the progress of independent differentiation runs. Figure 5A focuses on the expression changes of PODXL using mAb 84, during two independent neurogenic differentiation experiments. Based on %Pos (dashed), the two differentiation runs appeared to be proceeding at the same rate; however, upon closer examination of the histograms (Fig. 5B), we could see that the differentiation progressed at different rates, with run #1 progressing more steadily and run #2 abruptly changing between day 10 and day 14. As illustrated in Figure 5A, these differences were better accounted for by the nMFI than by the %Pos, with the most significant changes between day 10, day 14, and day 17. In run #1 (Fig. 5B, top row), the expression of PODXL in the population slowly decreased from 2000 to 200 fluorescence units at day 10 to 8–60 fluorescence units at day 17; with day 14 being a transitional stage, where the population was very heterogeneous (8–2000 fluorescence units), with a bias toward higher expressing cells (200–2000 fluorescence units). In run #2, however, the expression of PODXL in the population was downregulated more rapidly between day 10 and day 14, with further decreases to day 21. The heterogeneous population seen at day 14 in run #1, but not in run #2, indicates that PODXL expression decreased more quickly in run #2; suggesting that differentiation progressed more rapidly in run #2. These differences were more clearly reflected by the nMFI than the %Pos. The %Pos for both runs began to drop steadily only after day 10, with run #2 progressing slightly faster after that. The nMFI, however, illustrated the faster differentiation rate of run #2 and the clear shift in the cell population between day 10 and day 14 (drop in nMFI from 80 to <10) followed by a steady shift to day 21. The nMFI was also able to show the subtle differences (day 10) and similarities (day 17 and day 21) between the two runs more clearly. At day 10, the majority of the population in run #1 expressed the mAb 84 marker less than the population of run #2 as seen in the histogram and the nMFI (36.14 vs. 82.68), but not by the %Pos (97.2% vs. 98.7%) (Fig. 5A, arrow). At day 17 and day 21, however, the two populations were very similar, as shown by the histograms and the nMFI (2.99 vs. 2.81 at day 17, 1.69 vs. 1.75 at day 21), but %Pos only showed partial similarity (55.0% vs. 41.0% at day 17, 18.9% vs. 23.0% at day 21) (Fig. 5A, bracket). As such, a comparison of two differentiation runs was more accurate when done using the nMFI as compared to the %Pos.
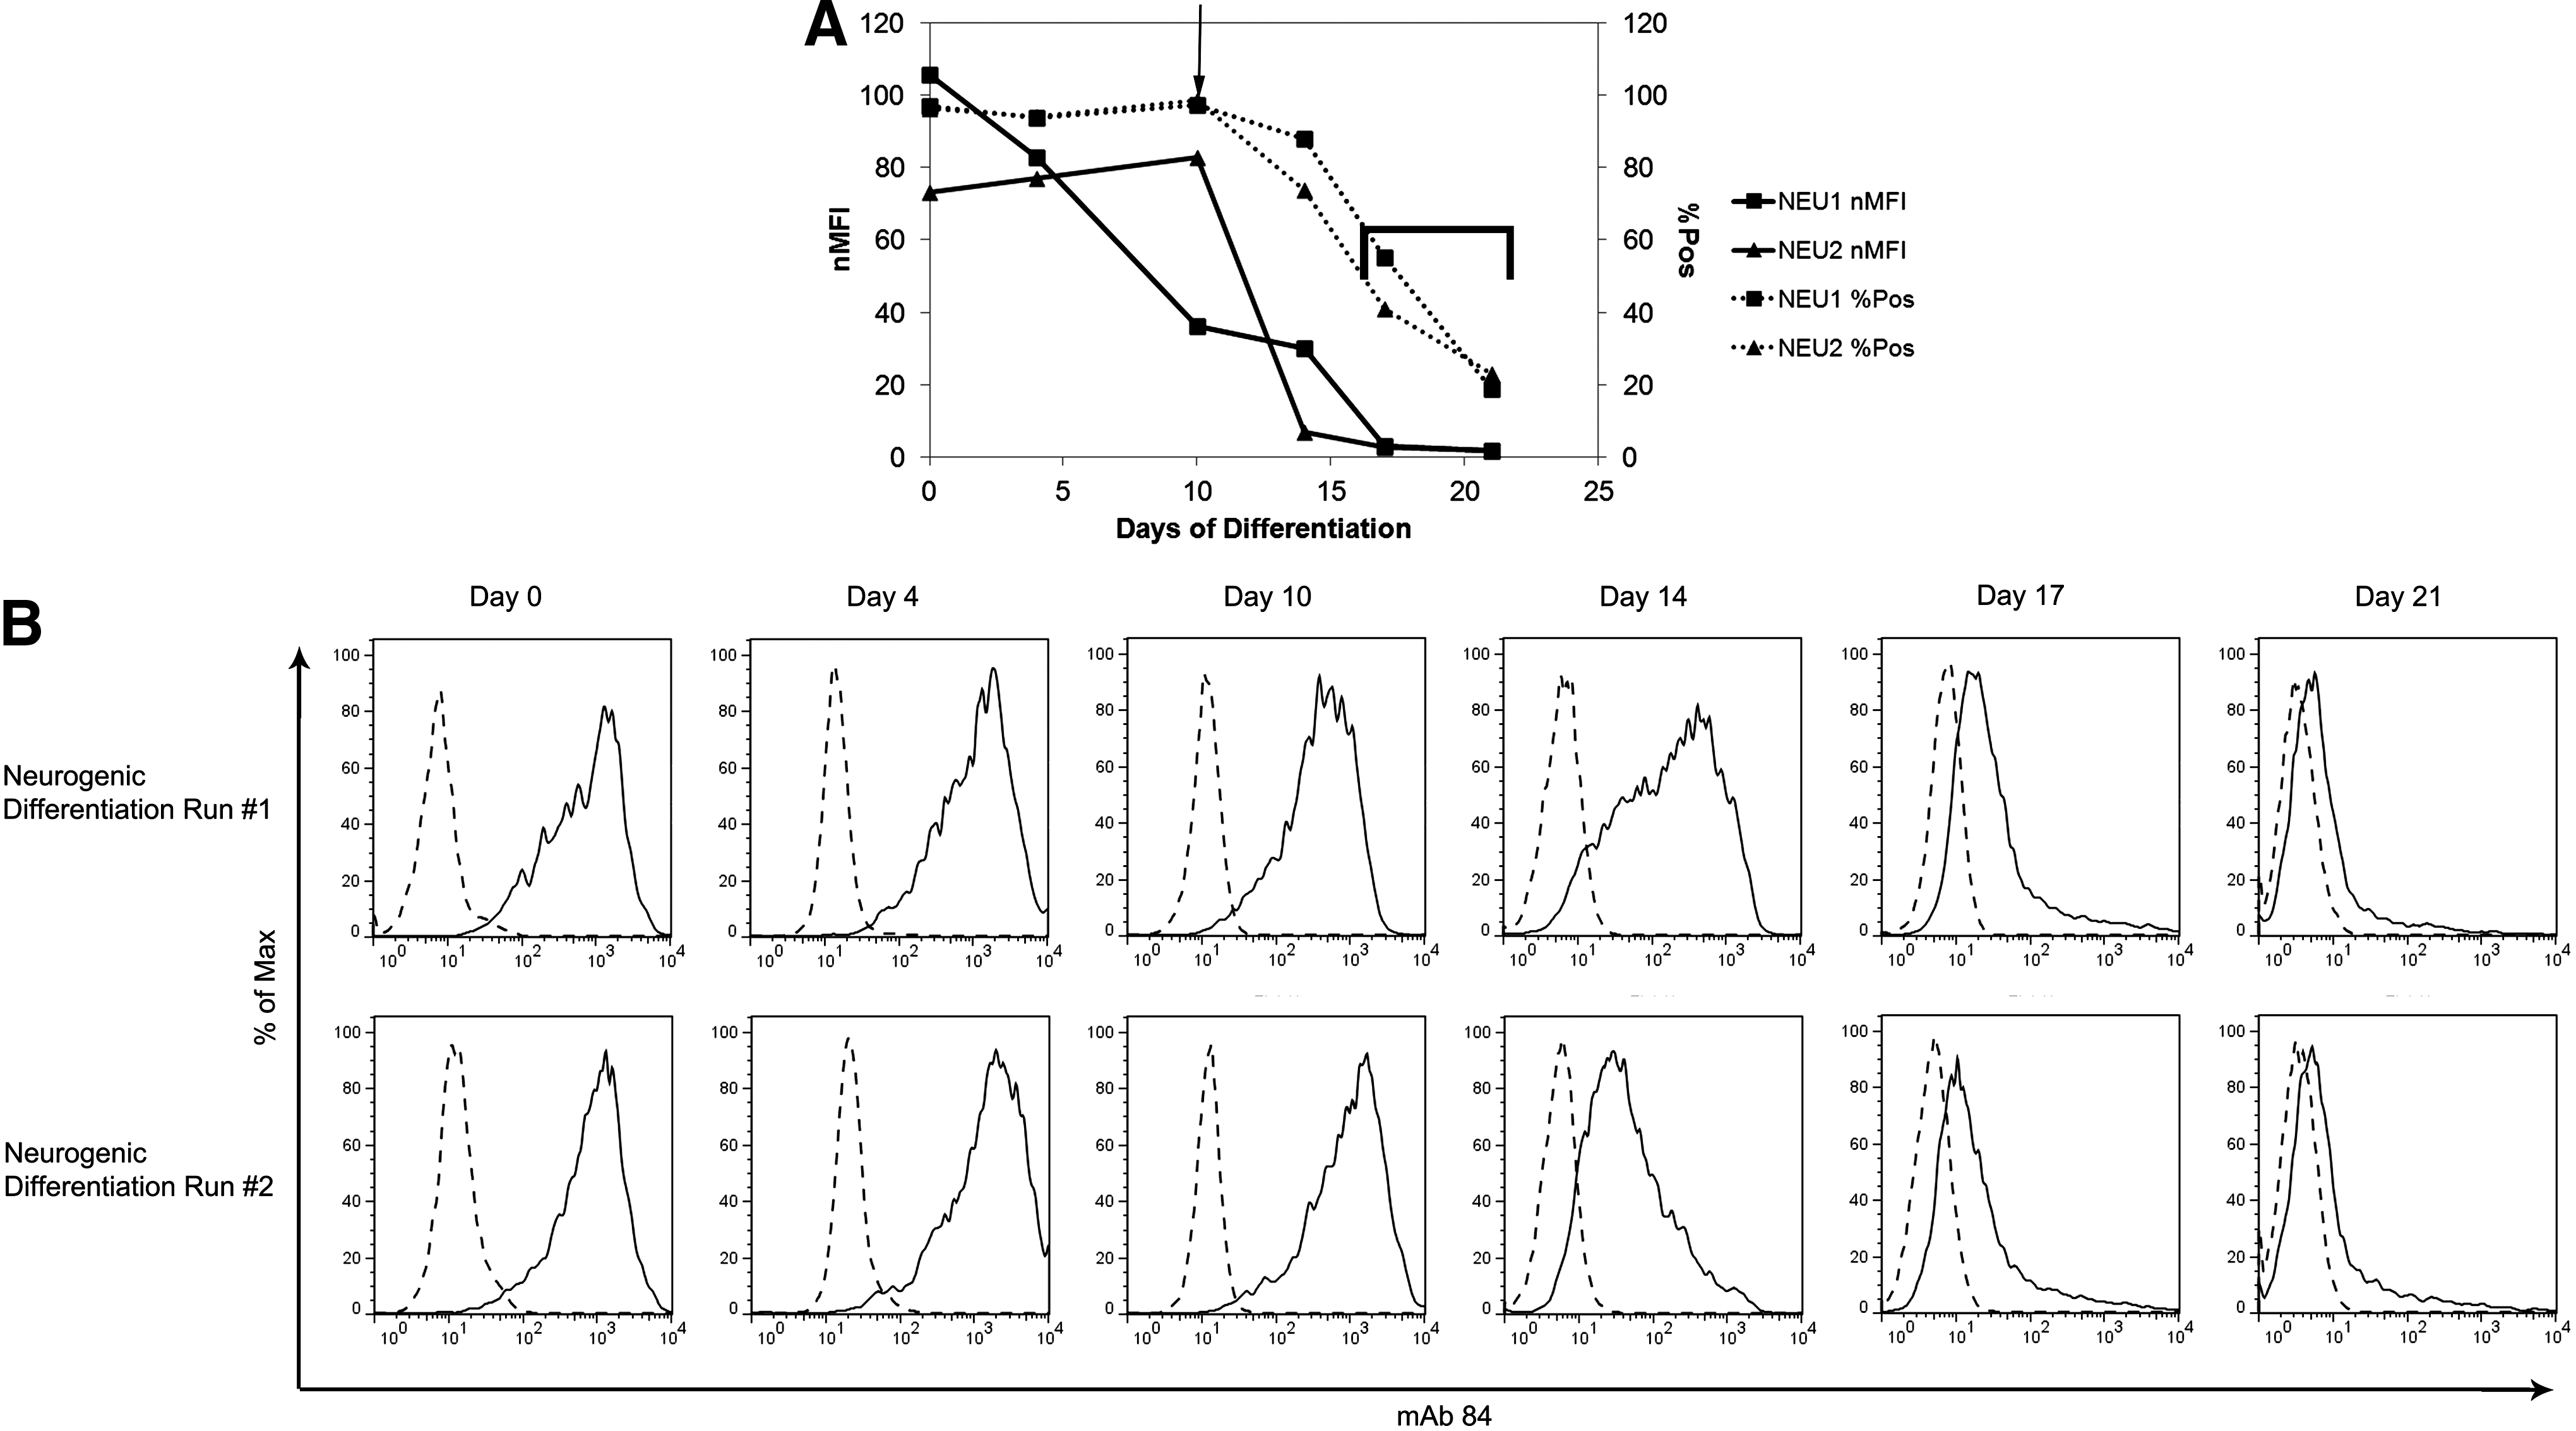
Comparison of nMFI and %Pos tracking mAb 84 expression during two runs of neurogenic differentiation. As hESC were differentiated into neuroprogenitor cells, mAb 84 expression change was tracked by flow cytometry. The differences between the two differentiation runs are clearly visible, but the differences are only noted by the nMFI and not by %Pos.
Discussion
By tracking changes in marker expression during chondrogenic, neurogenic, and hepatic differentiation, we have shown that flow cytometry analysis using the MFI is a more sensitive and reliable method as compared to the conventional percentage gating strategy. The reporting term, nMFI, uses a single point of reference to summarize the data, and thus is more sensitive to changes in the marker expression within the population. This sensitivity is lost in %Pos because it accounts for the number of events within a range of fluorescence intensities, and thus is unable to accurately capture subtle differences within the range. The nMFI also proves to be more reliable than %Pos because it is less vulnerable to skewing by outliers both within the negative control and the sample. These outliers often result in %Pos indicating a change when none has occurred or a false drop in expression due to a highly right-shifted gate.
With markers that demarcate distinct subpopulations (e.g., contains both high and low populations or expressing and nonexpressing, see SSEA1 staining at day 10 in Supplementary Fig. S6), this method must be modified. While the nMFI is still able to track the shift of cells from the expressing population to the nonexpressing population, individual gates over each subpopulation is a more effective gauge. Once the subpopulations are gated, the nMFI of each population can be calculated. Another alternative is to utilize fixed nMFI values to set the starting and ending points of the individual subpopulation gates. However, it should be noted that during bulk population analysis, the nMFI remains superior to %Pos.
hESC cultures are heterogeneous, containing both cells that have begun differentiation along various paths, as well as those that are in different substates of pluripotency.12–16 As such, the pluripotent state of hESCs is often verified at the beginning of a differentiation experiment by determining the expression of pluripotent markers, such as Tra-1-60, Oct-4, PODXL, or SSEA3/4. A general standard requires that >90% of the hESC culture must express the pluripotent markers. However, as we have shown (Fig. 3), %Pos is not the most accurate method for judging a starting population. Rather, we demonstrate that the nMFI analysis is a better indicator of the hESC starting population, and potentially also of the cell state and substate of our culture. Niwa et al. and Rodriguez et al. have both indicated that small fluctuations in the expression of the transcription factor Oct-3/4 (POU5F1) will result in a change of stem cell fate in both mice 17 and humans, 8 respectively. In mice, the repression of Oct-3/4 expression resulted in the loss of pluripotency and the dedifferentiation into the trophectoderm lineage, whereas the overexpression of Oct-3/4 resulted in the differentiation to primitive mesoderm and endoderm. In humans, the repression of Oct-3/4 resulted in the upregulation of mesoderm and endoderm differentiation markers, whereas the overexpression of Oct-3/4 resulted in the upregulation of endoderm derivative markers. Both of these studies focused primarily on the gene expression level and did not quantify the protein level. This technique would therefore enable the quantitative determination of the Oct-3/4 protein levels required for a cell to maintain pluripotency or to differentiate into a particular lineage. Studies by Draper et al. and Tonge et al. have indicated that expression of proteins associated with pluripotency fluctuate within the heterogeneous stem cell population, but pluripotency is maintained as long as the expression remains above an unknown threshold.18–20 In the past several years, studies have demonstrated that subpopulations exist within the pluripotent state. Laslett and coworkers were the first to suggest that subpopulations exist within the hESC population and represent different states of lineage commitment by demonstrating the concurrent expression of genes associated with pluripotency and lineage transcription factors. 14 The existence of subpopulations was evidenced by Hough et al., who isolated four subpopulations based on the expression levels of surface markers, GCTM2 and CD9, and demonstrated that each subpopulation has a unique gene expression profile of pluripotency and lineage-specific genes. 12 Interestingly, these subpopulations were also able to recapitulate the full hESC population. Tonge et al. recently demonstrated that subpopulations based on the expression level of SSEA3 (high, low, and negative) were functionally different. 20 After sorting, these subpopulations were able to generate both undifferentiated colonies in hESC maintenance conditions, and neural cells in neuralising media; however, each subpopulation responded to the differentiation cues differently and produced different types of cells along different timelines. These two studies highlight that cells expressing different levels of protein may be genetically different and functionally different, and emphasize the potential importance of using the nMFI to more accurately determine the cell state. Tonge et al. also concluded that there must be a differentiation threshold that can be related back to SSEA3 expression; however, the authors were unable to pinpoint where this threshold is. We believe that our method will allow researchers to determine, where this differentiation threshold is based on a combination of pluripotency markers, such as Oct-3/4, SSEA3, or PODXL. By elucidating the threshold and ranges of protein expression, one would be able to better judge the quality of a cell population before beginning differentiation, thus improving the efficacy of differentiation greatly. Our method could also be applied to determining ranges of markers to identify a specific differentiated state. Thus, we could better judge the efficiency of a differentiation protocol by monitoring how adjustments can induce a specific differentiation stage to occur earlier and whether the yield will be greater.
Conclusion
Our study has shown the efficacy of analyzing flow cytometry data by the MFI, and the utility of the nMFI as the reporting term. We have shown that the nMFI improves the ability to verify the quality of the starting cell population, to track differentiation for protocol optimization, and to compare cell populations, as compared to %Pos, the term derived from a bulk gating strategy. The increased accuracy of the nMFI is due to its robustness against outliers and consideration of all points rather than amalgamating them together. Thus, the use of the nMFI as a reporting term will provide a more precise analysis of flow cytometry data.
Footnotes
Acknowledgments
We thank the Agency for Science Technology and Research (A*STAR), Singapore for generously funding this project. Special thanks to Dr. Vanessa Ding, Dr. Tan Heng Liang, Angela Chin, and Jayanthi Padmanabhan for their helpful advice. Lesley Y Chan would like to thank the National University of Singapore Graduate School for Integrative Sciences and Engineering for her scholarship.
Disclosure Statement
No competing financial interests exist.
References
Supplementary Material
Please find the following supplemental material available below.
For Open Access articles published under a Creative Commons License, all supplemental material carries the same license as the article it is associated with.
For non-Open Access articles published, all supplemental material carries a non-exclusive license, and permission requests for re-use of supplemental material or any part of supplemental material shall be sent directly to the copyright owner as specified in the copyright notice associated with the article.