




Abstract
As tissue engineering products move toward the clinic, nondestructive methods to monitor their development and ensure quality are needed. In this study, high-resolution spectral ultrasound imaging (SUSI) was used to noninvasively characterize mineral content in collagen hydrogels. SUSI was used to generate three-dimensional (3D) grayscale (GS) images of construct morphology with submillimeter resolution. Spectral analysis of the backscattered radio frequency (RF) ultrasound signals was used to determine the midband fit (MBF) and slope of the linearized RF spectrum. These parameters are operator and instrument independent, and were used to characterize the spatial distribution of mineral in constructs supplemented with hydroxyapatite particles. GS and MBF correlated closely with mineral content, while slope was not dependent on concentration. SUSI also was used to monitor mineralization of collagen constructs by immersion in simulated body fluid (SBF) over 21 days. The construct surface was mineralized before the interior, and there was a dose-dependent effect of SBF concentration on degree of mineralization and deposited particle size. MBF density was closely correlated with the amount of calcium deposited. These data demonstrate that SUSI has utility as a noninvasive imaging method for quantitative analysis of mineralization in 3D protein constructs. Such techniques may assist the development of engineered orthopedic tissues.
Introduction
Ultrasound imaging has shown promise for rapid and nondestructive imaging in tissue engineering. In particular, conventional ultrasound has been used to characterize the evolution of tissue components and corresponding changes in tissue properties in a variety of systems, as summarized in Table 1. For example, attenuation of grayscale (B-mode) ultrasound signals over time has been shown to correlate with matrix deposition and differentiation of adipose stem cells on synthetic scaffolds. 2 Similarly, grayscale signals have been used to assess collagen production by myofibroblasts in 3D fibrin matrices over time, 3 as well as proliferation of bone marrow stromal cells in β-tricalcium phosphate scaffolds. 4 Acoustic parameters have also been correlated to the mechanical properties and cartilage matrix evolution by chondrocytes in polyethylene glycol hydrogels 5 and have been used to characterize the mechanical properties of agarose hydrogels as they develop over time. 6
HA, hydroxyapatite; SBF, simulated body fluid; MBF, midband fit; PLGA, poly(lactide-co-glycolide); PEG, poly(ethylene glycol).
Conventional B-mode ultrasound imaging is based purely on grayscale values and is able to provide spatial and temporal information about sample morphology. However, it provides little direct information about sample composition. A key drawback of purely grayscale analysis is that the image signal is dependent on a variety of factors, including ultrasound transducer response and image postprocessing. The results are therefore operator and system dependent, and it is difficult to compare data taken on different imaging systems or at different times in an objective and meaningful fashion.
In contrast, spectral ultrasound imaging (SUSI) utilizes unprocessed, raw backscattered radio frequency (RF) signals. In this approach, the power spectra of the RF signals from a region of interest are computed and calibrated to remove system input and output effects. Because the resulting spectra are often quasi-linear over the bandwidth used in typical ultrasound imaging, linear regression can be performed to obtain a relatively small set of parameters from the calibrated spectra. These parameters include the slope and intercept of the regression line, as well as the midband fit (MBF), which is the value of the linear function at the midpoint of the usable bandwidth. This analysis produces instrument-independent parameters that can greatly facilitate comparison of data between studies and time points, and which permit tissue characterization in an absolute and standardized manner. 7 It has been shown theoretically that these spectral parameters are related to tissue microstructural properties. 8 In particular, the slope provides information on the effective size of acoustic scatterers, and the MBF provides information on the concentration, size, and relative acoustic impedances of scattering particles in the sample. These parameters have also proven to be effective for identifying changes in tissue state for prostate, breast, and other cancer tissues9–12 as well as intravascular plaque.13,14 In a similar manner, spectral analysis may therefore have utility in more fully characterizing the composition of engineered tissues.
In the present study, high-resolution SUSI was applied to a model engineered construct that mimics a mineralized tissue. We evaluated the ability of SUSI to determine the distribution of mineral in a 3D collagen gel that was loaded with hydroxyapatite (HA) particles, to discriminate between different grades of HA, and to quantify particle distribution in the protein hydrogels. We also induced exogenous mineralization of pure collagen gels to assess the ability of SUSI to monitor changes in the constructs over time, and correlated spectral parameters with the concentration of mineral in the constructs. Our goal was to evaluate the utility of spectral ultrasound techniques for noninvasively imaging and characterizing mineral-containing protein materials, which may be relevant to orthopedic and other tissue engineering applications.
Materials and Methods
3D collagen hydrogel fabrication
Three-dimensional collagen hydrogels were generated as previously described. 15 Briefly, collagen type I (MP Biomedicals, Solon, OH) was dissolved at 4.0 mg/mL in cold 0.02 N acetic acid overnight. Constructs were created by mixing 10% fetal bovine serum (FBS; Invitrogen, Carlsbad, CA), 10% Dulbecco's modified Eagle's medium (DMEM; Invitrogen), 20% 5×-concentrated DMEM, 10% 0.1 N NaOH (Sigma Aldrich, St. Louis, MO), and 50% collagen stock solution at 4°C for a final collagen concentration of 2.0 mg/mL. The mixture (500 μL) was then injected into a 24-well plate and allowed to gel at 37°C for 45 min.
Addition of HA to 3D hydrogels
Composite collagen–HA hydrogels were fabricated by adding particulate HA directly to the gel mixture. Three types of HA were used, each with a different average particle size: reagent-grade (HA-R; Sigma Aldrich) with a particle size of 590 μm, micro-grade (HA-M; Plasma Biotal Ltd., North Derbyshire, United Kingdom) with a particle size of 5 μm, and nano-grade (HA-N; Sigma Aldrich) with a particle size of <200 nm. A stock HA solution of 200 mg/mL HA in DMEM was prepared and autoclaved at 120°C for 20 min to achieve sterility. Collagen–HA hydrogels were fabricated at 10.0 mg/mL by mixing cold 5% HA stock solution, 5% DMEM, 10% FBS, 20% 5×-concentrated DMEM, 10% 0.1 N NaOH, and 50% collagen stock, and then initiating gelation by raising the temperature to 37°C. Constructs with higher and lower concentrations of HA (5.0 mg/mL and 20.0 mg/mL) were prepared by correspondingly changing the amount of HA stock solution used.
For dispersion studies, HA stock solution and DMEM (10% of final gel) were mixed at 4°C and placed in a sonication water bath (Branson Ultrasonics, Danbury, CT) for 1 h to disrupt particle aggregates. The HA–DMEM mixture was then added immediately to the collagen pregel mixture and gelation was initiated as previously described.
Mineralization in simulated body fluid
Simulated body fluid (SBF) was prepared as previously described. 16 The standard (1×) mineralizing solution has final ion concentrations of 141 mM NaCl, 4.0 mM KCl, 2.5 mM CaCl2·H2O, 1.0 mM MgCl2, 4.2 mM NaHCO3, 0.5 mM MgSO4, and 1.0 mM KH2PO4 (Sigma Aldrich). For this study, SBF solutions of higher-fold concentrations (2.5×and 5×) were prepared by increasing the concentrations of each reagent by the appropriate factor. Collagen hydrogels were fabricated as described previously and were incubated at 37°C in 3.0 mL of either phosphate-buffered saline (PBS), 2.5×SBF, or 5×SBF. The medium was replenished with fresh stock twice a day. Samples were imaged at days 3, 7, 10, 14, and 21.
Imaging and data acquisition
Figure 1 shows a schematic diagram of the imaging setup that included a 90-mm-diameter Petri dish filled with PBS at room temperature. Collagen constructs were placed on top of an agar gel pad, which reduced signal reflection from the bottom of the dish. Ultrasound imaging was performed with a Vevo 770 instrument (VisualSonics, Inc., Toronto, Canada) using an RMV 708 imaging probe with a nominal 55 MHz center frequency, 20–75 MHz bandwidth (−6 dB), 4.5 mm focal distance, and 1.5 mm depth of focus (−6 dB). Three-dimensional backscattered RF data from the tissue construct were collected at either 100% or 10% scanner power and 420 MS/s by performing multiple B-mode scans using an automatic 3D translational controller. The interval between adjacent A-lines and B-mode scans was 31 μm and 64 μm, respectively. After each RF acquisition of a construct, a reference RF acquisition of the setup without the construct was collected. This approach allowed the acquisition of operator-independent data and provided objective measures of each parameter.

Schematic of experimental setup used for spectral ultrasound imaging of tissue construct.
Ultrasound data analysis
Grayscale
Each A-line signal acquired as 3D RF data was Hilbert transformed to obtain the complex analytic signal p(y,z). The conventional B-scan image is generally constructed using the logarithmic amplitude envelope of this signal, log10|p(y,z)|. For quantitative analysis, the grayscale (GS) parameter (in mV) used in this study was the absolute value of the complex analytic signal, while the logarithm of the absolute value was used to create GS images:
The time of travel of the ultrasound pulse to the construct's top surface (ttop) bottom surface (tbottom), and to the agar gel pad
Spectral parameters and parametric images
The power spectrum of each RF A-scan signal was calculated by taking the Fast Fourier Transform (FFT) of the data gated by a series of sliding Hamming windows of 0.2 μs, each offset by 0.1 μs. To remove artifacts associated with the transfer function of the ultrasound system, a calibrated power spectrum was generated by dividing the tissue power spectrum by the calibration spectrum, which was the power spectrum of the RF signal from the reflection of the imaging pulse from the interface of deionized water and phenylated silicone oil (Dow Corning 710, Midland, MI). 17 The calibrated power spectrum was processed by linear regression to find the spectral parameters, that is, the slope and the MBF of the −15 dB bandwidth.
To better represent the spatial distribution of spectral features of the construct on the GS B-mode images, we constructed parametric images by marking each pixel with a color that corresponded to the values of the spectral parameter. The density of each of the analysis parameters was calculated as follows:
where X is either GS or spectral parameters evaluated for a selected volume (V) of the tissue construct. Ultrasound backscattering from pure collagen constructs (without mineral) was very low and its mean GS value within a 0.1 μs time window was very close to that of liquid medium alone, as expected. A threshold GS value based on pure collagen constructs was used to assist in identifying regions of the constructs that lacked mineral.
Calcium quantification
The amount of calcium deposited in collagen hydrogels after incubation in PBS, 2.5×SBF, and 5×SBF was quantified at days 3, 7, 10, 14, and 21 using an orthocresolphthalein complex-one (OCPC) method. 18 Calcium content correlates to mineral deposition. Collagen gels were washed in PBS and digested in 0.5 mL of 1.0 N acetic acid overnight. About 10.0 μL of the dissolved solution was then incubated for 10 min at room temperature with 300 μL of a working solution consisting of 0.05 mg/mL of OCPC solution and ethanolamine/boric acid/8-hydroxyquinoline buffer (Sigma Aldrich). Samples were read spectrophotometrically at 575 nm. Calcium values were quantified by comparison to a standard curve prepared over a range of 0–100 μg/mL. Samples were diluted 100-fold or as necessary to obtain readings within the linear portion of the calibration curve.
Statistical analysis
Four separate constructs were used for each biochemical and imaging assay. Aggregated SUSI data were collected from a 0.5 mm×5.0 mm×thickness (∼2 mm) volume of each construct and the data are presented as mean±standard deviation. Statistical comparisons between parameters were made using Student's t-test for paired samples and the differences were considered significant at a level of p<0.05.
Results
Virtual histology
The setup used in this study allowed rapid and noninvasive 3D imaging of collagen constructs while still in incubating culture medium. Image acquisition was completed in a few seconds at a frame rate of 45 Hz, and saving of the raw RF data required 2–3 min. In the present study, construct boundaries were determined manually based on GS thresholding, though this process could be automated and accelerated in the future. Overall, analysis of each construct using SUSI required about 5–10 min.
Figure 2 shows a representative example of ultrasound imaging and analysis output from a collagen hydrogel containing HA-N mineral (Fig. 2A–F), as well as a “control” construct of pure collagen (Fig. 2G–L). The photographs of the construct (Fig. 2A, G) show a top view (xy-plane) and the region that was imaged is indicated by the dotted rectangle. The 3D volume-rendered ultrasound images (Fig. 2B, H) show the overall dimension and morphology of the construct. This digital reconstruction can be rotated and/or sectioned to provide any desired viewing prospective. Figure 2C is an image in the xy-plane at a defined depth (known as a C-scan) of the 3D of the HA-N construct, and shows homogeneous speckles indicative of uniform spatial distribution of mineral in the construct. Similarly, a GS image in an xz-plane of the HA-N construct (Fig. 2D) shows a mainly homogeneous distribution of mineral in the lateral (x) and depth (z) directions, as well as evidence of mineral settling at the bottom of the construct. The corresponding MBF image of the calibrated RF power spectrum (Fig. 2E), which is related to scatterer radius and concentration in the construct, shows an increasing concentration of scatterer toward the bottom of the HA-N construct. In contrast, the slope parameter (Fig. 2F), which varies inversely with scatterer radius, is relatively homogeneous in the bulk of the HA-N construct but decreases near the bottom of the construct, indicating settling of larger particles or cluster formation by the mineral. The corresponding rendered and RF spectrum images for the control construct (Fig. 2H–L) show very little signal, demonstrating that SUSI can discriminate between mineral-containing and pure collagen materials.
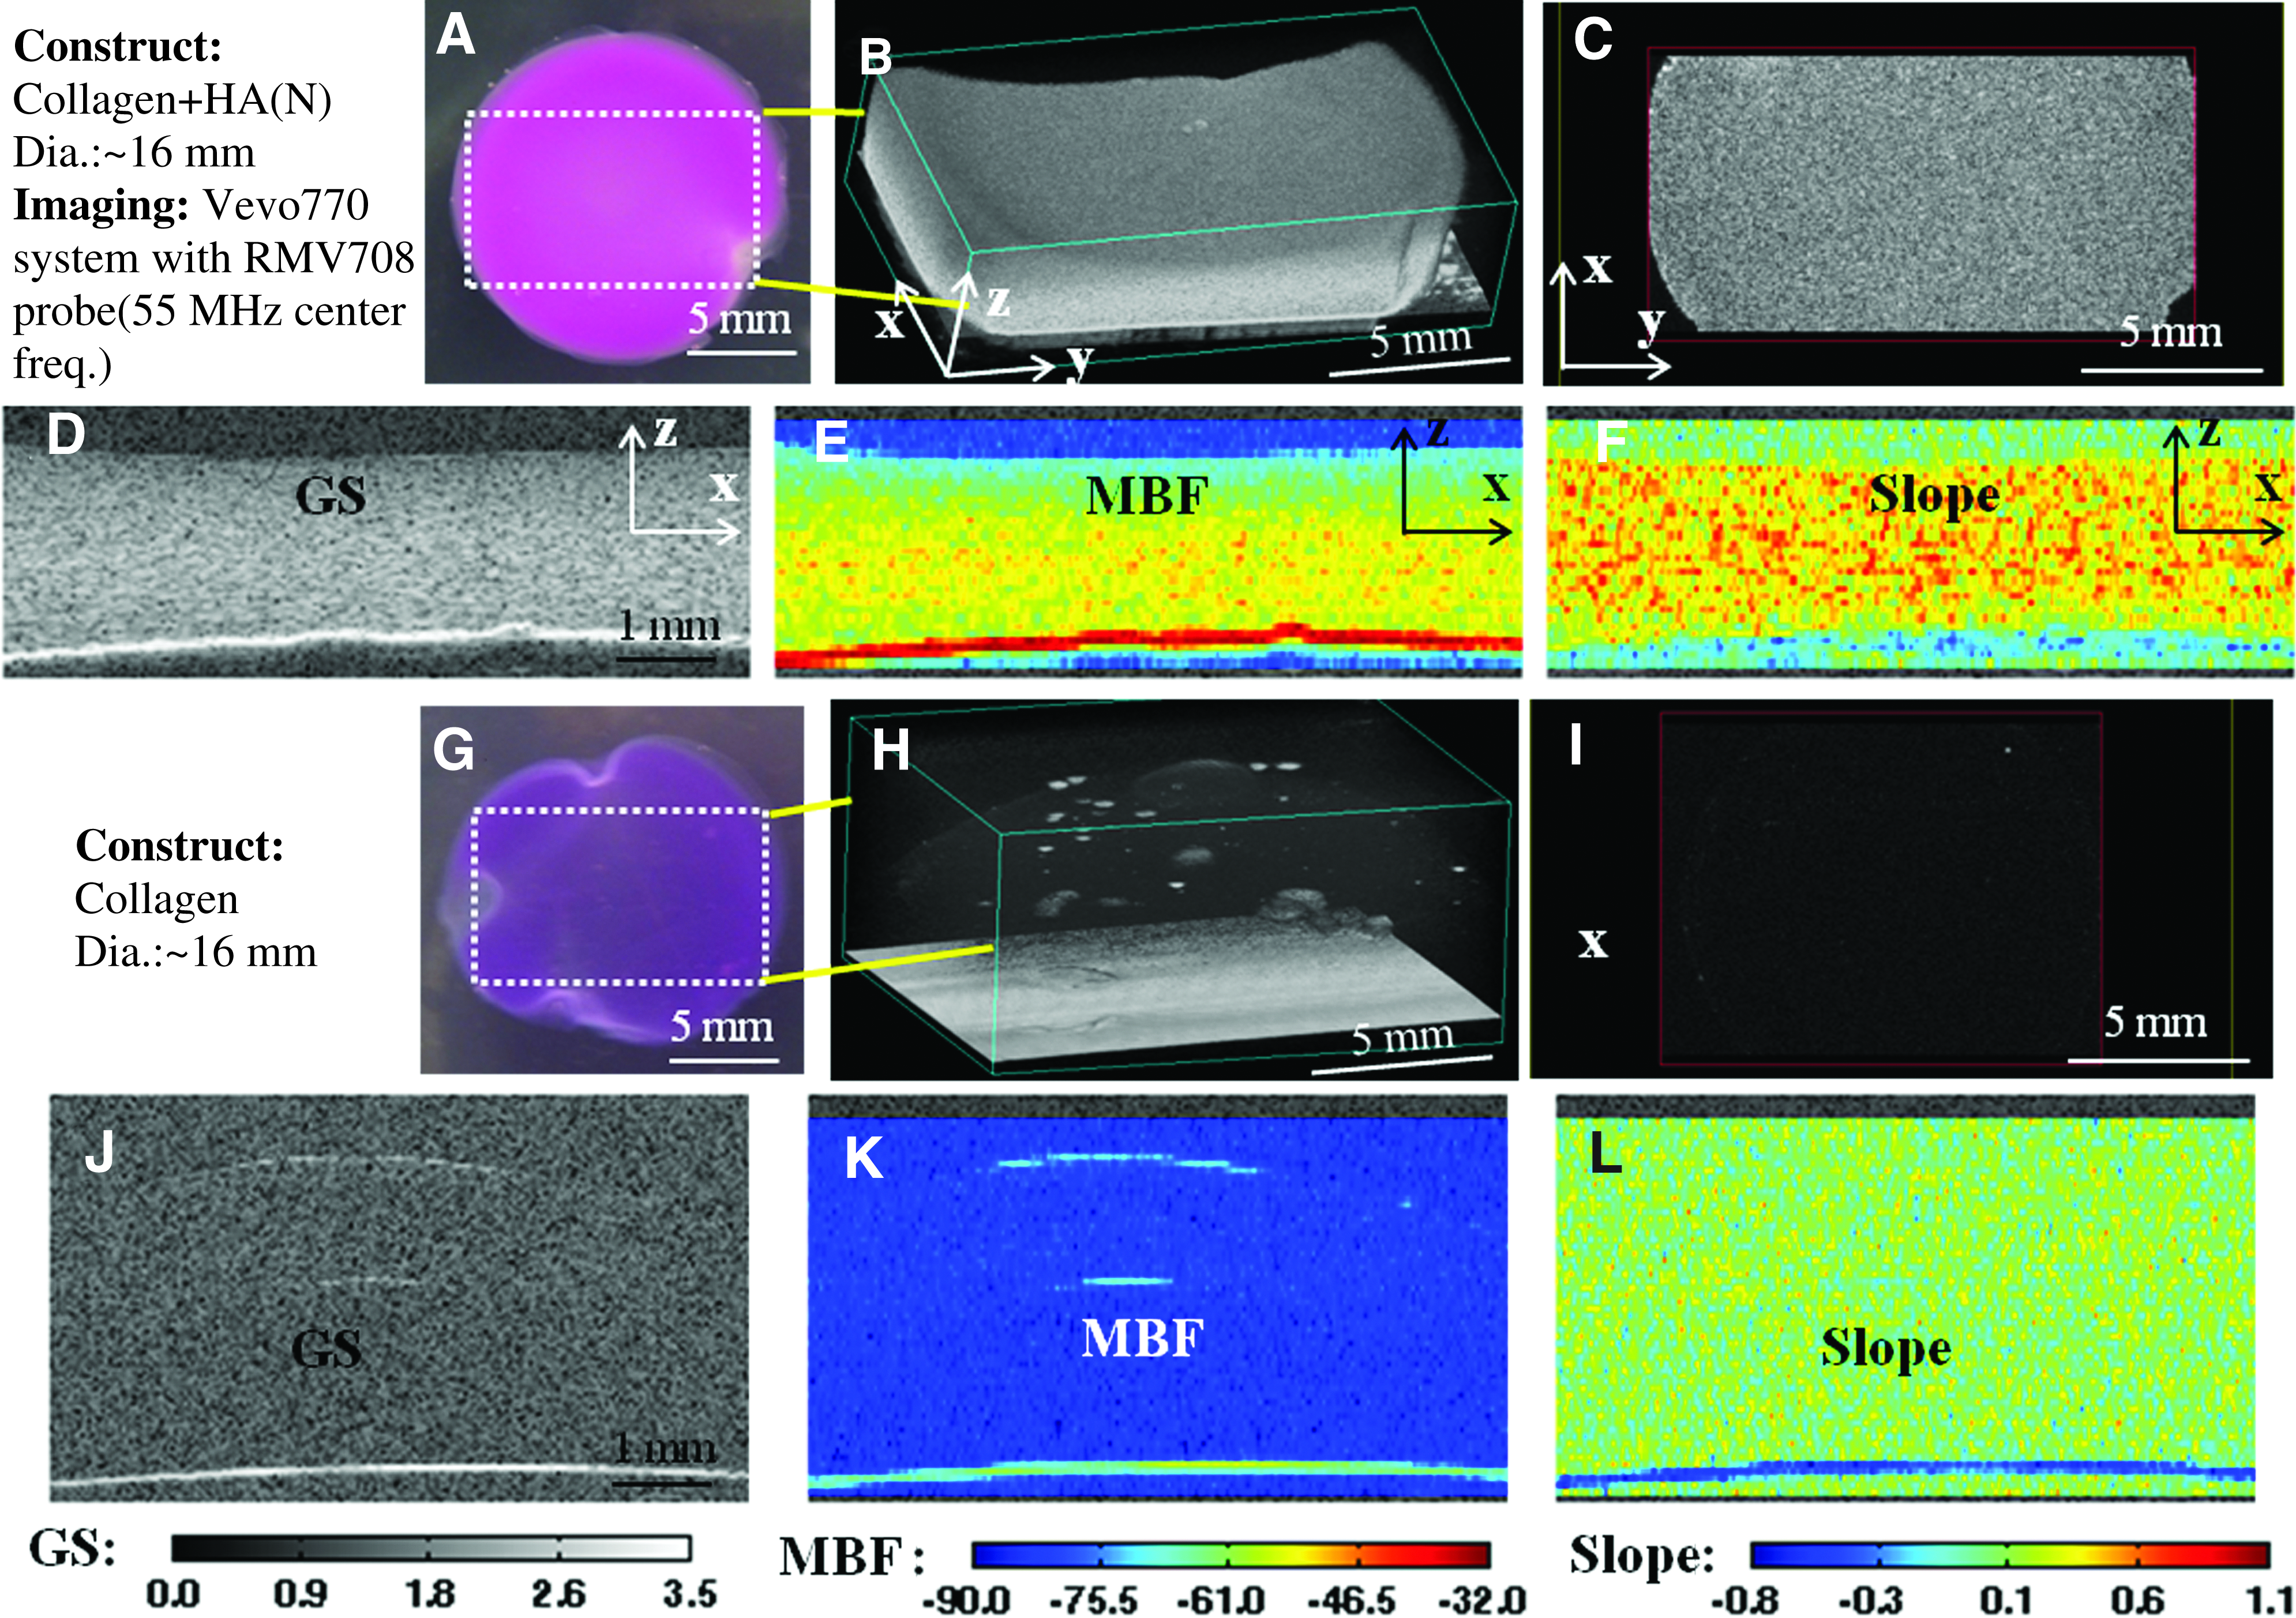
Virtual histology of 3D collagen constructs. Panels
Imaging and analysis of HA content, characteristics, and spatial distribution
To further demonstrate the ability of spectral ultrasound to determine mineral distribution and particle size in engineered tissues, three different types of HA mineral were added to collagen hydrogels at a concentration of 10.0 mg/mL. In addition, duplicate sets of each gel type were fabricated in which the HA was first sonicated to improve dispersion in the constructs. Figure 3 shows images of constructs made with each type of HA under both unsonicated (upper panels in each group) and sonicated (lower panels) conditions. The 3D rendered images in the first column of images in Figure 3 clearly show the morphology of each construct. The second and third columns include the sectional GS images with the MBF and slope values mapped over the right half of the images, to show specific information on each construct type. In unsonicated HA-R samples, significant settling of the mineral component was suggested by the very high GS signal near the bottom of the constructs. In addition, the MBF signal was mostly absent in the bulk of HA-R constructs except toward the lower bottom of the construct, since the settled mineral was not included in the MBF analysis because it produced a saturated signal. Sonication clearly improved dispersion of the HA-R mineral. Settling was also observable though less pronounced in the HA-M samples, and to a lesser extent in HA-N samples. The slope values showed the expected size difference between HA-R and HA-M (lower slope values correspond to larger particles), though the difference between HA-M and HA-N was not detected, possibly due to the resolution of the imaging system at this frequency. The effect of sonication on HA-M and HA-N was also less marked, though dispersion was improved by sonication in all cases.

Parametric images of collagen–HA constructs made with three different HA grades: reagent (R), micro (M), and nano (N). Constructs were made either without sonication (top row of panels in each set) or with sonication (bottom row of panels in each set). First Column: 3D rendered image of the construct. Second Column: images of GS (left half of image) and MBF (right half of image) in a representative cross-section. Third Column: images of GS (left half of image) and slope parameter (right half of image) in a representative cross-section. GS, grayscale. Color images available online at
To more systematically quantify the effects of HA type and sonication on mineral dispersion in collagen constructs, a 3D volume of 0.5 mm×5.0 mm×thickness (∼2 mm) was analyzed for each treatment. This provided assessment of data from a larger volume of the constructs (as opposed to a single section, as in Fig. 3). The GS, MBF, and slope parameters are plotted as histograms in Figure 4 and the means and standard deviations of the histogram data are shown in Table 2. The first column of histograms in Figure 4 shows a comparison of the HA types using the unsonicated samples, and subsequent columns compare the unsonicated to the sonicated sample for each HA type. Since all constructs contained the same mass of HA mineral, the higher area under the curve and the higher mean of the GS and MBF data are indicative of more homogeneous distribution of the mineral in the construct, since settled HA was not included in the analysis. The lower mean of the slope for HA-R reflects the larger particle size, though the difference between HA-M and HA-N was not clearly discriminated. Sonication improved the distribution of HA-R significantly and the histogram data suggested better dispersion of HA-M and HA-N as well. The parametric data in Table 2 also reflect and quantify the observations made from the histogram data.

Histogram distributions of spectral parameters for unsonicated (U) and sonicated (S) collagen–HA constructs made with reagent (R), micro- (M), or nano-grade (N) HA. Top row shows grayscale values, middle row shows MBF values, and bottom row shows slope values. First column compares parameters between unsonicated samples. Subsequent columns compare unsonicated and sonicated constructs made with each HA type. Color images available online at
n=4 for each sample type.
GS, grayscale.
As a further validation of the ability of spectral ultrasound to characterize mineral in 3D collagen gels, a set of constructs with increasing HA concentrations (5.0, 10.0, and 20.0 mg/mL) were created. HA-N was used with sonication since these constructs showed the most uniform HA distribution in previous studies. Figure 5 shows 3D renderings as well as GS, MBF, and slope data for these constructs. The intensity of both the GS and MBF signals reflects the increasing HA content, while the slope values remain essentially unchanged. These data reflect that while the amount of HA in the constructs increased, the size of the HA particles remained the same. Figure 6 shows correlations between the density of the GS, MBF, and slope parameters and the amount of HA added to the constructs. These data show a strong linear correlation between HA content and both the GS and MBF parameters. In contrast, the slope parameter was minimally affected by the concentration of HA, as would be expected when the particle size remains constant. The linear regression has a slight negative slope (−0.4°), possibly due to aggregation of mineral particles at higher concentration.

Ultrasound imaging of collagen–HA constructs made with three different concentrations of HA-N with sonication. First column shows 3D rendered images, second column shows GS and superimposed MBF, and third column shows GS and superimposed slope. Rows show the HA-N concentration used to make the constructs. Color images available online at
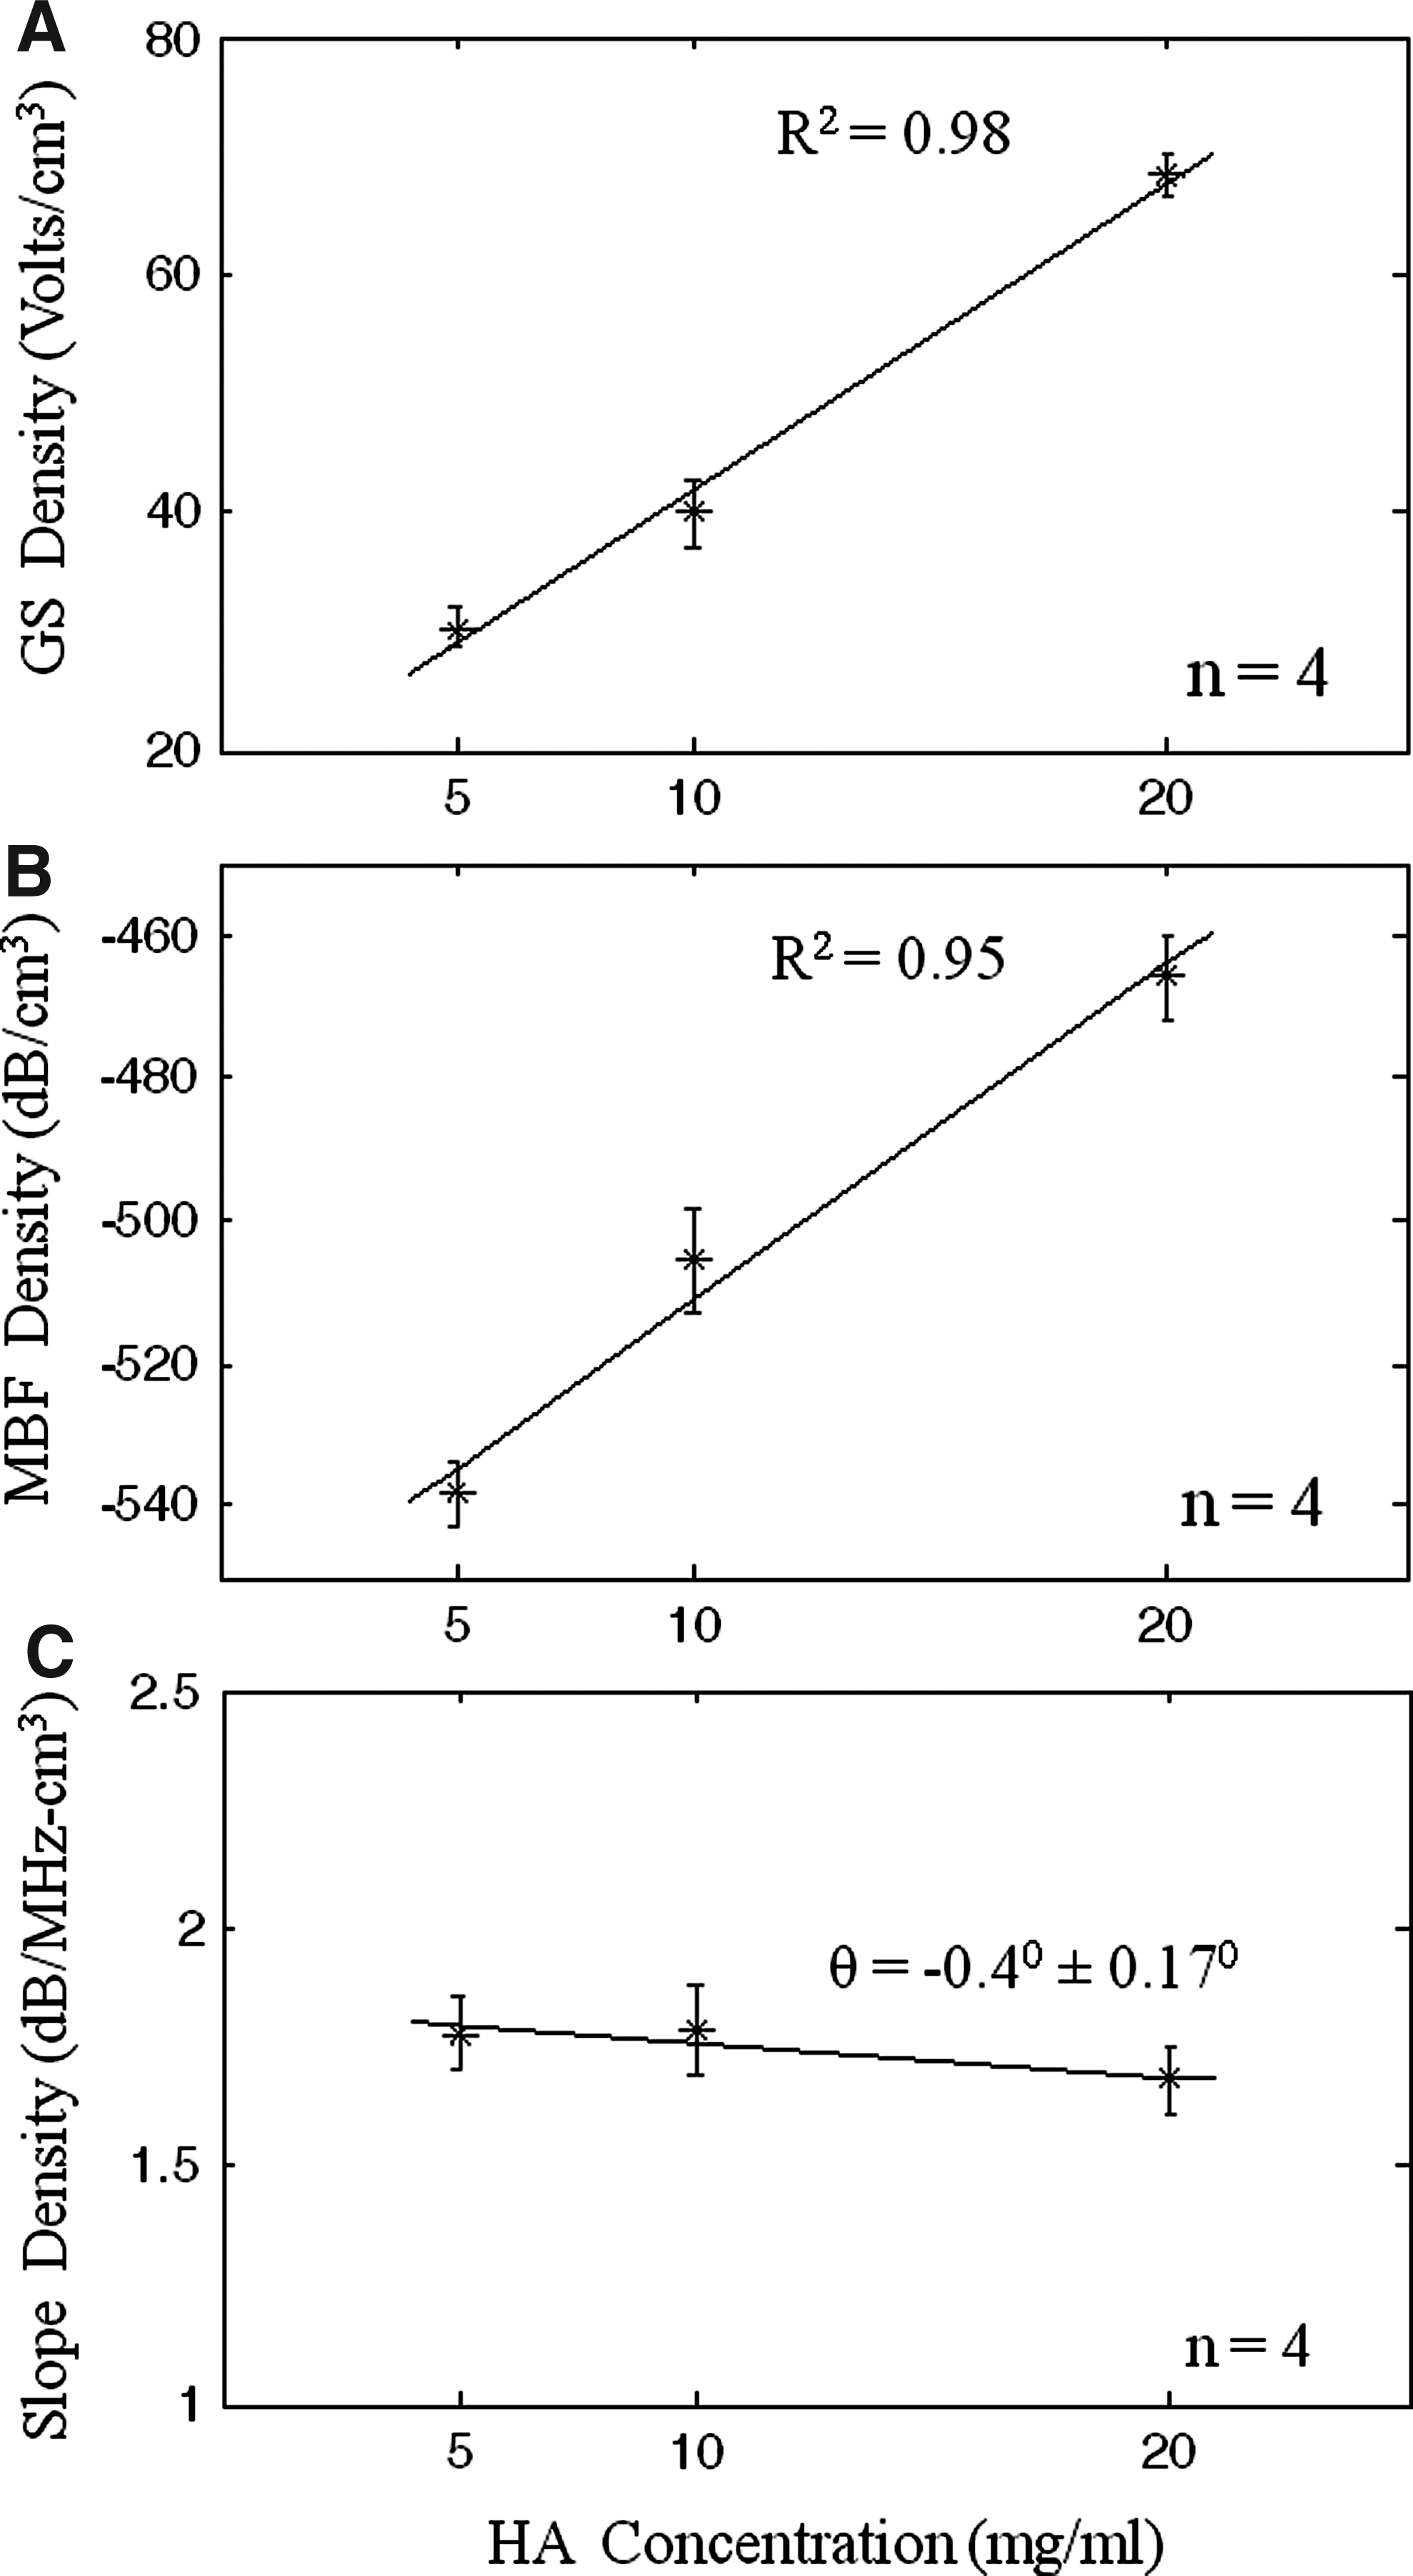
Correlation of sonicated HA-N mineral density with
Imaging and analysis of mineral deposition over time
As an alternative to incorporating a mineral phase at the time of construct fabrication, we also promoted progressive mineral deposition over time by incubating constructs in SBF. Pure collagen constructs incubated in either PBS (control), 2.5×SBF, or 5×SBF for a period of 21 days were imaged at different days and the resulting spectral ultrasound data at day 21 are shown in Figure 7. Constructs incubated in PBS showed low signal levels, indicative of minimal mineral deposition. Constructs incubated in 2.5×SBF showed some mineralization on the surface, although the interior of the material was largely free of mineral. In contrast, the 5×SBF constructs showed robust mineralization and a marked compaction to form a dense and mineral-rich material. The MBF values show the spatial location and the amount of mineral in the constructs, whereas the decreased values of the slope parameter in the 5×constructs suggest that the mineral phase in these constructs was composed of larger particles.
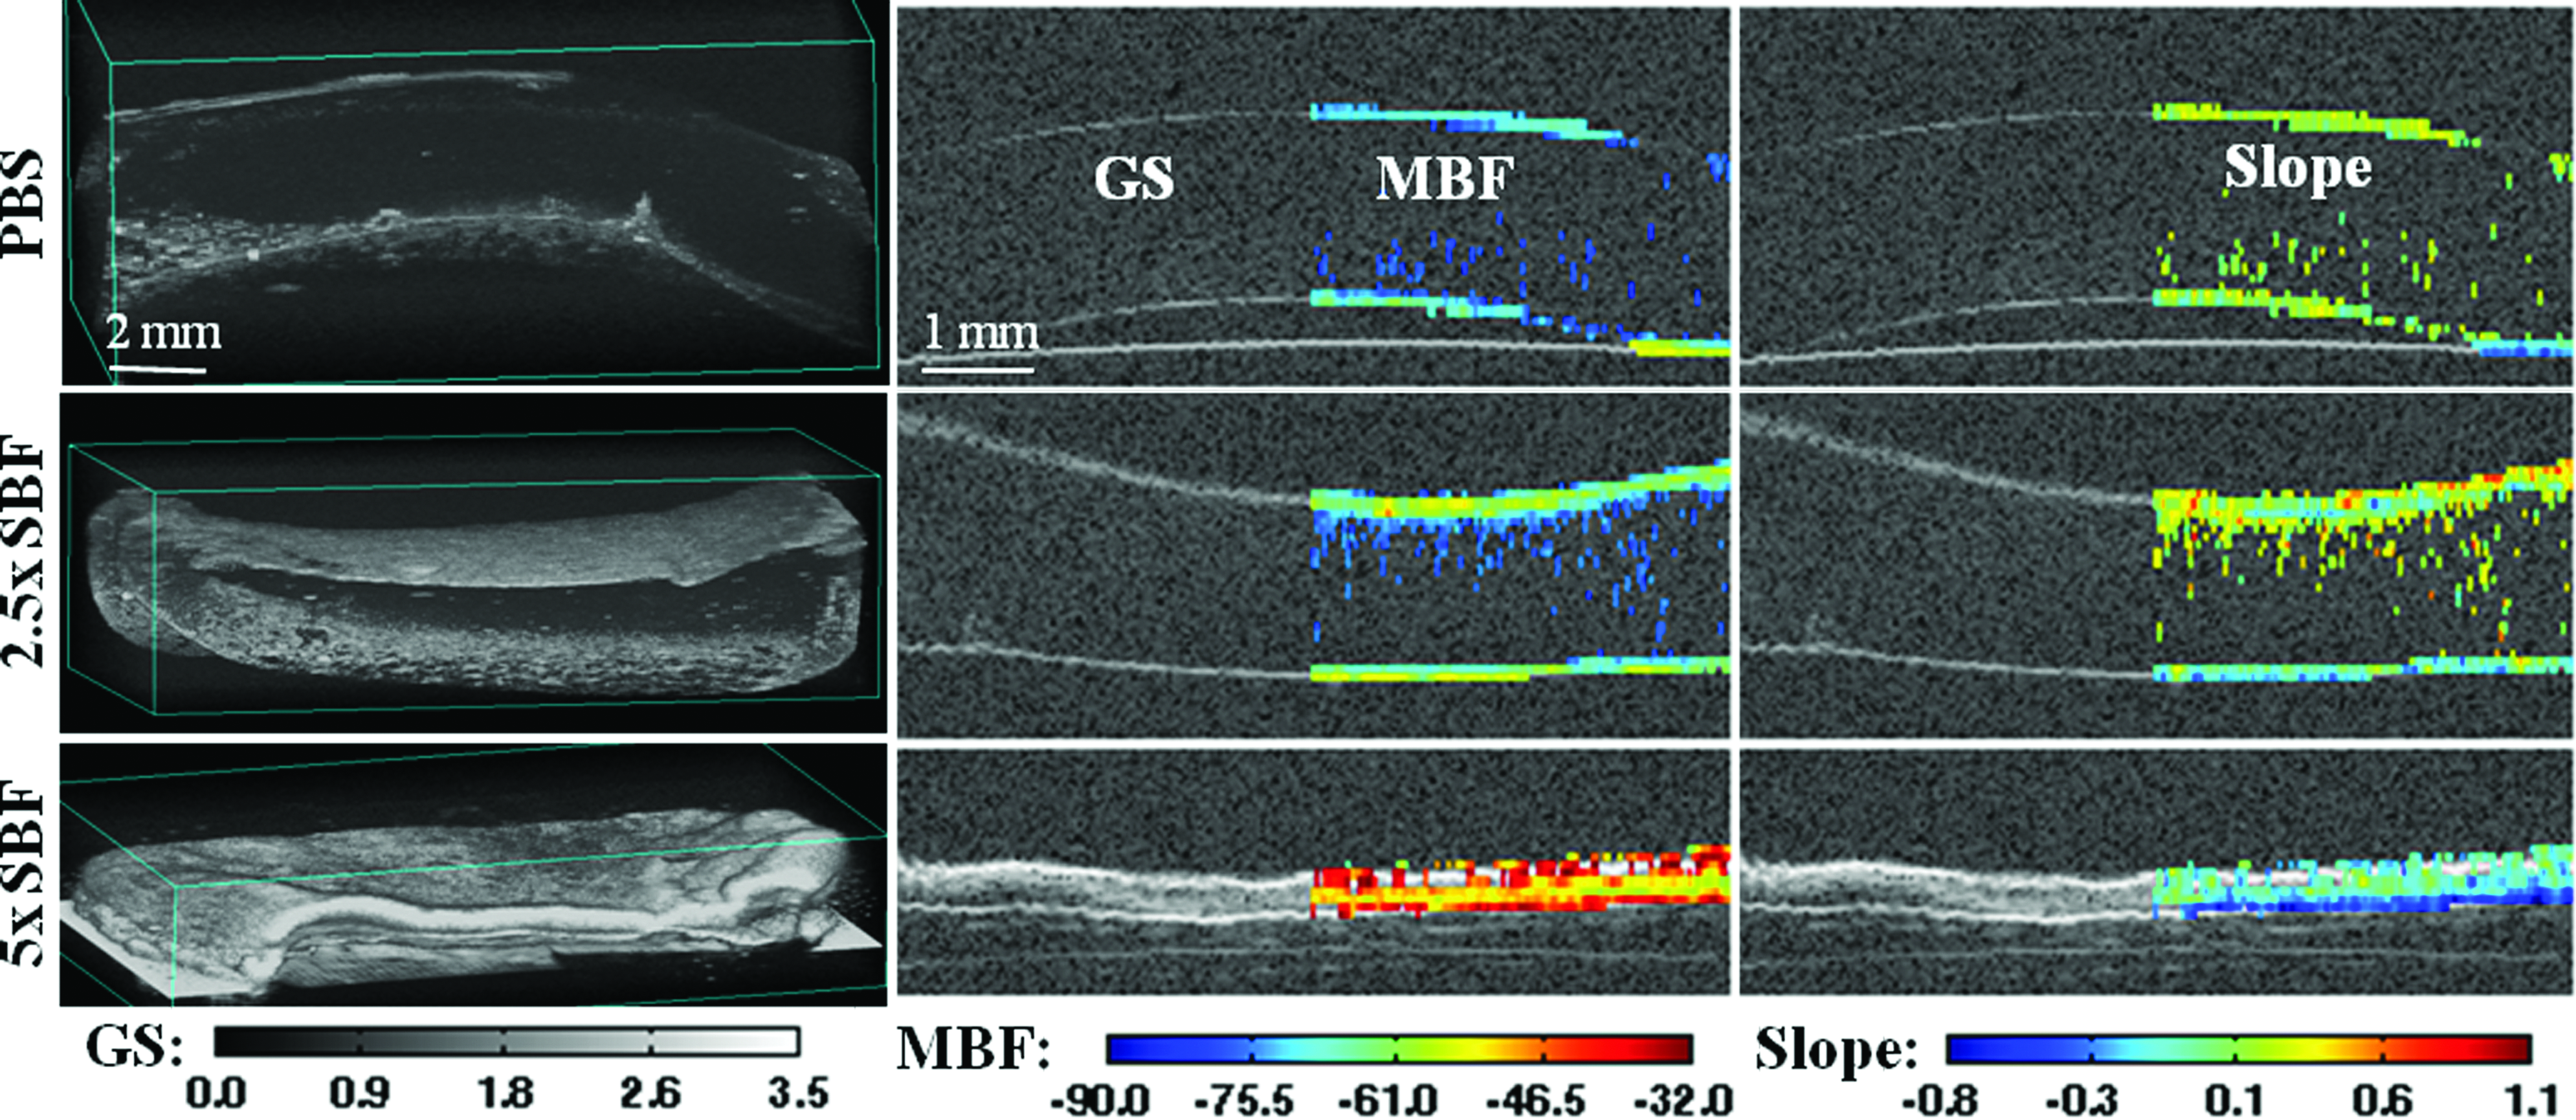
Collagen constructs exposed to mineralizing solution imaged at day 21 of incubation. First column shows 3D rendered images, second column shows GS and superimposed MBF, and third column shows GS and superimposed slope. Rows show the incubation solution used. Color images available online at
Figure 8 shows a temporal analysis of mineral deposition, using the 5×SBF constructs as an example because they demonstrated the most robust mineralization. The 3D renderings, GS images, and MBF images show the pattern of mineral deposition, which clearly was initiated at the construct surface as early as day 3, and then extended progressively into the interior of the construct. Ultrasound imaging also shows the morphology of the construct as a whole, and in particular the marked compaction in the z-direction that occurred between day 7 and day 10. The slope decreased over time, indicating increased particle size, as would be expected for a mineral deposition process.
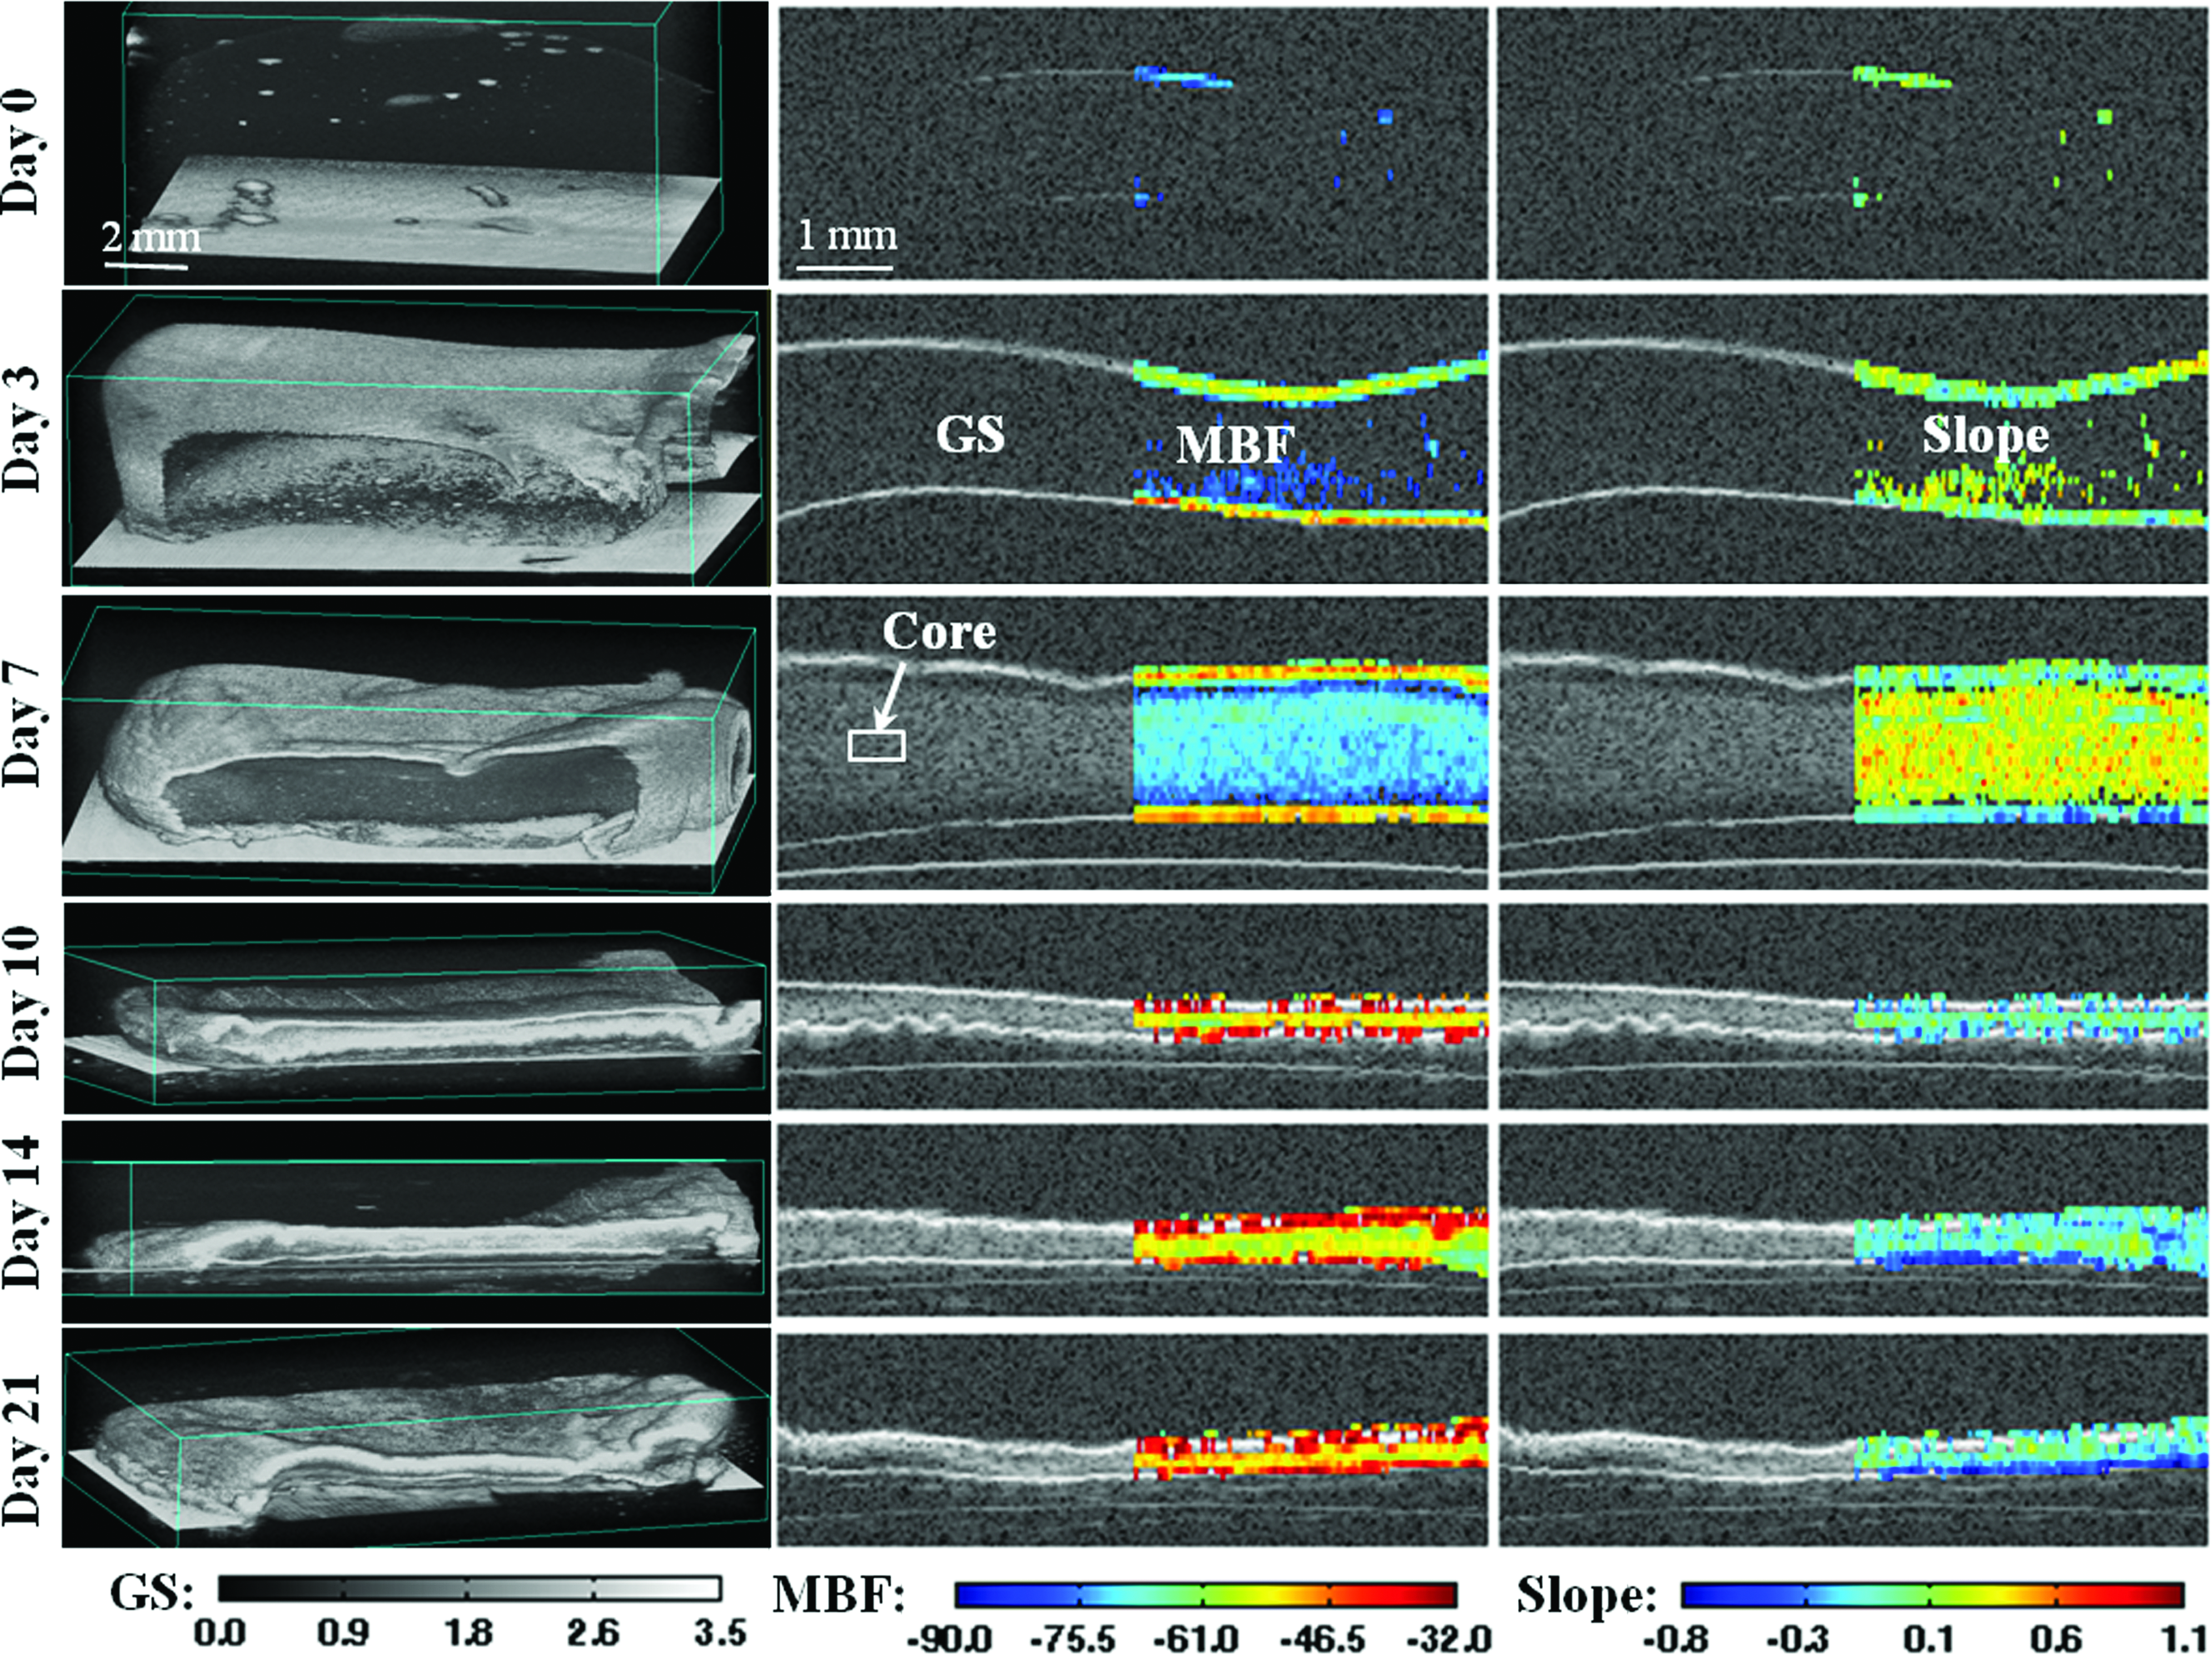
Collagen constructs mineralized in 5×simulated body fluid (SBF) and imaged over time. First column shows 3D rendered images, second column shows GS and superimposed MBF, and third column shows GS and superimposed slope. Rows show the time point of imaging. Color images available online at
Thresholding on ultrasound images was used to automatically determine construct thickness using Equation (2), by averaging the values in a 5.0 mm×0.5 mm section. This method takes into account changes in construct shape, and therefore can provide an accurate measure of the relevant dimensions at any specific location and time. Figure 9 shows that constructs in PBS compacted 17.4%±6.2% (n=4, p<0.05) over the first week but recovered over time at days 14 and 21. Constructs in 2.5×SBF did not compact significantly (1.8%±2.8% at day 7 with p=0.35) over 21 days of incubation and had similar thickness as the constructs in PBS at day 21. Constructs in 5×SBF compacted markedly to less than a third of their original thickness (1.75±0.06 mm, n=4 with p<0.001) after day 7, and their dimensions remained relatively constant for the remainder of the incubation period.
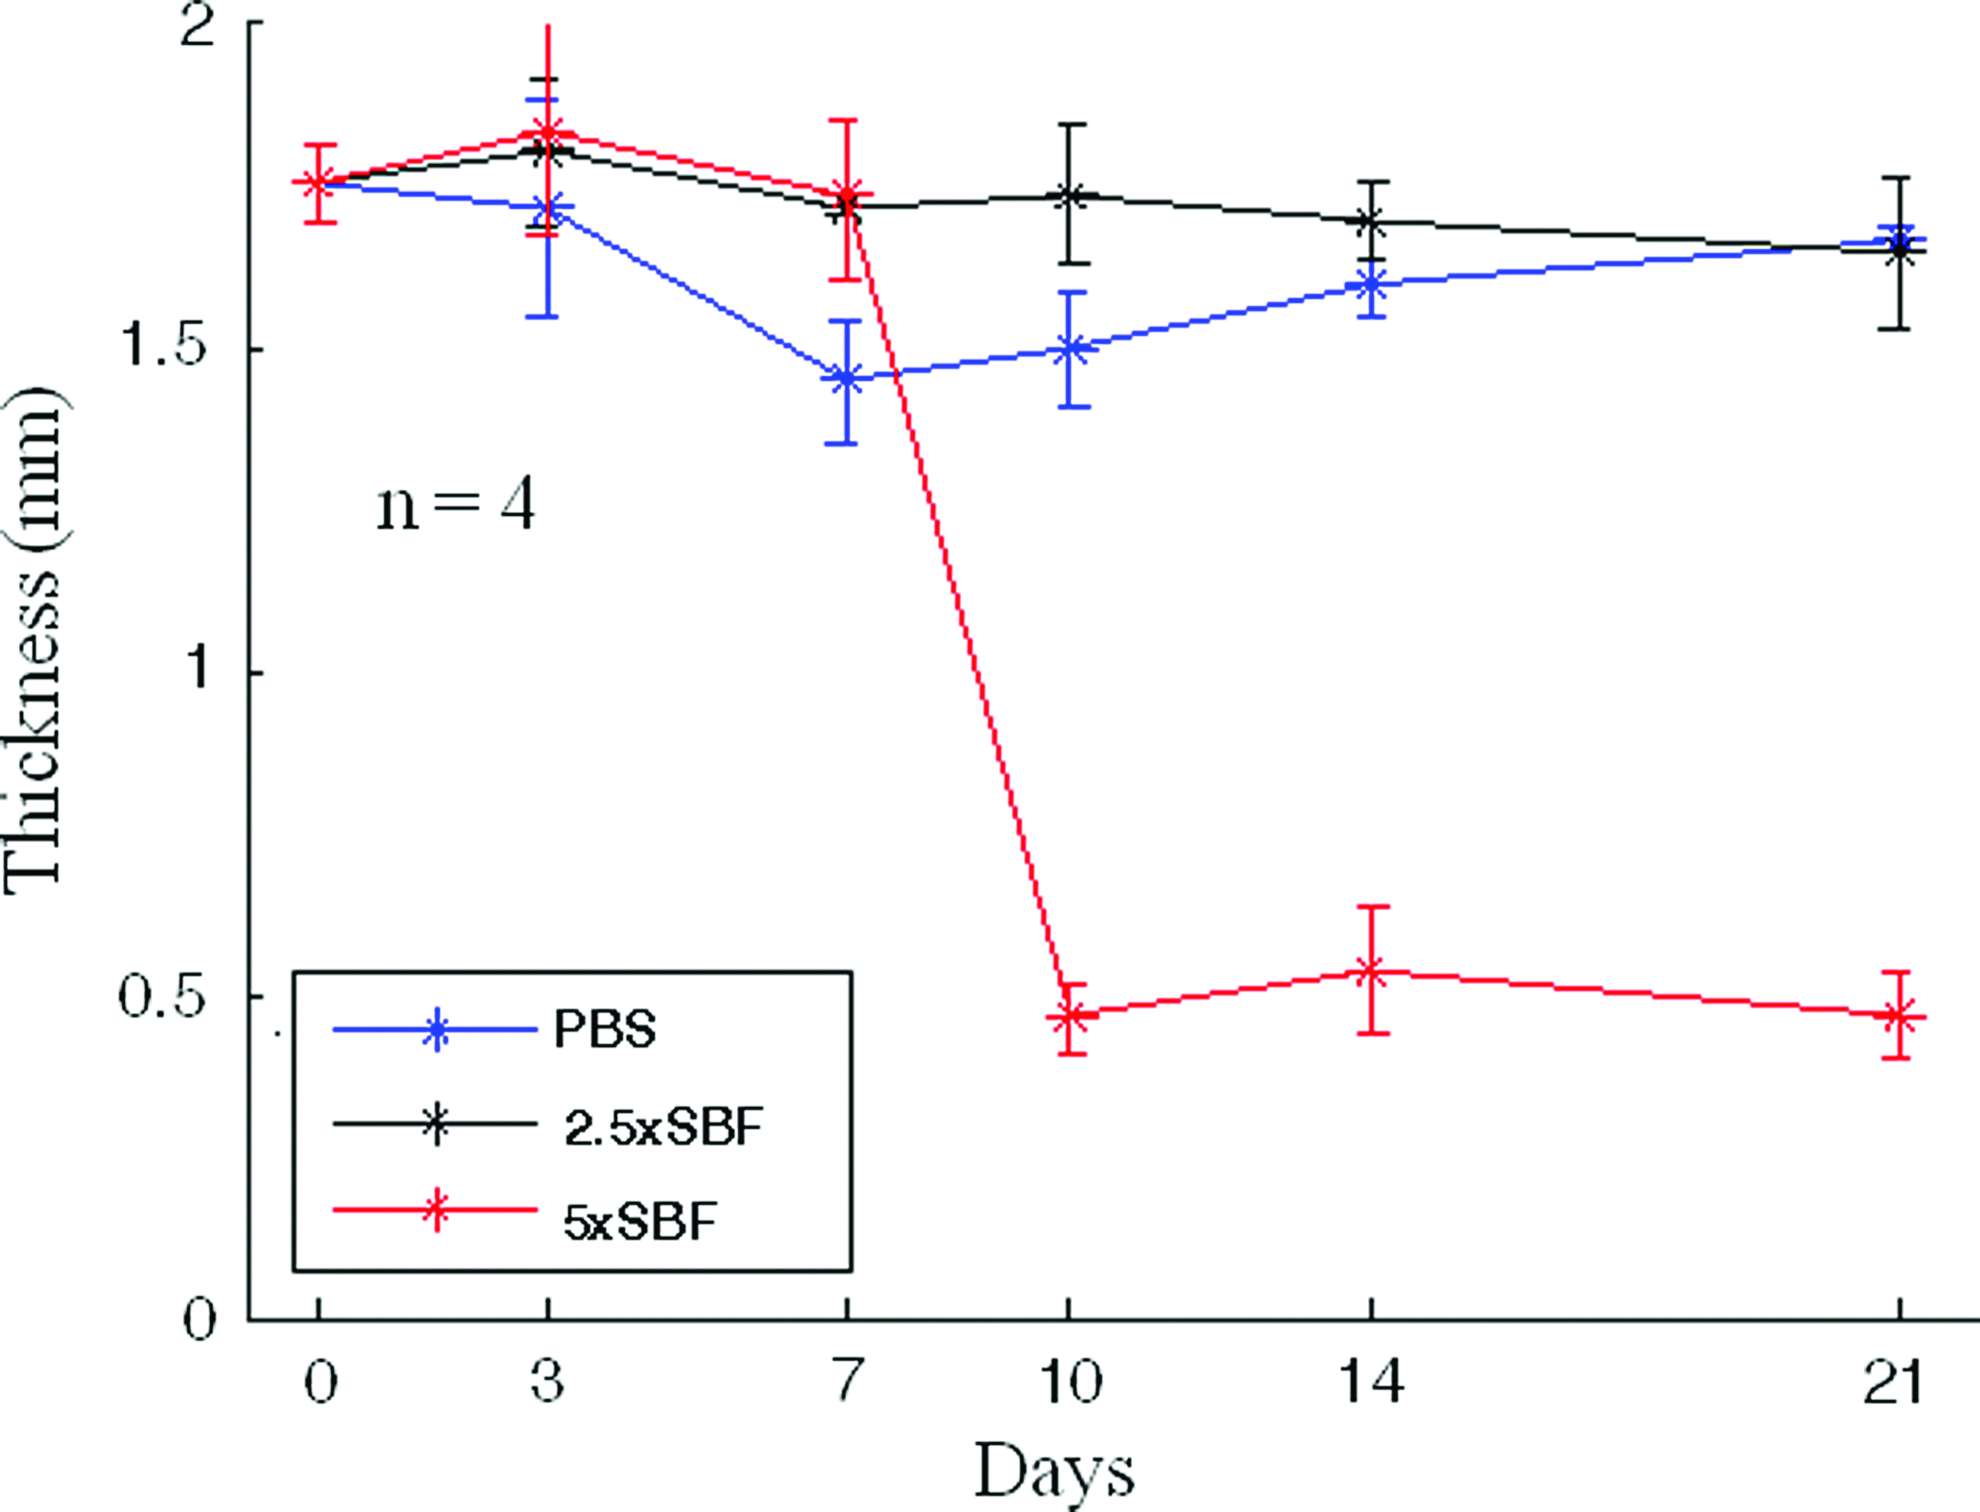
Plot of thickness over time of constructs incubated in phosphate buffered saline (PBS), 2.5×SBF, or 5×SBF (n=4 for each sample type; error bars represent standard deviation). Color images available online at
The density of the MBF signal over a 0.5 mm×5.0 mm×thickness volume of each construct determined using Equation (3) was compared with the extent of mineral deposition as measured by calcium content using the OCPC assay. Figure 10 shows both MBF density and calcium density in constructs over time. Overall, the MBF density matched the measured calcium concentration very closely in all constructs (R 2 >0.95 in all cases). In PBS, there was essentially no exogenous mineral deposition and the calcium concentration remained below 2 μg/mL. In 2.5×SBF the calcium content remained low and statistically unchanged over the first 14 days of incubation, but then climbed to ∼35 μg/mL by day 21, with a corresponding increase in MBF density. The 5×SBF constructs were robustly mineralized and the calcium content increased linearly over the incubation period to a final value above 6000 μg/mL at day 21.
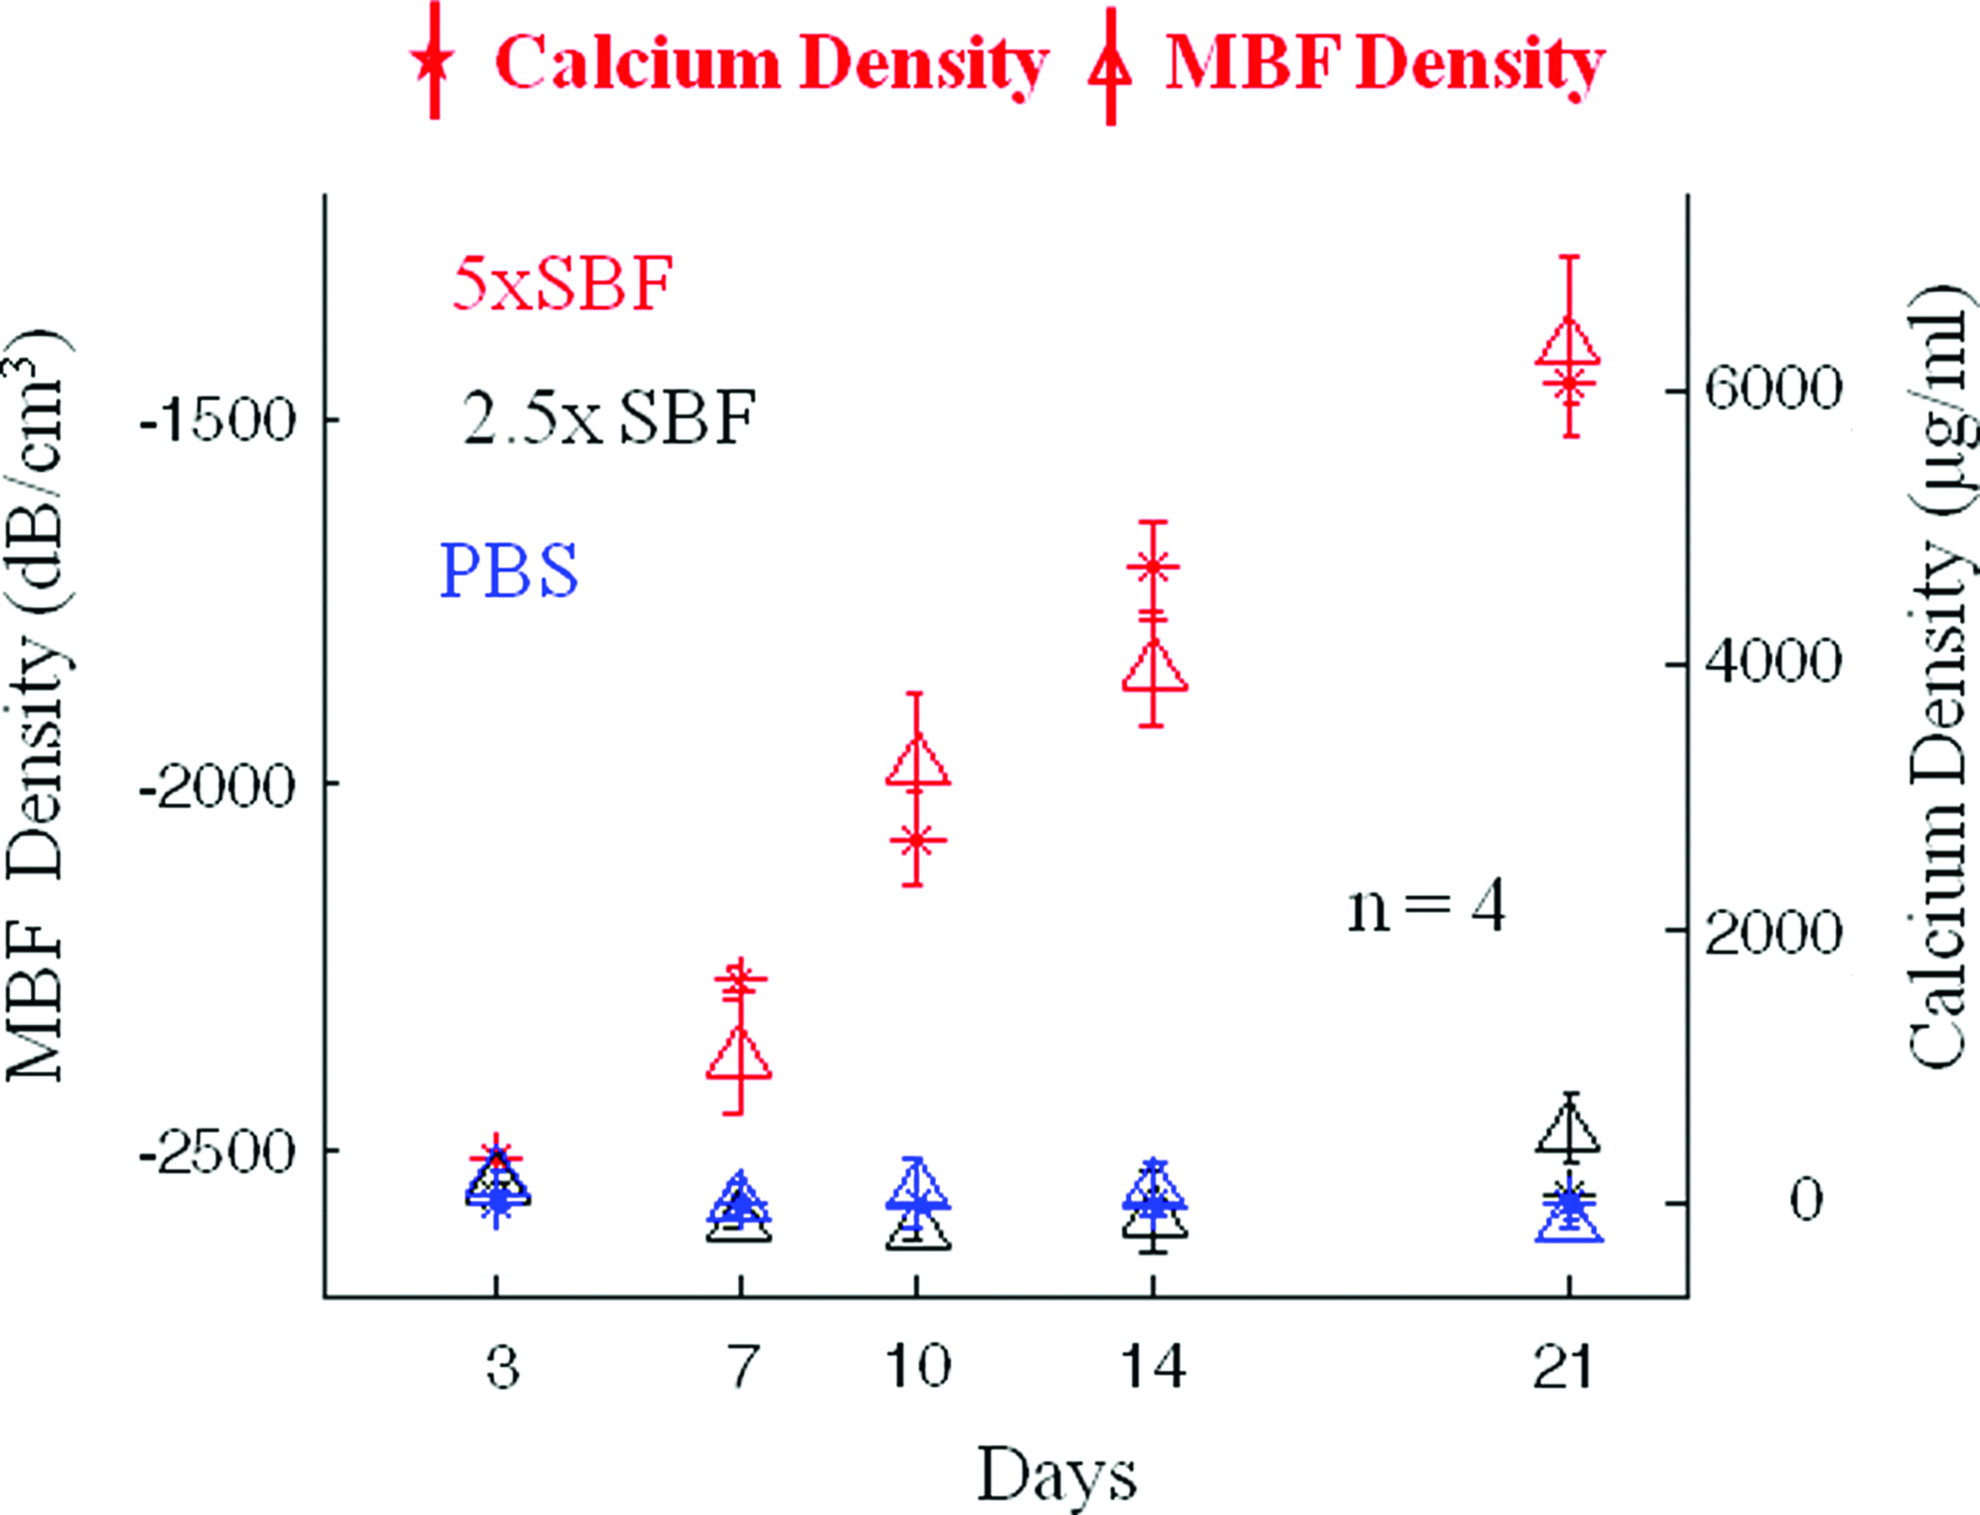
Calcium density and calculated MBF density over time in constructs incubated in PBS, 2.5×SBF, and 5×SBF (n=4 for each sample type; error bars represent standard deviation).Color images available online at
Discussion
SUSI rapidly generated objective and quantitative information about the morphology and composition of 3D collagen constructs. Importantly, the imaging method was noninvasive and could be performed while constructs remained bathed in incubating medium. Since the assay was nondestructive, the same samples could be imaged over time to monitor their development. In addition, 3D imaging allowed subvolume analysis and comparison of different regions of the imaged constructs through simple processing of the digital data. The use of high-frequency ultrasound imaging (≈50 MHz) provided a spatial resolution of ∼25 μm, which is suitable for characterization of engineered tissue constructs. High-frequency imaging resulted in a lower penetration depth than other modalities, but still allowed characterization of the 2-mm-thick engineered constructs used in this study. We imaged volumes on the order of 0.5 cm3, but larger volumes can easily be imaged by increasing the lateral scan dimension. Importantly, the wide bandwidth available at higher frequencies is beneficial for spectral analysis because it provides richer information about the composition of the constructs, relative to conventional grayscale imaging. Taken together, these features make ultrasound imaging very attractive for biomaterials and tissue engineering research, and potentially for quality assurance purposes as engineered tissues approach the market.
In this study, we focused on mineral-containing materials because of our interest in developing mineralized orthopedic tissues.19,20 Analysis of 3D collagen gels supplemented with different types of HA showed that spectral ultrasound can characterize the concentration, degree of dispersion, and spatial location of the mineral phase in 3D. In particular, 3D ultrasound imaging showed clearly the ability of sonication to enhance dispersion of the larger HA-R particles as well as the much smaller HA-M and HA-N particles. Mineral distribution was best analyzed using the GS and MBF parameters, since both depend primarily on the concentration of scatterers in the sample. The settling and dispersion effects could be assessed by color coding the parametric images, and could be further quantitatively characterized using histogram analysis. In addition, the relative concentration of samples supplemented with different levels of HA was characterized using ultrasound imaging results, which correlated well with the initial loading level. Achieving good dispersion of HA particles throughout scaffolds and hydrogels is a well-studied problem in developing biomimetic matrices, 21 and assessment of dispersion has been a challenge. Our results show that ultrasound imaging has the ability to both qualitatively and quantitatively characterize dispersion in 3D samples, and can be used to compare treatments designed to enhance dispersion.
In the analysis of HA distribution, the GS and MBF data provided similar information. However, a key distinction between these parameters is that MBF is independent of both the imaging system used and the scanning power of the ultrasound probe, whereas the GS data are dependent on these factors. Therefore, MBF data generated by different users on different systems are comparable, whereas GS data are not. In addition, SUSI uses raw spectral data and no manual thresholding is required. These features are important advantages of the method, since the ability to generate objective operator- and instrument-independent data makes the method more broadly applicable and appropriate for interstudy comparisons.
The slope parameter is reflective of particle size. In this study, the slope parameter was able to differentiate between HA-R particles (590 μm diameter) and the smaller HA-M (5 μm) and HA-N (<200 nm) particles. However, the smaller particle sizes could not be differentiated from each other because of the resolution of the probe used (∼25 μm). While the MBF parameter varied with added HA content as the concentration increased, the slope parameter remained relatively constant, as would be expected from adding more particles of the same size. The slope parameter is extracted from the raw RF spectrum and therefore is also instrument independent.
SBF was used as way to exogenously mineralize 3D collagen matrices, to observe and characterize the evolution of a mineral phase in constructs over time. SBF treatment has been developed and validated as a method to deposit a bone-like apatite mineral coating throughout scaffolds and hydrogels.22,23 Ultrasound imaging revealed the pattern, degree, and temporal progression of mineral deposition. There was a clear dose-dependent effect of SBF concentration on mineral development, which was initiated at the surface of the constructs. In the most concentrated SBF solution (5×), the formation of a mineral “shell” around the construct was followed by a dramatic compaction of the material after a week of incubation. Both the mineralization and the compaction processes were tracked over time using ultrasound imaging, which are not possible using current histological techniques. The spectral parameters were used to quantify the degree of mineral deposition and these results correlated well with corresponding data from a destructive calcium quantification assay. The reason for the marked volume change in highly mineralized constructs is not clear, but may have been due to changes in osmotic pressures caused by the mineral shell or the weight of the mineral deposits. Mineralization by SBF is a crystallization process that proceeds exponentially as new surface area and nucleation sites for crystal growth are provided. The much higher mineral content in the 5×SBF constructs was therefore expected based on the higher ion content in the mineralizing solution and the corresponding exponentially greater mineral deposition.
We have validated SUSI as a method to characterize a developing mineral phase in protein-based hydrogels. This technique therefore can be used to complement existing tissue imaging and characterization methods, and may provide additional information that cannot be obtained using current techniques. Microcomputed tomography (microCT) has been used widely in orthopedic tissue engineering,24,25 but is most suited to highly mineralized samples with strong radiographic contrast. Ultrasound is more applicable to soft tissues, and as we have shown it can distinguish mineral phases in such tissues. SUSI offers relatively rapid image acquisition (seconds to minutes for cm-sized samples) whereas microCT imaging typically takes much longer. In addition, SUSI can be performed with a small and easily transported probe whereas microCT requires inserting the sample into a larger scanner.
The SUSI technique has other possible extensions and applications in addition to those addressed in this study. More detailed analysis of spectral data from multicomponent samples may allow discrimination between material phases, for example, between different protein types in hydrogels and/or between different types of mineral components. In addition, SUSI may be extended to in vivo characterization of mineralization. Spectral analysis already is performed clinically to assess intravascular plaque formation, 26 and is being developed for virtual histological examination of cancerous tissue. Such extensions will be part of future work in the field, and will enhance the utility of SUSI in accelerating the development of functional engineered tissues.
Conclusions
This study showed that high-resolution spectral ultrasound can be used to noninvasively characterize and monitor 3D protein-based constructs that contain a mineral component. The technique provided information about the dimensions and morphology of the construct as a whole, as well as the concentration, distribution, and particle size of the mineral phase. Further, constructs could be imaged over time to monitor development of a mineral phase and characterize the composition of the matrix. Spectral analysis is particularly useful because it generates operator- and instrument-independent parameters that can be compared between laboratories, studies, and time points. This and similar techniques can generate metrics that reflect material and sample properties, and therefore may have utility in advancing research and product development in tissue engineering.
Footnotes
Acknowledgments
This work was supported in part by a National Science Foundation Graduate Research Fellowship (to R.R.R.) and by the University of Michigan Cardiovascular Center Summer Research Fellowship (to A.W.P.).
Disclosure Statement
The authors have no competing or financial interests.