




Abstract
Fabricating three-dimensional (3D) porous scaffolds with controlled structure and geometry is crucial for tissue regeneration. To date, exploration in printing 3D natural protein scaffolds is limited. In this study, soy protein slurry was successfully printed using the 3D Bioplotter to form scaffolds. A method to verify the structural integrity of resulting scaffolds during printing was developed. This process involved measuring the mass extrusion flow rate of the slurry from the instrument, which was directly affected by the extrusion pressure and the soy protein slurry properties. The optimal mass flow rate for printing soy slurry at 27°C was 0.0072±0.0002 g/s. The addition of dithiothreitol to soy slurries demonstrated the importance of disulfide bonds in forming solid structures upon printing. Resulting Bioplotted soy protein scaffolds were cured using 95% ethanol and post-treated using dehydrothermal treatment (DHT), a combination of freeze-drying and DHT, and chemical crosslinking using 1-ethyl-3-(3 dimethylaminopropyl)carbodiimide (EDC) chemistry. Surface morphologies of the different treatment groups were characterized using scanning electron microscopy. Scaffold properties, including relative crosslink density, mass loss upon rinsing, and compressive modulus revealed that EDC crosslinked scaffolds were the most robust with moduli of approximately 4 kPa. Scaffold geometry (45° and 90° layer rotations) affected the mechanical properties for DHT and EDC crosslinked scaffolds. Seeding efficiency of human mesenchymal stem cells (hMSC) was highest for nontreated and thermally treated scaffolds, and all scaffolds supported hMSC viability over time.
Introduction
Animal- and plant-based proteins are ideal biomaterials due to inherent bioactivity, degradation properties, and natural binding sites that can be tailored to control cell adhesion and growth both in vitro and in vivo. 14 The ability to create reproducible natural biopolymer scaffolds or hydrogels with a precise structure provides a unique platform for controlling tissue regeneration. Specific optimization and design of printing parameters and conditions have been developed for various proteins15–19 and composites.20,21 Three-dimensional printing using a powder layer with deposition of a binding solution was used to fabricate a blend of corn starch, gelatin, and dextran. 20 Gelatin alone has also been plotted at 3% and 10% concentrations in water.15,16 Landers et al. discussed the important fabrication parameters involved in plotting soft gel materials, including viscosity, swelling in a plotting medium, density, and thermal behavior of the plotted material, using gelatin and agar as examples. 16 Bovine collagen has been fabricated using an indirect printing technique, where slurry is printed into a negative mold, and the mold is subsequently dissolved away after freeze-drying to leave a scaffold with a predefined structure.17–19 The 3D Bioplotter was used to fabricate 3D collagen-chitosan-hydroxyapatite hydrogels in a study characterizing the angiogenic and inflammatory response in vivo in comparison with a plotted poly(lactic-co-glycolic acid) scaffold. 21
Two main challenges with printing natural biopolymers include strut solidification upon extrusion 15 and electrostatic interactions between the biopolymer and liquid media if plotting into a solution. Scaffolds formed in air would require that the slurry dries at an appropriate rate during extrusion to support subsequent printed layers. Plotting into a liquid medium requires that the density of the solution be the same as the material being injected to preserve a strand shape and to prevent dissolution of the printed strands.2,16 Standardizing the plotting method for individual soft materials is essential since variability in moisture content of slurries and drying as a result of variable environmental conditions can affect reproducibility during mass production.
This study focuses on the Bioplotting of a denatured soy protein, chosen due to the thermoplastic nature of the protein components, 22 as well as the initial biocompatibility demonstrated both in vitro with different cell types23–25 and in vivo. 26 The soy protein is a plant-based material with a wide range of structural and mechanical properties depending on the processing treatment. 22 The degradation properties of soy biomaterials can be altered through different crosslinking treatments or fabrication techniques.24,27,28 Flexibility in material properties allows soy to be fabricated into a variety of structures, including thin films, 29 granules,25,26,30 hydrogels,31,32 and scaffolds.24,33 The goals of this work were to fabricate soy protein scaffolds in a reproducible manner with optimized printing parameters and to characterize the resulting 3D soy protein constructs.
Materials and Methods
Mass extrusion
A denatured soy protein isolate containing 87.6% protein as determined by the combustion method 34 (Solae LLC, St. Louis, MO) was mixed with milliQ (MQ) water in varying wt.% to form a slurry. 1 wt.% antibiotic/antimycotic solution (Invitrogen, Carlsbad, CA) was added to all slurries. Glycerol (Sigma-Aldrich, St. Louis, MO) was added to 20 wt.% soy protein slurries as a plasticizer. Slurries were sieved sequentially through an autoclaved 297-μm pore size sieve (#50 mesh), and then an autoclaved 105-μm pore size sieve (#140 mesh) to remove nondissolved particulates, forming a homogeneous paste. Sieved pastes were spread into a polyethylene (PE) syringe cartridge attached to a 200-μm PE tip and loaded into a 3D Bioplotter (EnvisionTec GmbH, Gladbeck, Germany) at room temperature. Slurries were extruded into a Petri dish of known weight at a pressure of 3 bars for 2 s, and the ejected masses were weighed (n=3 measurements per temperature). The mass flow rate was determined by dividing the weight of the extruded slurry with the amount of time of extrusion (2 s). The temperature of the cartridge was then raised and held for 5 min before the next set of extrusions. Extrusions were performed for the temperature range of 22°C to 70°C. The optimal mass flow rate for the soy protein slurry was determined by setting the pressure range between 0.5 bars to 3 bars at a fixed temperature of 27°C. To observe the effects of disulfide bond removal, 7.5 mM dithiothreitol (DTT; Sigma-Aldrich) was added to the 20 wt.% soy protein/4 wt.% glycerol solution. To visualize the macroscopic surface morphology of the printed strands, a 2 wt.% trypan blue solution (Invitrogen) was added.
Scaffold fabrication and post-treatments
Soy protein slurry composed of 20 wt.% soy protein/4 wt.% glycerol was prepared using the method described above. Individual boxes of 10 mm (length)×10 mm (width)×5 mm (height, 20 layers total) with θ=45° and 90° layer rotations (Fig. 1) were fabricated onto a Teflon foil. Layer spacing (s) was set at 250 μm. Distance between strands was set at 1 mm to yield w=800 μm. Pressures applied to achieve the optimal flow rate through a 200-μm tip (to achieve t=200 μm) ranged between 0.8 to 2 bar. Plotting temperature and speed were 27°C and 35 mm/s, with a preflow delay of 0.1 s. All scaffolds were immersed in 95% ethanol for at least 3 h before any further treatments. Following dehydration in ethanol, scaffolds were punched using a 6-mm biopsy punch to avoid edge effects. The four following treatment groups were considered: nontreated (NT), freeze-dried and dehydrothermal treated (FD-DHT), dehydrothermal treated only (DHT), and chemical crosslinked with carbodiimide crosslinking (1-ethyl-3-(3 dimethylaminopropyl)carbodiimide [EDC]). Scaffolds that underwent no further treatment beyond 95% ethanol dehydration (NT group) were rinsed 3×and immersed in a phosphate-buffered solution (PBS) with calcium and magnesium (Hyclone, Logan, UT). A subset of scaffolds (FD-DHT group) were rinsed 3×with PBS, dried on a 11-μm filter paper, frozen at−80°C, and dried to sublime water frozen on the strand surfaces. After lyophilization, scaffolds underwent DHT in a vacuum oven (VWR, Radnor, PA) at 105°C for 24 h under a vacuum of<100 mmHg. Scaffolds only treated with DHT (DHT group) were rinsed 3×in PBS and dried on the 11-μm filter paper immediately before DHT. Scaffolds for chemical crosslinking (EDC group) were transferred to a solution of 375 mM EDC coupled with N-hydroxysuccinimide (NHS) at an EDC:NHS ratio of 5:2 (assuming 2 mmol carboxylic acid groups), all dissolved in 95% ethanol. 35 All scaffold groups were immersed in PBS for at least 24 h before experiments.
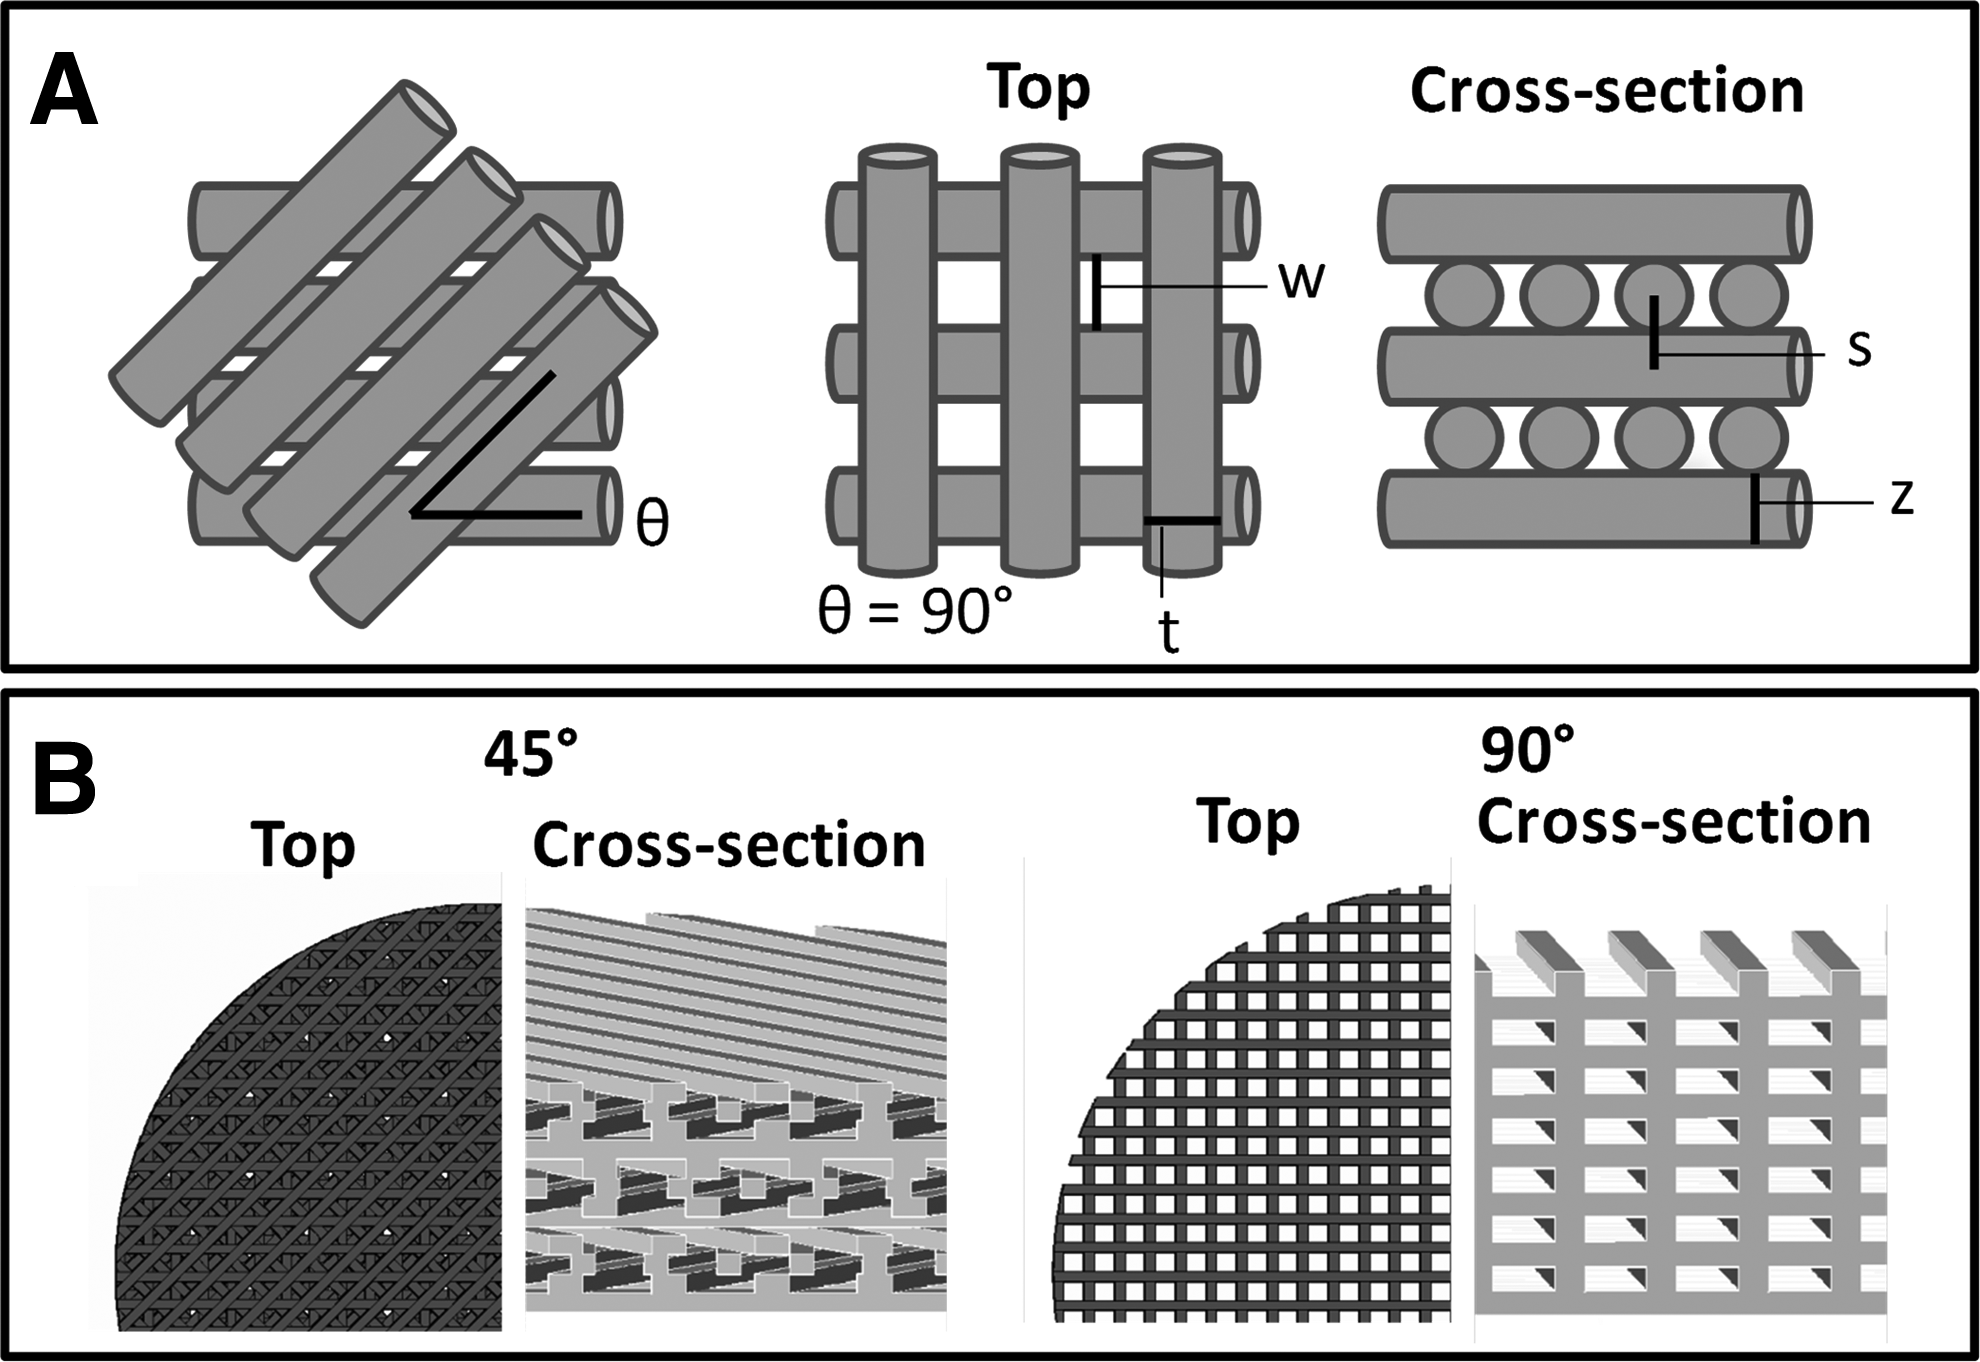
Idealized schematics of Bioplotted scaffolds.
Surface morphology characterization
A Quanta 600F sFEG scanning electron microscope (FEI, Hillsboro, OR) was used to visualize the scaffold structure and surface morphology of 90° scaffolds (n>2 per group). Cross sections were obtained by cutting scaffolds using a scalpel. Hydrated scaffolds (NT and EDC groups and individual soy strands with and without addition of DTT) were immersed in 100% ethanol for at least 20 min and critical point dried. All scaffolds were coated with 9 nm of osmium before imaging. Dimensions of the various scaffolds, including strand thickness t and pore width w for top and bottom layers as well as strand thickness z were measured using ImageJ with at least five measurements per sample and n=3.
Determination of crosslink density and mass loss
Relative crosslink density (XD), the inverse of swelling ratio directly related to the volume fraction of dry soy, was determined for the 45° scaffolds of the different groups (n=5–6) using a previously described method.
36
Hydrated scaffolds were immersed in 90°C water for 2 min. The scaffold was then pressed under a 1 kg weight between 11-μm filter papers for 20 s to remove water within the pores and weighed to obtain the wet mass (Mw). The wet scaffolds were dried overnight at 110°C. Density of crosslinks was then calculated using the wet and dry masses (Mw and Md, respectively), of the soy scaffold, the density of soy (ρs), and the density of water (ρw=1.00 g/cm3) using the following equation:
The density of soy was determined for FD-DHT scaffolds using an AccuPyc 1340 helium pycnometer (Micromeritics, Norcross, GA) with n=3 taking the average of 6–8 independent measurements per sample. Average density calculated from FD-DHT scaffold results were used to reduce the likelihood of closed cell pores.
Mass loss of the scaffolds upon rinsing was determined by calculating the percent change between dry weights before and after rinsing. Hydrated NT and EDC scaffolds were freeze-dried before measuring starting dry weight (Mb). All scaffolds were individually rinsed 3×for 5 min in either PBS or MQ water, freeze-dried, then weighed to obtain mass after rinsing (Ma). Total percent mass loss was calculated as (Mb−Ma)/Mb×100%.
Mechanical properties
Compression testing on 45° and 90° scaffolds was performed using a mechanical tester (JLW Instruments, Chicago, IL) using a previously described method. 24 Briefly, scaffolds (n=5 per group) were compressed at 0.2 mm/min up to 45% strain, and the compressive modulus was determined by calculating the best fit slope of the linear (elastic) regime starting from the lowest strain outside the toe region (0.8% strain) to R 2 =0.95 (R 2 =0.99 for EDC scaffolds).
Cell seeding
Scaffolds with 45° geometry were used to characterize cell attachment and growth. All scaffold groups were hydrated in PBS for at least 1 day before cell seeding. Scaffolds were sterilized in 70% ethanol and exposed to UV simultaneously for 30 min. After sterilization, scaffolds were dried on the 11-μm filter paper before and after rinsing 3×in PBS with 5 min per rinse and incubated overnight in the low-glucose phenol red-free Dulbecco's Modified Eagle Medium (DMEM) supplemented with a 25 mM HEPES buffer, 2 mM L-glutamine, 10% fetal bovine serum, and a 1% antibiotic/antimycotic solution (all from Invitrogen).
Human mesenchymal stem cells (hMSC) from Lonza (Walkersville, MD) were passaged up to Passage 5 in MSC basal media with the MSC growth supplement, L-glutamine, and penicillin/streptomycin. All cells were cultured at 37°C in a 5% CO2 humidified environment. Cells were trypsinized using 0.05% trypsin-EDTA (Invitrogen) and seeded onto the top layer of the printed scaffold at varying densities, including 1×10⁴, 5×10⁴, and 1×10⁵ cells per scaffold. Cells were allowed to adhere to the scaffold for 90 min at 37°C with 5% CO2 before the addition of the phenol red-free DMEM described above. Scaffolds were cultured for 1 and 7 days.
Cell seeding efficiency, proliferation, and morphology on various scaffolds
Harvested scaffolds were cut into four pieces using microscissors and sonicated for 20 min in 1 mL of 0.02% (v/v) Triton X-100 (Bio-Rad, Hercules, CA) in MQ water. Samples were centrifuged at 15,000 rpm for 10 min at 4°C. A PicoGreen assay kit (Invitrogen) was used to quantify the amount of DNA in the supernatant. Aliquots of 100,000 cells taken during seeding were used to determine the amount of DNA per cell to convert the DNA quantity to cell count. Cell seeding efficiency was calculated for the scaffolds seeded with 1×10⁵ cells. The seeding efficiency was defined as the percent difference between the numbers of cells present in the culture after 1 day (C) to the assumed amount of total cells seeded. The formula used was seeding efficiency (%)=C/(1×105)×100%. Cell-seeded scaffolds were fixed for 1 h using 2% glutaraldehyde (Sigma-Aldrich) and 3% sucrose (J.T. Baker, Avantor, Center Valley, PA), dehydrated through graded ethanol, and critical point dried before imaging using a scanning electron microscope.
Statistical analysis
All quantitative data from scaffold characterization analyses were reported as the mean with the positive error bar representing one standard deviation. Cell data were reported as the mean with the positive error bar representing standard error mean (standard deviation/n1/2). Independent t-tests assuming unequal variance were used. One-way analysis of variance (ANOVA) with a Scheffe post hoc analysis (α=0.05) was performed with the post-treatment group as the fixed factor. p-Values<0.05 were considered statistically significant.
Results
Mass extrusion of soy protein slurry
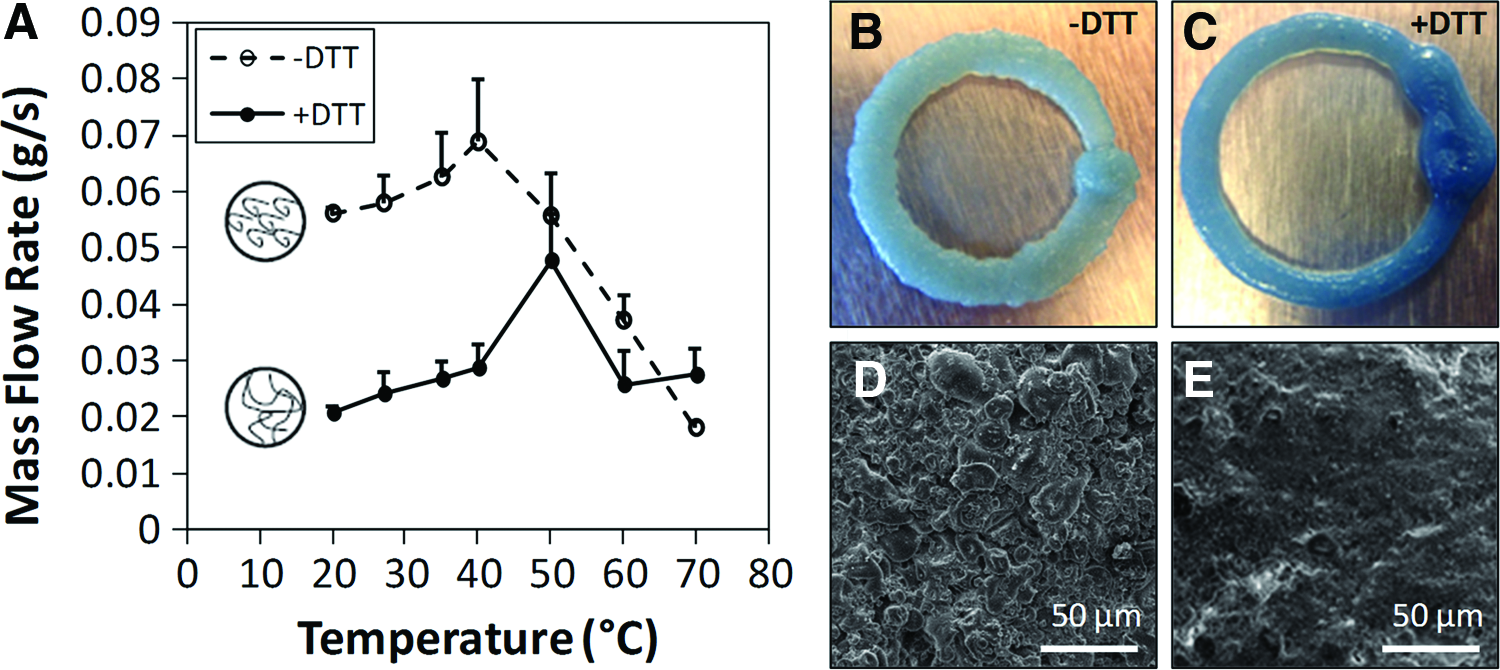
To determine an optimal soy slurry composition that could be used to fabricate 3D soy protein scaffolds with controlled pore architecture, the mass flow rate was measured for different slurry compositions up to the saturation point of the soy protein at around 20 wt.% (Fig. 2). Increasing the total weight percent of the soy protein decreased the mass flow rate. The addition of glycerol decreased the mass flow rate even further for all temperatures regardless of the percent weight of glycerol added up to 20 wt.% (data not shown). The mass flow rate of 20 wt.% soy and 4 wt.% glycerol slurry with DTT was decreased at all temperatures compared to slurry without DTT except at 70°C (Fig. 3). Macroscopic views of the strands showed that the slurry without DTT had limited uptake of trypan blue dye and rougher edges compared to the slurry with DTT (Fig. 3B, C). Scanning electron microscopy (SEM) images of the printed surfaces confirmed that the strand surface without DTT had rough surface topology compared to the smooth surface of the strand with DTT. The mass flow rate increased as extrusion pressure was increased (for the 20 wt.% soy and 4 wt.% glycerol slurry, Fig. 4). The mass flow rate required to plot robust strands with z-pores and well-defined pore structures for this slurry composition was 0.0072±0.0002 g/s (Fig. 4B). The soy protein could not be deposited onto Teflon at pressures lower than the optimal pressure (Fig. 4A). Increased pressures resulted in expansion of the strands and inability to form defined structures (Fig. 4C, D).
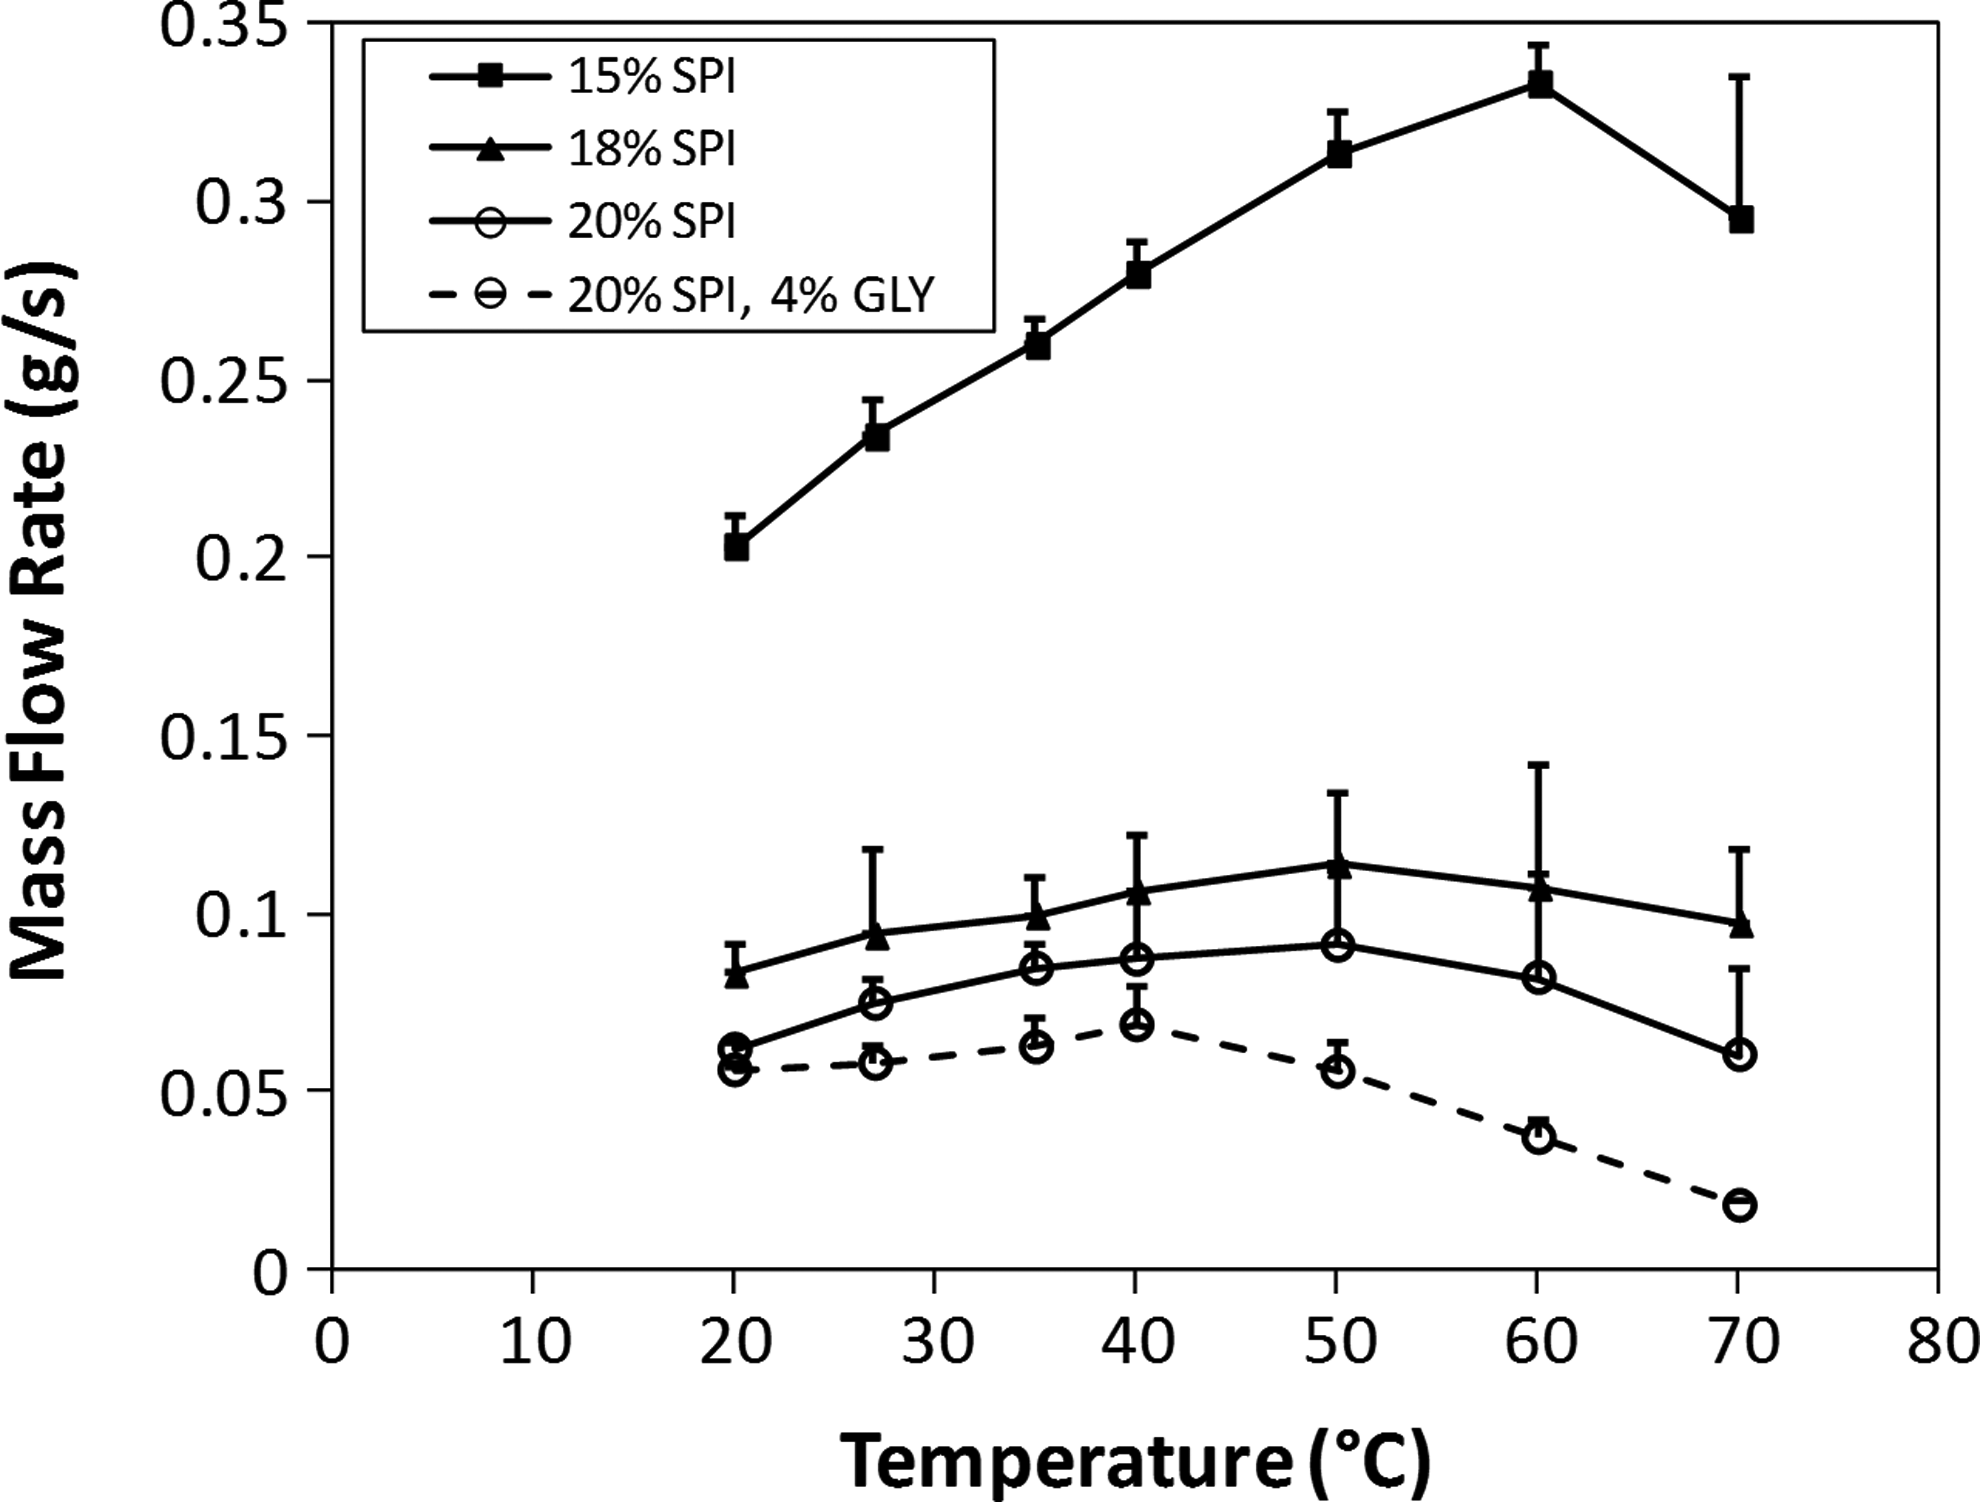
Mass flow rate of soy protein slurries of varying soy protein and glycerol concentration measured using the Bioplotter. Mass was extruded at a pressure of 3 bars for 2 s (n=3 measurements per temperature). All error bars represent one standard deviation.

Mass flow rate of a 20% soy protein, 4% glycerol slurry at various pressures (n=3 measurements per temperature). Letters A–D represent mass flow rates with corresponding macroscopic images of strand shape.
Scaffold characterization
Fabricated scaffolds had well-defined pore geometries and varied surface morphologies depending on the post-treatment type. The coloration of the scaffolds as viewed in the macroscopic images was darker yellow for the FD-DHT and DHT groups (Fig. 5). Average diameters of the 45° soy scaffolds upon ethanol dehydration and immersing in PBS after 24 h for the NT, FD-DHT, DHT, and EDC groups were 6.57±0.19, 6.57±0.14, 4.97±0.33, and 6.09±0.04 mm, respectively. SEM images of the scaffold struts showed differences in surface morphology after post-treatments. NT and EDC scaffolds had rough, dimpled surfaces with visible globules of various sizes on the order of 10 to 100 μm (Fig. 5B, E). The globules were connected homogeneously without any pores within the strand. Scaffolds that underwent DHT had smooth surfaces with less ridges and interconnected globules (Fig. 5C, D). Rounded globules were not observed. The FD-DHT scaffold strand had pores within the surface connected by protein webs (Fig. 5C). A representative cross section of the scaffolds (Fig. 5E) showed distinct stacking of strands in the z-axis with minor collapse of pores.

Effect of post-treatment on scaffold surface morphology.
Post-treatment of the scaffolds affected the structural and mechanical properties, and hence, the robustness of the scaffold (Fig. 6). Measurements of strand thickness t from the top and bottom layers of a 90° scaffold showed that the strands expanded upon printing, decreasing the pore size w (Fig. 6A, B). The z-axis strand thickness was thinner than the strut thickness at the bottom of the NT, FD-DHT, and DHT scaffolds, implying that the strand shape became elliptical with the deposition of layers. DHT scaffolds had a significantly smaller strut thickness at the top of the scaffold compared to FD-DHT and EDC scaffolds (p<0.001). FD-DHT and DHT scaffolds expanded significantly with significantly smaller strut thicknesses at the top of the scaffold compared to the bottom (p<0.001). The pore width in the top layer for FD-DHT scaffolds was significantly larger compared to other groups (p<0.001). At the bottom of the scaffold, DHT scaffolds had significantly smaller pore width (p<0.001) compared to all other groups. The density of soy measured from helium pycnometry was 1.811±0.029 g/cm3. The relative density of crosslinks significantly increased with DHT (p<0.05) and significantly increased by at least two-fold (p≤0.001) for the EDC group (Fig. 6C). ANOVA demonstrated that relative crosslink density across groups were significantly different (p<0.001). The mass loss of scaffolds rinsed in PBS ranged between 6% and 12%, with significant difference (p=0.001) between all groups as determined by ANOVA (Fig. 6D). Both DHT and EDC groups were significantly different from NT and FD-DHT groups (p<0.05). A similar total mass loss percent was observed for scaffolds rinsed in water, with the exception of the NT group which degraded entirely during the rinses. However, once rinsed in PBS, scaffold mass remained constant up to 30 days when incubated in PBS at 37°C for all groups (data not shown). The compressive modulus was on the same order of magnitude for NT and FD-DHT groups for both 45° and 90° scaffolds and 45° DHT scaffolds (Fig. 6E). 90° DHT scaffolds had approximately fourfold higher compressive modulus. The compressive modulus was on the order of kPa for the EDC scaffolds, and 90° scaffolds had double the modulus compared to the 45° scaffolds. The compressive modulus was significantly different between 45° and 90° scaffolds for the DHT and EDC groups (p<0.01). From the results, scaffold groups could be identified in the following order from least to most robust: NT, FD-DHT, DHT, and EDC. Scheffe post hoc analysis identified the EDC scaffolds to have significantly different crosslink density and mechanical properties compared to all other groups.
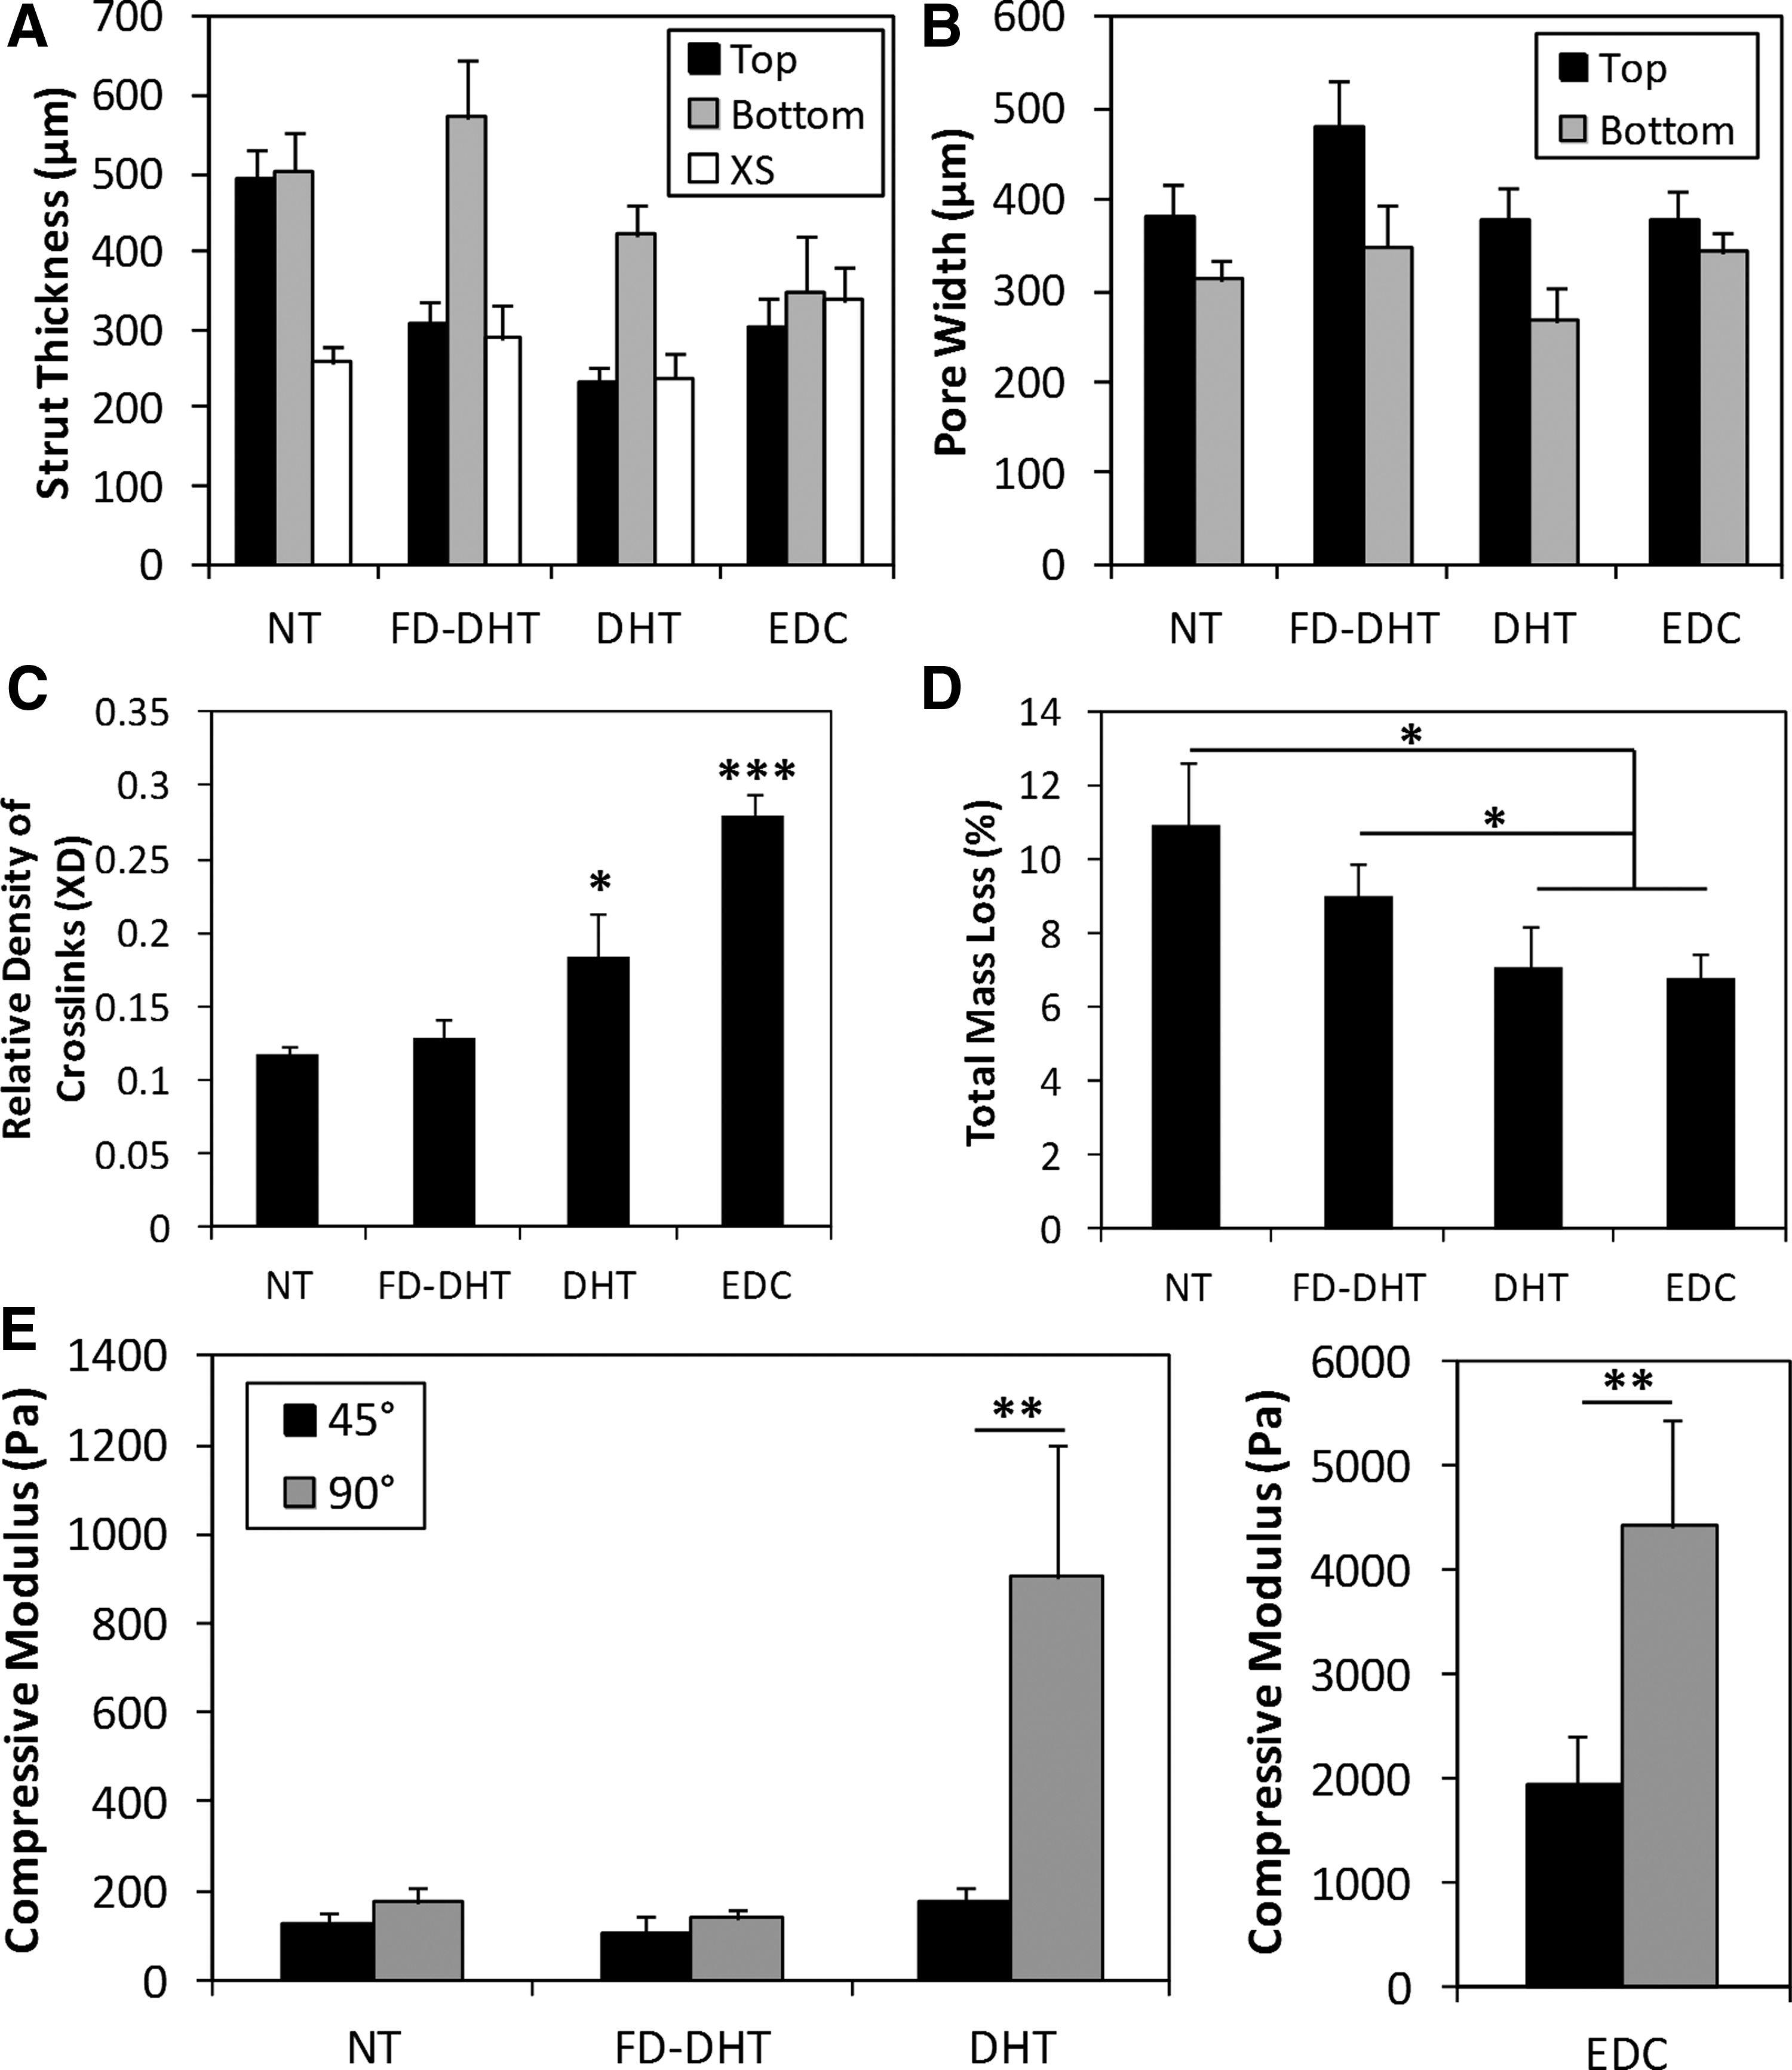
Effect of post-treatment on structural, mechanical, and degradation properties of Bioplotted soy scaffolds. All error bars represent one standard deviation.
Cell seeding, proliferation, and morphology in printed scaffolds
Cell seeding efficiencies and proliferation rates were varied between the post-treatment groups (Fig. 7). The cell seeding efficiency was significantly different across all groups (p<0.01) as determined by ANOVA. Average seeding efficiencies for NT, DHT, FD-DHT, and EDC groups were 29.4%±14.4%, 37.0%±6.4%, 14.1%±1.2%, and 3.0%±1.1%, respectively (Fig. 7A). The cell seeding efficiency for FD-DHT, DHT, and EDC groups were significantly different from each other (p<0.05 for all combinations). The deviation in seeding efficiency for the NT group rendered it not statistically different from the other groups. The cell seeding efficiencies for all the groups did not change with varying cell seeding densities (data not shown). Cell viability was maintained across all groups, and proliferation was observed for cells seeded on the NT, EDC, and FD-DHT groups. The average number of cells increased two-fold for cells seeded on both NT and EDC scaffolds. At day 1, the cells attached to the NT, FD-DHT, and DHT scaffolds appeared spread and elongated with fibroblast-like morphology on the strands and at the strand junctions (Fig. 7C–E); however, the cells did not bridge the pores for any of the scaffold groups. Cells attached to the EDC scaffolds appear rounded (Fig. 7F). Cell distribution across the scaffolds was similar for both days 1 and 7 (data not shown).

Effect of post-treated scaffolds on human mesenchymal stem cell seeding efficiency and growth.
Discussion
This work demonstrated for the first time the ability to fabricate 3D soy protein porous structures via Bioplotting. A major challenge for Bioplotting natural biopolymers is the difficulty in reproducibly printing struts that hold shape and maintain the scaffold structure. Pressures needed to print slurries are variable due to moisture content differences from batch to batch. This study used the mass flow rate (measured using the Bioplotter) as a reliable parameter for determining the ability to produce scaffolds with consistent self-supporting architectures, independent of soy slurry conditions. A mass flow rate of 0.0072±0.0002 g/s of soy protein produced well-defined scaffold constructs. To determine how this parameter varied with different slurry compositions, the mass flow rate was measured for different soy protein/glycerol concentrations. For all soy protein concentrations, the mass flow rate increased and then decreased at temperatures between 40°C and 60°C (Fig. 2). This trend may be due to increasing mobility of protein chains as the temperature increases up to a solidification point, 37 after which the flow rate starts to decrease due to a greater resistance to flow as the slurry continues to solidify.38,39 The lowest flow rate for all temperatures was achieved with a slurry comprised of 20% soy protein and 4% glycerol slurry (Fig. 2).
To understand the molecular forces involved during printing for this system, DTT, a disulfide bond reducing agent, was added to 20% soy/4% glycerol slurries. The addition of DTT caused a lower mass flow rate, and the texture of the printed strands were smoothened (Fig. 3). This demonstrates that disulfide bonding is a significant molecular force involved in maintaining structural integrity in soy protein gels 40 and is needed to create stable and robust 3D plotted soy structures. The peak observed at 50°C in slurries with DTT may have been caused by relaxation of chains held together by hydrogen bonding and hydrophobic interactions, which are not affected by DTT. 40 The lower mass flow rates of slurries containing DTT is expected based on reptation theory 41 ; the proteins solubilize and unravel without disulfide linkages, 40 which allows for increased packing and entanglement of chains in a confined space (within the Bioplotting needle) causing a greater resistance to flow (Fig. 3A). Although there could be this increased entanglement of protein chains, the DTT-containing slurries could not solidify since the gelation mechanism of soy protein requires both physical and chemical crosslinks (dominated by disulfide bonding). 38
Important printing parameters, including printing speed, layer spacing, and printing temperature, were optimized for soy protein slurries to produce well-defined porous constructs. As mentioned previously, the relationship between the pressure and mass flow rate may shift along the pressure axis due to the varying slurry moisture content between batches. For instance, slurries with a slightly less moisture content would require greater pressure to achieve a flow rate of 0.0072 g/s. However, regardless of the pressure needed for extrusion, the mass flow rate necessary to produce optimal scaffolds remains constant in a narrow range. The soy protein was unable to be deposited onto the Teflon foil at pressures lower than optimal, and at higher pressures (even just 0.2 bars away from the optimal pressure), the strands overflowed into the pores (Fig. 4). These studies demonstrate that the printing speed and extrusion pressure are critical variables to adjust when plotting natural biopolymers. The proper method to optimize these parameters first requires the determination of a printing speed that allows for sufficient drying into a discernible layer without clogging the printing nozzle, while also limiting expansion of the printed strands. With a set speed, the pressure can then be adjusted for optimal strand formation. The flow rate at this optimal speed and pressure can be measured and maintained during all further scaffold printing processes to ensure reproducibility. This quality control method may also be applied to the plotting of other soft materials with similar viscoelastic and drying/solidifying properties into liquid medium or air.
To fabricate soy protein scaffolds with well-defined pores, the layer spacing during printing was set to be greater than the strand size (nozzle tip), since the material expanded laterally upon extrusion (Fig. 6A, B); layer spacing less than 250 μm would cause layers to congeal together. To avoid issues with uneven gelation, scaffolds were printed at 27°C, but could have been printed at room temperature or at 37°C, since the mass flow rate remained constant (Fig. 2). The ability to successfully print at these temperatures may allow for direct incorporation of growth factors and drugs within the scaffold struts during the printing process, as opposed to the more common method of postcoating the polymer struts with growth factors/drugs after fabrication.42,43 To increase stability of the strands upon printing, ethanol treatment was used to further dehydrate the proteins. Electrostatic interactions between the soy protein and PBS and media ions promote protein aggregation.38,40 Therefore, the scaffold structure is well maintained in physiologically relevant conditions 38 with minimal degradation observed after initial washing for up to 30 days (data not shown). The electrostatic interactions are necessary for the scaffold to retain shape, since noncrosslinked scaffolds dissolved when immersed in water.
Thermal and chemical post-treatments were applied to further increase scaffold robustness. Differences in structural and mechanical properties across the various post-treatments demonstrated the ability to tune the material properties of the printed soy protein scaffolds. The surface texture and scaffold size were the two main structural properties that underwent morphological changes. DHT treatment alone caused smoothening of microscopic texture through further molecular modifications; namely, formation of hydrogen and disulfide bonds under heat 40 (Fig. 5D). Shrinking of struts at the top of the scaffold also occurred with both FD-DHT and DHT groups (Fig. 6A), indicating that residual moisture retained before treatment could affect size. Uneven heating at the top and bottom of the scaffold could have also caused thicker strand thicknesses at the bottom. The trends in increasing crosslink density and mechanical properties with decreasing total mass loss corresponded across the nontreated, thermally treated, and chemically treated scaffolds as expected (Fig. 6). Freeze-drying before DHT significantly decreased the crosslink density, mass loss, and mechanical properties of the scaffolds compared to the DHT group, most likely due to the presence of pores within the struts after freeze-drying. Carbodiimide crosslinking that results in nonspecific peptide bond formation, created the highest crosslinked and therefore the most robust scaffolds. 35 The mechanical properties of the soy protein can be varied across 2 orders of magnitude up to appxoimately 4 kPa. The compressive modulus of Bioplotted soy scaffolds was greater than soy protein scaffolds produced only by freeze-drying (not Bioplotted), which has moduli of approximately 50 Pa. 24 90° scaffolds had greater compressive modulus compared to 45° scaffolds (Fig. 6), which coincides with previously reported studies. 44 The trend of increased mechanical properties for 90° scaffolds is more prominent for the more robust DHT and EDC scaffold groups. In particular, the average compressive modulus for the 90° scaffolds in the DHT group was significantly higher than the average for the 45° scaffolds. This may be due to the ability for greater evaporation of residual moisture (resulting from increased heat flux through the open pores) in the 90° scaffolds during DHT treatment leading to a greater bonding at the junctions, resulting in a significantly higher mechanical strength in this geometry. The structural geometry did not affect the relative density of crosslinks or the total mass loss (data not shown).
The 45° scaffolds were chosen as an initial geometry for exploring cell attachment on soy scaffolds since limiting the amount of through pores has been shown to increase seeding efficiency. 45 The seeding efficiencies were in similar ranges as reported with other Bioplotted scaffolds (between 25% and 45% 45 ). The seeding efficiency may be further improved by exploring geometries with greater overlap of strands. Freeze-drying with DHT decreased the seeding efficiency due to the increase of small pockets or voids not large enough for cells to infiltrate, which decreased the available surface area for cells to attach. Seeding efficiency was also lower for EDC scaffolds likely due to reduced availability of epitopes for cell binding after crosslinking, which is confirmed by inability for cells to spread when attached to the surface (Fig. 7F). However, rounded cell morphology did not prevent cells from proliferating in the EDC group. Significant proliferation was observed for FD-DHT and EDC groups, and cell viability was maintained across the NT and DHT groups. DHT modification of the soy protein scaffolds maintained cell viability, but resulted in limited cell proliferation. This result implies that although the seeding density was lower for the FD-DHT and EDC groups, the cell density was still sufficient to support cell growth. At both days 1 and 7, the cells for all scaffold groups were homogeneously scattered throughout the entire scaffold structure. Differences in adhesion and proliferation between the nontreated and DHT-treated scaffolds are therefore likely due to different cell–surface interactions, mechanical, and degradation properties and not due to the dispersion of cells within the scaffold. Further studies are necessary to better understand how the physical and chemical changes resulting from these postprocessing procedures affect cell behavior.
The results from these studies demonstrate that reproducible 3D soy protein scaffolds can be fabricated via 3D Bioplotting. The slurry flow rate was determined to be an important parameter that could be used to predict the printability of soft materials, as well as serve as a measurement for quality control purposes. The ability to print the soy protein is particularly advantageous since the processing can be done at either room temperature or 37°C without the use of organic solvents, allowing for the possibility of incorporating drugs or growth factors during the printing process. Future work will involve characterizing the functionality and differentiation of hMSCs seeded on the Bioplotted soy scaffolds to further establish the bioactivity and applicability of soy protein implants for tissue engineering and regenerative medicine applications.
Footnotes
Acknowledgments
This work was funded with a National Science Foundation Graduate Research Fellowship awarded to Karen B. Chien. The soy protein was obtained from Solae LLC as part of a Materials Transfer Agreement; Solae performed the combustion test to determine the protein content. The authors thank Peiqi Zhang and Dr. David Dunand for support and use of the helium pycnometer. The authors would also like to acknowledge Adam Jakus for support on CAD work. Northwestern University Electron Probe Instrumentation Center graciously provided sample preparation and SEM facilities. The Equipment Core Facility of the Institute of BioNanotechnology in Medicine at the Northwestern University provided the lyophilizer, critical point drier, and the spectrophotometer for the DNA quantification assay. The U.S. Army Research Office, the U.S. Army Medical Research and Material Command, and the Northwestern University provided funding to develop this facility.
Disclosure Statement
No competing financial interests exist.