




Abstract
Human epithelial cell culture models of monolayer Caco-2 cells have been widely employed to assess the absorption of drug molecules across intestinal mucosa. However, cautions should be taken when interpreting the conclusions from those models due to their undesirable phenotype and functionality when compared with the native intestinal tissue. In the present study, an improved, more physiologically relevant three-dimensional (3D) culture model of the intestinal mucosa was developed to study drug absorption, in which a coculture of epithelial cells, including Caco-2 cells and HT29-methotrexate cells, was indirectly seeded on a Transwell filter insert with collagen gel and stromal cells (fibroblasts and immunocytes) incorporation. This setting-up provided a compatible environment to improve the phenotype and functionality of the epithelial cells. Compared with the monolayer culture of Caco-2 cells, the reconstructed 3D model displayed more physiologically relevant characteristics evidenced by its decreased TEER value and mucus-like layer formation. A decreased expression of P-gp and an increased expression of BCRP were also observed in the current 3D culture model, leading to a changed secretory permeability of their substrates. More importantly, an improved correlation (R2=0.843) was obtained between the absorptive permeability across the 3D coculture model and the human absorption fraction especially for those model compounds with moderate or high permeability. Thus, this engineered 3D coculture model presents a unique, improved opportunity to evaluate drug permeability in vitro.
Introduction
To date, investigations of drug absorption have often utilized in situ or in vivo animal models or ex vivo transport models with an intestinal sheet or a brush border fraction. 2 These models provide enterocytes with many physiological cues, including pH, GI motility, metabolism enzymes, as well as transporters, which are important to obtain more biologically relevant data on drug absorption evaluation. 2 However, due to the complex in vivo environment and difficulty in quality control, detailed mechanistic studies are difficult to interpret in those animal models. 4 In addition, the tissue microenvironment is of murine origin rather than human; subtle, but non-negligible changes persist that impact enterocyte behavior, hence, caution should be taken when extrapolation of data from animal models. 4
Several cell-based models under two-dimensional (2D) conditions in vitro have been developed to better predict drug intestinal permeability and fraction of oral dose absorbed in humans. 5 Specifically, the Caco-2 cell monolayer has been widely accepted by pharmaceutical companies and regulatory authorities as a standard screening assay mainly due to its advantageous differentiation similar to the intestinal absorptive enterocytes. 6 However, it should be noted that these stationary 2D cell cultures recapitulate neither the tissue architecture of the mucus layer nor the interactions between the epithelium and the stroma in intestinal mucosa. This is most important because such interactions involved in tissue microenvironment play a dominant role in determining the phenotype and functionality of enterocytes, and consequently affecting the process of drug absorption. For instance, it has been reported that Caco-2 cells form more stringent tight junctions than those found in the human intestinal epithelium, leading to a lower level of paracellular permeability. 7 In addition, the P-glycoprotein (P-gp) efflux pump is overexpressed in Caco-2 cells compared to the level measured in vivo with primary small intestinal enterocytes, which to some extent enhances the transport activity of the epithelium significantly during drug absorption. 8 Therefore, it is apparent that although it remains important, the Caco-2 monolayer model has its own unique limitations when used for drug absorption evaluation.
An enormous potential exists in the use of three-dimensional (3D) culture models as surrogates for intestinal mucosa tissues, because these culture systems provide not only 3D architecture for cell growth, but also cell–cell and cell–extracellular matrix (ECM) interactions, making them possible to better mimic in vivo tissue microenvironment.9,10 In fact, a number of simple yet effective 3D cell culture systems of different tissues have been established by using tissue-engineering techniques for those studies on developmental biology, replacement therapy, or even drug toxicity evaluation.11–14 However, few studies have focused on reconstructing the 3D culture model of human intestinal mucosa tissue to improve the current model system of drug absorption. It has been well known that human intestinal mucosa consists of three layers, that is, the epithelial layer, lamina propria (connective tissue containing blood and lymphatic vessels), and muscularis mucosae. 4 Specifically, enterocytes and goblet cells are two major cell types in the epithelial layer and account for the majority of absorption in the human small intestine. 15 Moreover, goblet cells are capable of mucin secretion to form a mucus layer covering the intestinal epithelium. 16 Thus, any drug molecules absorbed into the bloodstream are supposed to pass through that complex epithelial barrier. 4 On the other hand, stromal cells such as fibroblasts, endothelial cells, or immunocytes involved within the connective tissue of lamina propria should also be taken into account when assessing the model system of drug absorption due to their indispensable role in regulating epithelial cell behavior. 16 To our knowledge, only one recent study by Leonard et al. 17 reported a 3D coculture of enterocytes, monocytes, and dendric cells to model inflamed intestinal mucosa in vitro, allowing the mimicking of pathophysiological changes occurring in vivo in the inflamed intestine. Nevertheless, there is no suitable in vitro 3D model of the intestinal barrier till now to assess the absorption of drug molecules across healthy intestinal mucosa, despite those reports on the development of optimized 2D Caco-2 cells monolayer models with other stromal cells (HT29-methotrexate [MTX] cells, nerve cells, Burkitt's lymphoma Raji B cells, etc.) incorporation,15,18–20 while neither the 3D architecture nor the ECM were presented.
In the present study, an improved 3D coculture model of human intestinal mucosa was developed, in which human intestinal epithelial cells (IECs, Caco-2 cells, and HT29-MTX cells) and prominent stromal cells (fibroblasts and immunocompetent macrophages) are involved with collagen (a major structural component of the ECM in native small intestinal mucosa) incorporation. We hypothesized that IECs growing in a 3D microenvironment provided by the stromal cells and the ECM would generate intestinal tissue-like structures that would more closely resemble the morphology and function of the native intestinal mucosa. The 3D coculture model was characterized by morphology and function, and a correlation between absorptive permeability of the model compounds across the 3D coculture model and their absorption fraction in the human body was also evaluated. It is evidenced that this improved 3D intestinal mucosa model is more physiologic, functional, and reproducible, building up a bridge between the classical in vitro Caco-2 cell monolayer and the in vivo animal model in the field of drug absorption evaluation.
Materials and Methods
Cell maintenance culture
Human colon adenocarcinoma cells Caco-2 (passage 45–55; ATCC HTB-37) were grown in the high-glucose Dulbecco's modified Eagle's medium containing 10% fetal bovine serum (FBS), 1% nonessential amino acid (all from Invitrogen), and 1% penicillin/streptomycin (P/S; from Hyclone). Human colon adenocarcinoma cells HT-29 (ATCC HTB-38) were cultured in the McCoy's 5A medium (Invitrogen) containing 10% FBS and 1% P/S solution. Primary mouse embryonic fibroblasts (MEFs, P0) were isolated from mouse embryos as described before. 21 Cells were cultivated in the RPMI 1640 medium (Invitrogen) with 10% FBS and 1% P/S supplement. To improve the quality control of the experiments, only the MEFs with low passage number (P0-P3) were utilized for the 3D coculture. Human monocytic cells THP-1 (ATCC TIB-202) were grown in the RPMI 1640 medium containing 10% FBS and 1% P/S. THP-1 cells were transformed to an adherent macrophage phenotype by resuspending in the RPMI 1640 medium, supplemented with 100 nM phorbol 12-myristate 13-acetate (PMA; Sigma), and seeded at a density of 4×10⁵ cells per well (12-well plate). These cells were then cultured at 37°C for 24 h, during which time, the THP-1 cells adhered to the surface of the wells and were termed “macrophages”. 22 Thereafter, the THP-1-derived macrophages were cultured as THP-1 cells. All the cells were cultivated at 37°C in a 5% CO2 and 95% humidity environment. They were subcultured when they reached 90% confluence and the medium was refreshed every other day.
HT29 cell inducement with MTX
Mucus-secreting cells HT29-MTX, a subpopulation of HT29 cells resistant to MTX, have been generally accepted to mimic the goblet cells in native intestinal mucosa. HT29-MTX cells were obtained through inducing HT29 cells with MTX according to the methodology described by Thécla Lesuffleur. 23 Briefly, HT-29 cells were stepwise adapted to grow in an exponentially increasing concentration (10−7M and 10−6M) of MTX (Sigma). After 3 months of induction with MTX, the stepwise-adapted cells were almost exclusively differentiated into mucus-secreting cells evidenced by mucus qualitation and quantification assay.
Three-dimensional cell culture and TEER measurement
MEFs dispersed in a 1.5 mg/mL type rat tail collagen solution (BD Biosciences) were pipetted onto the top of Transwell filter inserts (Cat. No. 3460, Corning) with a final concentration of 1×10⁵ cells/mL. After gelation at 37°C for 2 h, a mixed Caco-2 (1×10⁵ cells/12-well) and HT29-MTX cell suspension (1.1×10⁴ cells/12-well) was added onto the formed collagen gel to keep the final ratio of 9:1. The coculture was cultivated with the Caco-2 medium in the apical compartment and the MEF medium in the basolateral compartment. After 14 days, the setting-up was transferred into a 12-well receiver plate preseeded with THP-1-derived macrophages, which by then had adhered to the base of the well. After cultivation for another 5–7 days, the coculture (Supplementary Fig. S1a; Supplementary Data are available online at
Hematoxylin and eosin staining
Samples were fixed with 4% paraformaldehyde overnight, followed by washing three times with phosphate-buffered saline (PBS). The paraffin-embedded sections (5-μm thickness) were prepared by the 2nd Medical Center of Dalian Medical University (Dalian, China) and stained with hematoxylin and eosin dyes (H&E; EMD Chemicals). Images were captured using an Olympus culture microscope (CKX41).
Scanning electron microscopy
Samples were fixed with 2.5% glutaraldehyde overnight. The fixed samples were then postfixed with 1% osmium tetroxide (EM Sciences) for 2 h, and dehydrated in a series of graded ethanol (30%, 70%, 95%, and 100%, v/v) before critical point drying. The dried samples were then mounted on stubs with double-stick tape, sputter coated with a gold–palladium alloy, and examined using a scanning electron microscope (XL-30; Philips-FEI).
Cell viability and proliferation measurement
To evaluate cell viability in the 3D coculture, samples harvested were incubated with the calcein-AM/ethidium homodimer (EthD-1) solution (Molecular Probes) at 37°C for 1.5 h. After washed with PBS for 3 times, samples were then examined using a confocal laser scanning microscope (CLSM; Leica SP2). Only live cells are distinguished by the presence of a ubiquitous intracellular esterase activity that can digest nonfluorescent calcein-AM into fluorescent calcein emitting green fluorescence, whereas dead cells with damaged membranes allow the entrance of EthD-1 that produces a bright red fluorescence upon binding to nucleic acids.
Cell proliferation in monoculture and 3D coculture was determined by DNA content analysis as described in our previous study.24,25 Briefly, after harvesting all the samples at indicated time points (store at −80°C), the DNA content was measured using PicoGreen DNA Assay following the protocols provided by the manufacturer (Molecular Probe). Samples (n=3 per group in the same experiment, three repeats) were measured through a Hybrid multi-mode microplate reader (Synergy™ H1, BioTek® Instruments) at an excitation wavelength of 480 nm and an emission wavelength of 530 nm.
Mucus qualitation and quantification assays
For mucus staining with Alcian blue, cultures (at 20 days) were fixed with 4% paraformaldehyde for 30 min followed by adding 5 mg/mL of the Alcian blue solution (Amresco). After incubation for 30 min at room temperature, the excessive Alcian blue solution was removed thoroughly through PBS rinsing for several times. These samples were then observed under the phase-contrast microscope and images were captured with Olympus DP72.
The periodic acid/Schiff method was utilized to assay the amount of the main mucus glycoprotein mucin in the cultures as described by Mantle and Allen. 26 Briefly, cells harvested were lysed with 1% Triton-X in PBS for 20 min at room temperature (200 μL/sample). They were then sequentially incubated with a 0.5% periodic acid solution and the Schiff reagent (Sigma) at 37°C for 2 h and 30 min, respectively. The OD values at 555 nm were measured using a microplate reader (Synergy™ H1, BioTek® Instruments).
Immunofluorescence staining
Immunofluorescence staining was used to determine the protein expression of the tight junction protein, ZO-1and the efflux transporter, P-gp in the 3D cocultures. Briefly, paraformaldehyde-fixed samples were washed thoroughly with PBS before they were treated with a 0.3% Triton-X-100 solution (Sigma) at room temperature for 1 h. After blocking with 1% bovine serum albumin (BSA; Sigma), samples were incubated with either mouse anti-human ZO-1 (1:100; BD Biosciences) or mouse anti-human P-gp (1:50; BD Biosciences) at 4°C overnight. After washing with PBS to remove the primary antibodies completely, they were then incubated with the FITC-conjugated goat anti-mouse IgG (Sigma) for around 2 h. Cell nuclei were counterstained with propidium iodide (PI, 5 μg/mL; Invitrogen). The 2D monoculture with a similar treatment served as control. All the samples were finally mounted onto coverslips and images were captured with CLSM SP2.
Real-time quantitative reverse transcription–polymerase chain reaction analysis
For related gene expression analysis by real-time reverse transcription–polymerase chain reaction (RT-PCR), total cellular RNA from the sample harvested was extracted using the RNAiso Plus reagent (Takara) following the supplier's instruction, and the total RNA concentration was determined by spectrophotometric analysis at 260 nm. A portion of 500 ng RNA was subjected to reverse transcription in a 10 μL reaction mixture using the RT-PCR kit (Takara). After synthesis of cDNA, real-time PCR was conducted with SYBR® Premix Ex Taq™ II Kit (Takara) to detect transcript levels of MDR1(P-gp), BCRP, MRP2, and OATP1A2. The primer sequences for real-time PCR are listed in Table 1.27–30 Data were analyzed with Applied Biosystems StepOne™ Real-Time PCR System software version2.0 (Applied Biosystems). The relative expression level for each target gene was normalized by the CT value of the human housekeeping gene β-actin (2ΔCT formula). Each sample was analyzed in triplicate.
Measure permeability through transport experiment
To compare the transport function between the constructed 3D coculture and 2D monoculture, marker compounds (all from Sigma) that are commonly used to determine paracellular or transporter (P-gp, BCRP or MRP2)-mediated transport were assayed, respectively. Permeability of a series of model compounds (all from Sigma) with low, moderate or high permeability was further evaluated as described in our previous study.
31
Briefly, cultures after 3 weeks of cultivation were gently rinsed twice followed by a preincubation with a transport buffer (the Hank's balanced salt solution, HBSS) at 37°C and 5% CO2 for 15 min. Then, the experiment was initiated by replacing the transport buffer in the donor side with the model compound dissolved in HBSS. About 100 μL of each sample was taken from the receiver compartment at predetermined time points followed by an equal volume (100 μL) of prewarmed HBSS supplement to maintain a constant volume. All the samples harvested were stored at −20°C until their analysis with liquid chromatography. With respect to the sample assay, samples diluted with methanol at a ratio of 1:1 (v/v) were centrifuged at 14000 r·min−1 for 15 min before their loading into an ultrafast liquid chromatography (UFLC; Shimadzu) with diode array detection. The amount of fluorescein in the samples was measured using Hybrid multi-mode microplate reader (Synergy™ H1, BioTek® Instruments) at an excitation wavelength of 488 nm and an emission wavelength of 530 nm. To check the mass balance, recoveries of those model compounds were measured at both sides of the insert, respectively. TEER values were monitored before and after the transport studies to ensure the integrity of the 3D coculture and 2D monoculture. Apparent permeability coefficient (Papp) of a compound was calculated according to the following equation
32
:
where Papp is the apparent permeability coefficient (cm/s), ΔQ/Δt is the permeability rate (μmol/s), A is the diffusion area of the coculture or monoculture (cm2), and C0 is the initial concentration of the substance in the donor compartment (μM).
Data analysis
All reported values were averaged (n=3 repeats except for specific experiments where explanations are provided) and expressed as mean±standard deviation (SD). Statistical differences were determined by the Student's two-tailed t test and differences were considered statistically significant at p<0.05.
Results
Morphological characteristics of the 3D coculture
After 3 weeks of cultivation, a dense monolayer composed of Caco-2 cells and HT29-MTX cells was generated on the surface of the MEF-embedded collagen (Fig. 1b, c). This is similar to the morphological profile exhibited by the monoculture of Caco-2 cells in the Transwell insert (Fig. 1a). A detailed growth profile of the 3D coculture was revealed by H&E staining, where an intact monolayer of the epithelial cells (Caco-2 cells and HT29-MTX cells) was constructed on top of the ECM layer (collagen) containing visible stromal cells (fibroblasts) (Fig. 1d). This organization is somewhat like the tissue structure of the native small intestinal mucosa especially the the intestinal villi structure, in which both the epithelium and connective tissues underneath (named lamina propria) are presented (Fig. 1e). The SEM image further displayed the uniform topology of the epithelial layer, supporting the intercellular tightness of the epithelial cells of the constructed 3D culture model (Fig. 1f).
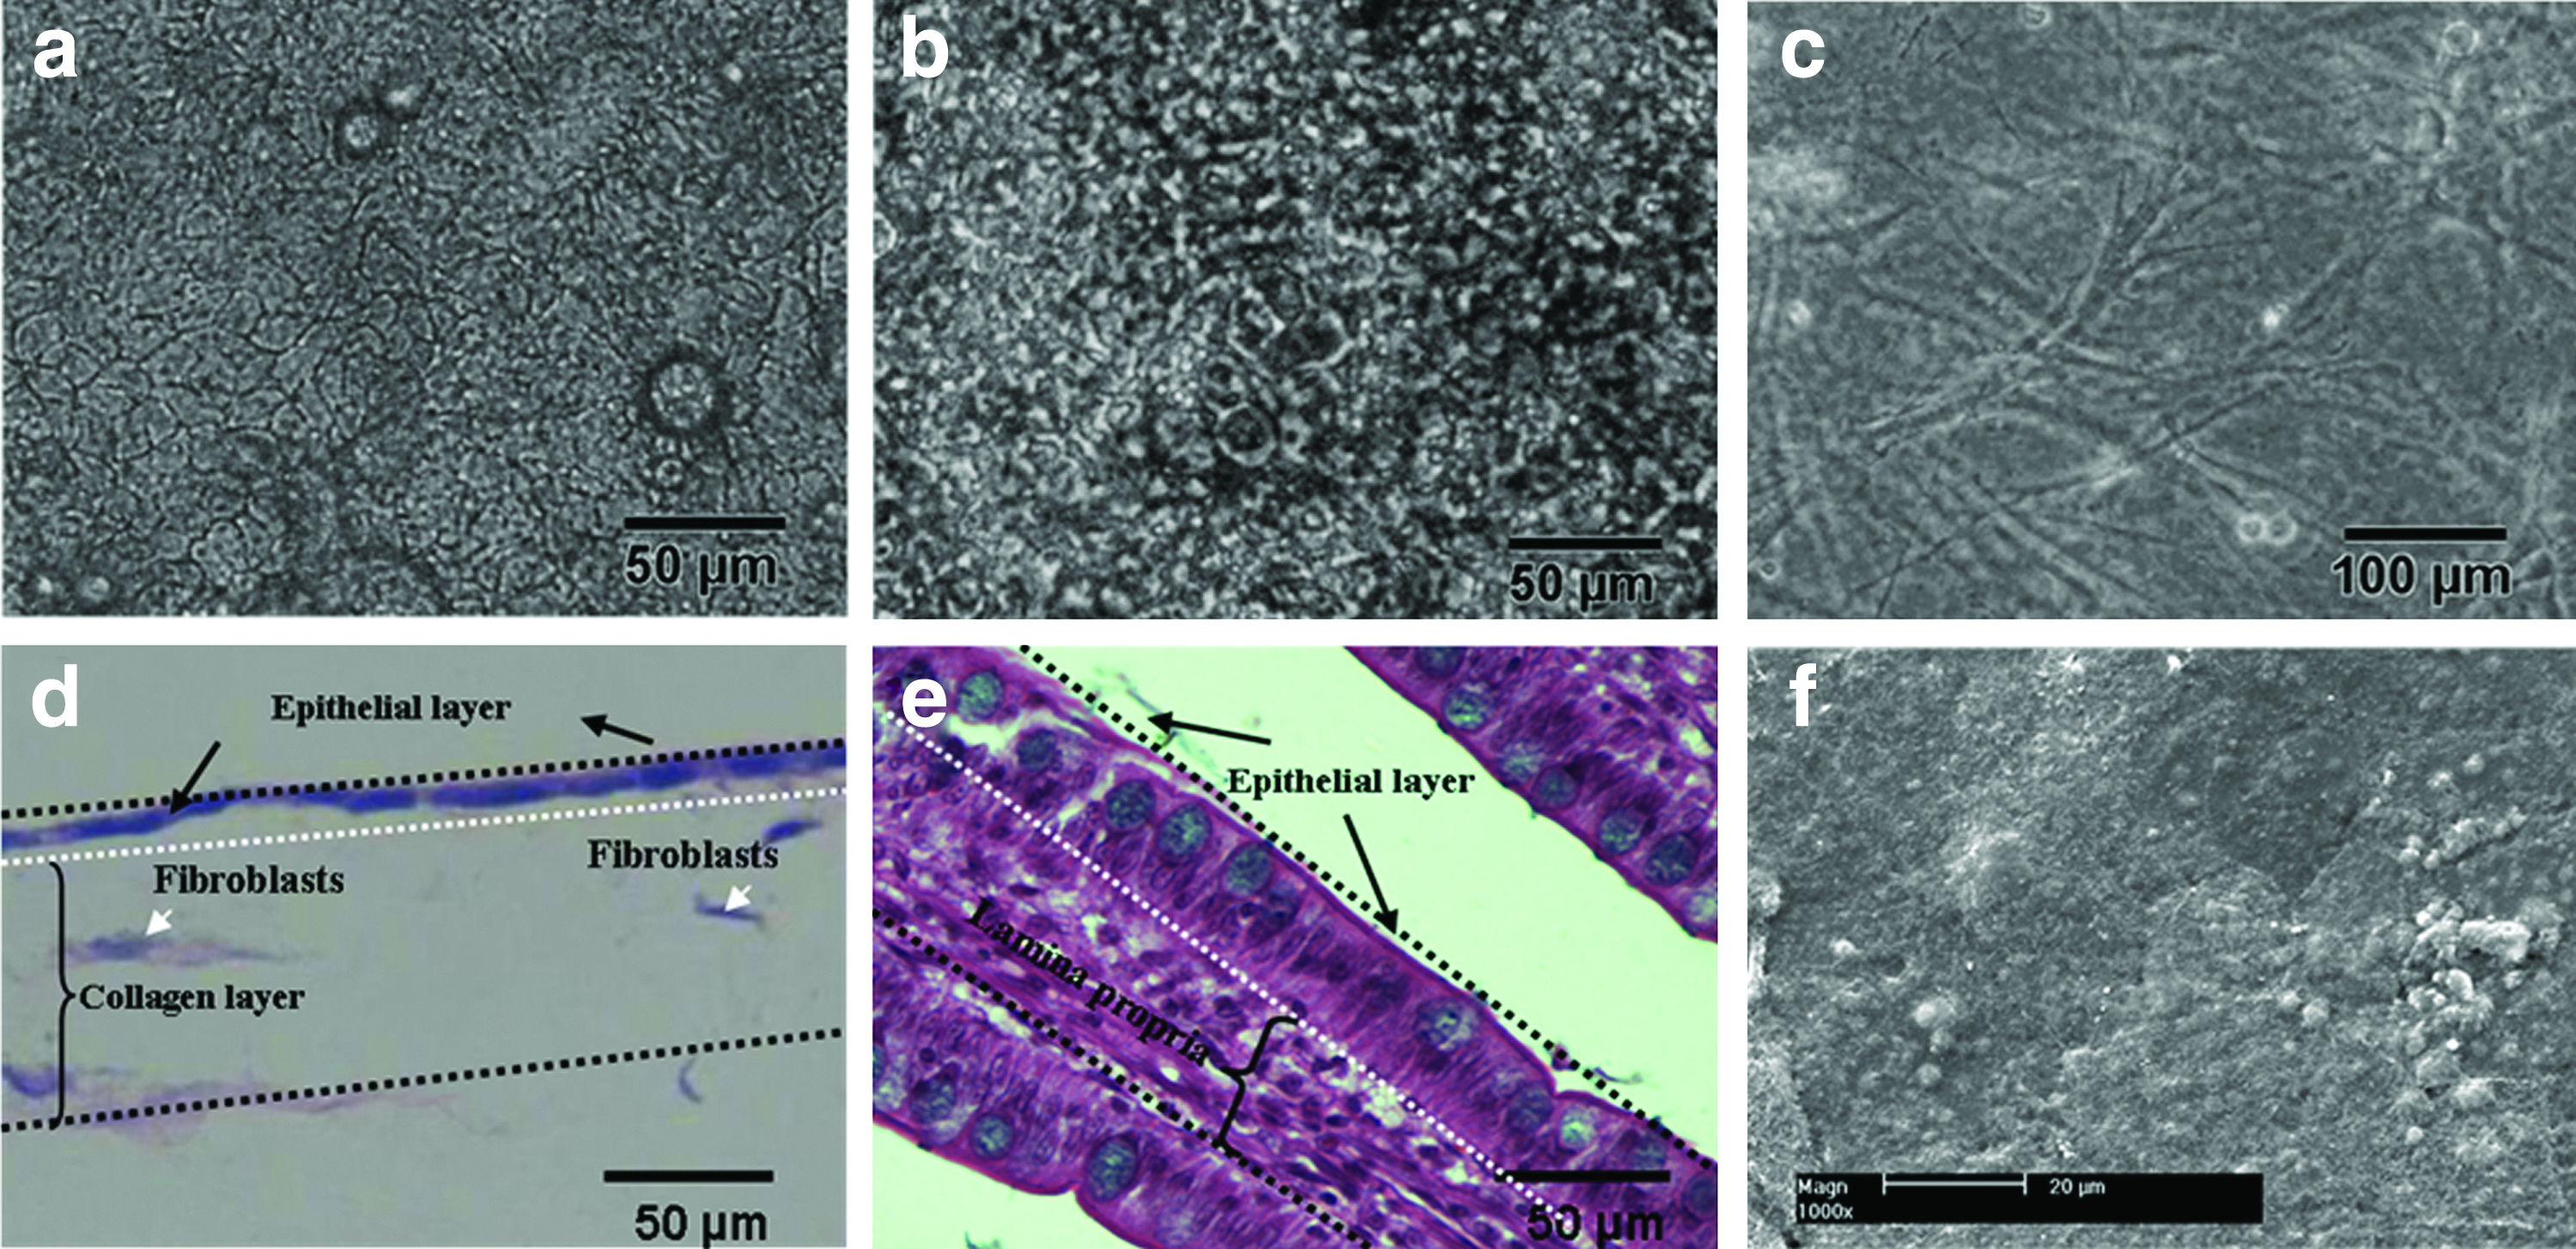
Morphological characteristics of the three-dimensional (3D) coculture (day 20). Similar to the monoculture of Caco-2 cells in the Transwell insert
Viability and proliferation of IECs and MEFs in 3D coculture model
Live/Dead staining calcein-AM/EthD-1 staining was applied to evaluate the cellular viability of the 3D model. As shown in Figure 2a and b, both IECs and MEFs in collagen gel displayed good viability after 3 weeks of cultivation. This suggests that the 3D coculture model developed in this study provides a suitable microenvironment for IECs and stromal cells growth. The growth curve assayed by the DNA content measurement (Fig. 2c) provided further evidence for the 3D culture compartment in supporting cell proliferation, in which the DNA content of the cells (including IECs and MEFs) increased progressively during the first 10 days of cultivation. In contrast, 2D monocultures reached a peak level after 7 days of culture, which is much earlier than the 3D cocultures. In addition, it seemed that the proliferation rate of cells in the 3D model during the first week was much higher than that at any other indicated time points. After the culture, for up to more than 2 weeks in vitro, decreased cellular proliferation was observed, evidenced by the decreased DNA content.
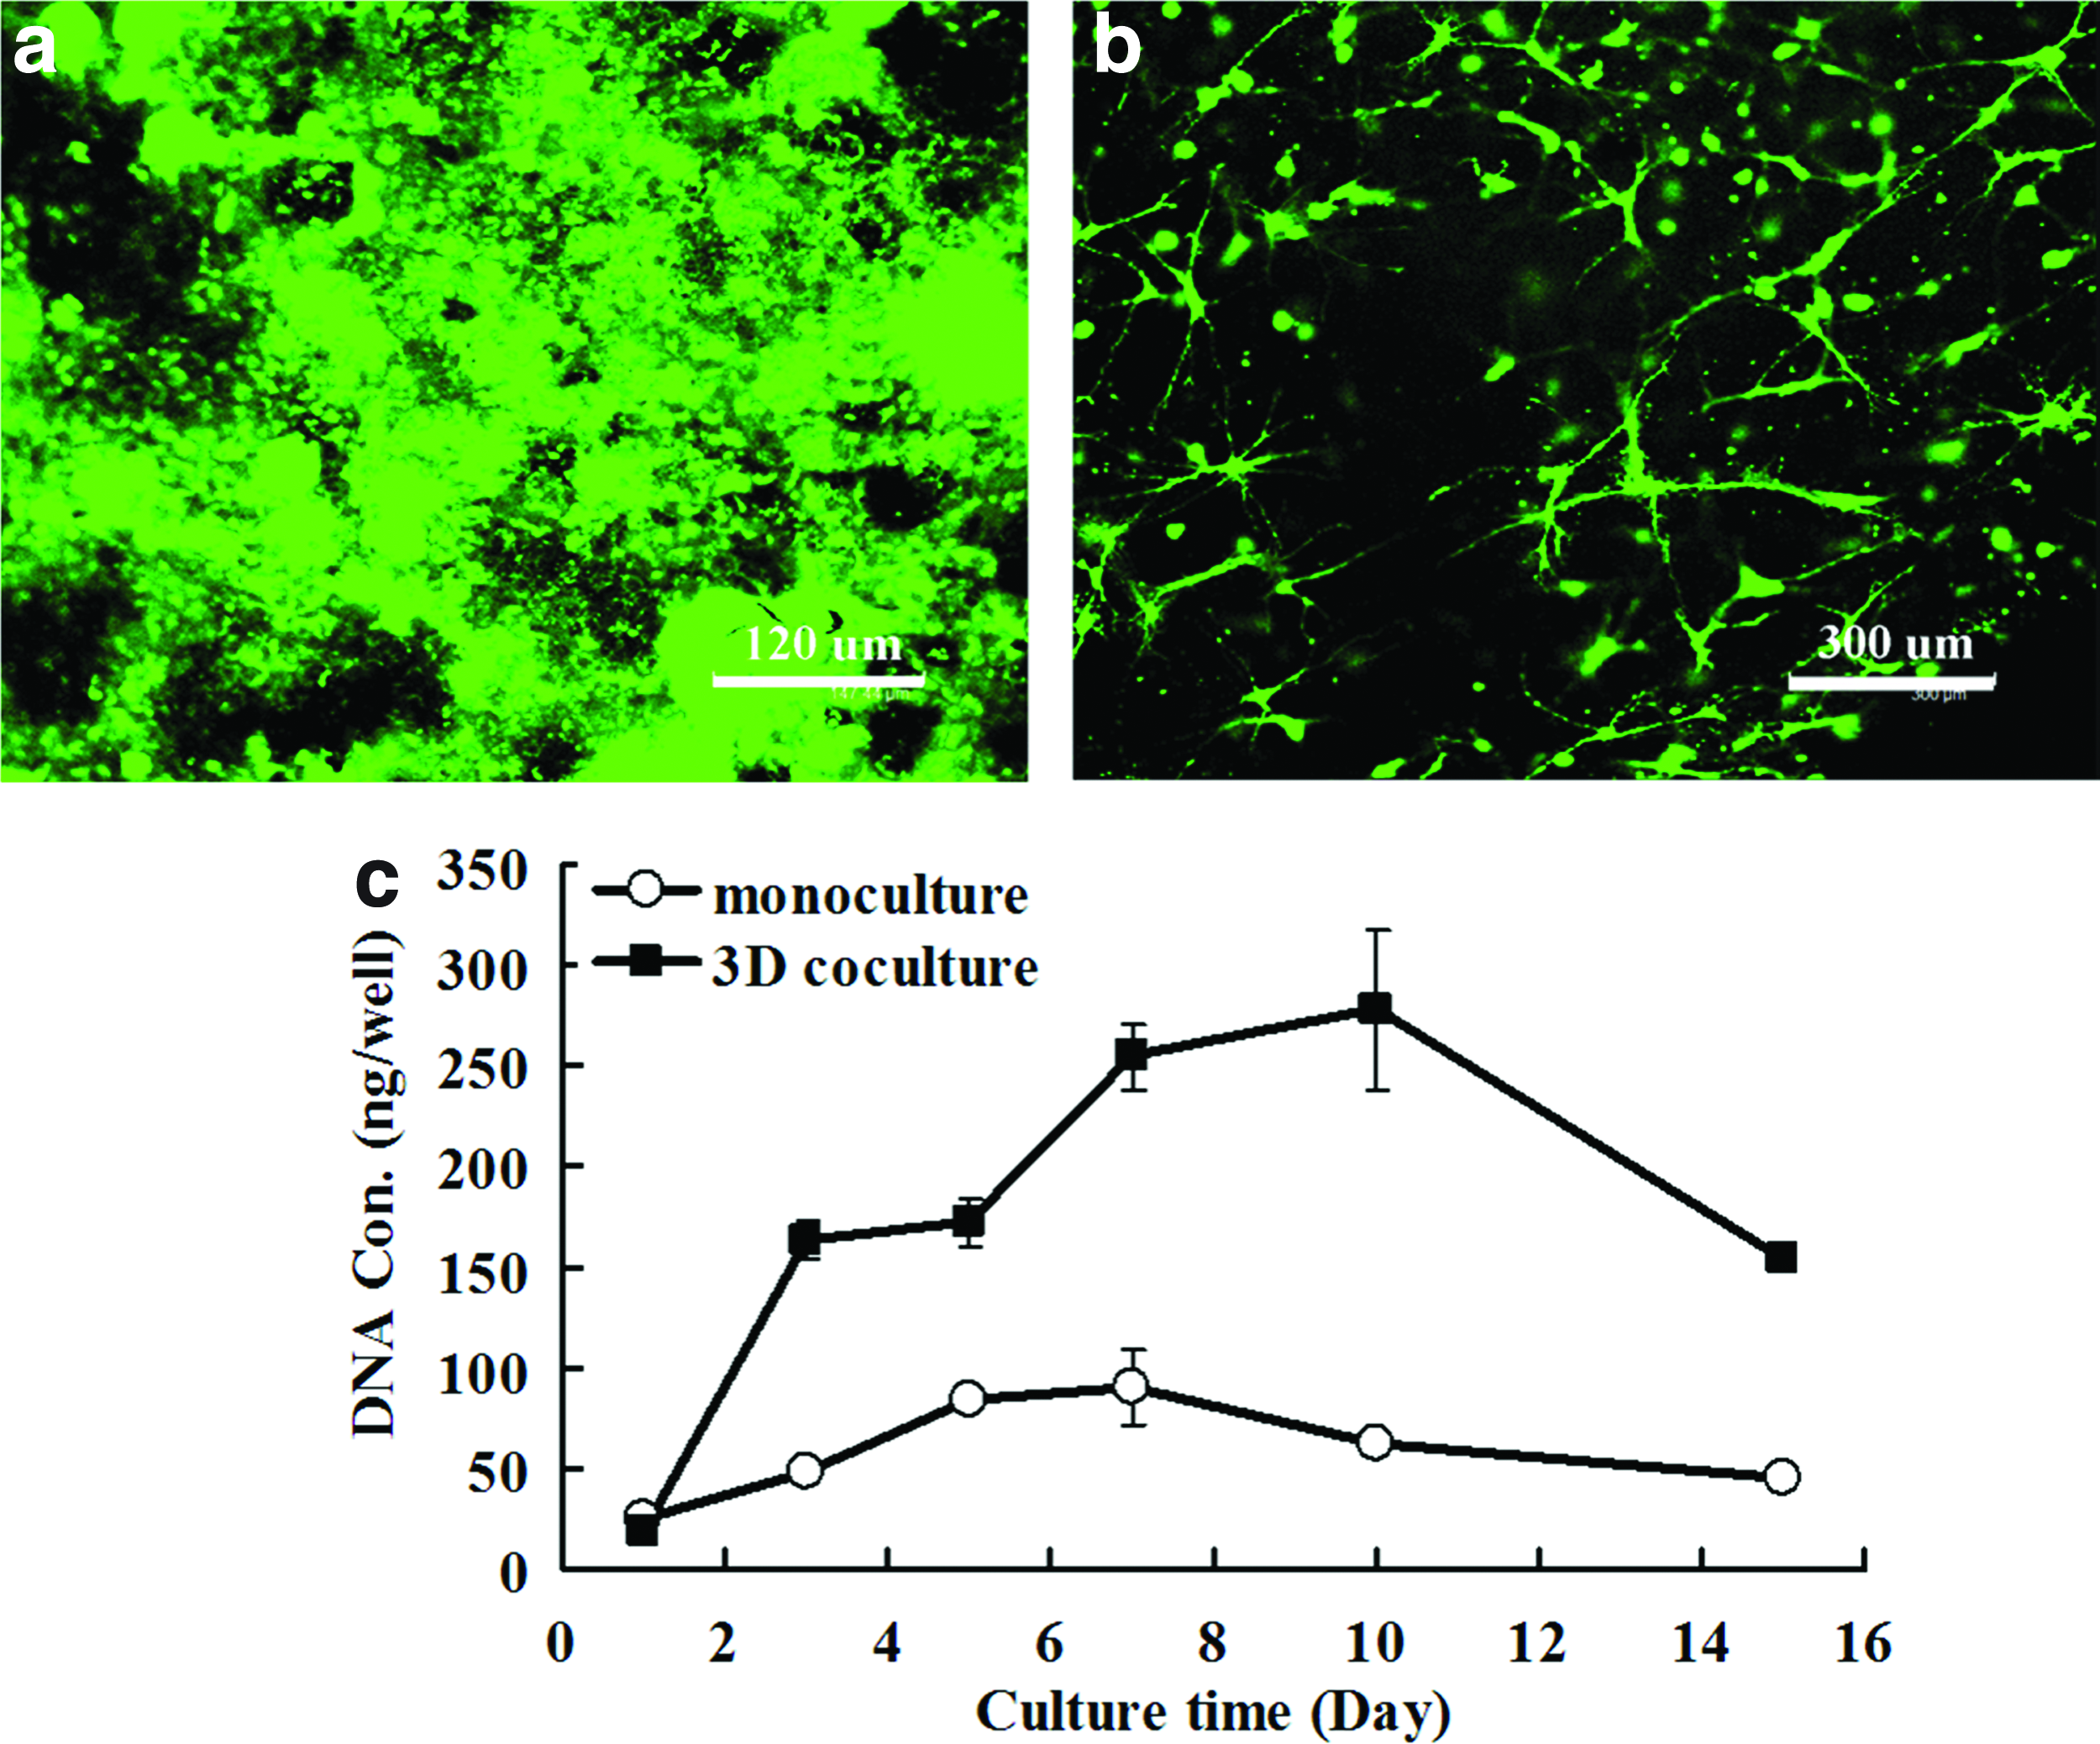
Characterization of the 3D coculture model
Mucus secretion of HT29-MTX cells in 3D coculture model
MTX-resistant HT-29 cells were obtained through 10−6M MTX inducement for months, as evidenced by their functionality of mucus secretion detected with Alcian blue staining. As shown in Figure 3a, compared with the 2D monoculture, more dense staining of mucus was observed on the surface of 3D coculture after 3 weeks of cultivation. Quantification analysis through periodic acid/Schiff staining further supported the enhanced secretion of mucus in MTX-resistant HT-29 cells, in which the level of mucus secretion in 3D cocultures increased up to four times of the monocultures (Fig. 3b).
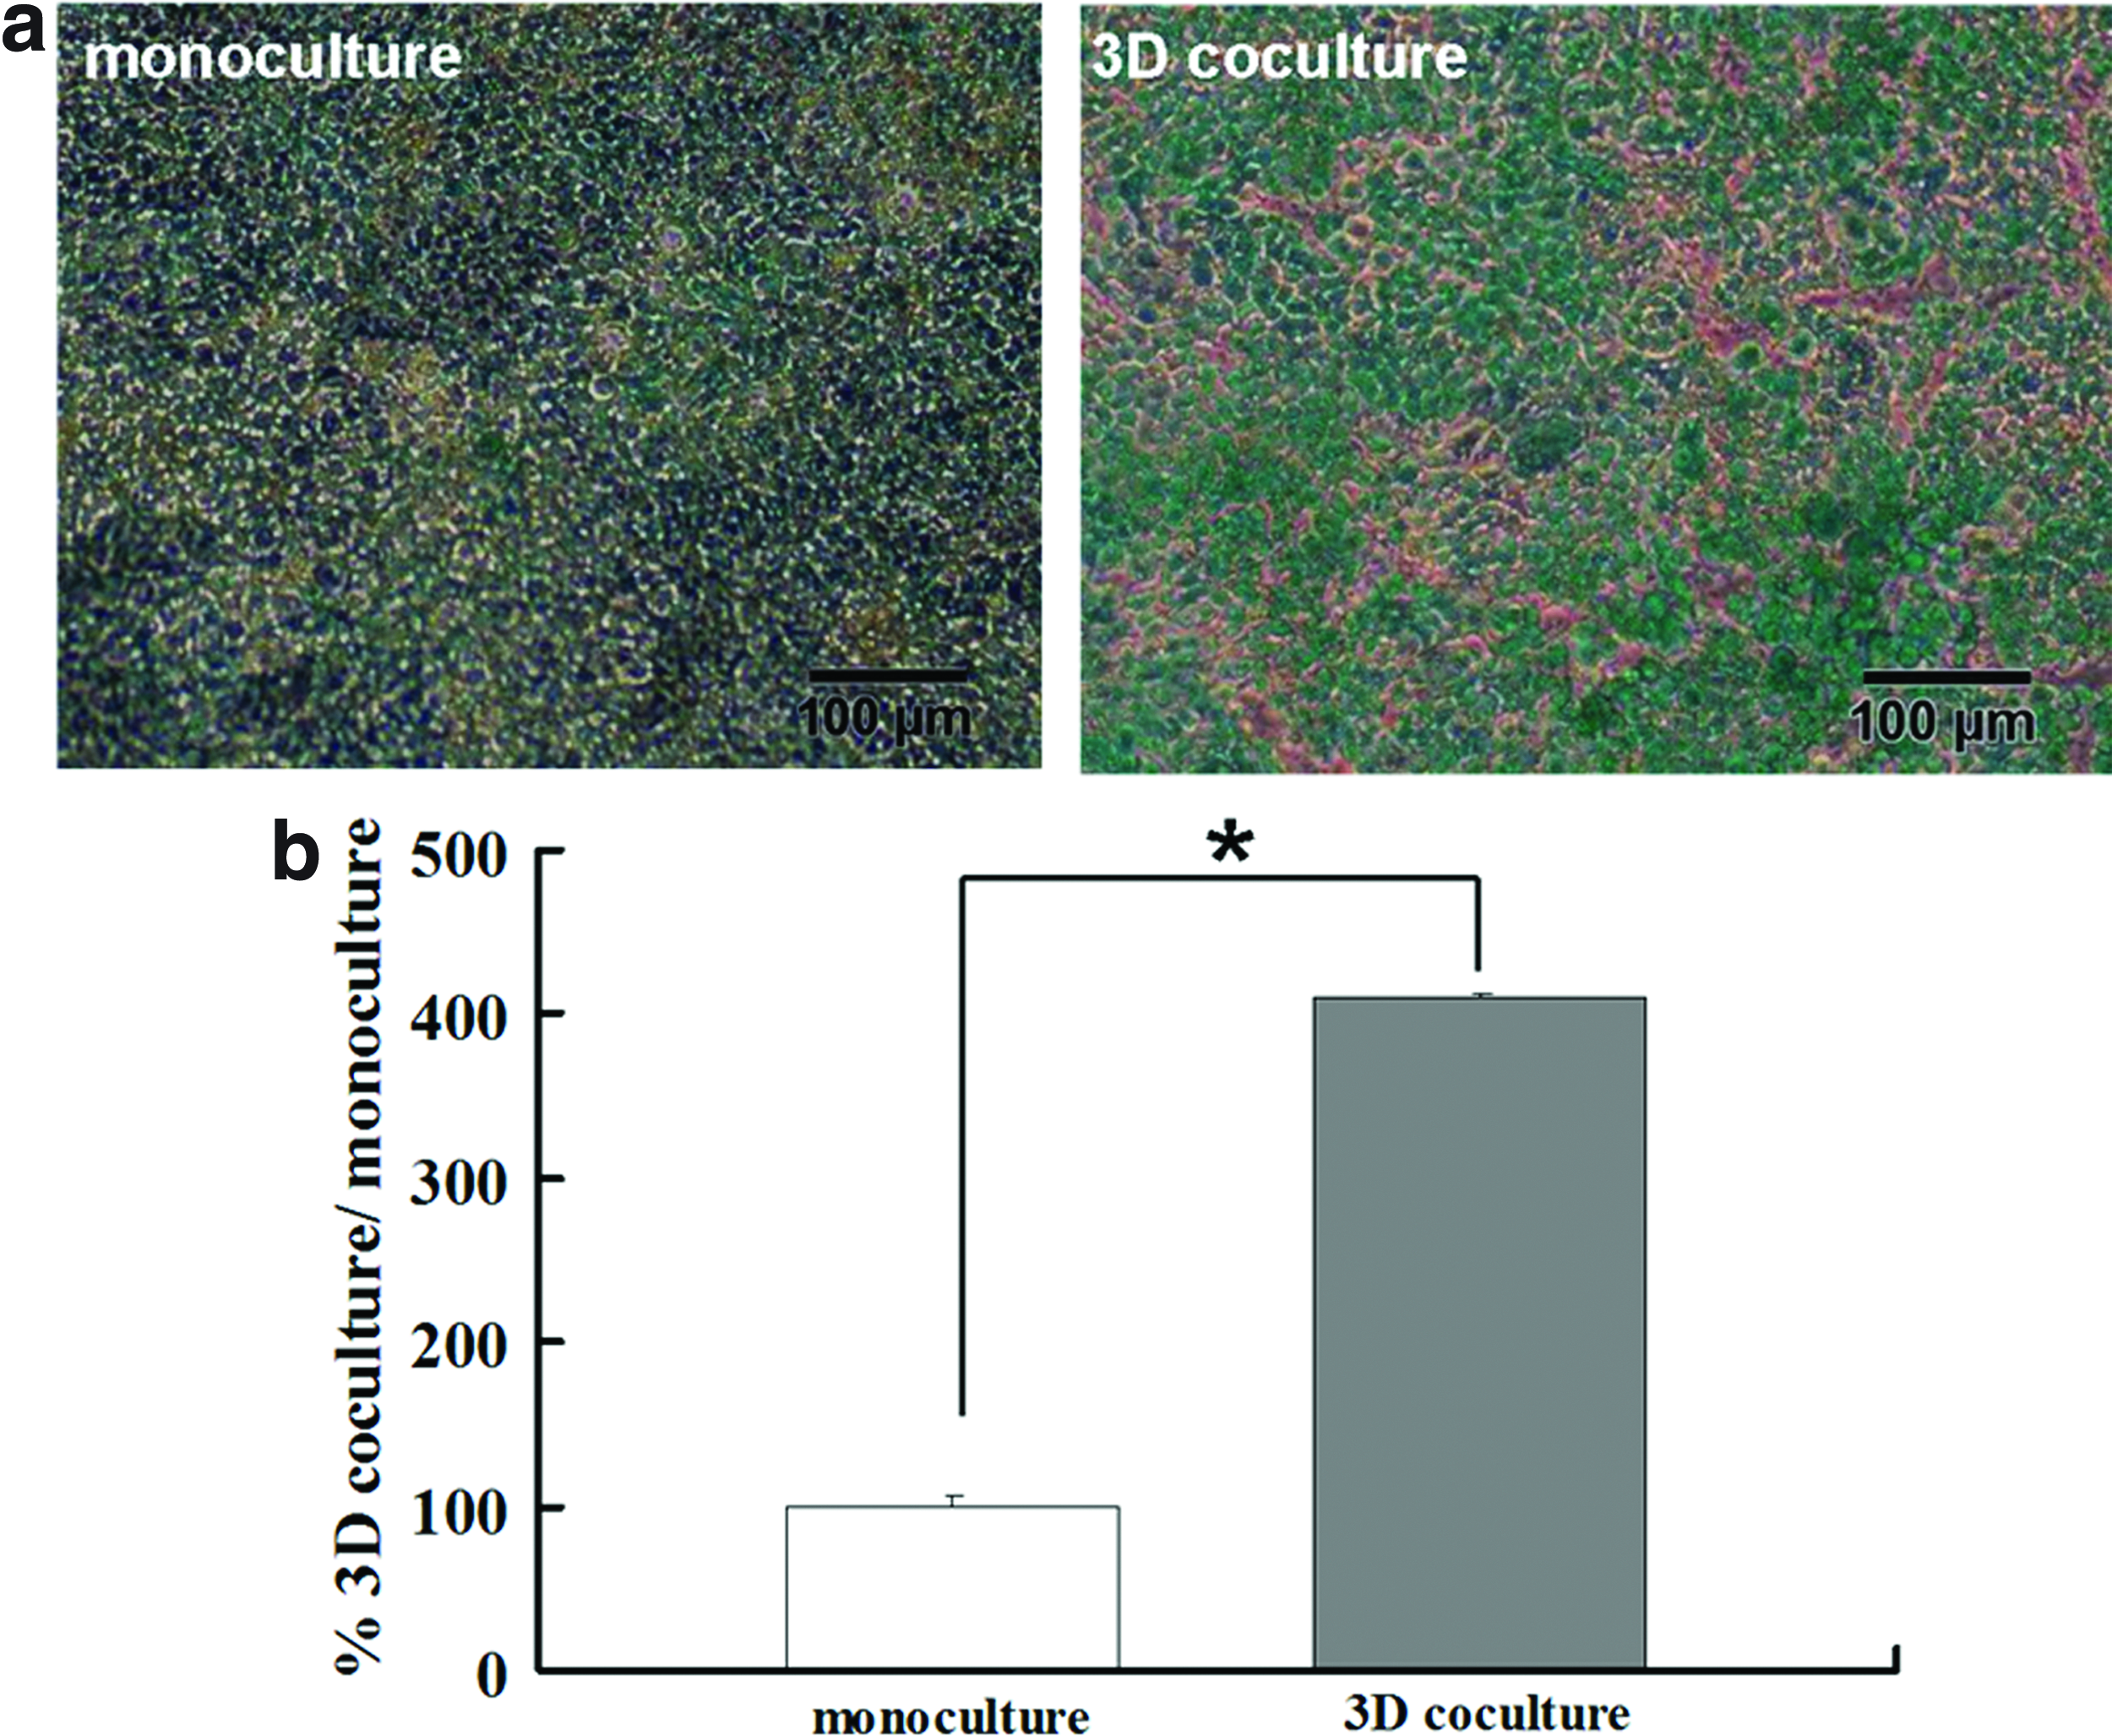
Immunostaining of ZO-1 and P-glycoprotein (P-gp)
Expression of ZO-1, a tight junction protein as the essential pore forming part of the tight junctional complex in enterocytes, was evaluated by immunofluorescence staining. As shown in Figure 4, ZO-1 expression was relatively lower in the 3D coculture (Fig. 4b) when compared with the 2D monoculture (Fig. 4a). In addition, in contrast to the overexpressed P-gp, a membrane efflux transporter in the monoculture (Fig 4d), a decreased expression of P-gp was observed in the 3D coculture after 3 weeks of cultivation (Fig. 4e). This expression patter (either ZO-1 or P-gp) exhibited by the 3D coculture is somewhat like the native small intestine, in which a relatively lower level of ZO-1 and P-gp was observed (c and f ).
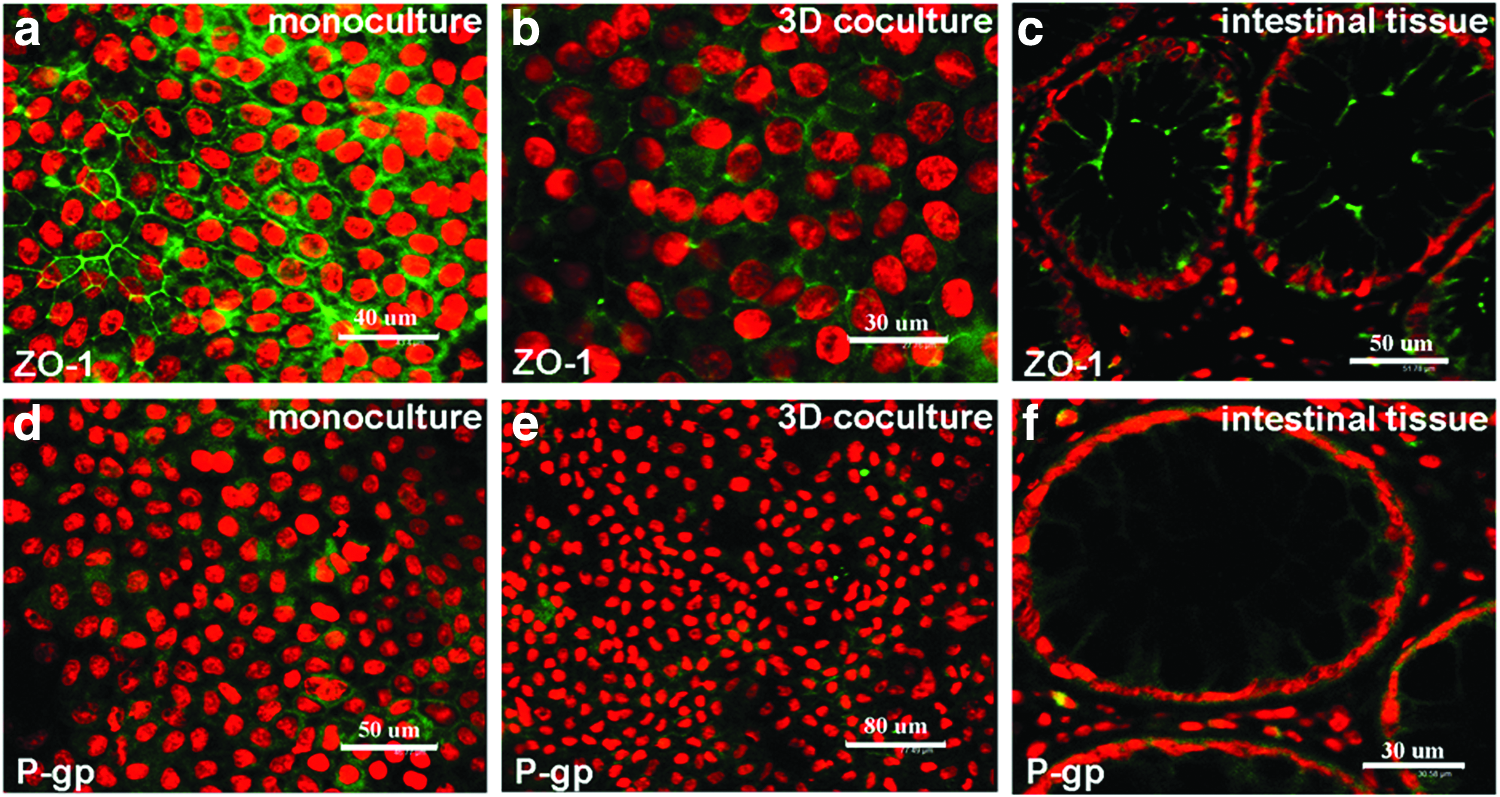
Immunostaining showed the protein expression of ZO-1 and P-gp in the monoculture, 3D coculture, and human small intestinal epithelial tissues. The cell nuclei were counterstained with propidium iodide. A lower ZO-1 expression level was observed in 3D coculture
TEER measurement and paracellular permeability evaluation
To monitor the change of TEER values during the cultivation, TEER values of both monocultures and 3D cocultures were measured, respectively, at indicated time points (Fig. 5a). It seemed that the TEER values of 3D cocultures increased more slowly relative to the 2D monocultures. In addition, the majority of TEER values of the 3D cocultures were significantly lower than those of the 2D monocultures throughout the cell culture in vitro, even though a slightly decreased value was observed in the monoculture group after 10 days of cultivation. This might be partly explained by the decreased expression of the tight junction protein as described above. A most significant difference between them was observed by the tenth day. However, it should be noted that in spite of their lower TEER values, the 3D cocultures after 16 days of cultivation were still capable of maintaining their TEER values at a level of more than 400 Ω·cm2 until their utilization for absorption evaluation. This highly suggests a desirable integrity of the epithelial layer generated by the 3D coculture compartment.
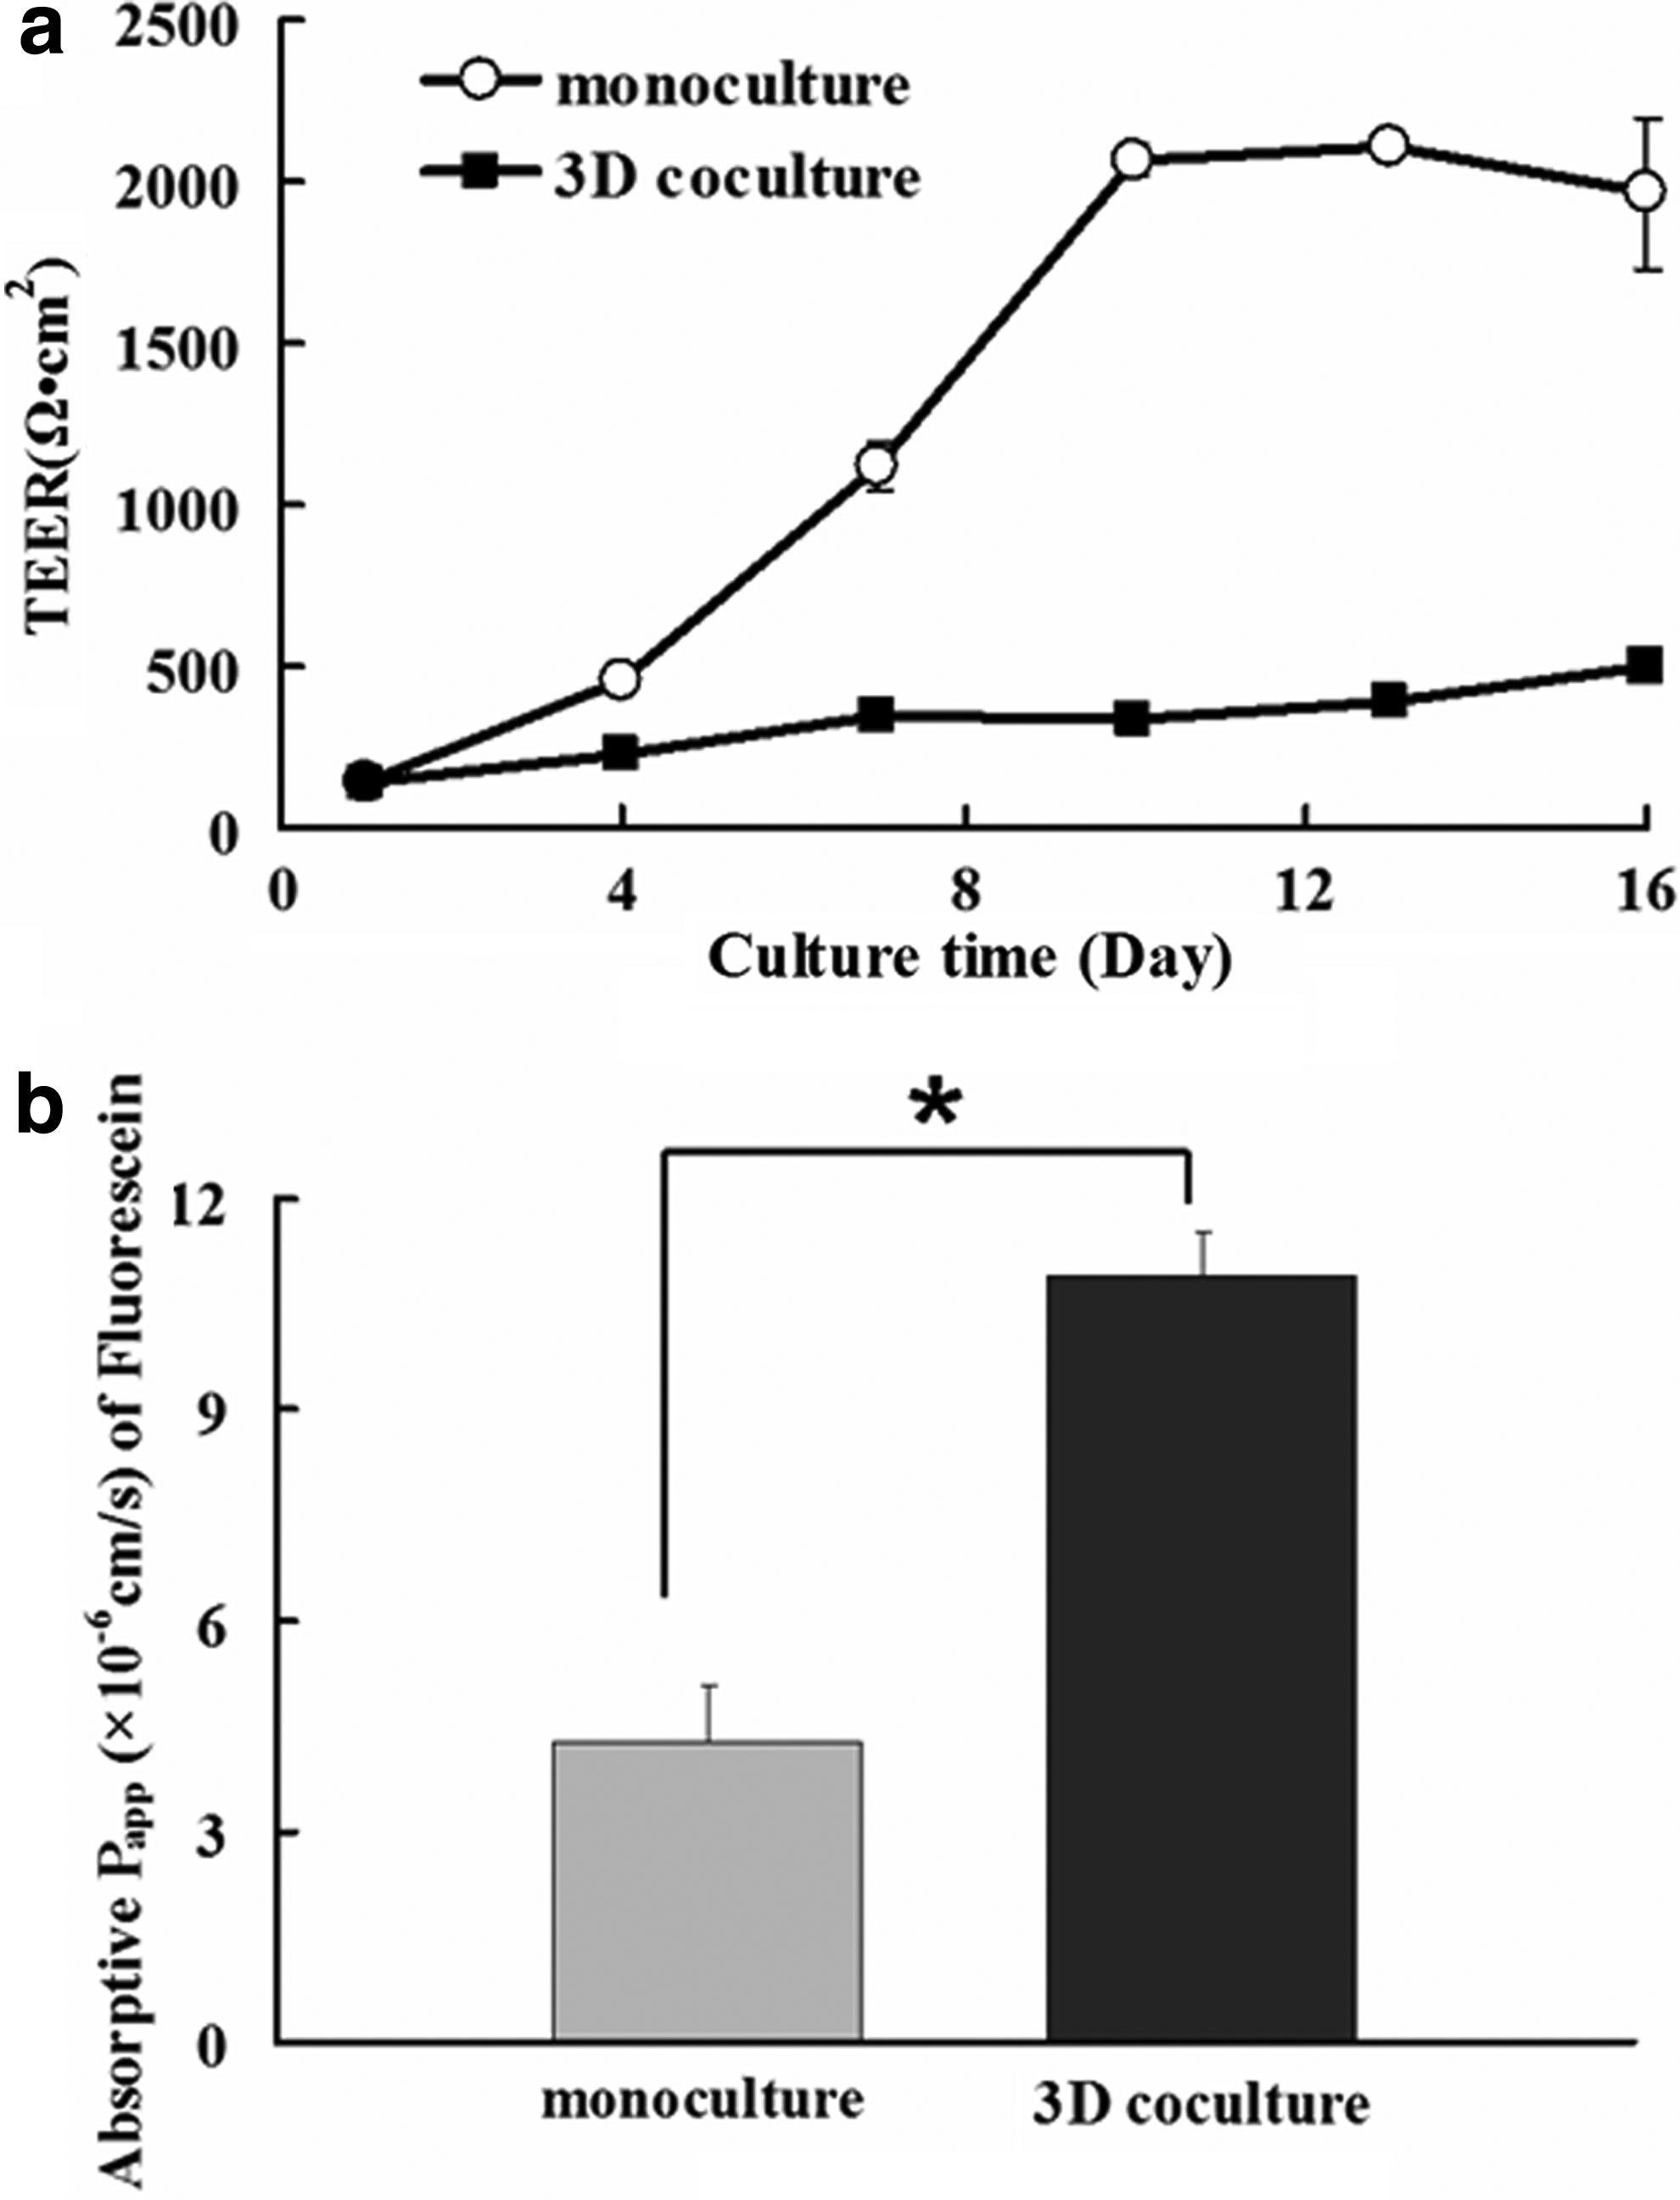
To further characterize the integrity of the epithelium in the 3D coculture, absorptive permeability (apical to basolateral) of fluorescein, a marker compound for the paracellular pathway was also measured. An improved permeability through the paracellular pathway was observed as evidenced by the significantly higher average Papp value in the 3D coculture than the monoculture (Fig. 5b). These results strongly support that an involvement of HT29-MTX and/or ECM could alter the integrity of the epithelium layer in the coculture and consequently enhance the paracellular permeability.
Functionality evaluation of the 3D coculture model
Gene expression of transporters in 3D coculture
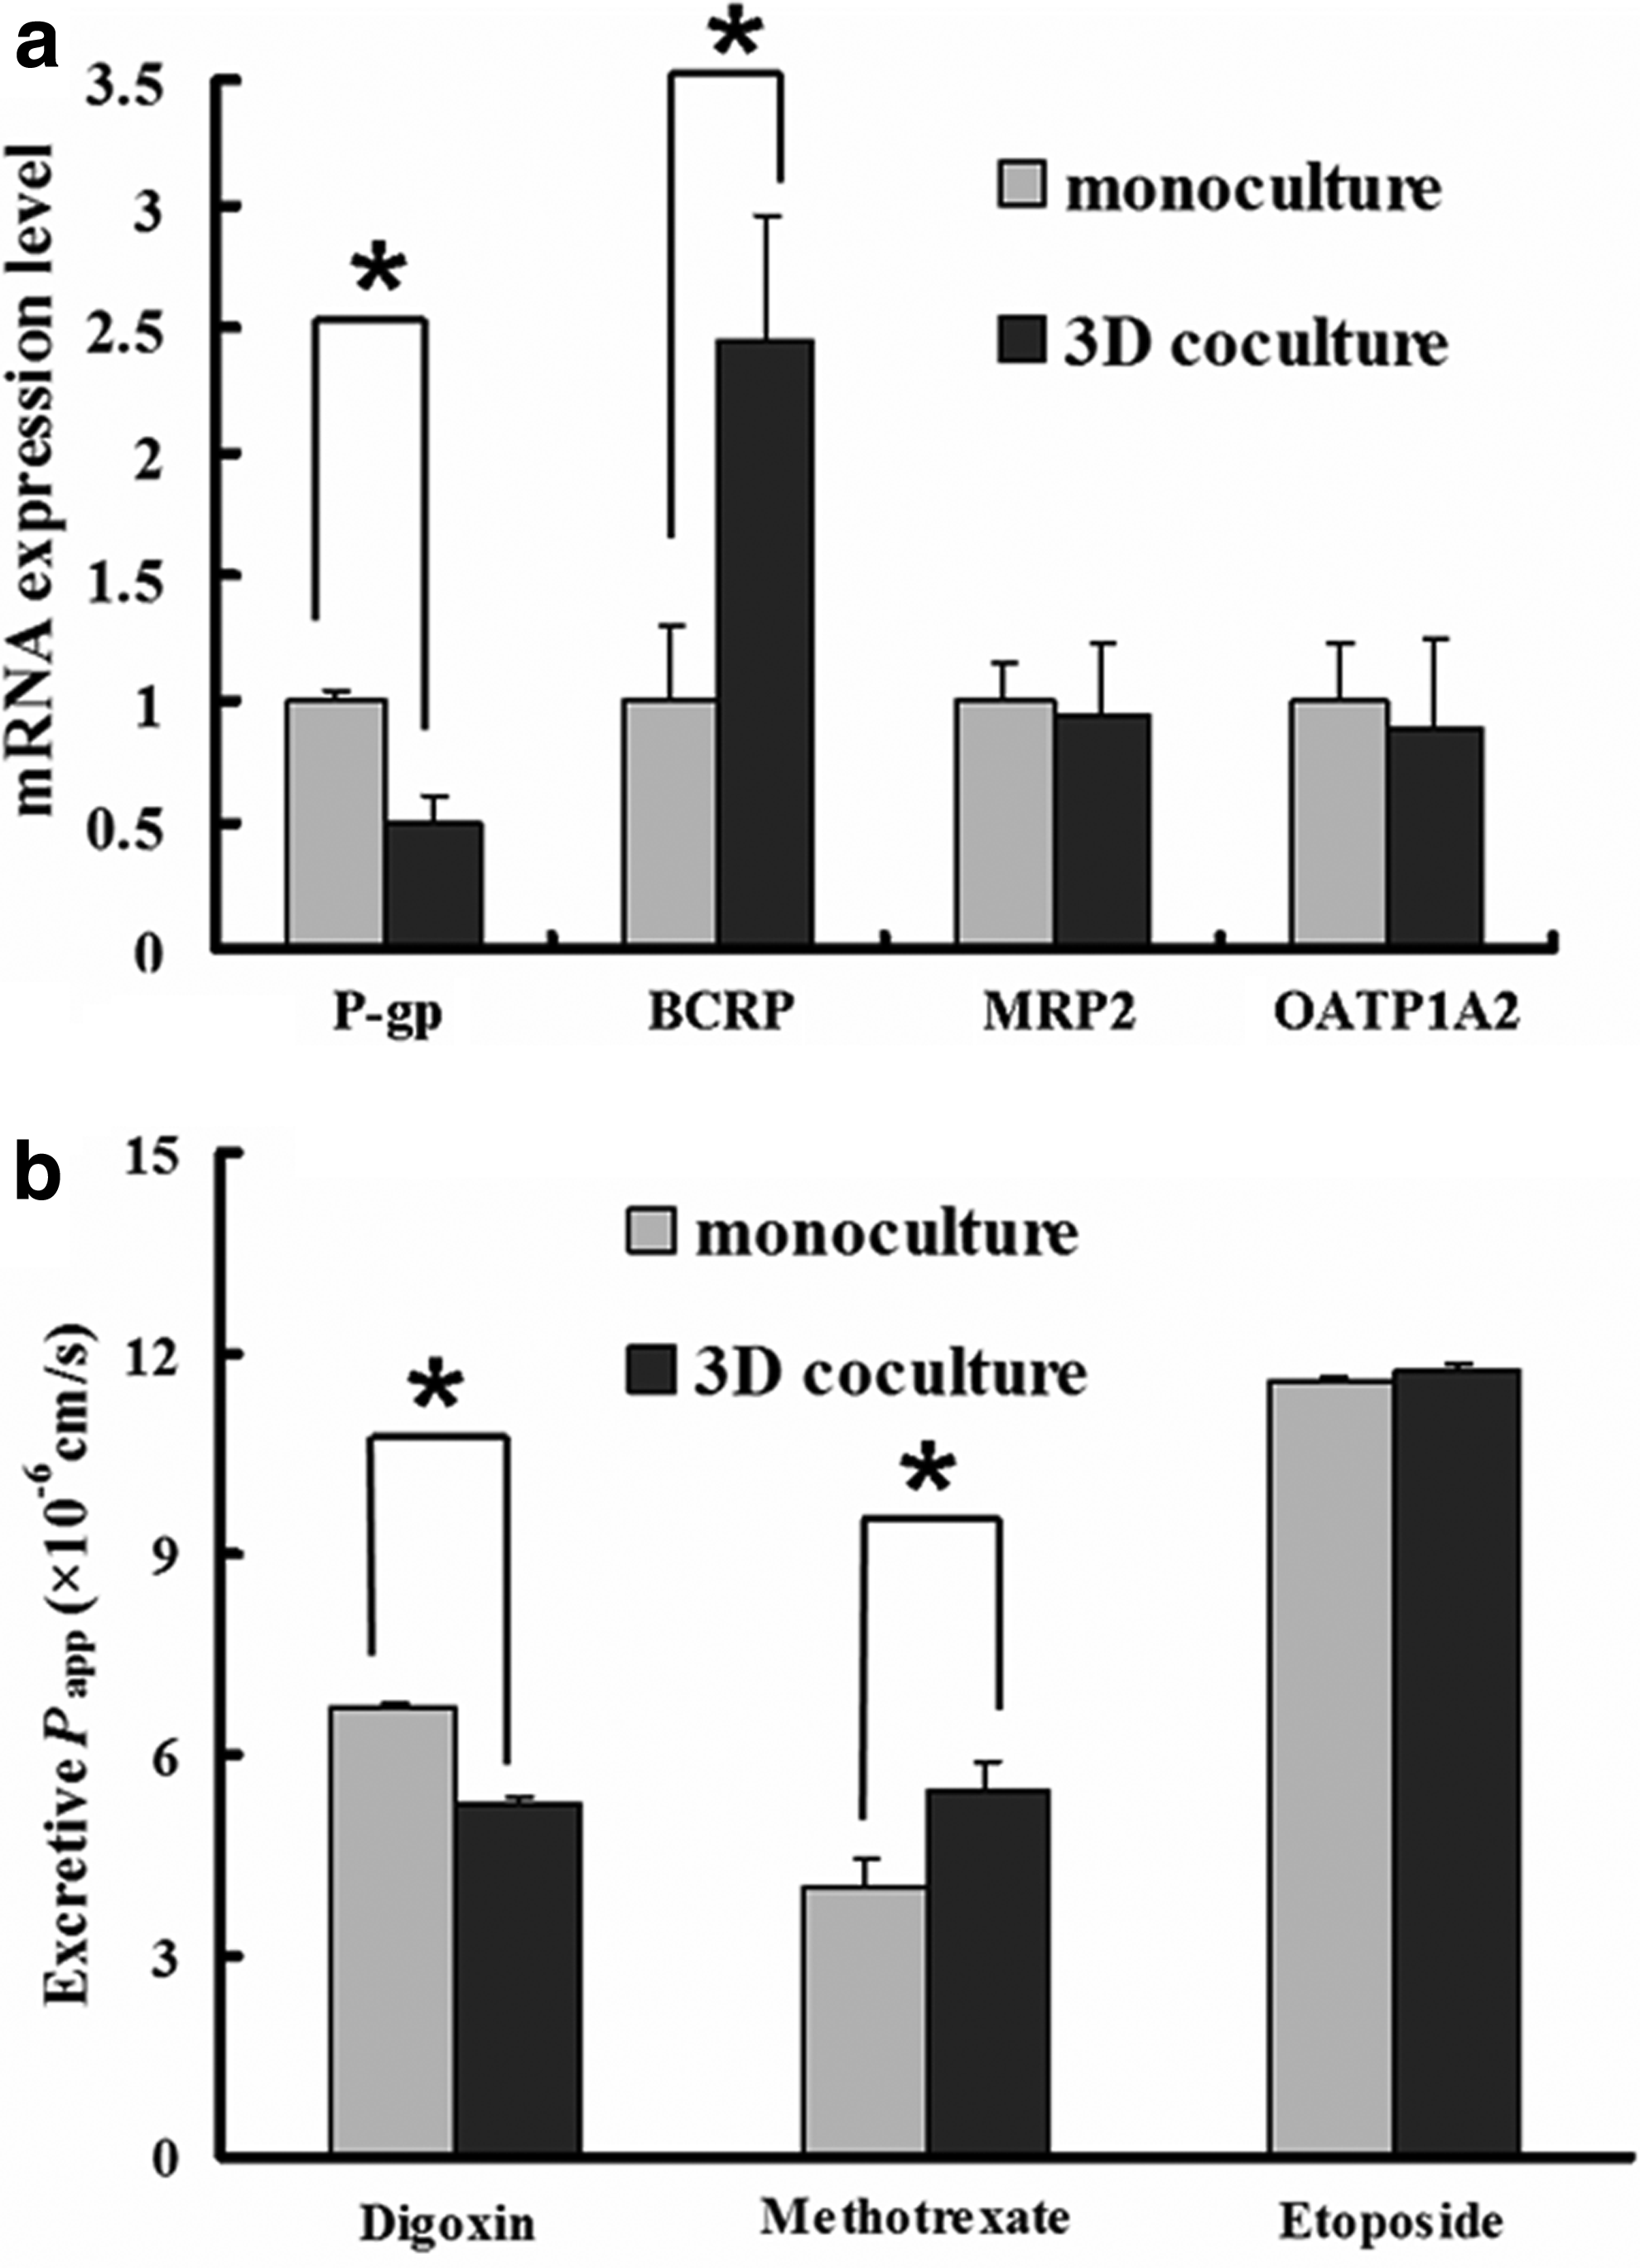
To determine whether the presence of the ECM and stromal cells could affect the functionality as well as the morphological differentiation of Caco-2 cells in the 3D coculture, their gene expression of key transporters, including P-gp, BCRP, MRP2 (efflux transporters), and OATP1A2 (influx transporter), was analyzed by real-time RT-PCR. Compared with the monoculture, the P-gp (encoded by MDR1) mRNA level was significantly downregulated in the cocultured Caco-2 cells (Fig. 6a). This result is somewhat consistent with the P-gp protein expression of the 3D coculture detected by immunofluorescence staining, in which a less stained P-gp protein was observed in the coculture after 3 weeks of cultivation when compared to the monoculture (Fig. 4c, d). It was also found that gene expression of BCRP, another important efflux transporter expressed at the apical side of IECs, was upregulated in the 3D coculture compared with that of the monoculture. No significant difference of either the MRP2 or OATP1A2 mRNA level existed between those two groups, even though a relatively higher expression level of genes was observed in the monoculture. These results provide further evidence that the stromal cells and ECM present in the 3D coculture contribute to Caco-2 cells functional differentiation.
Transport activity
The activity of the efflux transporters, including P-gp, BCRP, and MRP2, was further evaluated by their excretive transport (basolateral to apical) of a specific substrate, that is, digoxin for P-gp, MTX for BCRP, and etoposide for MRP2. As shown in Figure 6b, the basolateral-to-apical Papp value of digoxin in the 3D coculture was significantly lower than that in the monoculture. This is probably due to the decreased expression of P-gp in the coculture as indicated by immunostaining and real-time RT-PCR analysis. In contrast, the basolateral-to-apical Papp value of MTX in the 3D coculture was significantly higher than that in the monocultured Caco-2 cells, which is somewhat consistent with the enhanced mRNA expression of BCRP in the coculture. Similarly, consistent with the unchanged mRNA expression level of MRP2 described above, no statistically significant difference in the secretory permeability of etoposide between these two groups was found.
Permeability of model compounds in the 3D coculture model
To further validate the functionality of the reconstructed 3D coculture model, a series of model drugs (N=19) with different transport mechanisms were selected for absorption evaluation according to their reported intestinal absorption fraction (IAF) and permealility in vitro. Basically, all the model drugs were classified into two groups as follows: (1) the model drugs with low permeability (IAF in human < 65%); (2) the model drugs with moderate or high permeability (IAF ≥65%). Their absorptive Papp values (apical to basolateral) were determined in both monoculture and 3D coculture (TEER values > 400 Ω·cm2) and average mass balance of the validated drugs was between 80%–120%. As shown in Table 2, those model drugs displayed low, moderate, and high permeability, respectively, which is somewhat consistent with their reported permeability. However, it should be noted that the absorptive Papp values of most model drugs in the group 1 increased in the 3D coculture model in comparison with the monoculture, whereas the absorptive Papp values of most model drugs in the group 2 decreased (3D coculture vs. monoculture).
Molecular weight.
Correlation analysis between permeability and human absorption fraction
According to the data in Table 2, a rank order relationship between drug permeability values obtained from the 3D coculture or monoculture and reported human extent of absorption33–35 was established by linear regression. As shown in Figure 7a, no significant difference existed between the correlation coefficient of the model drugs in group 1 (lowly permeable drugs) in 3D coculture (R2=0.844) and that in the monoculture group (R2=0.850). However, with respect to the model compounds displaying moderate or high permeability (group 2), a higher correlation coefficient (R2=0.843) was achieved in the 3D coculture model compared to that of the monoculture (R2=0.704) (Fig. 7b).

Discussion
In the present study, a more physiologically relevant 3D coculture model of human intestinal mucosa was developed for predicting drug permeability in vitro. This 3D coculture model offers several advantages over the conventional Caco-2-based monolayer models because of the reconstruction of the in vivo 3D microenvironment of normal intestinal mucosa. On the one hand, in addition to the Caco-2 cells, goblet cells induced from HT-29 cells were incorporated into the epithelial layer of the model system, making its cellular composition mimic the native intestinal epithelial layer more closely. On the other hand, considering the indispensible role of stromal cells and ECM in driving or maintaining the differentiation of IECs, two types of stromal cells, that is, fibroblasts and immunocytes, and type I collagen were adopted in the current 3D coculture model. This contributes significantly to the reconstruction of intestinal tissue microenvironment in vitro.
To characterize the 3D coculture model in vitro, we first evaluated the influence of stromal cells on the growth of epithelial cells. An enhanced cell proliferation evidenced by the higher total DNA content was observed in the 3D cocultures when compared with the 2D Caco-2 monocultures. This result is somewhat consistent with those previous reports on the stimulatory effect of fibroblasts on the growth of enterocytes.36,37 A detailed mechanism of this effect has not been well elucidated; however, several efforts in this direction have demonstrated that a direct paracrine action of the hepatocyte growth factor and the keratinocyte growth factor secreted from human colon fibroblasts or other stromal cells might account for the proliferative effect exerted by the cocultured intestinal stromal cells.36,37
Characteristics of the epithelial layer presented in the 3D coculture model were also evaluated. A thicker coating layer of viscoelastic and lubricant mucus evidenced by the increased periodic acid/Schiff staining was exclusively generated over the epithelial layer in the 3D coculture system. This feature is significantly distinct from the conventional Caco-2 monolayer culture where only a very small amount of mucus is produced under normal culture conditions. It is known that goblet cells scattered among the small intestinal epithelium in vivo are responsible for the mucin secretion and mucus formation over the epithelial layer even though their ratio is only about 10%. Moreover, this special mucus layer plays an indispensable role in determining the amount of drug absorption.18,38 Here functional HT29-MTX cells served as a model of goblet cells were involved into the Caco-2 cell culture at a ratio of 1:9 (HT29-MTX: Caco-2), resulting in a formation of the epithelial layer with mucus that more closely simulates the physiological mucosa structure of the small intestine in vivo.
The decreased TEER value and increased permeability of fluorescein were also observed in the 3D coculture system, indicating its decreased tight junction integrity of the epithelial layer. This finding is consistent with previous reports on an improved permeability of paracellularly absorbed compounds caused by goblet cells incorporation into the 2D Caco-2 cell culture. 18 It has been demonstrated that HT29-MTX cells were proficient enough to decrease tight junction integrity and epithelial barrier function due to their different structure of tight junctions in comparison with that between enterocytes. 16 Thus, this phenomenon might be explained by the incorporation of HT29-MTX cells. Moreover, a significantly decreased expression of the tight junction protein ZO-1 was also detected in the present study, providing further evidence for the role of HT29-MTX cells in the alteration of tight junction integrity of the epithelial layer in the 3D coculture.
It is known that intestinal mucosa serves as an essential epithelium barrier between the gut lumen and blood circulation to protect against the invasion of extraneous toxicant and drug molecues. 4 Specifically, both efflux and influx transporters expressed by the in vivo IECs are mainly responsible for the complex absorptive and secretory functionality. 39 In the present study, expression of the P-gp transporter, a major ATP-dependent drug efflux pump for xenobiotic compounds with broad substrate specificity, 40 was found to be significantly downregulated in the cocultured Caco-2 cells. This is distinct from the Caco-2 monoculture where the P-gp expression level is pretty high. 8 In accordance with the P-gp protein expression level, a decreased secretory permeability of digoxin, a specific substrate of P-gp, was also observed in the 3D coculture when compared with the 2D Caco-2 monoculture. In fact, overexpression of P-gp in Caco-2 cells compared with the human small IECs has been recognized by several investigators.41,42 This could be explained by the colorectal tissue source of the Caco-2 cell line. 40 It has been well demonstrated that there is a constant increase of P-gp expression along the intestine from the proximal to the distal part. 43 Thus, it seemed that the microenvironment provided by the 3D coculture system was able to improve the phenotype of Caco-2 cells and make them better simulate the small intestinal enterocytes in vivo. This conclusion was also supported by the markedly increased transcript expression level and enhanced export activity of another important export pump BCRP in the 3D coculture. It has been reported that BCRP was accurately expressed along the intestine, that is, increasing within the small intestine from proximal to distal and decreasing thereafter in the colon. 44 Thus, this not only offers a reasonable explanation for the lower expression level of BCRP in the monoculture, 44 but also confirmed the improved phenotype of Caco-2 cells in the 3D coculture. As opposed to those two efflux transporters described above, the transcript expression of MRP2 and OATP1A2 showed no significant difference between the 3D coculture and the 2D monoculture. Detailed mechanisms of these effects are still under investigation, but our preliminary exploration has found that the synergistic effect of goblet cells, stromal cells, and the ECM existed in the reconstructed 3D coculture model (Supplementary Fig. S2). Both of the interactions between epithelial and stromal cells and the effect exerted by collagen are necessary for optimizing the phenotype and functionality of Caco-2 cells in vitro.
To further characterize the potential of the 3D coculture in predicting the permeability of drug molecules in vitro, we finally evaluated the in vitro absorptive permeability of a range of model drugs (with poor, moderate, or high absorptive permeability, respectively), by using the reconstructed 3D coculture model. With respect to the drugs with poor intestinal absorption, we found that their permeability measured in the 3D cocultures was generally higher than that in the Caco-2 monocultures. A similar phenomenon has been reported in Walter et al.'s study, in which the low absorbable hydrophilic drugs exhibited a higher transport rate in the coculture of Caco-2 and HT29-MTX when compared with the Caco-2 monolayer. 38 Artursson et al. also found that drugs displaying a low permeability had a higher permeability in vivo than in the Caco-2 monolayers. 45 It has been demonstrated that the surface area for absorption in vivo is one of the dominant factors impacting the intestinal absorption of drugs with low permeability.3,45 Particularly, drugs with lower permeability will remain longer in the intestinal lumen in vivo before they are absorbed. These drugs may therefore diffuse further down the length of the villi as compared to drugs with high permeability. This diffusion would not only increase the absorptive surface area, but also allow a fraction of the drug absorption to occur through the leakier paracellular pathway in the crypt region.3,45 Here we hypothesize that the surface area of the 3D system or the monoculture is equal to the permeable membrane area (1.12 cm2). However, actually, the reconstructed 3D coculture described in the present study is supposed to possess a bigger absorptive surface area compared to the conventional Caco-2 monolayer culture due to its 3D architecture. This might partly explain the increased permeability exhibited by the low-permeability drug observed in the 3D coculture system. On the other hand, one study by Moyes et al. has found that macrophages could increase the uptake of microparticles by the Caco-2 monolayer, highly suggesting the important role of macrophages in promoting the absorption of low-permeability drugs. 22 Here the THP-1-derived macrophages were also present in the 3D coculture system, thus, the effect of those macrophages could not be ignored because of their contribution to the increased drug permeability. Further investigations are definitely needed, however, to better understand the related molecular mechanism that impacts the process of intestinal absorption of low-permeability drugs.
Regarding why the improved Papp values of low absorbing drugs in 3D coculture failed to improve its R2 value significantly, currently, we still do not know how to explain this phenomenon exactly. However, it should be pointed out that the Papp values of low absorbing drugs are pretty low, which usually leads to some difficulties unexpected in measuring the trace amount of low absorbing drugs in the samples. This might be partially responsible for the little difference of R2 between the 3D coculture and 2D monoculture as shown in Figure 7a.
In contrast to the increased permeability exhibited by the low-permeability drugs, those model drugs with moderately or highly permeable property displayed decreased Papp values in the 3D cocultures in comparison with the 2D monocultures. We analyzed that the collagen matrix beneath the Caco-2 and HT29-MTX cells might be responsible for the decreased permeability of those model drugs because they served as a barrier across the 3D coculture model of intestinal mucosa. In addition, the presence of a mucus layer secreted from goblet cells, representing a second absorption barrier in vitro, might contribute to the altered permeability. It could be strongly supported by one study by Hilgendorf et al., in which they have demonstrated that drug–mucus interactions could impede the passage of drug molecules through the epithelial cell layer. 18
Better correlation between the permeability obtained from 3D cocultures and the human absorption fraction for those moderately or highly permeable model drugs was also achieved in the present study, when compared to the 2D monocultures through linear correlation analysis. This result supported not only the important role of microenvironment in regulating the functionality of enterocytes, but also the desirable potential of the 3D coculture model that could be utilized for the drug screening. It has been demonstrated that an increased absorptive surface area mentioned above influences not only on the low-permeability drug absorption, but also on the moderate- or high-permeability drug absorption. However, since this effect was more prominent in the former than in the latter,3,45 here we analyzed that the absorptive surface area might not serve as the only factor that accounts for the improvement of correlation as seen in Figure 7b. Some other factors, such as mucus layer, tight junction, as well as expression of transporters, should also be taken into account when explaining this outcome.15,16,33,35 Further studies have been carried out to clarify the key features responsible for drug absorption in the cell culture compartment.
In conclusion, we have developed an improved 3D coculture model of human intestinal mucosa to better predict drug permeability in vitro under more defined and physiologically relevant conditions. It offers a more promising opportunity of modifying the permeability barrier of the epithelial layer with respect to paracellular resistance, mucus secretion, and transporters. It is hoped that utilization of this enterocyte-stromal cell model system would narrow the gap between conventional cell culture system and animal testing, allowing the identification of the factors that control the behavior of IECs and even the process of drug absorption.
Footnotes
Acknowledgments
This work was founded by the National Natural Science Foundation of China (No. 81173125 and No. 31100689) and the Hundred Talents Program of the Chinese Academy of Sciences.
Disclosure Statement
The authors state that no competing financial interests exist.
References
Supplementary Material
Please find the following supplemental material available below.
For Open Access articles published under a Creative Commons License, all supplemental material carries the same license as the article it is associated with.
For non-Open Access articles published, all supplemental material carries a non-exclusive license, and permission requests for re-use of supplemental material or any part of supplemental material shall be sent directly to the copyright owner as specified in the copyright notice associated with the article.
