
Abstract
Automatic image analysis algorithms are in general dedicated quantification tools used for very specific types of microscopic cell images, but are not robust enough to accurately quantify the cell number and distribution in the wide variety for fluorescence images that exist in the field of tissue engineering (TE) today, where cell–material (scaffold) interactions are being evaluated more and more. In this study, a semiautomatic algorithm was developed that allows the user to manually count a limited part of a TE scaffold image, and then automatically counts the cells of the full image based on that calibration dataset. The algorithm was validated on images of cells on a two-dimensional (2D) titanium (Ti) substrate, in a three-dimensional (3D) Ti scaffold and in a fibrin hydrogel by comparison with manual cell counting and with an indirect cell counting using metabolic assay. The average relative error between this semiautomatic and the manual approach was 3.4% for the 2D Ti substrates, 5.9% for the 3D Ti scaffolds, and 14.1% for the fibrin hydrogels. Hereby a proof of concept was delivered that could lead to an increased use of automated cell imaging as a reliable 2D and 3D quantitative tool for both basic biological research and process control of clinical TE products.
Introduction
In TE and in biological research in general, there is a large variety in fluorescence images that is caused by differences in the image quality, cell density, resolution, illumination, scaffold structure and material and also the 3D geometry, which makes that not all cells are in focus. To obtain quantities like cell number and local cell density, cells should be distinguished from the background, a process called segmentation. The image processing steps needed for this segmentation are very much dependent on the image features mentioned above, which makes it impossible to have one universal cell counting algorithm for all of them. For several specific applications, dedicated cell detection software has been developed.14–25 In the absence of such software, commercial and open source software provide easy-to-use building blocks that allow the user to make a cell counting algorithm that performs best for his specific application. The limitation of many of these automatic cell counting algorithms is that they are very prone to systematic under or over estimation of the cell number26,27 and as an outsider it is very difficult to know the reliability of the data. Polzer et al., for example, thoroughly validated their automatic cell counting algorithm with manual counting (R2=0.975), counting after nuclei staining (R2=0.997), and hemocytometer cell counting (R2=0.629) and concluded their algorithm was robust, fast, and reproducible for their specific application. 16 This is, however, a laborious approach that strongly reduces the advantage of automatic cell counting and therefore limits its use.
To use fluorescence cell imaging at its full potential, image processing software needs to catch up with the evolution in fluorescence labeling and microscope technology.
13
Existing algorithms are often accurate, but not robust enough to be used for a wide variety of images. The objective of this study was to develop and validate a semiautomatic cell counting algorithm that
• allows the user to manually count a limited part of a TE scaffold image, and then automatically counts the cells of the full image based on that calibration dataset, • provides an objective measure for the accuracy of the semiautomatic counting compared to the manual counting of the user, • without any adaptations can be used for a variety of commonly used TE scaffold types.
Materials and Methods
Fluorescence images
Choice of image types
Three image types that are representative for TE research and which have an increasing complexity for automatic cell counting were selected: (1) a two-dimensional (2D) titanium (Ti) substrate, (2) a 3D Ti scaffold, and (3) a fibrin hydrogel. The 2D Ti substrates were chosen to develop the algorithms. In a 3D scaffold geometry, it is not possible to have all the cells in a scaffold in focus in one image. Therefore, any image-based cell counting method can be used for counting all the cells in the image, but not all cells in the scaffold. The 2D Ti substrate was included in this study as an intermediate between a 2D cell culture and a 3D scaffold. Ti was chosen over a transparent microscope glass because of its use as TE scaffold material and because it is not transparent for fluorescent light, making it a more realistic image for TE scaffolds. Because of the flat surface, all cells on the substrate were visible in the images, and therefore, the counted cell number could be correlated to the total cell number that was obtained by a metabolic assay. In the 3D Ti scaffold images, the cells that are in focus are smaller and have a sharper outline, while the cells out of focus appear bigger and less sharp in the image. These 3D features increase the complexity for automatic cell counting compared to the 2D substrate. Cells that are encapsulated in a hydrogel generally appear rounder than cells that are attached to a surface. Depending on the optical properties of the material, hydrogels often generate an uneven background in fluorescent images, which increases the complexity further for automatic cell counting compared to the 2D substrates and 3D Ti scaffolds.
2D Ti substrates
Six Ti substrates were produced with selective laser melting (SLM) and had a surface for the cells to attach of 0.5 mm×2 mm (Fig. 1, column 1). 28 Human periosteum-derived stem cells (hPDCs) were stained with red fluorescent CellTracker™ CMDiI (Invitrogen). After expansion, cells were detached from the flasks, centrifuged, and suspended in 2 μM of the CMDiI solution. Cells were incubated for 5 min at 37°C, and then for 15 min at 4°C to limit endocytosis of the dye. Cells were centrifuged and resuspended twice in phosphate-buffered saline (PBS) (Lonza Group Ltd.) to remove residual dye. Six substrates were drop seeded with 200 μL stained cell suspension at six different densities (0/2000/5000/8000/10,000/15,000 cells/cm2). The cells were incubated overnight in a growth medium [the Dulbecco's modified Eagle's medium (DMEM) with 10% fetal bovine serum (FBS)] at 37°C, 5% CO2, and 95% relative humidity (RH) to allow cell attachment to the substrate. Next, the substrates were rinsed with PBS to remove nonadherent cells.

Representative pictures of the three scaffold types and the fluorescent image of the cell-seeded scaffolds (rows 1 and 2: scale bars=5 mm; row 3: scale bars=500 μm). Color images available online at
3D Ti scaffolds
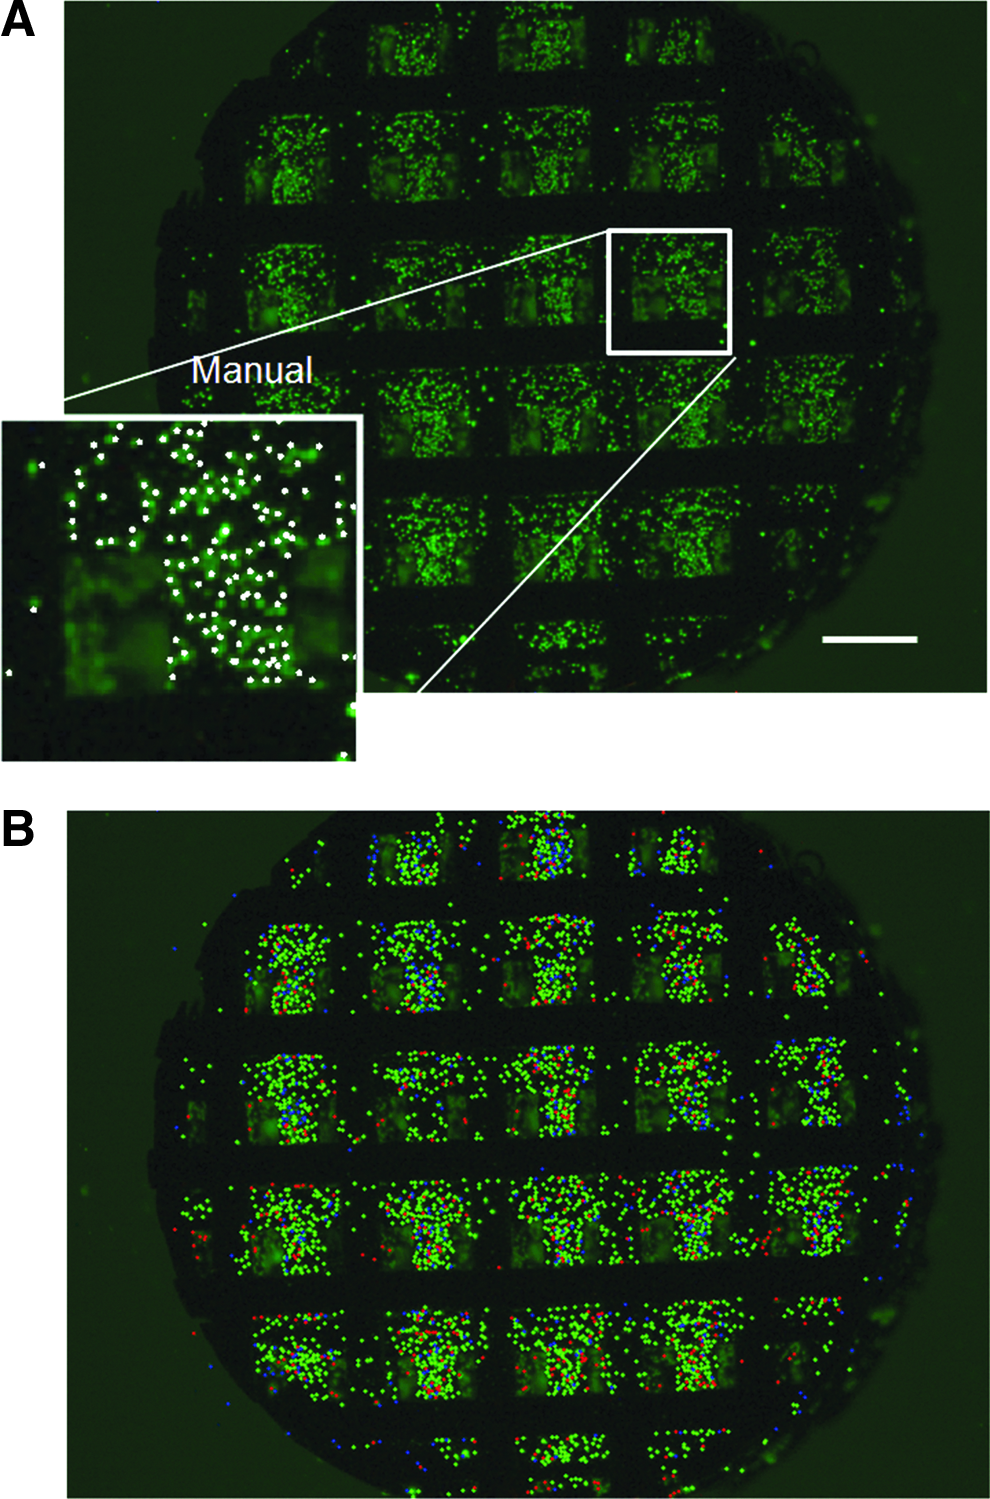
The regular cylindrical 3D Ti scaffolds were produced with SLM and measured 10 mm in height and 6 mm in diameter (Fig. 1, column 2). 28 Five scaffolds were prepared and seeded with hPDCs according to the method of Impens et al. 29 After seeding and overnight incubation, samples were rinsed with PBS to remove nonadherent cells. Live cells were then stained with 2 μM Calcein AM (Invitrogen). After placing the samples at 37°C for 20 min in the dark, the dye solution was discarded and the residual stain was washed away with 2 mL of PBS.
Fibrin hydrogels
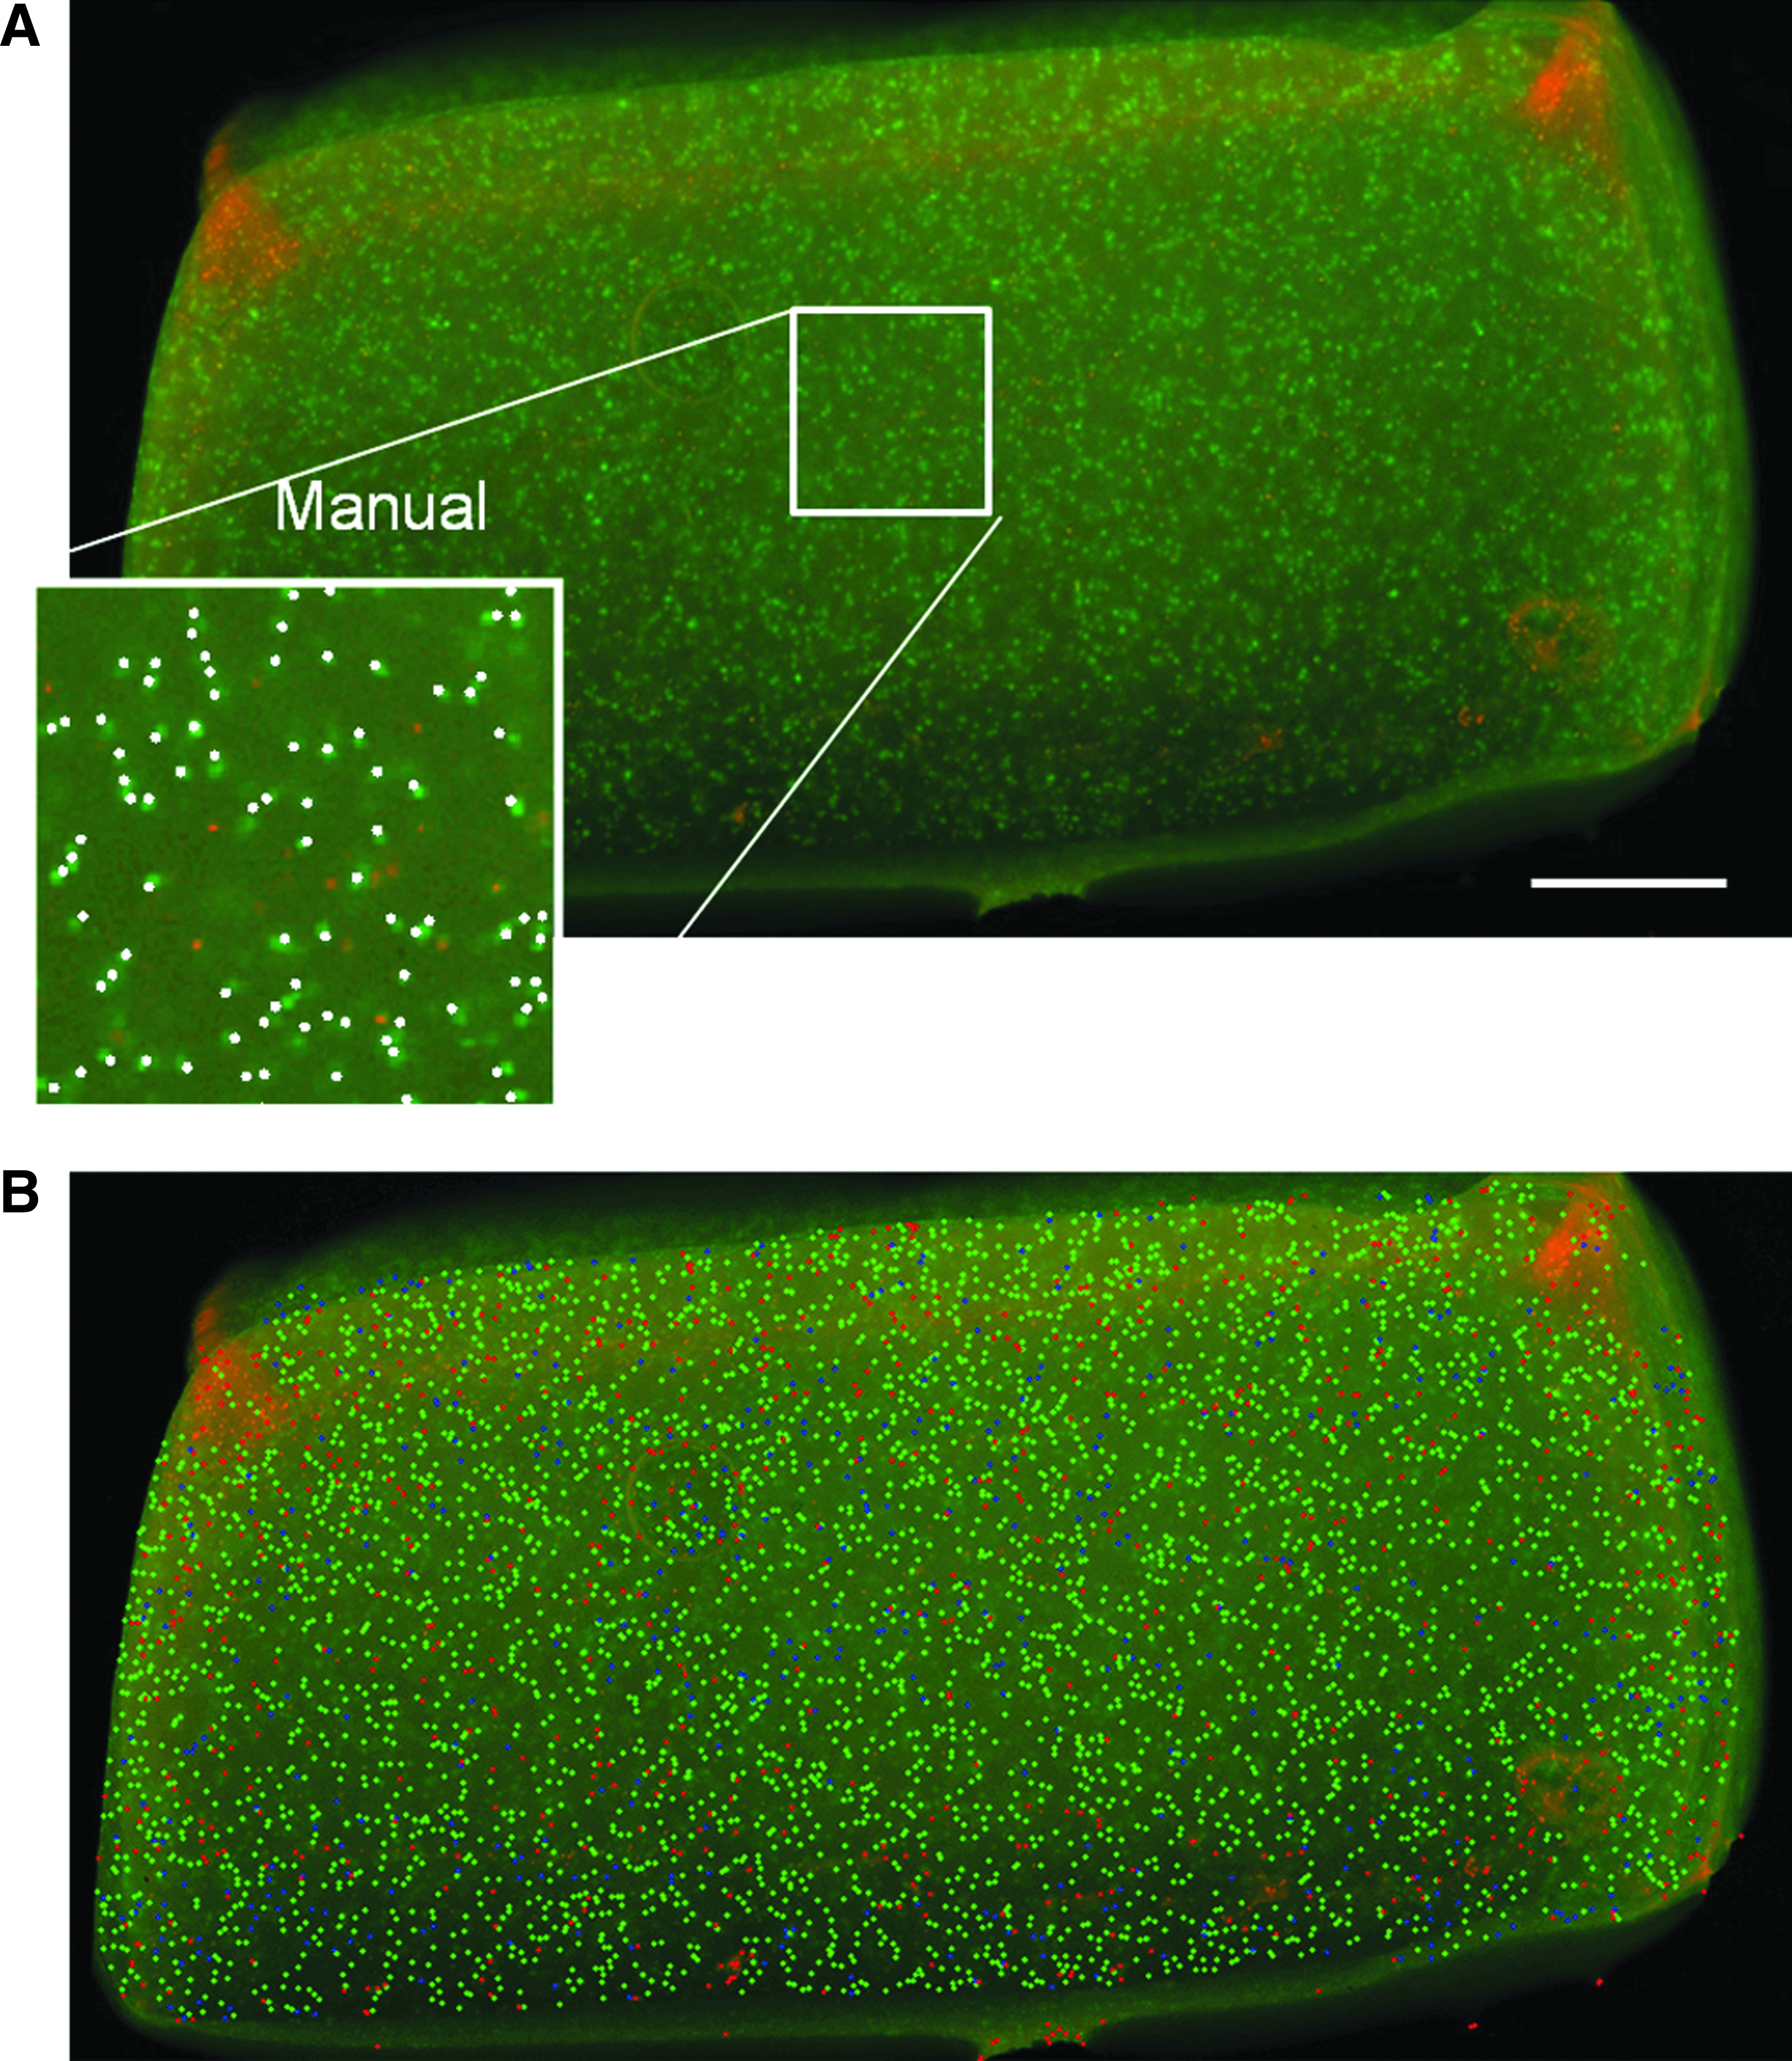
Cells were encapsulated in fibrin sealant (Tisseel VH S/D) to create cell-seeded carriers for 3D culture. Five cylindrical hydrogels (8-mm diameter and 4-mm height) were prepared with a final fibrinogen concentration of 33 mg/mL and a thrombin concentration of 1 unit/mL (Fig. 1, column 3). The cell density was 1×10⁶ cells/mL. After expansion, cells were detached from the flasks, centrifuged, and resuspended in the thrombin component. The cell–thrombin solution was added to an equal volume of the fibrinogen component, vortexed briefly, and pipetted into a custom-made stainless steel mould. Subsequently, the mould was placed at 37°C for 1 h. After removing the hydrogels from the mould, they were rinsed with 2 mL PBS and placed in 12-well plates in a 2 mL medium. Wells were coated with agarose to prevent cell attachment. After rinsing with 2 mL of PBS, samples were first cut in half, and then stained with 2 μM Calcein AM. After placing the samples at 37°C for 20 min in the dark, the dye solution was discarded and the residual stain was washed away with 2 mL of PBS.
Microscopic imaging
Overview images of cells seeded on/in 2D/3D Ti substrates and encapsulated in fibrin hydrogels were taken with a stereomicroscope (SteREO Discovery.V8; Carl Zeiss MicroImaging, Inc.) equipped with a cooled charge-coupled device camera (SPOT Insight 2MP Firewire Colour Mosaic camera; Diagnostic Instruments, Inc.). During imaging, all samples were submerged in PBS to prevent drying. Four top-view images (1200×1600 pixels), which were partially overlapping the longitudinal direction, were taken from each 2D Ti substrate. These four images were manually combined using Matlab (The Mathworks, Inc.) to make one overview image of the entire sample substrate and cropped to a size of 4000×1200 pixels. The 3D Ti scaffold images were taken in one top-view image (1200×1600 pixels). Two partially overlapping images (1200×1600 pixels) were taken of each fibrin hydrogel cross section. These two images were manually combined using Matlab to make one overview image of the entire cross section of each fibrin hydrogel (2000×1100 pixels). All images were stored as 24-bit Red-Green-Blue TIFF files.
Semiautomatic cell counting algorithm
The semiautomatic cell counting algorithm, can be split up in four modules as depicted in Figure 2: (1) selection of a rectangular patch of the image and manual counting of the cell in the patch, (2) automatic cell counting of the patch for all image processing parameter value combinations, (3) determining the best parameter value combination by means of the total mismatch, and (4) automatic cell counting of the original image with the selected parameter values. Figure 2 also illustrates that only module 1 requires a manual interaction by the user and all the other modules are done automatically by the computer, hence, the term semiautomatic. The algorithm was made in Matlab. This paragraph explains the four modules subsequently.

Schematic explanation of the semiautomatic cell counting algorithm, indicating the manual module on top and three automatic modules below. The images and numbers shown here are illustrative. The same algorithm was used to count the cells on the two-dimensional titanium (Ti) substrates, the three-dimensional (3D) Ti, and the fibrin hydrogel scaffold images. Color images available online at
Selection of a rectangular patch of the image and manual counting of the cell in the patch
In the first module, the user selects a rectangular image patch. The patches used here were 200×200 pixels. In this image patch, the user clicks on all the centers of what he/she considers to be cells, thus storing the manual cell coordinates.
Automatic cell counting of the patch for all image processing parameter value combinations
To determine the number and coordinates of the cells in the fluorescent image, the image has to be converted to a binary image of white cells (pixel values one) against a black background (pixel values zero). The image processing sequence that was used for this can be found in Figure 3. There are three parameters in this sequence that are sensitive to the differences in cell appearance in the different images: (1) size of the isotropic second-order Gaussian derivative filter, (2) gray value threshold, and (3) use of watershed. The second-order Gaussian filter enhanced the contrast of cell-shaped pixel areas, which had a higher gray value in the center and a lower gray value at the edges. Preliminary tests showed that this was a good filter to increase the contrast between cells and background and between adjacent cells in the image. This allowed for the gray value threshold to be used effectively for separating cells from the background. In general, when two cells are touching each other, the region where they touch is less wide than the diameter of the cell. Therefore, the watershed was a good algorithm to separate cells that were in contact with each other after the gray value threshold. The possible values of these parameters and their meaning with respect to the automatic cell counting are given in Table 1. The second-order Gaussian derivative filter increased the contrast of the cells, and was implemented according to Geusebroek et al. and Freeman and Adelson.30,31 Watershed, which is available in the Image Processing Toolbox in Matlab, is an algorithm that creates a distance map (for each white pixel, the distance to the closest black pixel is calculated) of a binarized image, and then splits this distance map where local minima are found. The algorithm performs the image processing sequence (Fig. 3) on the manually selected image patch, for all 5610 combinations (=11×255×2) of the values of these three parameters (Table 1). The output of this module is a library of 5610 sets of cell coordinates.

Example images after subsequent image processing steps:
Determining the best parameter value combination by means of the total mismatch
The goal of this step is to select the best parameter value combination (Table 1) for automatic cell counting in the image patch. This is done by determining which set of automatically determined cell coordinates (output of module 2) are most similar to the manually determined cell coordinates (output of module 1). To quantify the similarity between two sets of cell coordinates, the total mismatch was defined as follows: if the distance between an automatically and a manually detected cell is less than five pixels, than this is assumed to be the same cell and the manual–automatic cell duo is classified as a matched cell. The five-pixel distance is to take into account that the user will not click the cell center every time, but this distance will never be equal or more than five pixels. Every manually and automatically detected cell can only be matched once. After the matching step, the total mismatch (MMtotal) is calculated as follows:
with
Automatic cell counting of the original image with the selected parameter values
The selected parameter value combination (output of module 3) is used to automatically count the cells in the entire image. The output of the cell counting algorithm is the cell number and the cell coordinates in the entire image and the total mismatch of the cell count in the image patch used for manual counting.
Accuracy detection by manual cell counting
The accuracy of the semiautomatic cell counting algorithm was quantified by comparison with manual cell counting. The standard deviation of manual cell counting was quantified. The same images used for semiautomatic cell counting were also manually counted and the total mismatch was used as an accuracy measure.
Intra- and interoperator variability of manual counting
Since the manual cell counting is also prone to errors, we first aimed at quantifying the interoperator and intraoperator variability of the manual cell counting on the 2D substrate images by three experienced operators. Ten image patches (100×100 pixels) were taken from the 2D substrate images. A series of 30 patches was created using all 10 images three times in a randomized order. This same series was then manually counted by three experienced operators. The intraoperator variability of one operator for one patch was calculated as follows:
where S.D.[Ncells] is the standard deviation of the three cell numbers that were counted by the same operator on the same patch, and Average[Ncells] is the average of these three cell numbers. The interoperator variability for one patch was calculated as follows:
where S.D.[Average[Ncells]] is the standard deviation of the average cell counts of each operator for this patch and Average[Average[Ncells]] is the average of all the cell counts of all operators for this patch.
Manual cell counting of the entire scaffolds
All images used in this study were also completely manually counted by one experienced operator. A user interface was made that enabled the person to magnify the image and click the cells.
Accuracy measures
The total mismatch (Eq. 1) was calculated for the manual and semiautomatic cell counting for the entire scaffolds. The total mismatch consists of an unmatched manually counted cell fraction and an unmatched semiautomatically counted cell fraction calculated as follows:
These are measures for the underestimation and the overestimation of the semiautomatic cell counting algorithm, respectively.
Metabolic activity on the 2D Ti substrate
One reason to use the 2D Ti substrates (instead of the 3D Ti or the fibrin hydrogel scaffolds) to develop the cell counting algorithm was that all the cells on the 2D substrates were visible in one image. Consequently, the semiautomatically counted cell number could be compared with a biological assay that is related to the cell number. An alamarBlue® assay was performed on the 2D Ti substrates after microscopic imaging to indirectly quantify the cell number based on the metabolic activity of the cells on the substrates. The scaffolds were put in a 500 μL culture medium (the DMEM with 10% FBS) with 10% alamarBlue and were incubated for 4 h at 37°C, 5% CO2, and 95% RH. Absorbance was measured using a 544 nm excitation wavelength and a 590 nm emission wavelength. A standard curve with known cell numbers was used to indirectly estimate the cell number. The standard curve was created by seeding known cell numbers (500, 1000, 2000, 5000, 10,000, 20,000 cells) in 12-well plates (triplicate samples), which were incubated overnight in the growth medium at 37°C, 5% CO2, and 95% RH to allow cell attachment. Next, the metabolic activity was measured as described above.
Statistics
Quantitative results are represented as mean±standard error of the mean. Comparative studies of means were performed using a balanced one-way analysis of variance. Significant differences were determined with probability of 0.05 and a significance level of 0.05.
Results
2D Ti substrates
Manual counting
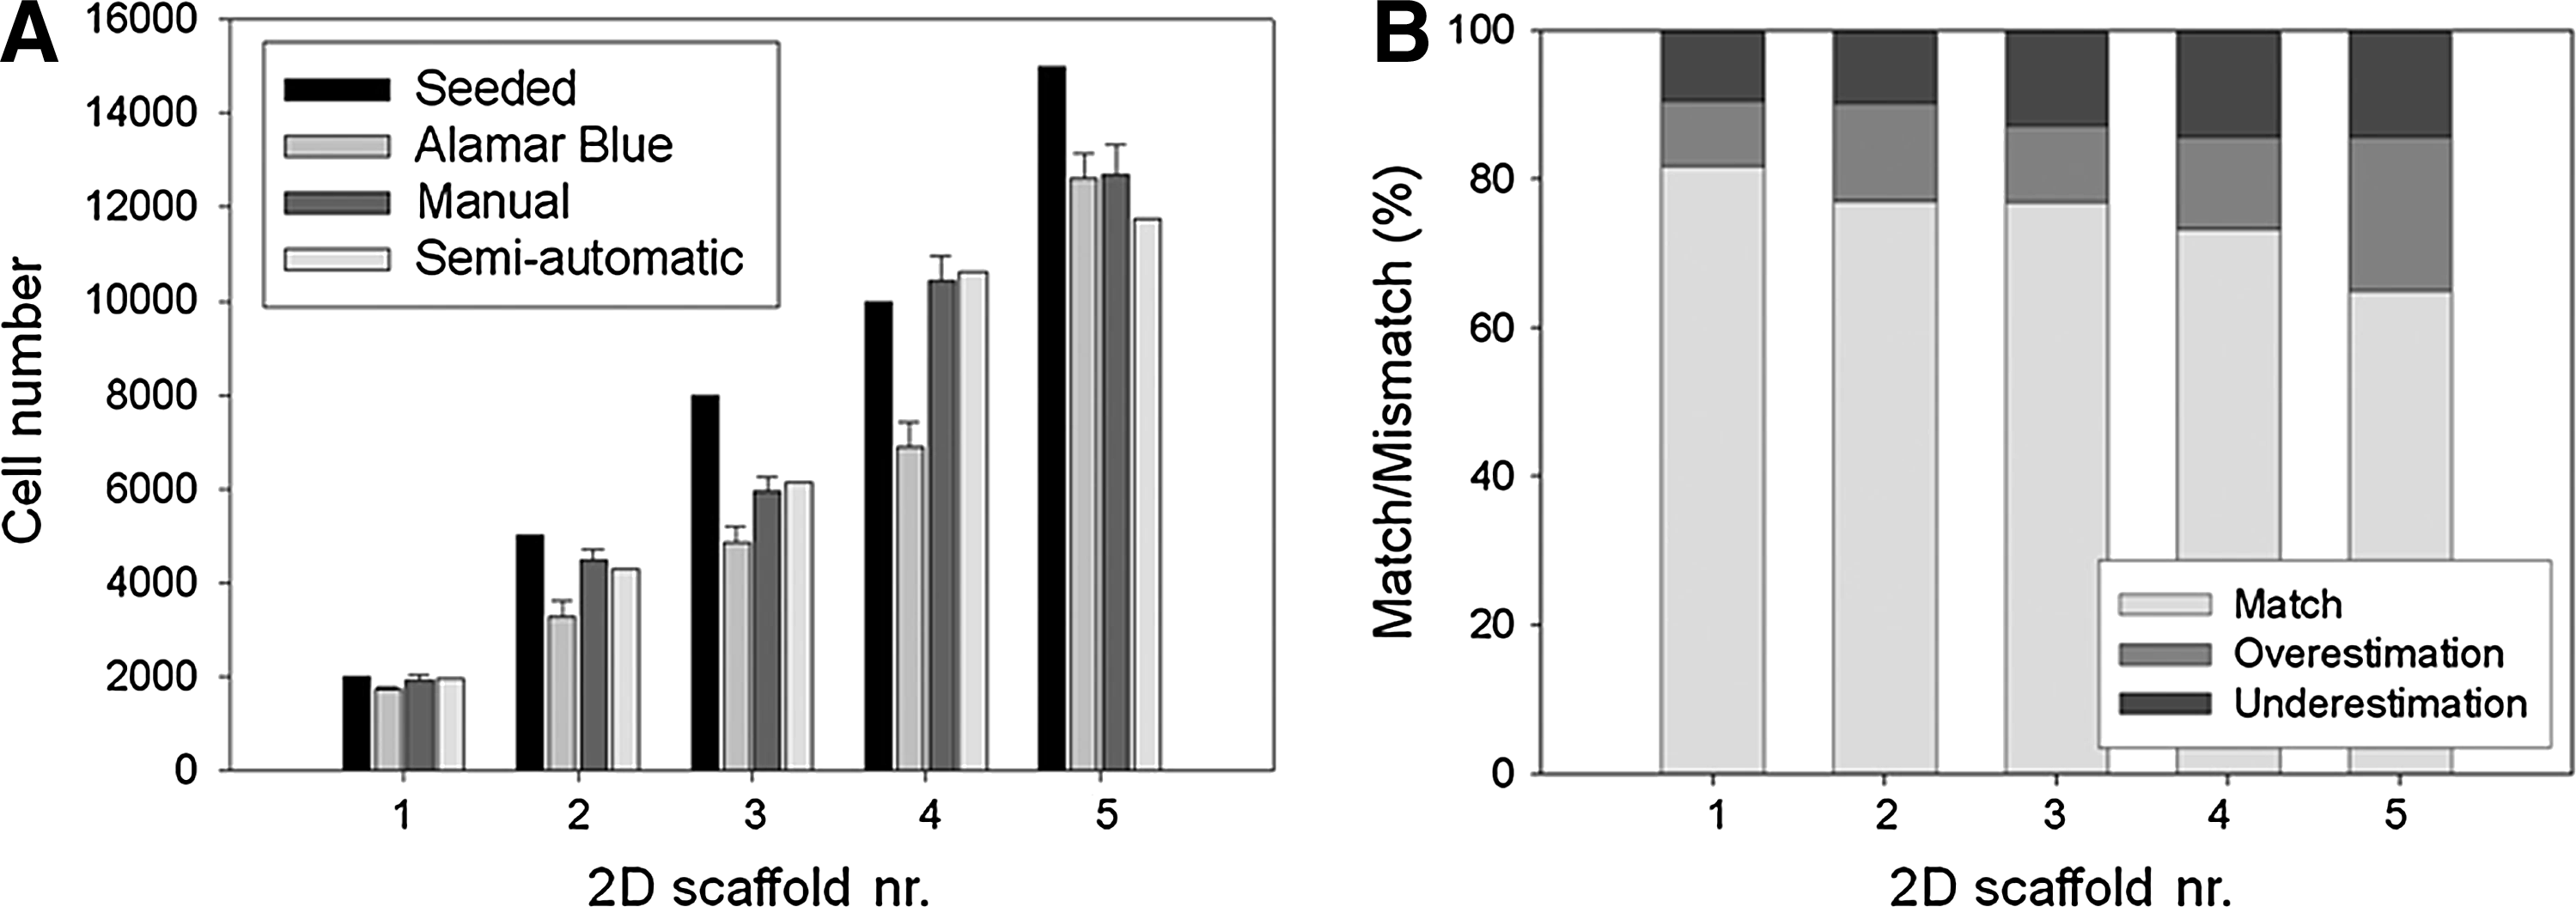
The average intraoperator variability, which is a measure for the repeatability of manual cell counting on the 2D Ti substrate images by a single operator, was 5.5% (Fig. 4A). This is lower than the average interoperator variability, which is a measure for the difference in manual cell counting between different operators, which was 12.9%. This latter value was used to estimate the standard deviation of the manual counting of the entire 2D Ti substrate images shown in Figure 5A, because it reflects the uncertainty of the manually determined cell number.
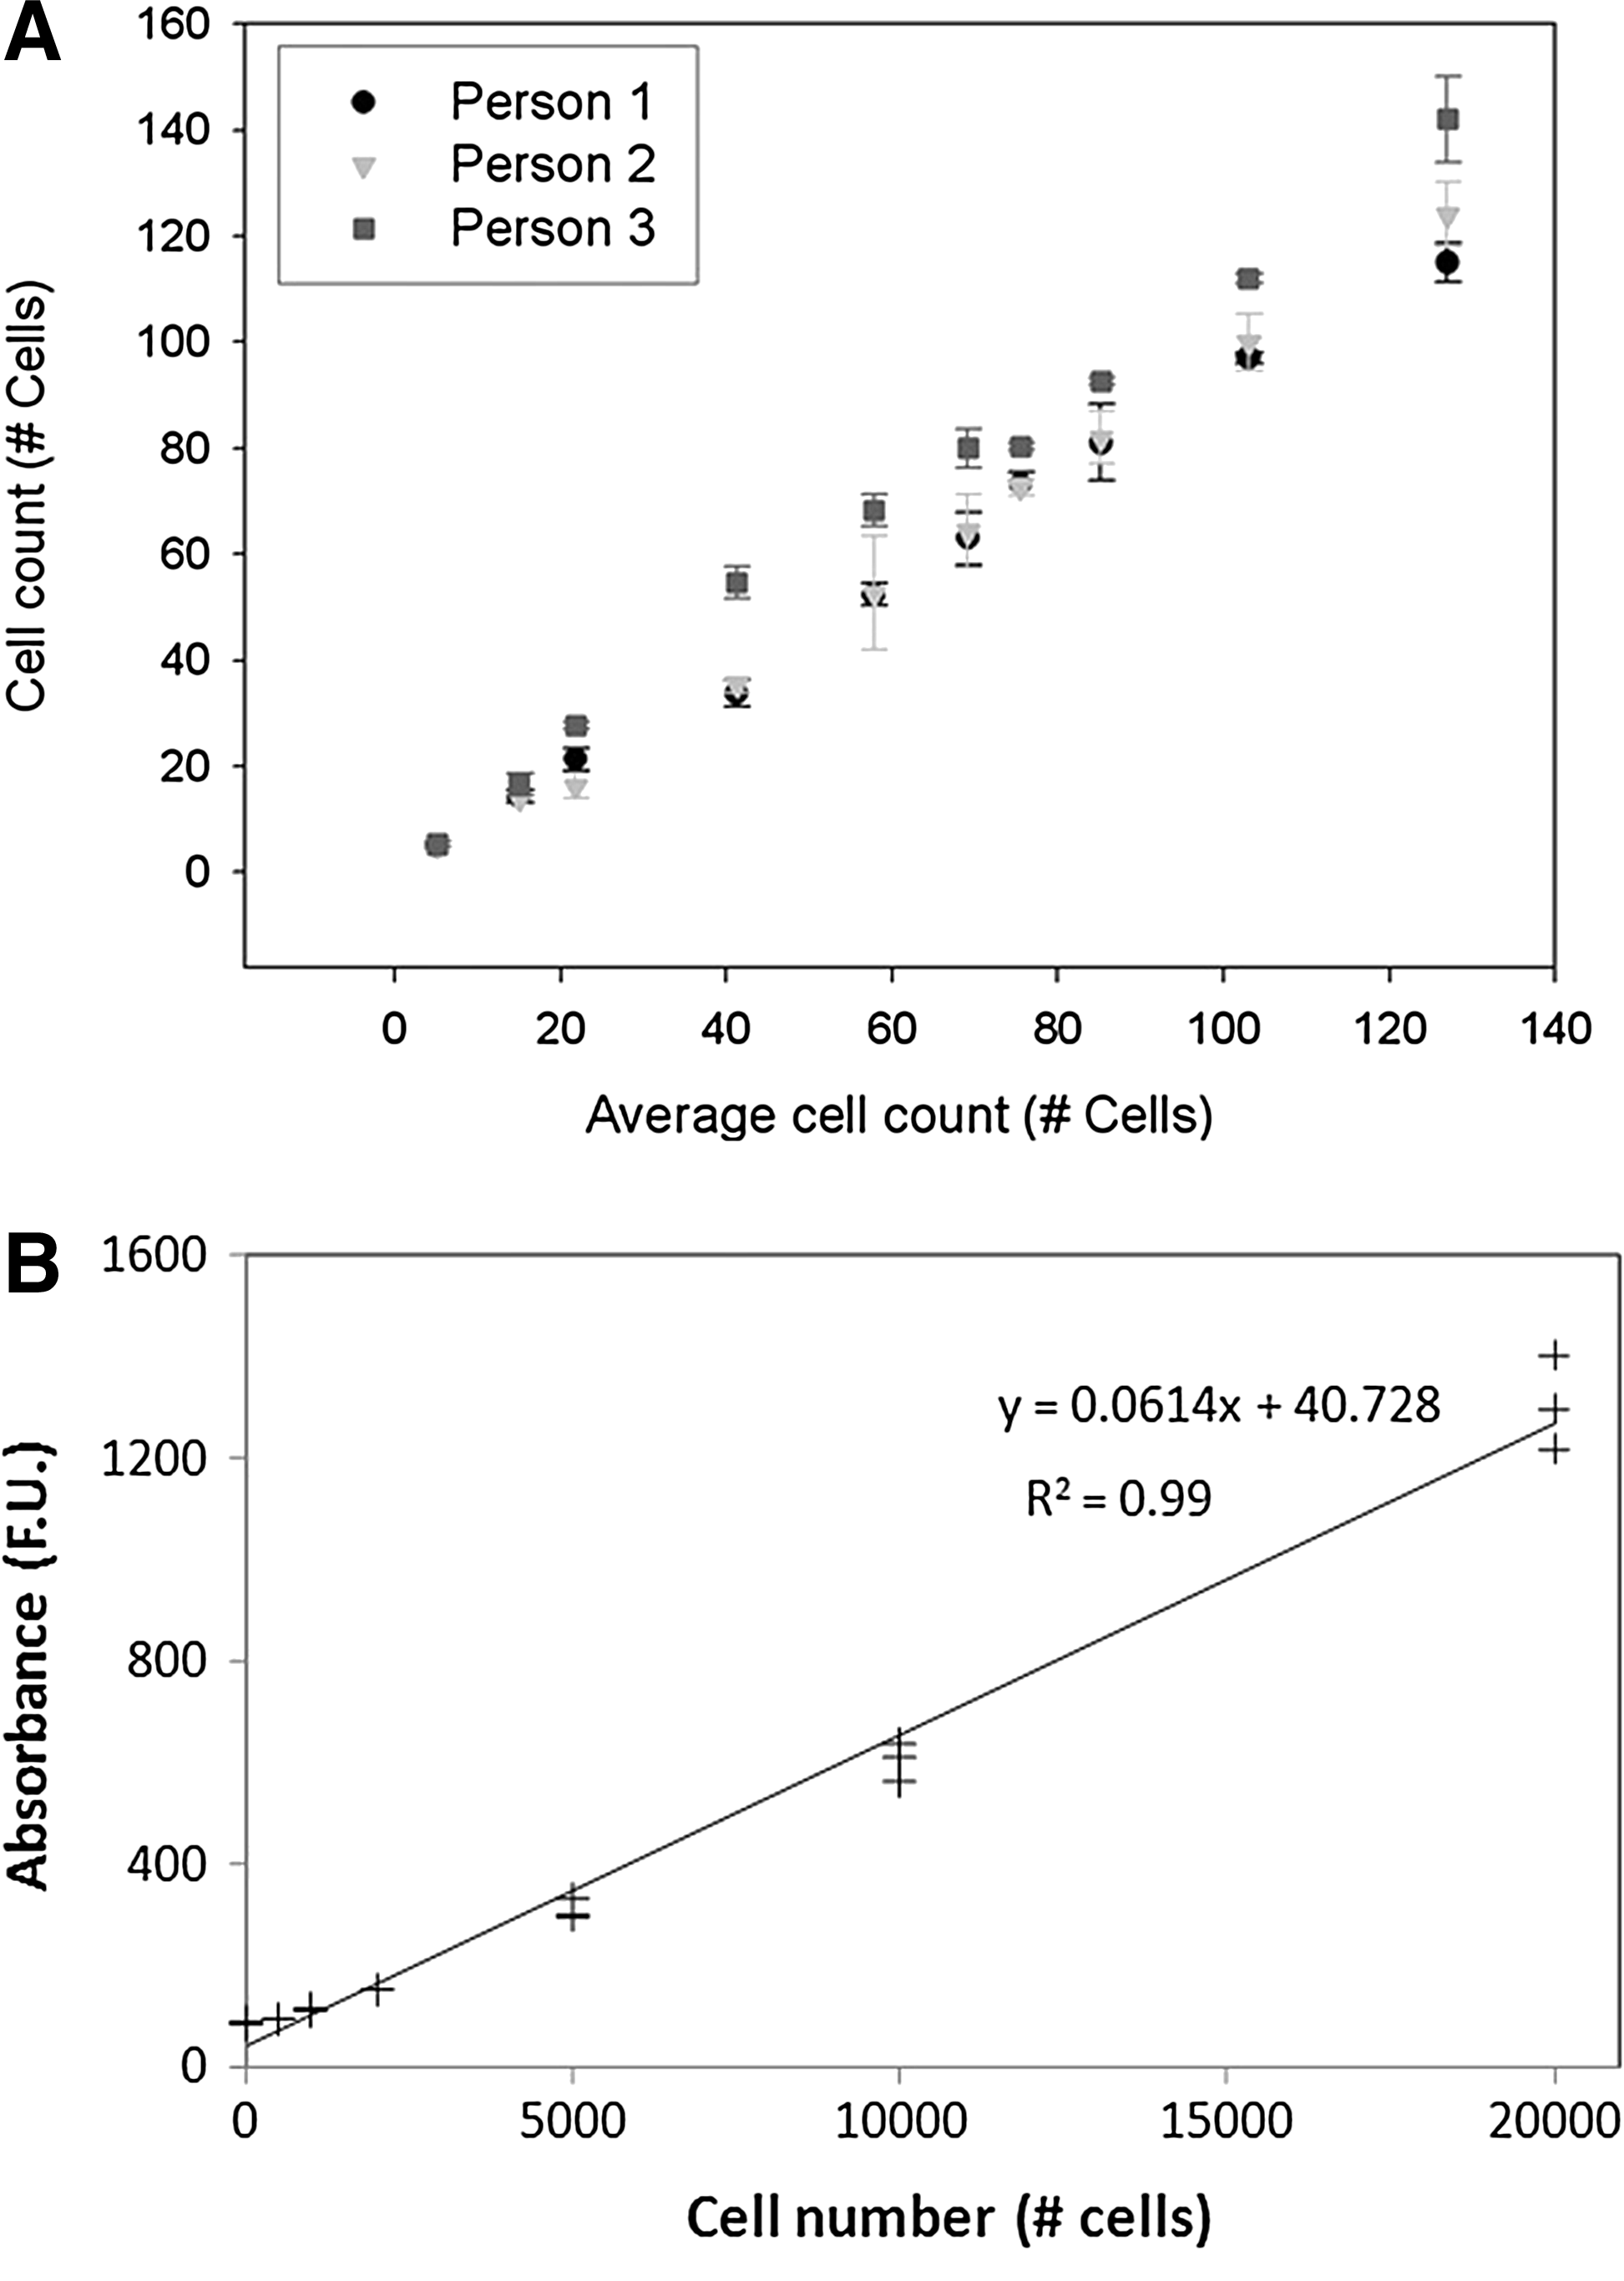
Metabolic activity
The graph in Figure 4B shows there was a linear relation (R2=0.99) between the metabolic activity measurement and the cell number of attached hPDCs as measured by manual cell counting. This relation was used to calculate the cell number on the 2D Ti substrates shown in Figure 5A.
Semiautomatic cell counting
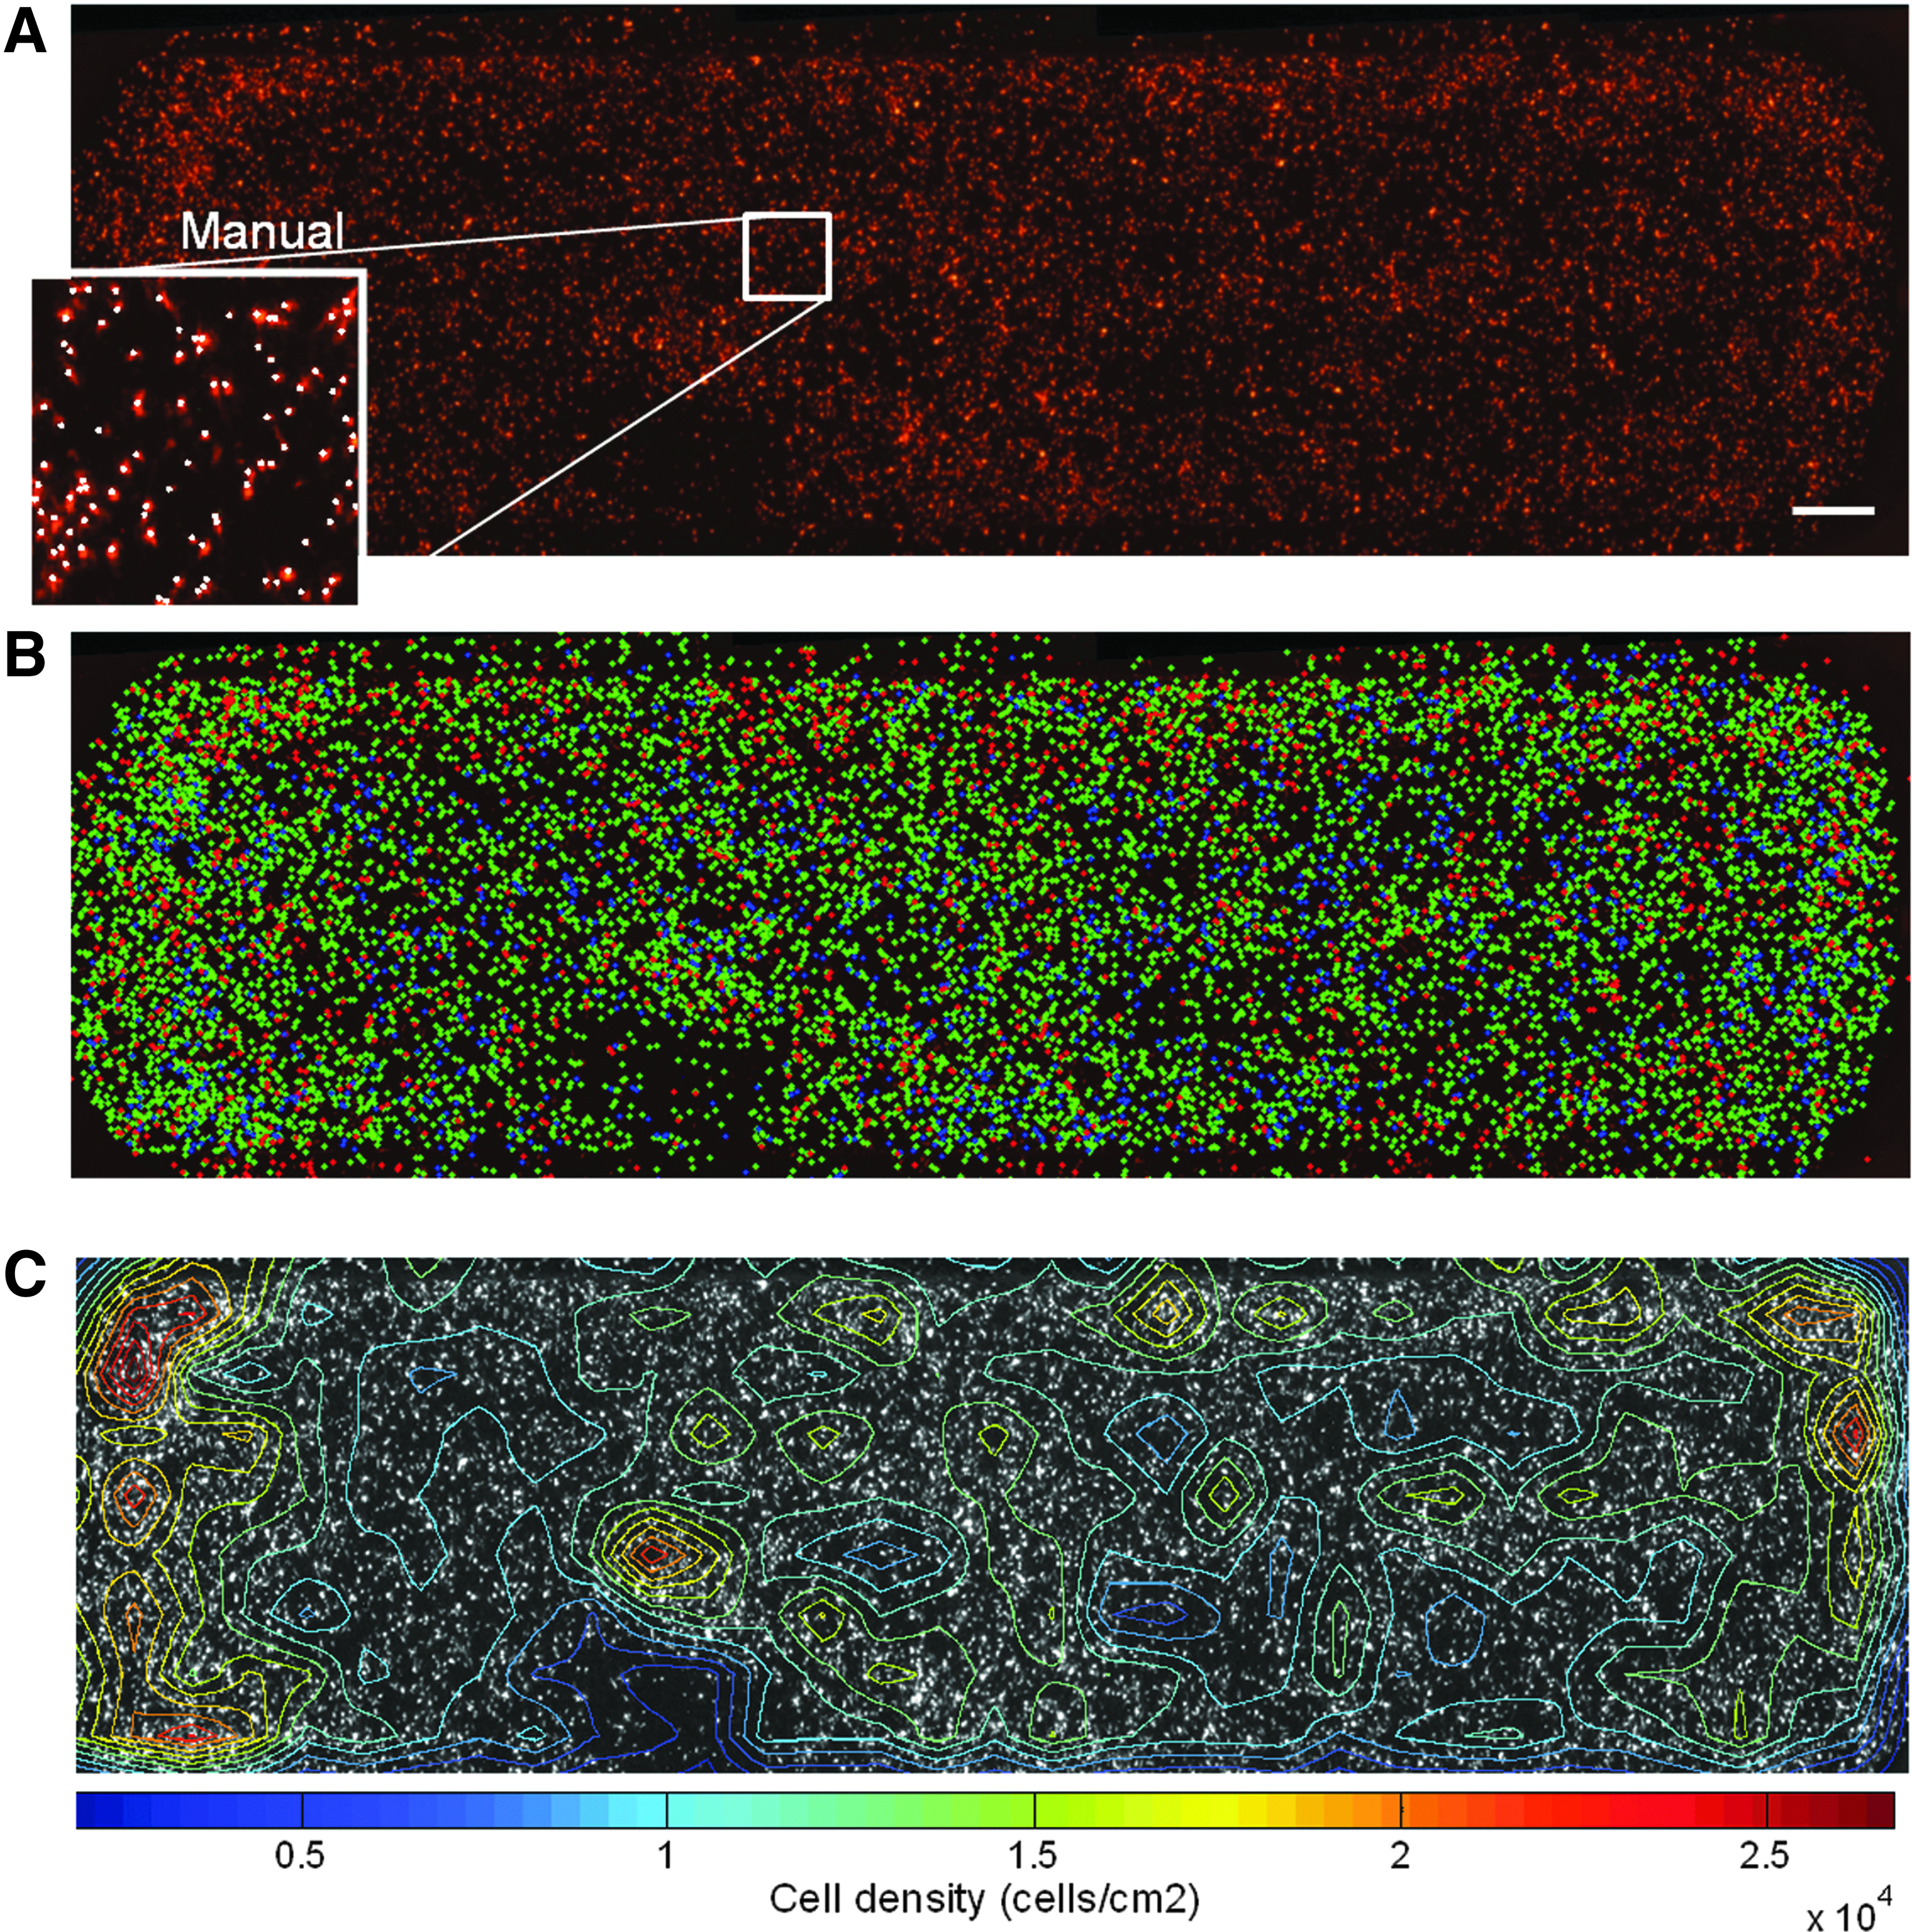
The average difference between the manually and semiautomatically determined cell number was 3.4%, which was not significant (Fig. 5A). The example in Figure 6A and B shows, however, that although the majority of the cells matched (green), there are also unmatched semiautomatic (red) and unmatched manual cells (blue). Figure 5B shows the ratios of these three cell fractions for all 2D Ti substrates. The total mismatch, which is the sum of the two unmatched fractions, is 25.2% on average. It increases with cell density from 18.2% for 1940 cells/cm2 to 35.0% for 12,680 cells/cm2. The cell number estimated from the metabolic activity measurement was significantly lower than the semiautomatically determined cell numbers, but had a similar trend. This difference could be explained by a small error in the cell number calculated from the metabolic activity measurements, since this calculation was based on a calibration curve that was created for cells cultured on 2D culture plastic instead of 2D Ti substrates.
3D Ti scaffolds
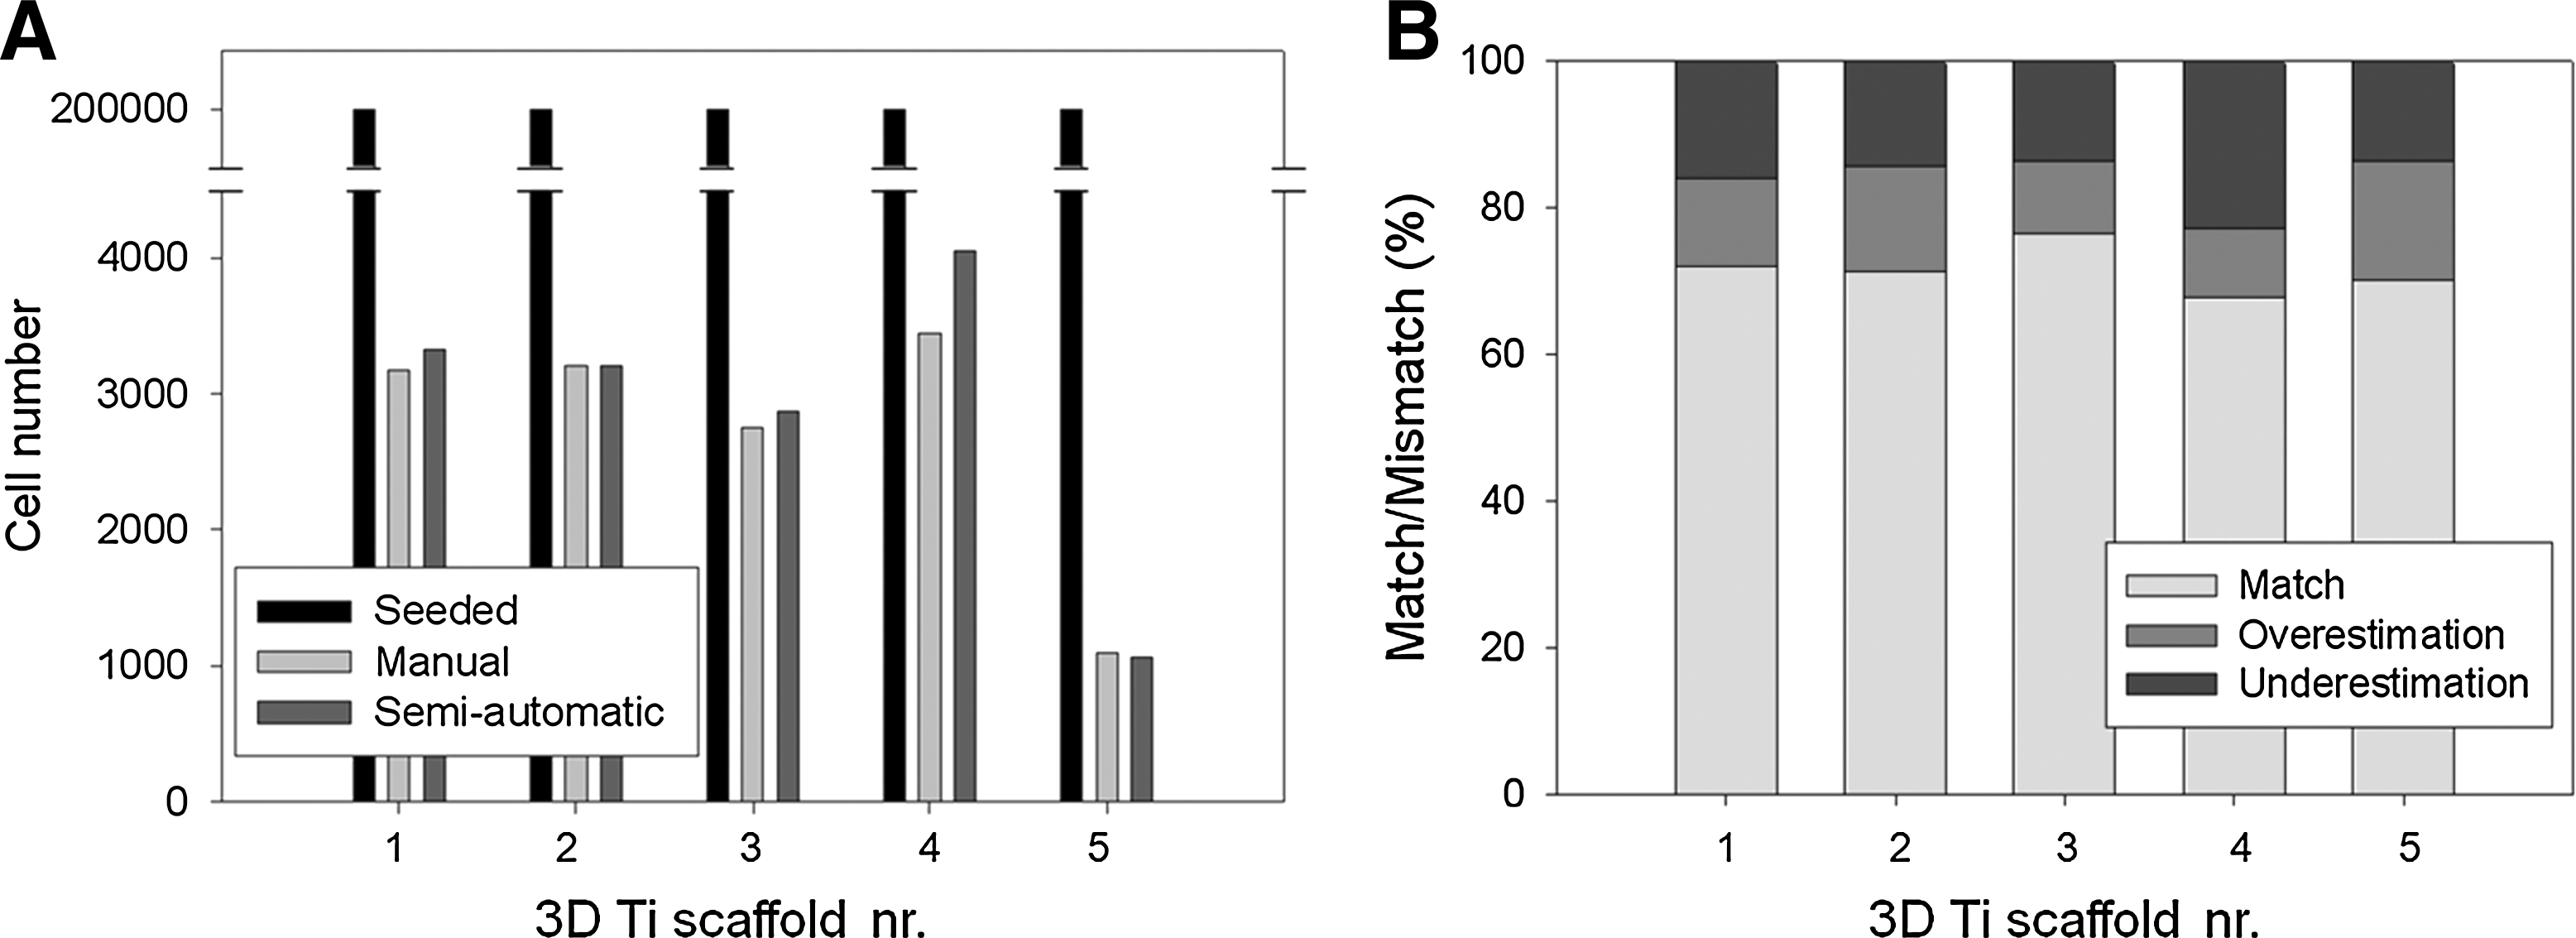
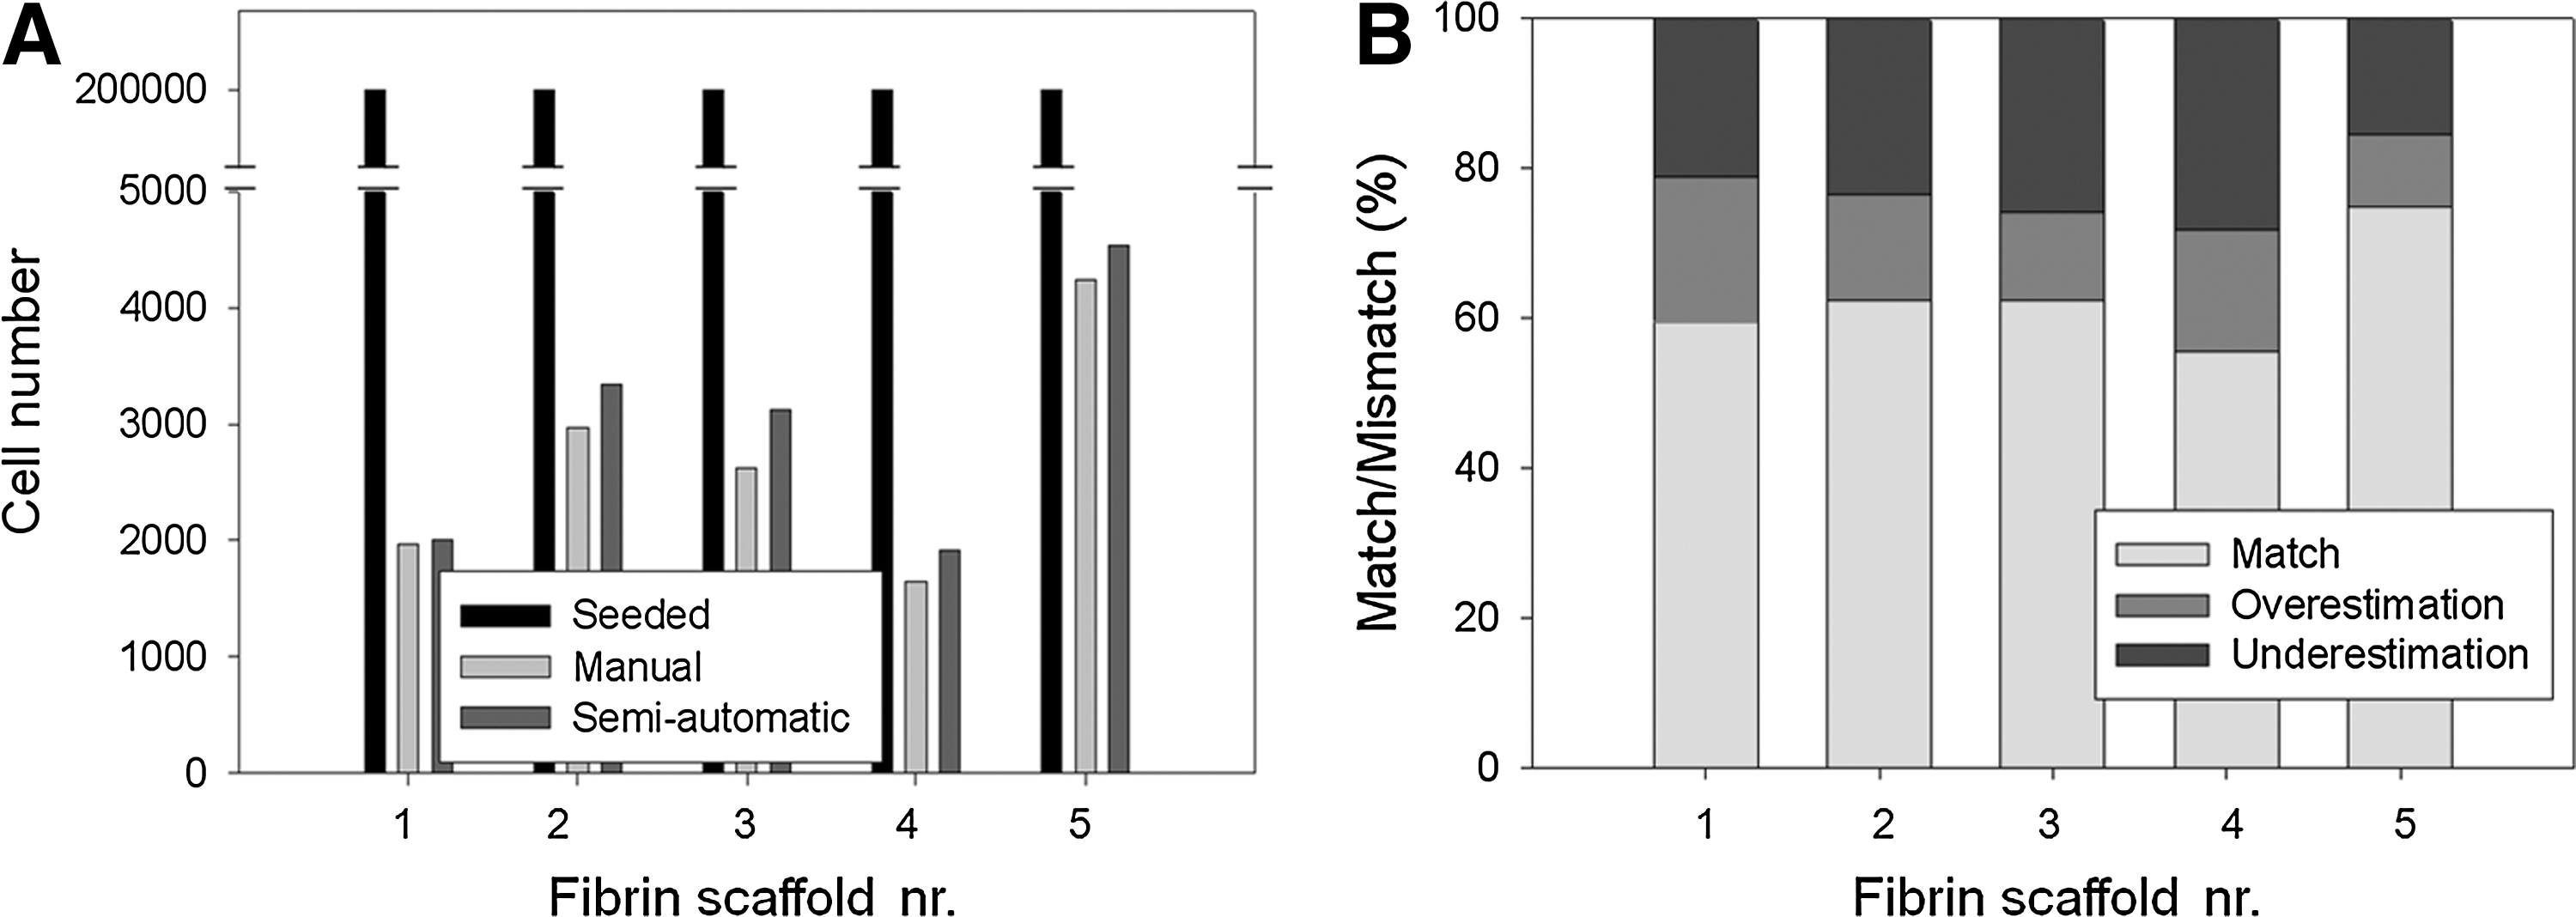
For the 3D Ti scaffolds, the average absolute difference between manually and semiautomatically determined cell numbers was 5.9% (Fig. 7A). Figure 8B shows the presence of both unmatched manually counted cells (blue dots) and unmatched semiautomatically counted cells (red dots), which were homogeneously distributed across the scaffold. The total mismatch, which is the summation of both unmatched fractions, was 28.4% on average (Fig. 7B).
Fibrin hydrogels
For the fibrin hydrogels, there was a net underestimation of the cell number by the semiautomatic counting of 14.1% compared to the manual counting (Fig. 9A). Figure 10B shows that apart from the matched cells (green), there were also unmatched manually counted (blue dots) and semiautomatically counted (red dots) cells. Unlike for the other two scaffold types, there was a heterogeneous distribution of both unmatched cell fractions across the fibrin hydrogel. At the scaffold edges, where the background intensity was different, there were locally higher concentrations of unmatched semiautomatically counted cells (red dots), whereas the unmatched manually counted cells were more concentrated in the center of the scaffold (blue dots). Figure 9B shows that there is on average a higher total mismatch 35.7% than for the other scaffold types, caused by the higher percentage of both underestimation and overestimation.
Discussion
The semiautomatic approach could count cells on a 2D Ti substrate, in a 3D Ti scaffold, and in a fibrin hydrogel with an average difference in the cell number compared to manual counting of 3.4%, 5.9%, and 14.1%, respectively. The average total mismatch, which takes into account the underestimated and overestimated cell fraction, was respectively 25.2%, 28.4%, and 35.7% on average for these three scaffold types. To put the performance of the algorithm in perspective, several things should be kept in mind. First of all, the average difference in the cell number is an underestimation of the accuracy, since the number of unmatched manual and semiautomatic cells cancel out each other. The total mismatch does account for this effect and, consequently, results in higher error values than the absolute difference in the cell number. It is opportune to mention here that the majority of the unmatched fraction is caused by under- and over-segmentation of connected cells and not by objects in the images that do not represent cells. Other studies that use dedicated image processing for one specific image type, report lower total mismatch values (7%–10%).17,19 However, because these algorithms are developed for one specific application, their use for TE is limited.
There is a limit to the accuracy that can be obtained by any automatic or semiautomatic cell counting algorithm, which is determined by the repeatability of the manual cell counting. Numerous studies have depicted the interoperator variability in manual visual cell counting with reported values of 3% for well-separated leucocytes to 59% for tightly packed fluorescent cells.17,21 For the 2D Ti substrate, used to benchmark the algorithm, the interoperator variability was 12.9%, which was higher than the average difference in the cell number between the manual and the semiautomatic cell counting on the 2D Ti substrates (3.4%). Keeping this in mind, the accuracy of this semiautomatic approach was acceptable as proof of concept.
Purpose-specific cell counting algorithms have been developed for various specific applications like white blood cells 20 or hepatocytes 23 on 2D glass plates, fibroblasts in a hydrogel, 14 or stem cells in embryoid bodies. 17 The semiautomatic approach, however, is capable of counting cells in very different image types without any manual interventions in the image processing sequence itself. It should be recognized that this approach will need further development for different image types. For example, in the fibrin hydrogels, there was a net underestimation at locations of extreme high or low background intensity (mainly at the edges). Background heterogeneity is a challenge that is not unique to this algorithm and existing algorithms can most likely be implemented to overcome this limitation. 16
An important goal of this study was to find an objective way of showing the accuracy of the semiautomatically counted cells. The manually counted patch provided a way to do this. The main advantage of the semiautomatic cell counting is that the manual interaction is shifted from the image processing to the manual cell counting. This way the expertise of the researcher is used and the results are not influenced by manual changes in the image processing parameters. Based on an image of the manually counted patch and on the numerical data from the error in cell number and total mismatch, any outsider can critically asses the reliability of the results. This is a crucial requirement for any automatic cell counting method to be accepted for research and to be used as a routine method for analysis or quality control.
This method can be categorized as computer learning, which has a broad toolbox of algorithms that can be used also for counting cells. Artificial neural networks, for example, is a learning method that is very usable for efficiently training the image processing parameters and has already been explored for cell counting. 11 It enables the user to define the desired total mismatch and can then iteratively be learned after every manually counted cell. This minimized the manual counting and thereby increased the efficiency of the training step.
The algorithm now trains for only three parameters, but can be easily expanded with any number of extra modules. Most of the existing filters that were developed for dedicated true automatic algorithms can be used to drastically increase the robustness of the algorithm, without increasing the effort for the user. Once this semiautomatic counting concept has matured, it could drastically increase the use of quantitative cell imaging. Less standardization would be needed for image acquisition, which provides biological researchers a higher flexibility when designing experiments that include microscopic imaging or require information on cell number and distribution when seeded in/on carrier materials.
Because this cell counting method is very generic, it could potentially be used in many other applications besides bioreactor experiments and 3D cell culture for TE. One of the biggest applications is probably the more standard cell culture experiments on 2D plastic substrates (like flasks, Petri dishes, or well plates), which in general are easily transferable to a microscope. In these experiments, live cell imaging in combination with semiautomatic cell counting could be a powerful tool to nondestructively measure changes in cell number and cell distribution over time, thereby replacing destructive DNA measurement techniques or indirect methods like metabolic activity assays. As demonstrated in this research, the metabolic activity (measured by an alamarBlue assay) and cell number (measured by manual counting) are highly correlated indicating that metabolic activity assays might be used as an alternative method for estimating cell numbers. Although this might be true for certain applications, for TE applications, the use of (semi-) automatic cell counting tools has important advantages compared to metabolic activity assays: (1) imaging techniques allow not only quantifying cell numbers, but also cell distribution; (2) metabolic activity assays need calibration curves for specific cell types and specific cell states, whereas this is not necessary for imaging techniques; (3) imaging techniques work also for low cell numbers, whereas for metabolic activity assays, a minimum number of cells is needed; (4) imaging techniques allow very frequent estimation of cell numbers compared to metabolic activity assays that are much more time-consuming. However, both techniques are complementary and when applied together, they allow generating more information about and gaining more insight in cell behavior, which can be used as a basis for a more optimal monitoring and control of cell behavior.
Footnotes
Acknowledgments
This work is part of Prometheus, the Leuven Research & Development Division of Skeletal Tissue Engineering of the KU Leuven. Thanks to Jan Demol and Yantian Chen for the images of the fibrin hydrogels and 3D Ti scaffolds.
Disclosure Statement
No competing financial interests exist.