
Abstract
We described a novel substrate-mediated RNA interference (RNAi) technology to investigate the effect of neural crest marker expression on the multipotency of human gingival fibroblasts (HGFs). HGFs showed significantly higher neural and chondrogenic differentiation potentials compared with adult bone-marrow-derived mesenchymal stem cells and stem cells from human exfoliated deciduous teeth. By sending target-specific RNAi agents with the conventional vehicle (PolyFect), we observed that the multipotency of HGFs was closely associated with the expression of neural crest marker gene Forkhead box D3 (FoxD3). Using the novel chitosan substrate-mediated method, we successfully delivered short-hairpin RNA constructs to HGFs grown on chitosan without the use of conventional vehicles. The delivery efficiency measured by flow cytometry showed a 10-fold increase for HGFs on chitosan versus those on culture dish, and the cell viability was >95%. Moreover, HGFs with FoxD3 gene knockdown did not form spheroids on chitosan. Based on this working principle, we further selected the gene-silenced population from HGFs. The nonsilenced HGFs showed much higher neural differentiation ability with the nestin expression 40-fold greater than FoxD3-silenced population after induction, suggesting the feasibility of the method to silence genes. The new substrate-mediated gene silencing platform that combines the use of substrate and RNAi can be used to clarify the functions of important genes without suffering the toxicity.
Introduction
M
Previously we have shown that chitosan as the cell culture substrate can select the MSC-like population from HGFs, based on the trend that they express N-cadherin and form multicellular spheroids on chitosan. HGFs also show neural crest marker gene expression. 18 On the other hand, MSCs may change their migration rate and endocytic phenotype during spheroid formation, which facilitates the uptake and transfer of DNA plasmids.19,20 RNA interference (RNAi) is a recently available technology by which a targeted gene can be turned down. 21 Like gene delivery, the transfer of target-specific RNAi agents normally requires viral or nonviral vehicles for delivery. The nonviral vehicles such as cationic lipids and polymeric nanoparticles can cause severe toxicity and an alteration in cell behavior. On the other hand, the possible delivery of RNAi by substrate mediation is rarely reported.
In the current study, the neural crest marker gene expression and the differentiation properties were analyzed for HGFs in comparison with SHED and adult bone-marrow-derived MSCs (HBMSCs). Greater differentiation abilities of HGFs versus HBMSCs were connected to the neural crest marker gene expression by the RNAi approach. The greater cell mobility as well as the ability to form spheroids on chitosan was also associated with the neural crest marker gene expression. We used the aforementioned principles to establish a method to efficiently deliver short-hairpin RNA (shRNA) and knock down Forkhead box D3 (FoxD3), one of the neural crest marker genes, and to further select the gene-silenced population on chitosan without losing cell viability. The successful knockdown of FoxD3 and the impaired neural differentiation of HGFs were demonstrated.
Materials and Methods
Cell isolation
Procedures for obtaining human tissues were approved by the institutional review board (IRB No. 096-05-142). HGFs and SHED were isolated and cultured by the following method. Human gingival tissue was obtained from healthy adult gingiva during surgery with informed consent. Normal exfoliated human deciduous incisors were collected from children of 7 to 8 years old. 8 Tissues were minced into 0.5-mm3 pieces and explanted into 60-mm tissue culture polystyrene (TCPS) dishes. Tissue explants were incubated in alpha-minimum essential medium (α-MEM; Gibco/BRL) supplemented with 10% fetal bovine serum (FBS; Gibco), 100 μg/mL streptomycin (Gibco), 100 U/mL penicillin (Gibco), and 50 μg/mL gentamicin (Gibco). Confluent cells were trypsinized by 0.25% trypsin/EDTA solution (Gibco).
HBMSCs (Cambrex) were cultured in complete medium consisting of low-glucose Dulbecco's modified Eagle's medium (DMEM; Gibco) supplemented by 10% FBS, 10 mL/L penicillin–streptomycin (Biological Industries), and 10 mL/L L-glutamine 200 mM (100×) (Tedia). As a negative control, human skin fibroblasts (HSFs) were isolated by mincing the disposed adult foreskin fragments and incubation in the Hank's balanced salt solution (HBSS) with 2.5 mg/mL trypsin and 5 mg/mL collagenase for 1 h. 22 They were cultured in DMEM with 10% FBS and penicillin–streptomycin.
Cells of fourth to eighth passages were used in the following experiments. All cells were checked for the morphology by an inverted phase-contrast microscope and for the proliferation by the MTT assay. Cells were analyzed for the expression of neural crest marker genes FoxD3, Slug, and SRY-box containing gene 10 (Sox10) by reverse transcription-polymerase chain reaction (RT-PCR), with details described at the end of next section. Surface markers were quantified by flow cytometry, including CD29 (BioLegend), CD31 (BioLegend), CD34 (BioLegend), CD44 (BioLegend), CD45 (BioLegend), CD73 (BD Pharmingen), CD90 (Serotec), CD105 (BioLegend), and CD146 (BD Pharmingen). A flow cytometer (FACS caliber, BD) was used for the fluorescence analysis.
Characterization of multilineage differentiation
For osteogenic differentiation, cells in a density of 3×10³ cells/cm2 were plated in α-MEM supplemented with 10% FBS, 10 mM β-glycerophosphate (Sigma), 0.2 mM ascorbate-2-phosphate (Sigma), and 10−8 M dexamethasone (Sigma). 18 The culture was maintained for 3 weeks. The medium was refreshed twice a week. Calcium deposition in the cell culture was assessed by von Kossa stain. Cells cultured for 3 weeks were rinsed in phosphate-buffered saline, fixed, stained with 5% silver nitrate (Sigma), and exposed to ultraviolet light for 30 min. They were then rinsed in water, followed by 5% sodium thiosulfate (Sigma) for 3 min, and washed again before the addition of 0.1% Fast Red (Sigma) as the contrast stain. Calcium deposition was examined under an optical microscope. The numbers of von Kossa-stained mineralized nodules were identified and counted at a higher magnification of 400×by image analysis. The expression of osteogenic markers runt-related transcription factor 2 (Runx2) and osteocalcin (OCN) was analyzed by RT-PCR.
For adipogenic differentiation, cells in a density of 2×10⁴ cells/cm2 were cultured in high-glucose DMEM (Gibco) supplemented with 10% FBS, 0.5 mM isobutyl-methylxanthine (Sigma), 200 μM indomethacin (Sigma), 10−6 M dexamethasone, and 10 μg/mL insulin and cultured for 3 weeks. 18 The induction medium was refreshed twice a week. Lipid droplets in the cell culture were confirmed by Oil red O staining. Cells were fixed in 10% formalin, treated with 0.3% Oil red O solution (Sigma) for 15 min, and then repeatedly washed with tap water. Samples were examined under the optical microscope. The numbers of lipid droplets were quantified by automated image analysis. The expression of adipogenic markers peroxisome proliferator-activated receptor γ2 (PPARγ2) and lipoprotein lipase (LPL) was analyzed by RT-PCR.
For chondrogenesis, the micromass culture was used to grow chondrogenic cells in 3D conditions. Highly concentrated cells (50×104 cells in 20 μL) were plated on polyester Transwells (0.4-μm pore size; Corning) in 24-well tissue culture plates (Corning) and incubated at 37°C for 4 h to allow cell encapsulation. They were then overlaid with serum-free low-glucose DMEM containing 10 ng/mL transforming growth factor-beta 3 (TGF-β3) (Peprotech), 0.1 μM dexamethasone, 50 μg/mL L-ascorbate-2-phosphate, 40 μg/mL L-proline (Sigma), 1% insulin–transferrin–selenium (ITS+premix) 100×(Sigma), and 1% penicillin–streptomycin for a period of 3 weeks. 23 The induction medium was changed twice a week. The representative constructs from 21 days of micromass culture were sectioned by flashed-frozen sectioning (10 μm). To identify the presence of aggrecan in the specimens, sections were stained with Alcian blue (Sigma) for the sulfated glycosaminoglycans. Other specimens were labeled with the specific primary antibody for type II collagen (Chemicon) 24 and FITC-conjugated goat anti-mouse IgG as the secondary antibody (Chemicon). To quantify the cell number and the amount of type II collagen in the micromass culture, some constructs were digested in papain solution for 24 h at 60°C. After reaction with 0.1 μg/mL Hoechst 33528 dye in the dark for 1 h at room temperature, the concentration was measured (with excitation at 365 nm and emission at 458 nm) by a fluorescence spectrophotometer (Hitachi F2500). Cell number was calculated based on a standard curve. 24 The amount of collagen was quantified by a native type II collagen capture ELISA kit (Rheumera™; ASB-5000-EX). The ELISA kit was used according to the manufacturer's protocol. The expression of chondrogenic markers Sox9 and collagen type II (Col II) was analyzed by RT-PCR.
For neural differentiation, Neurobasal A (Gibco), B27 supplement (Gibco), 1% penicillin, 20 ng/mL epidermal growth factor (Peprotech), and 40 ng/mL fibroblast growth factor 2 (Peprotech) were used as the induction medium to culture 5×10⁴ cells attached on 0.1% gelatin (Sigma)–coated dishes for 14 days. 18 The induction medium was changed twice a week. For neural-specific protein staining, cells were fixed in 4% formaldehyde for 15 min and then blocked and incubated with primary antibodies (nestin, Chemicon, 1:200; glial fibrillary acidic protein [GFAP], Abcam, 1:500; β-III tubulin, Sigma, 1:500) for 1 h, respectively, and subsequently incubated with the secondary antibody for 45 min. The expression of neurogenic markers nestin, GFAP, and β-tubulin was analyzed by RT-PCR.
To analyze the gene expression of neural crest markers and differentiation markers, total RNA was extracted from cells by using Trizol® reagent (Invitrogen). cDNA synthesis and amplification via PCR were performed using the RevertAid™ First Strand cDNA Synthesis Kit (MBI Fermentas). The cDNA obtained from 1 μg of total RNA was used for one PCR by PCR Master Mix Kit (Applied Biosystems). The PCR mixture was made up in 25 μL of 10-μM-targeted gene oligonucleotide primers. The reaction was performed by a Thermal Cycler (GeneAmp PCR System 2700; Applied Biosystems). PCR cycles were performed consisting of denaturing at 94°C, various annealing temperatures, and extension at 72°C. The primer sequences and the annealing temperature used in this study are listed in Table 1. β-Actin was used as the house-keeping gene for normalization of the data.
RT-PCR, reverse transcription-polymerase chain reaction; F, forward; R, reverse; Sox10, SRY-box containing gene 10; Runx2, runt-related transcription factor 2; OCN, osteocalcin; PPARγ2, peroxisome proliferator-activated receptor γ2; LPL, lipoprotein lipase; Col II, collagen type II; GFAP, glial fibrillary acidic protein.
RNAi studies
Knockdown of FoxD3, Slug, or Sox10 expression was performed on HGFs and HBMSCs by shRNA. All shRNAs were purchased from National RNAi Core Facility Platform (Taiwan). For each gene, five clones with different designs were tested for optimization and the shRNA with the most efficient and reproducible effect was selected for the experiments. The targeted FoxD3 sequence is GCGCAGTCG TTTCT GCGGCCA. The targeted Slug sequence is CCCGT ATCTCTATGAGAGTTA. The targeted Sox10 sequence is CCACGAGGTAATGTCCAACAT.
HGFs or HBMSCs were seeded on TCPS (3×10⁴/cm2) in culture medium (1 mL with 10% FBS) and incubated for 12 h. The medium was replaced by the serum-free medium containing 1 mg of shRNA and 5 μg of PolyFect (Qiagen). Cells were exposed to the specific shRNA for 24 h. This was followed by culturing in complete medium for another 3 days and analysis of gene expression by real-time RT-PCR (data defined as 3 days after transfection). The medium was replaced every 3 days. The RT-PCR analysis was conducted again at 7 and 14 days after transfection. Nontarget RNAi (TRC vector) was used as negative control (blank) for all shRNA experiments.
The effect of RNAi on cell differentiation was measured for cells at 7 days after transfection. The differentiation (osteo-, adipo-, chondro-, or neural differentiation) was performed for a period of 14 days using the method described previously.
HGFs transfected with the specific shRNA against FoxD3, Slug, or Sox10 were seeded on chitosan substrates (3×10⁴ cells/cm2). To prepare the chitosan substrates, chitosan (Fluka, degree of deacetylation 77%) was dissolved in acetic acid (1%) and cast on coverslip glass. The cell morphology and mobility were observed by a real-time cell culture monitoring system (Astec; CCM-Multi). The protein expression of RhoA at 3 days postseeding was analyzed by western blots using anti-human RhoA (Cell Signaling) and GAPDH (Chemicon).
FoxD3 gene expression and the ability to form spheroids on chitosan
For the purpose of this study, HGFs were transfected with FoxD3 shRNA (pLKO_TRC007) in which PAC gene was replaced by turboRFP-C so the transduced cells showed red fluorescence. HGFs were seeded on chitosan in the serum-free medium containing shRNA plasmid with or without PolyFect. Cells were exposed to shRNA for 24 h and the medium was replaced by the complete culture medium. At 3 days after transfection or the initial exposure, cells were analyzed by flow cytometry for transfection efficiency (percentage of red fluorescent cells). Besides, cell viability was determined by flow cytometry using Annexin V-FITC/propidium iodide (PI) apoptosis detection kit (BD Biosciences). Viable cells are FITC Annexin V and PI negative, and early apoptotic cells are FITC Annexin V positive and PI negative, whereas cells at end-stage apoptosis and death are FITC Annexin V and PI positive. In another group, HGFs were seeded on chitosan for 3 days before adding shRNA. Cells were exposed to shRNA for 24 h and analyzed at 2 days after medium replacement, to contrast the transfection efficiency for HGFs before and after the spheroid formation. TCPS was used as the control substrate.
Selection of highly silenced cells by chitosan
To select highly silenced cells, a novel knockdown protocol using chitosan as the culture substrate was developed. First, HGFs were transfected with the specific shRNA (FoxD3) on chitosan with or without PolyFect. Three days after transfection, cells were moved to another chitosan membrane and the culture continued for another 3 days. The images were captured by the real-time cell culture monitoring system. At the end point, HGFs were collected either nonselectively (all population), or collected as “spheroid-forming subpopulation” (HGF-S) or “nonspheroid-forming subpopulation” (HGF-N). To collect HGF-S, the culture plate was removed from the incubator. The pH alteration caused the spheroids to detach from chitosan membranes. They were soon collected by gentle shaking, flushing with medium, and pipetting. The collection of HGF-S was confirmed by the microscope. HGF-N was then collected by trypsinization. Each subpopulation was analyzed for FoxD3 expression (gene and protein) and neural differentiation capacities. The gene expression was analyzed by RT-PCR and the protein expression was analyzed by western blots using mouse anti-human FoxD3 (Abcam) and GAPDH.
Statistical analysis
Multiple samples (n=3–4) were used in each experiment and numerical values were expressed as the mean±standard deviation. Reproducibility was confirmed by three independent experiments. Experiments were repeated on cells from three different donors. Statistical differences among the experimental groups were assessed by the analysis of variance followed by the Student's t-test. p-Values <0.05 were considered statistically significant.
Results
Phenotypic characterization of HGFs, SHED, and HBMSCs
Phenotypic characterization was performed for cells of the fourth passage. The morphology of HGFs, in comparison with HSFs, SHED, and HBMSCs, is shown in Figure 1A. All cells displayed fibroblast-like morphology. The proliferative potential of these cells was evaluated by the cell doubling time. The doubling time of HGFs was 56.52±1.24 h, in comparison to 65.19±4.40 h for SHED, 56.82±0.91 h for HBMSCs, and 26.12±1.03 h for HSFs.
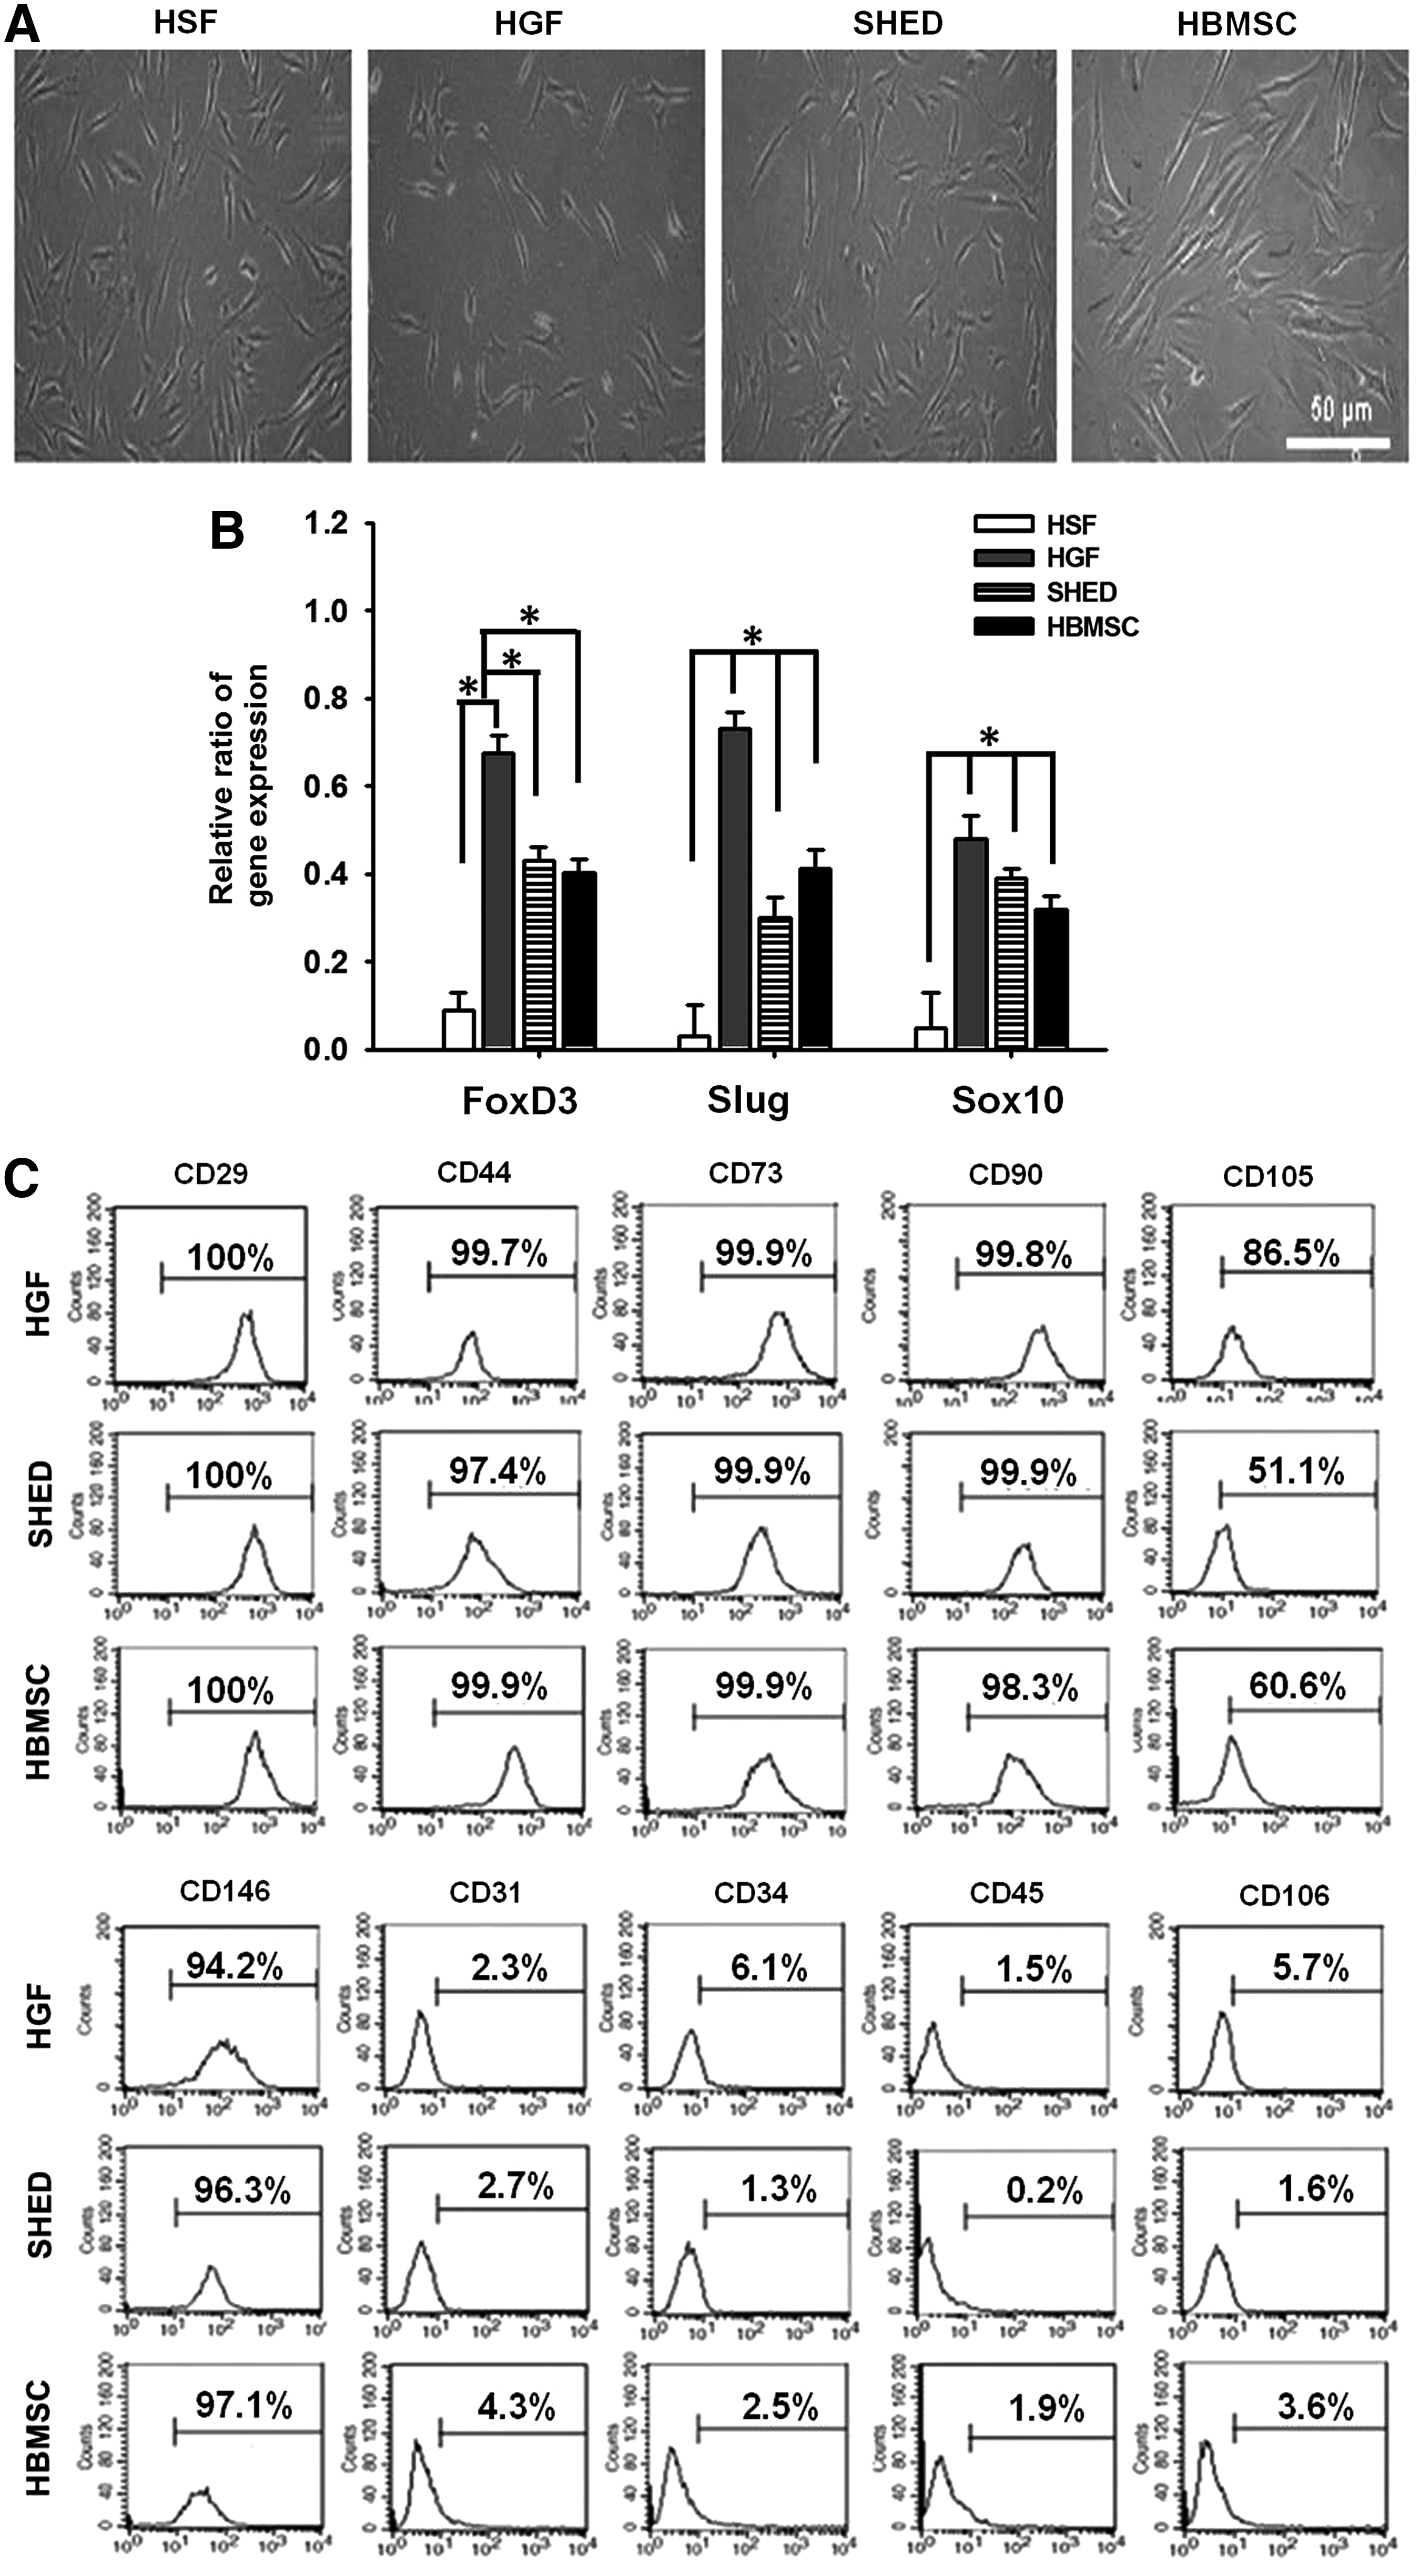
Characteristics of HSFs, HGFs, SHED, and HBMSCs.
The neural crest marker gene expression is shown in Figure 1B. HGFs, SHED, and HBMSCs had evident expression of FoxD3, Slug, and Sox10 genes. In particular, HGFs had greater neural crest marker gene expression than SHED and HBMSCs. On the other hand, SHED and HBMSCs had similar expression levels of these genes.
Results from flow cytometric analyses are shown in Figure 1C. The expression of CD29, CD31, CD34, CD44, CD45, CD73, CD90, CD105, CD106, and CD146 was compared among different cells. HGFs, SHED, and HBMSCs were positive for specific antigen markers of MSCs, such as CD29, CD44, CD73, CD90, CD105, and CD146. The expression of the endothelial cell and hematopoietic cell surface markers, like CD31, CD34, CD45, and CD106, was minimal (<6%, considered as negative). For better comparing HGFs with the other types of cells, such as HBMSCs, SHED, and HSFs, the same passage numbers (4–8) were used for all cells in the following studies.
Multilineage differentiation
To examine and compare the osteogenic potential of cells in the presence of inductive medium, the expression of osteogenic genes (Runx2 and OCN) was analyzed by RT-PCR. Figure 2A clearly demonstrated that Runx2 was induced for HGFs, SHED, and HBMSCs at 7 days as compared with the undifferentiated control. The expression level of Runx2 kept increasing until 14 days and decreased at 21 days. On the other hand, the OCN gene was induced in HGFs and SHED at 14 days and in HBMSCs at 7 days as compared with the undifferentiated control. The expression levels of these genes in HSFs (negative control) were very low. Based on the gene expression, the osteogenic potential of HBMSCs was the highest, while that of HGFs and SHED was comparable to each other. At 21 days, HGFs, SHED, and HBMSCs showed positive staining with von Kossa (Fig. 2B). Untreated control cultures and HSFs (21 days) were negative for von Kossa stain. The amount of mineralized matrix deposition at 21 days quantified based on the images of bone nodules (in Fig. 2B) was similar (∼110 nodules per dish) among the groups of HGFs, SHED, and HBMSCs.
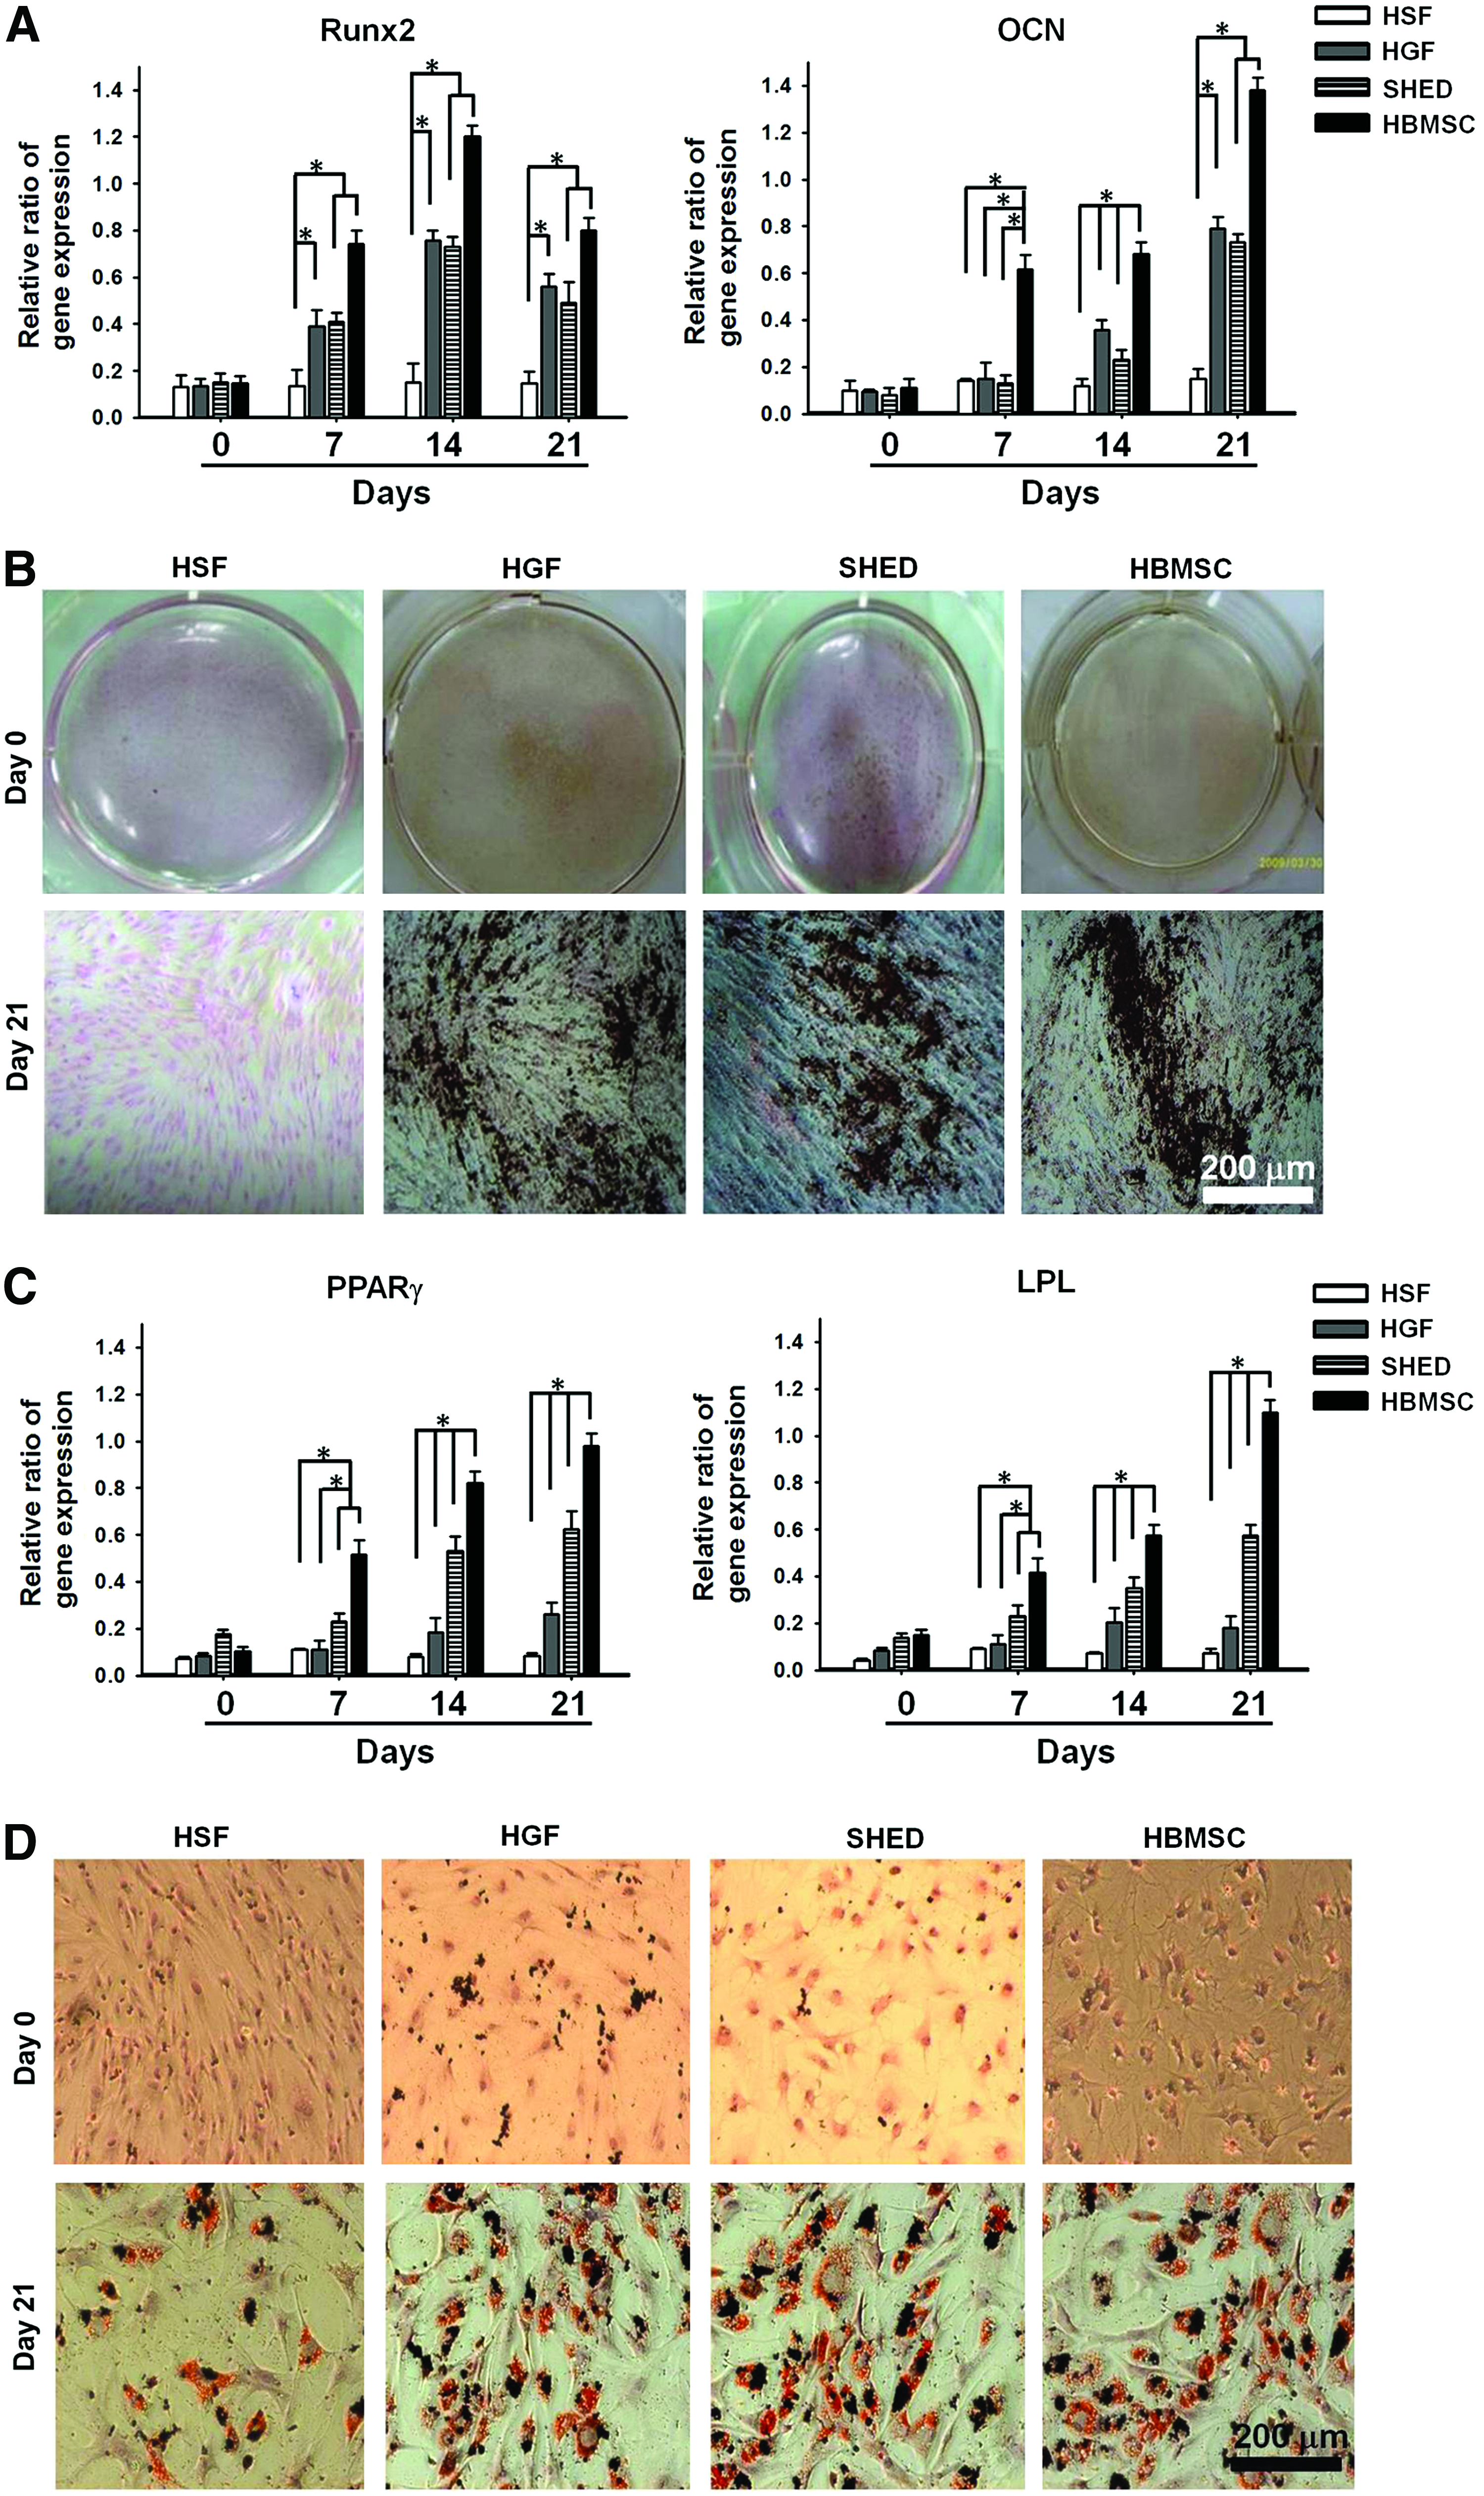
Analysis for the osteogenic and adipogenic potentials.
HGFs showed morphological change under the adipogenic induction for a week. The adipogenic differentiation of different types of cells is shown in Figure 2C and D. The RT-PCR analysis (Fig. 2C) demonstrated that the gene expression of PPARγ2 and LPL in HGFs, SHED, and HBMSCs was upregulated as compared with the untreated control after 7–14 days. The expression level of PPARγ2 and LPL in cells was the highest in HBMSCs, followed by SHED, and then HGFs. On the other hand, the expression levels of these genes in HSFs were very low through the induction period. Oil red O staining (Fig. 2D) revealed the ability of HGFs, SHED, and HBMSCs in contrast with HSFs to differentiate into phenotypically mature adipocytes with cytoplasmic lipid droplets. Based on the image analysis of Oil-red-O-stained samples, the number of lipid droplets in HBMSCs (135±4) was significantly (p<0.05) greater than that in HGFs (123±5), while that of SHED fell in between (129±5). HSFs showed few droplets (28±2).
The chondrogenic differentiation of HGFs, SHED, and HBMSCs versus HSFs was examined in micromass culture with TGF-β3 induction. HGFs, SHED, and HBMSCs formed micromass pellets after 21 days, while HSFs could not aggregate to form pellets. The expression of special marker genes, Sox9 and Col II, is demonstrated in Figure 3A. Sox9 gene was upregulated for HGFs, SHED, and HBMSCs after 7 days while Col II gene was upregulated at 14 days. HGFs demonstrated the highest level of Sox9 after 7 days and the highest level of Col II after 14 days. The histological analysis showed high-density pellets composed of chondrocyte-like cells (lacunae) surrounded by a sulfated proteoglycan-rich extracellular matrix (Fig. 3B) and expressing Col II (Fig. 3C). After 21 days, the cell number in the micromass culture of HGFs, SHED, and HBMSCs each increased to about 2.46±0.5-, 2.14±0.06-, and 1.54±0.09-fold of the original cell number. The production of Col II in the micromass culture of HGFs, SHED, and HBMSCs was 2.02±0.08, 1.87±0.08, and 1.58±0.11 ng/pellet, respectively, quantified by ELISA.

Analysis for chondrogenic and neurogenic potentials.
The expression of several neural marker genes after neural induction is shown in Figure 3D. The nestin gene in HGFs, SHED, and HBMSCs was upregulated at 4.5 days, sustained at 7 days, and downregulated at 14 days. On the other hand, the expression levels of GFAP (and β-III tubulin, data not shown) kept increasing during the 14-day period. At 14 days, the expression levels of GFAP in HGFs and SHED were higher than that in HBMSCs. The expression of β-III tubulin was in a similar level among HGFs, SHED, and HBMSCs (data not shown). The immunofluorescence staining at 14 days demonstrated that all cells except HSFs were positively stained for nestin and GFAP (Fig. 3E), as well as β-III tubulin (data not shown).
RNAi studies and the effect of neural crest marker genes on multilineage differentiation
Figure 4 shows the neural marker gene expression for HGFs, HBMSCs, and SHED where the gene was knocked down by the specific shRNA. The transfection was performed on TCPS with the aid of PolyFect. It was evident that the gene expression of FoxD3, Slug, or Sox10 was blocked at 3, 7, and 14 days. In particular, the gene was significantly silenced after 7 days. The effect of gene silencing was more efficient in HGFs than in HBMSCs or SHED.
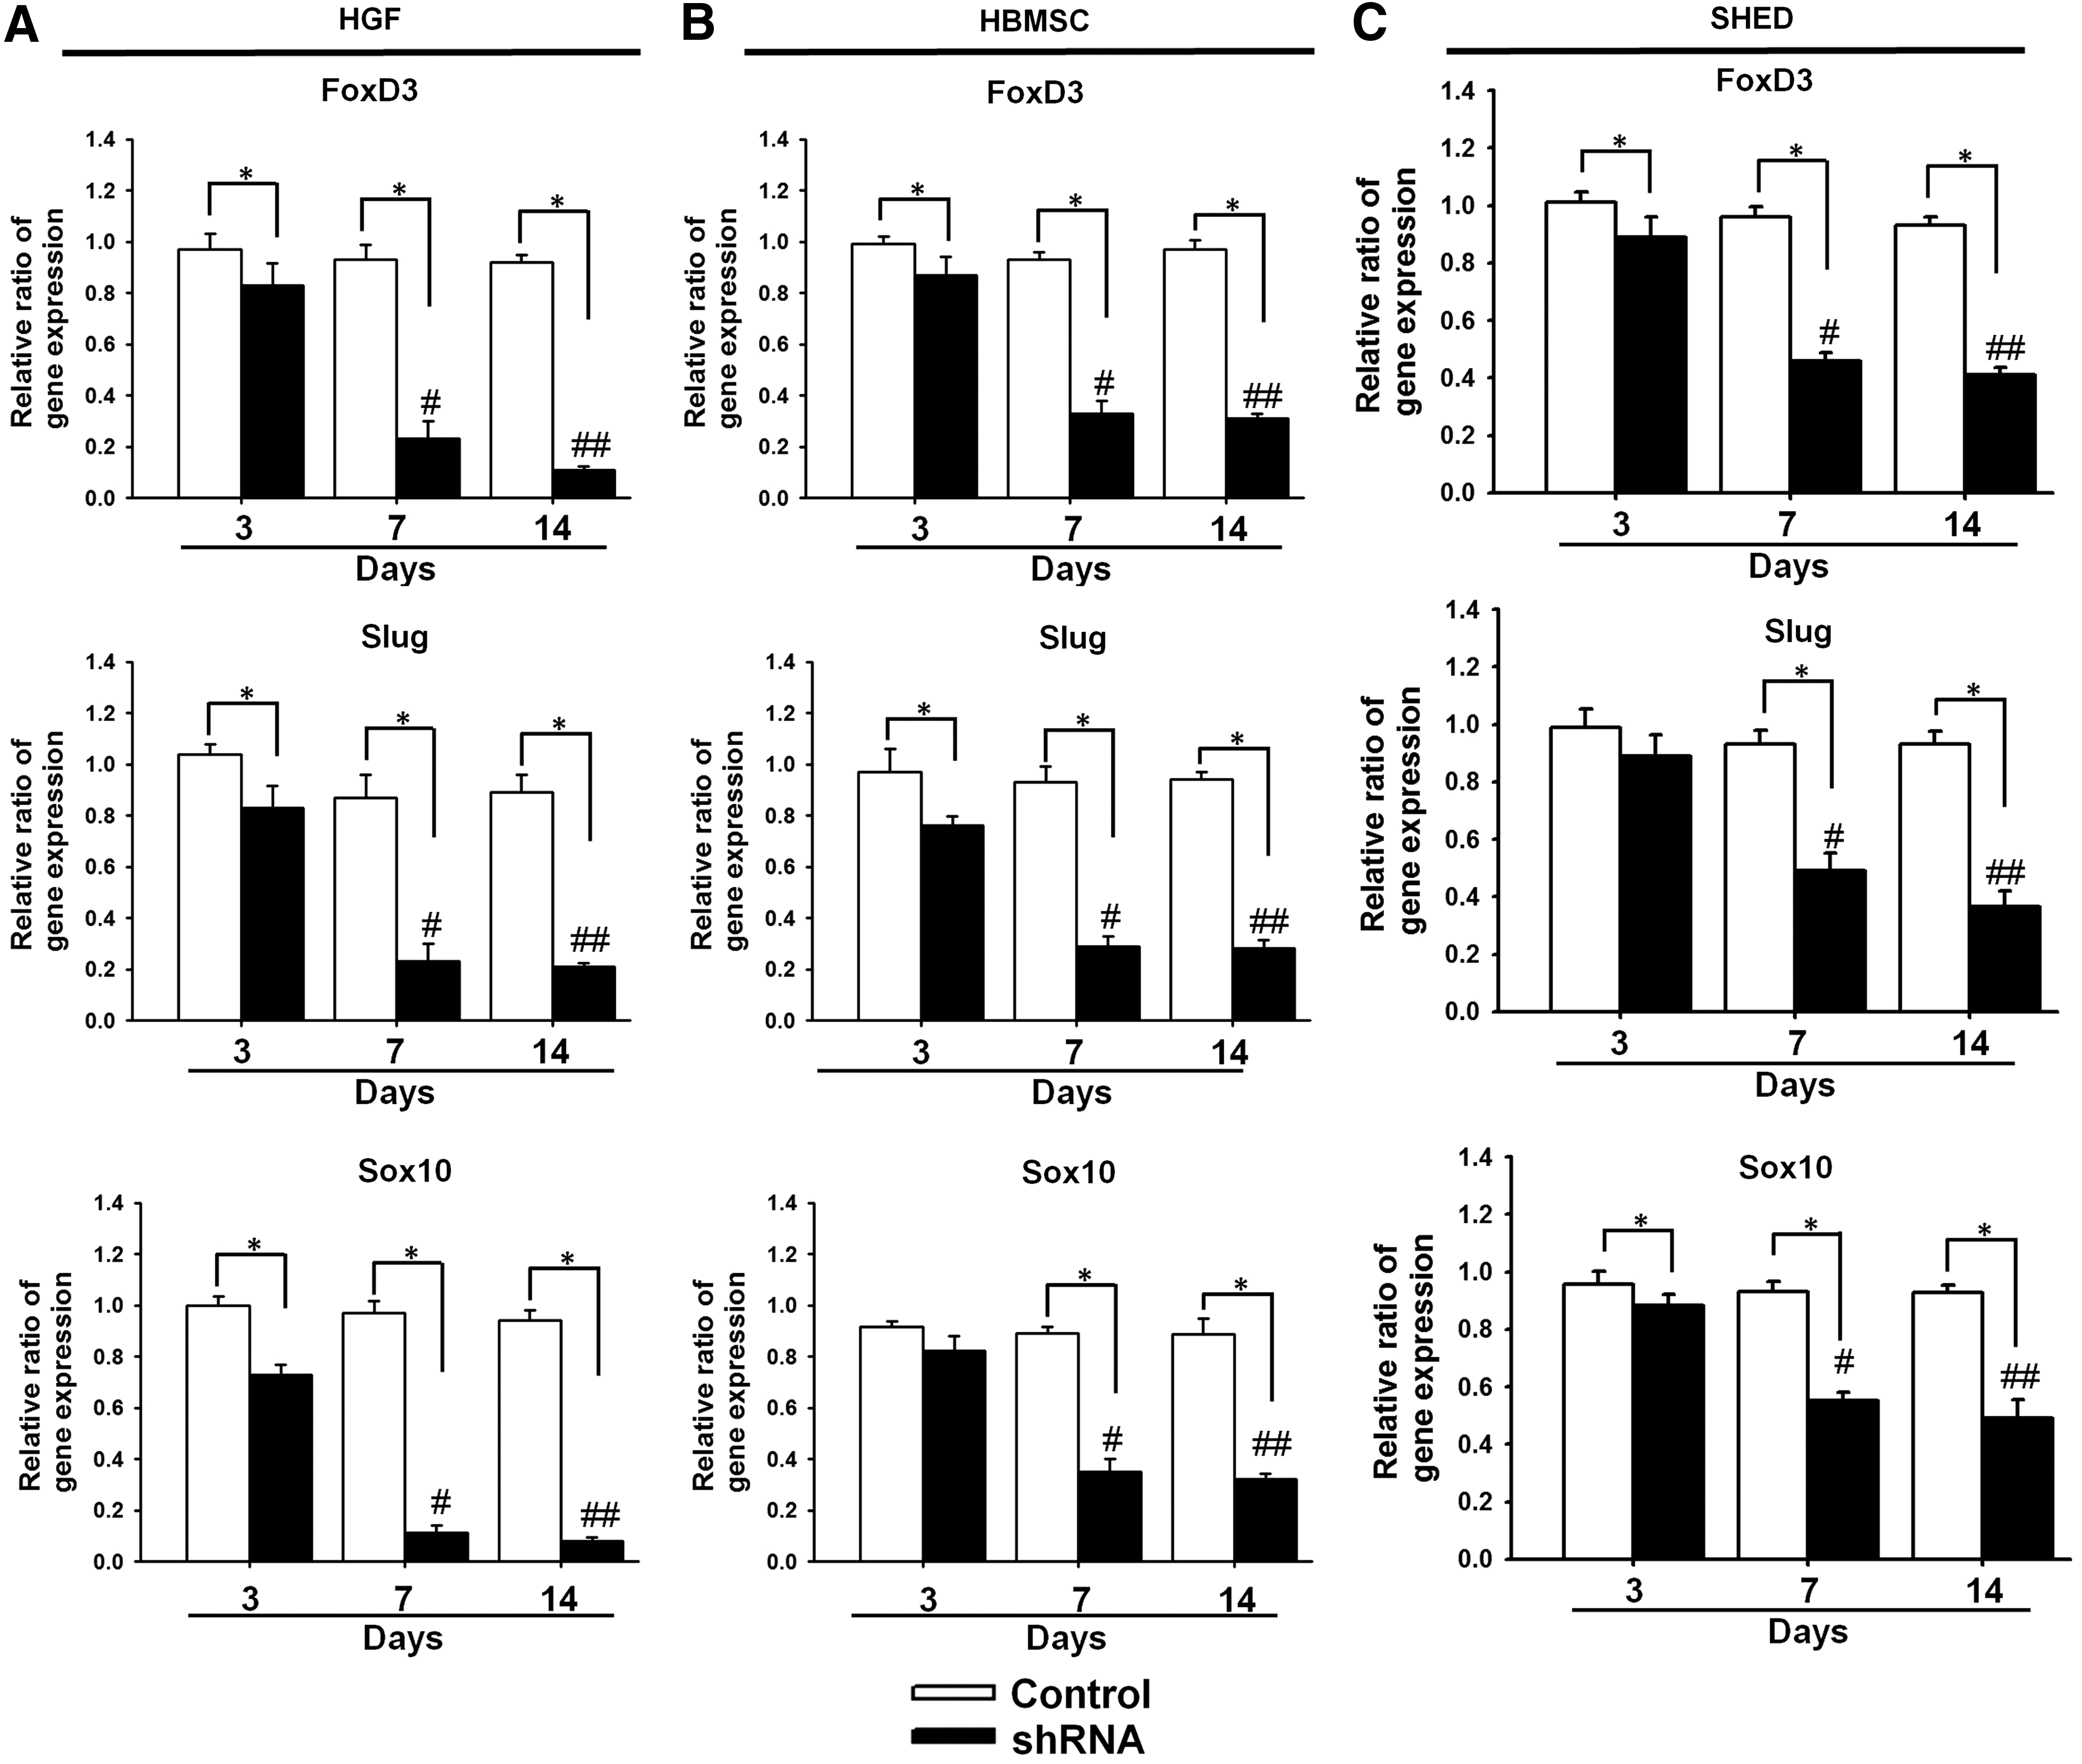
The neural crest gene expression for control cells and shRNA-transfected cells.
The effect of gene silencing on the multilineage differentiation capacities of HGFs, HBMSCs, and SHED is shown in Figure 5. For HBMSCs, the influence of silencing neural crest marker genes on the differentiation capacities was not obvious, which also applied for SHED. On the other hand, knocking down FoxD3 in HGFs before induction significantly decreased the neurogenic associated gene (nestin) expression while knocking down Sox10 significantly decreased the chondrogenic marker gene (Sox9) expression. Of interest to note was the increased osteogenic marker gene (Runx2) expression after the silence of FoxD3.
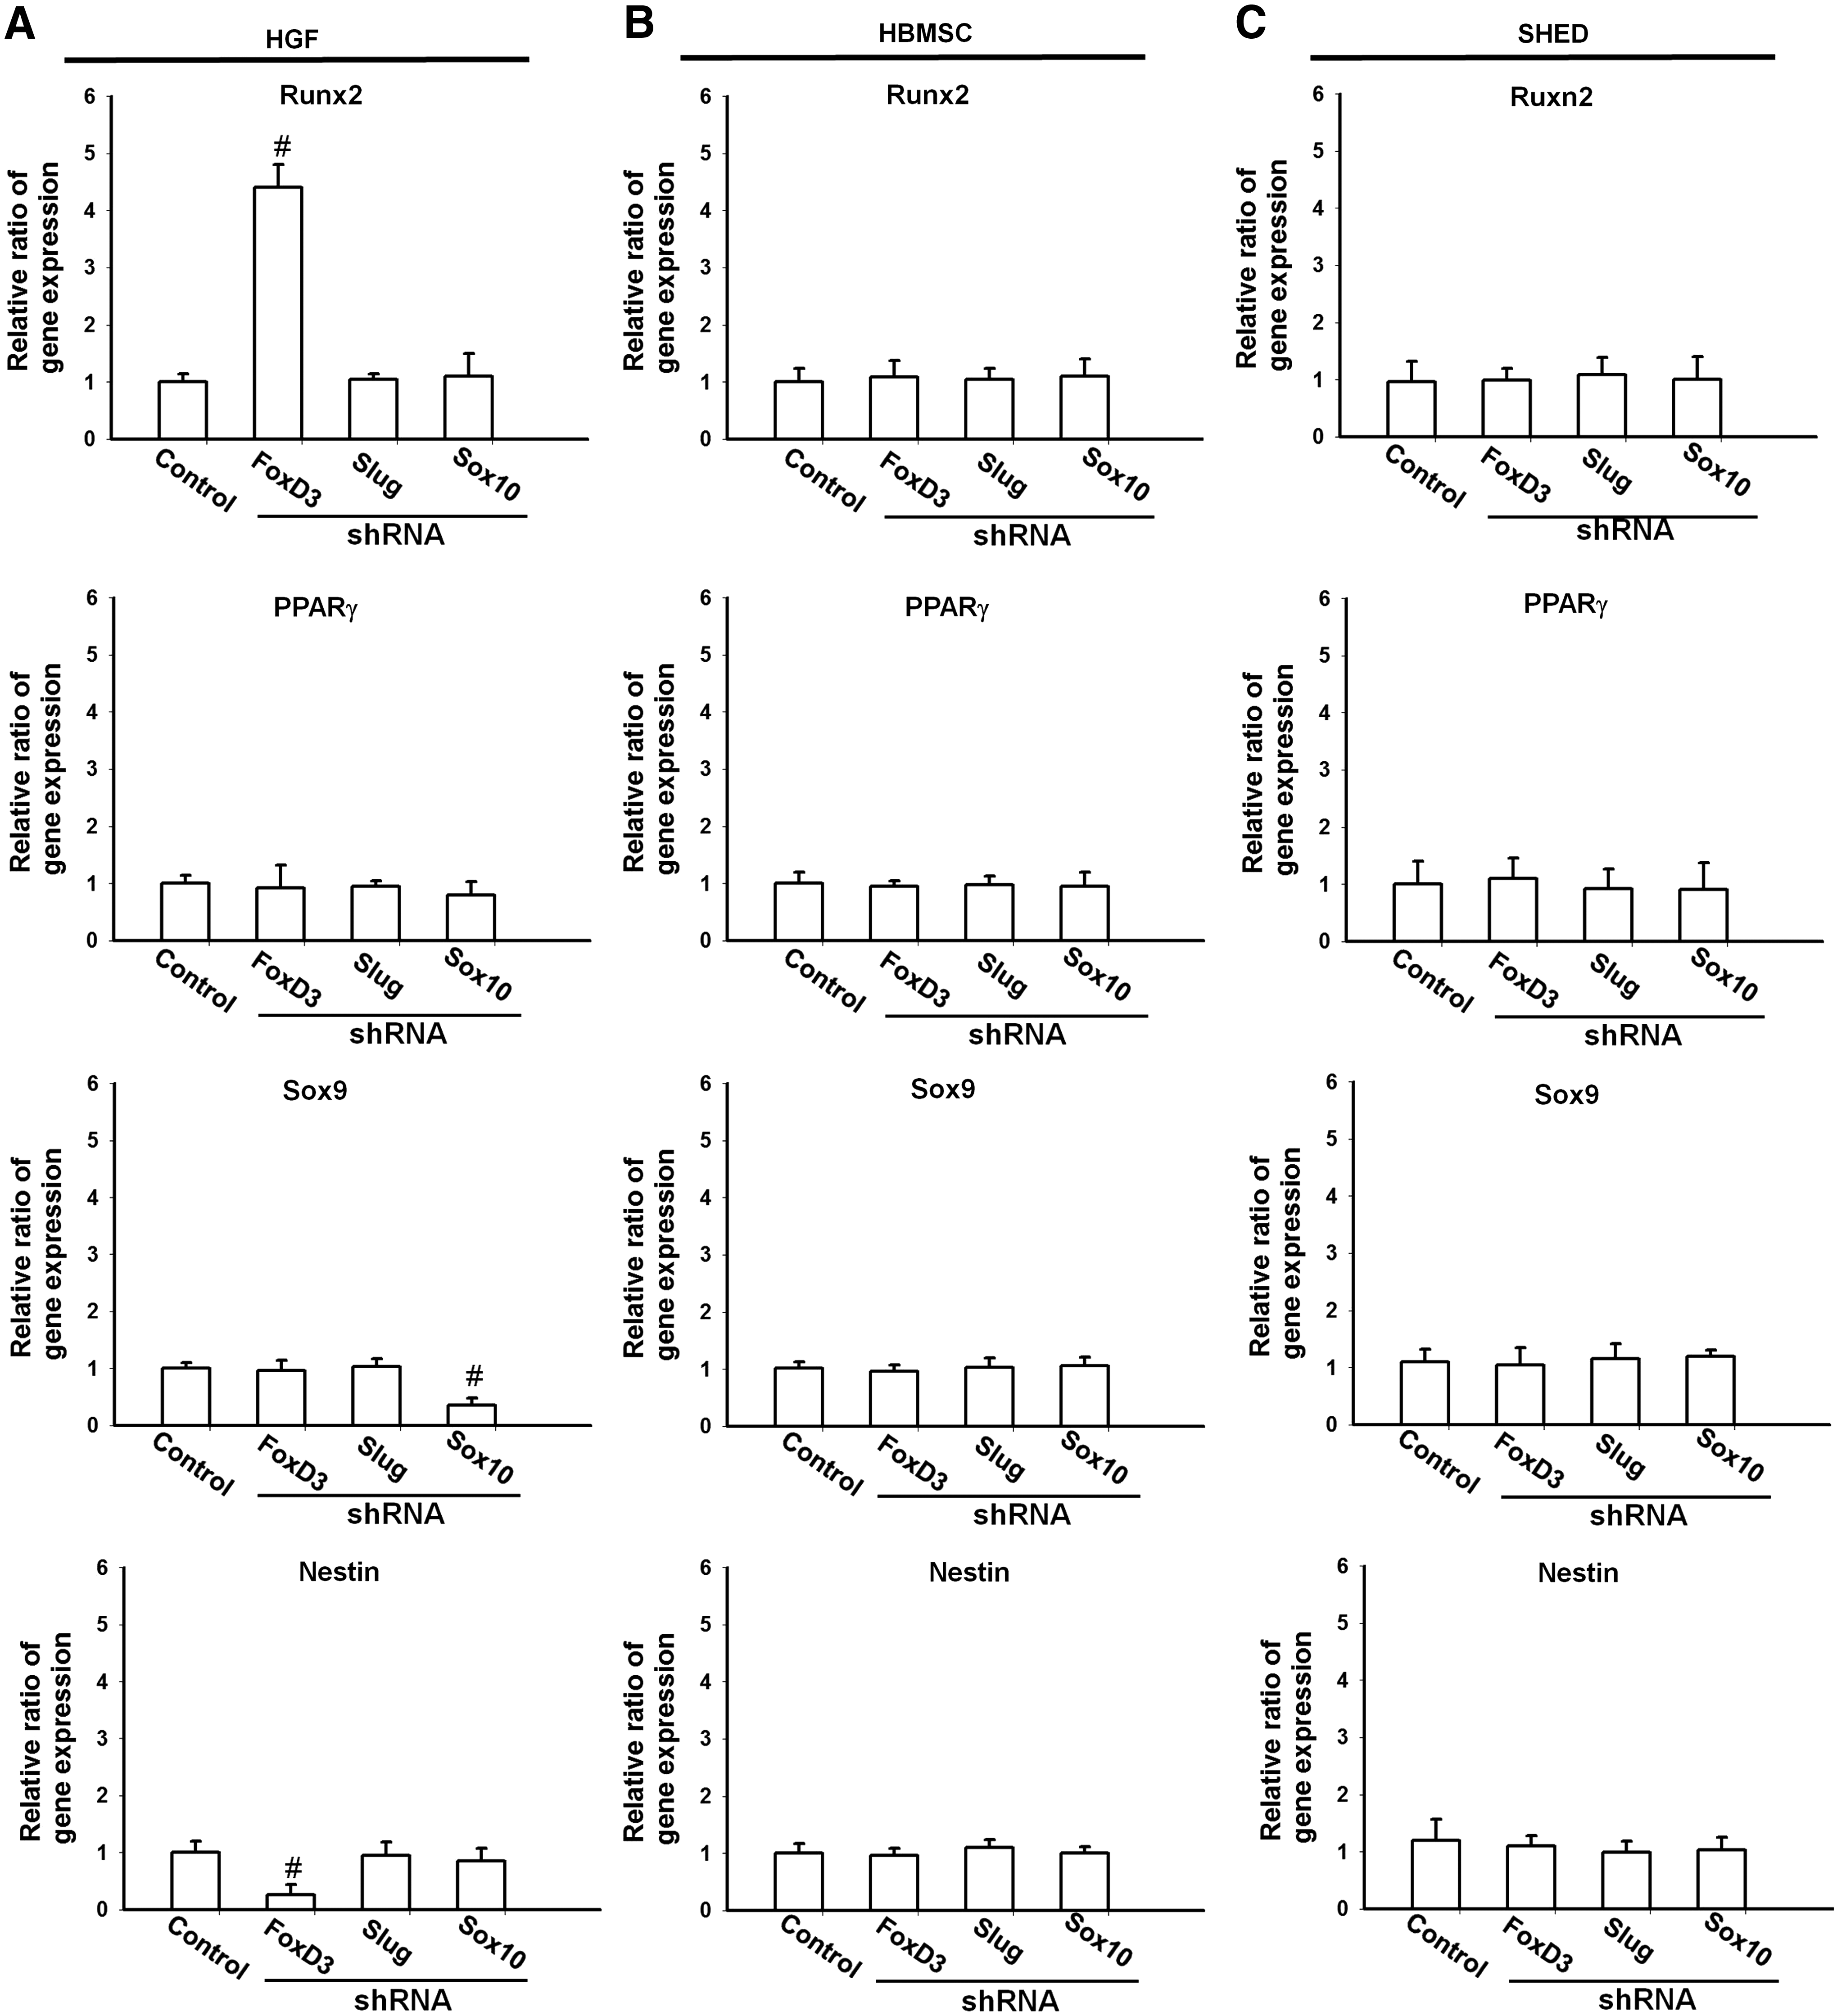
The expression of Runx2, Sox9, PPARγ2, and nestin genes after FoxD3-, Slug-, or Sox10-specific shRNA knockdown.
The morphology of gene-silenced cells on chitosan substrates is shown in Figure 6A. The real-time cell monitoring revealed that knocking down FoxD3 significantly blocked the mobility of HGFs on chitosan and inhibited the spheroid formation at 3 days, while knocking down Slug or Sox10 had no apparent effect on cell mobility or spheroid formation on chitosan. The expression of RhoA by western blots is shown in Figure 6B and C. RhoA for all cells was upregulated after reseeding on chitosan. However, the upregulation of RhoA on chitosan was not as remarkable for FoxD3-silenced cells versus the other groups. Comparing all groups on chitosan, it was evident that gene silence of FoxD3 decreased the expression of RhoA, while silence of Slug or Sox10 did not have an influence on RhoA expression. These results suggested the critical role of FoxD3 in HGF mobility and spheroid forming on chitosan.
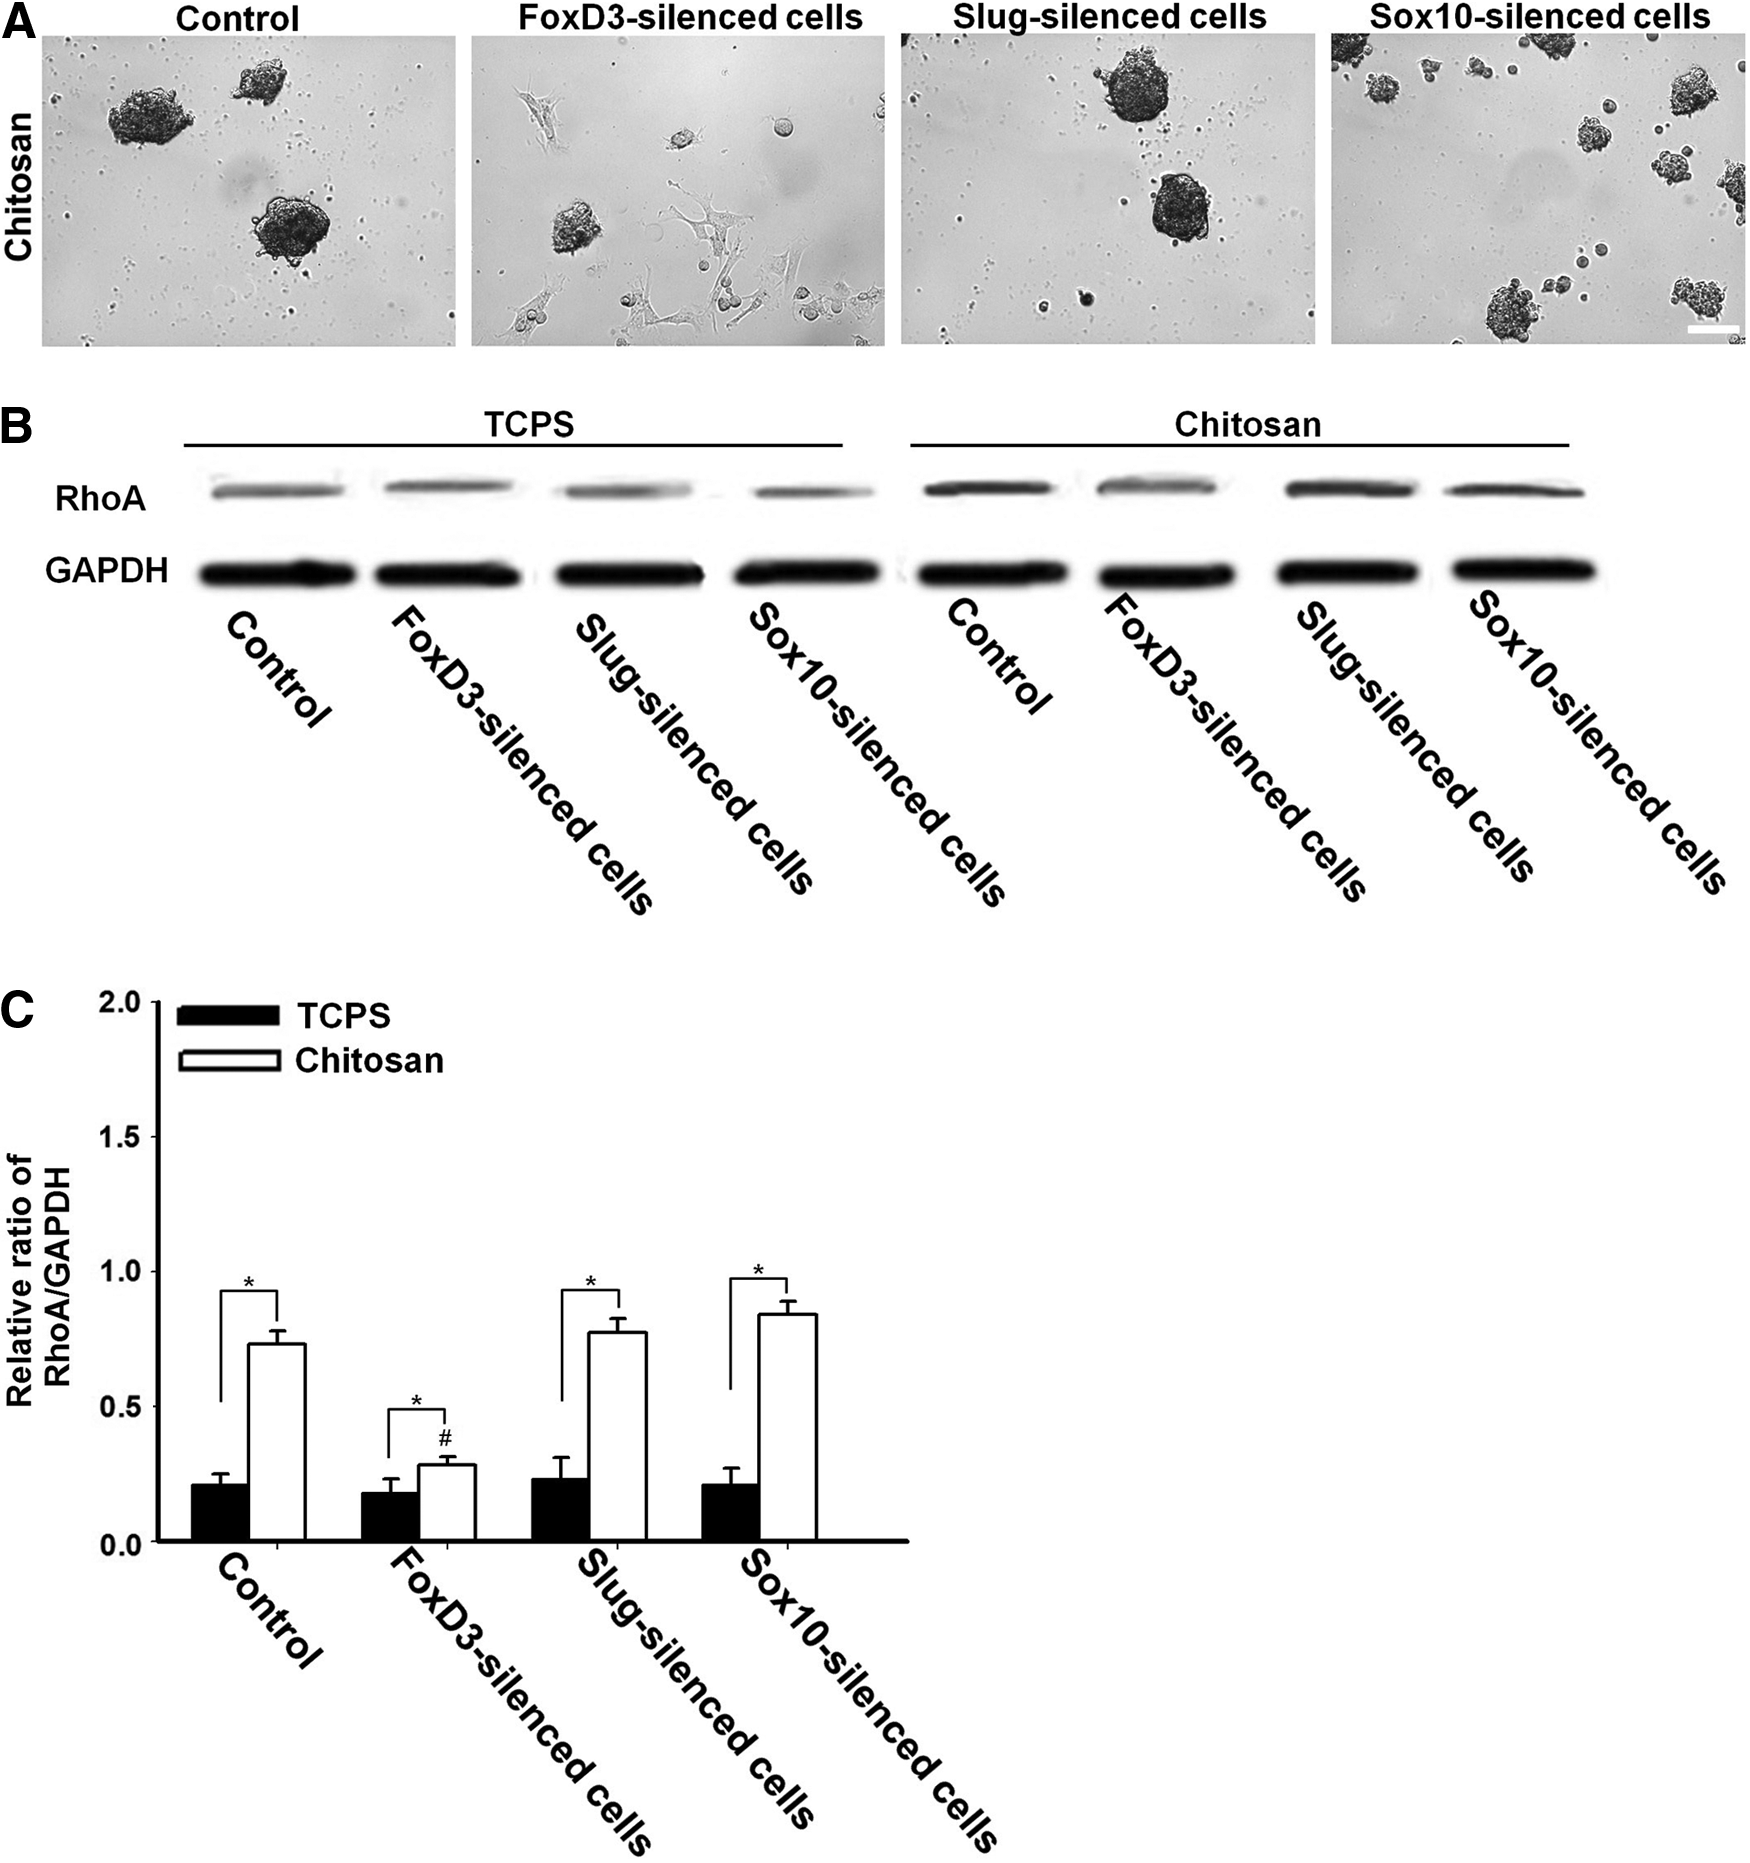
Cell morphology and RhoA expression of specific gene-silenced cells on chitosan substrates. Cells were transfected by specific shRNA (with PolyFect) on TCPS and they were then seeded on chitosan for 3 days.
New method of gene silence for HGFs grown on chitosan and selection of silenced cells by chitosan
Using chitosan as the substrate, shRNA could be delivered to HGFs more efficiently. The shRNA plasmid was exposed to cells either before spheroid formation (at 0 day) or after spheroid formation (at 3 days), as shown in Figure 7A. The transfection efficiency determined by the flow cytometry is shown in Figure 7B. If cells were exposed to shRNA before spheroid formation (“Before”), then seeding on chitosan (compared with TCPS) facilitated the expression of delivered shRNA (red fluorescence), either with or without PolyFect. In particular, the transfection of shRNA on chitosan in the absence of PolyFect was more efficient than that on TCPS with the aid of PolyFect. However, if shRNA was exposed to HGFs after spheroid formation (“After”), then the delivery was not as efficient, suggesting that the process of spheroid formation may be critical to gene transfer. By reseeding the spheroids (collected on chitosan) onto TCPS, we could visualize that the expression (as red fluorescence) was homogeneous in the “Before” group but it was only in the peripheral area of the spreading spheroids in the “After” group (Fig. 7C). More precisely, the transfection efficiency gradually declined as the time for adding shRNA into culture was delayed, from 0 (“Before”) to 72 h (“After”) postseeding (Supplementary Fig. S1; Supplementary Data are available online at
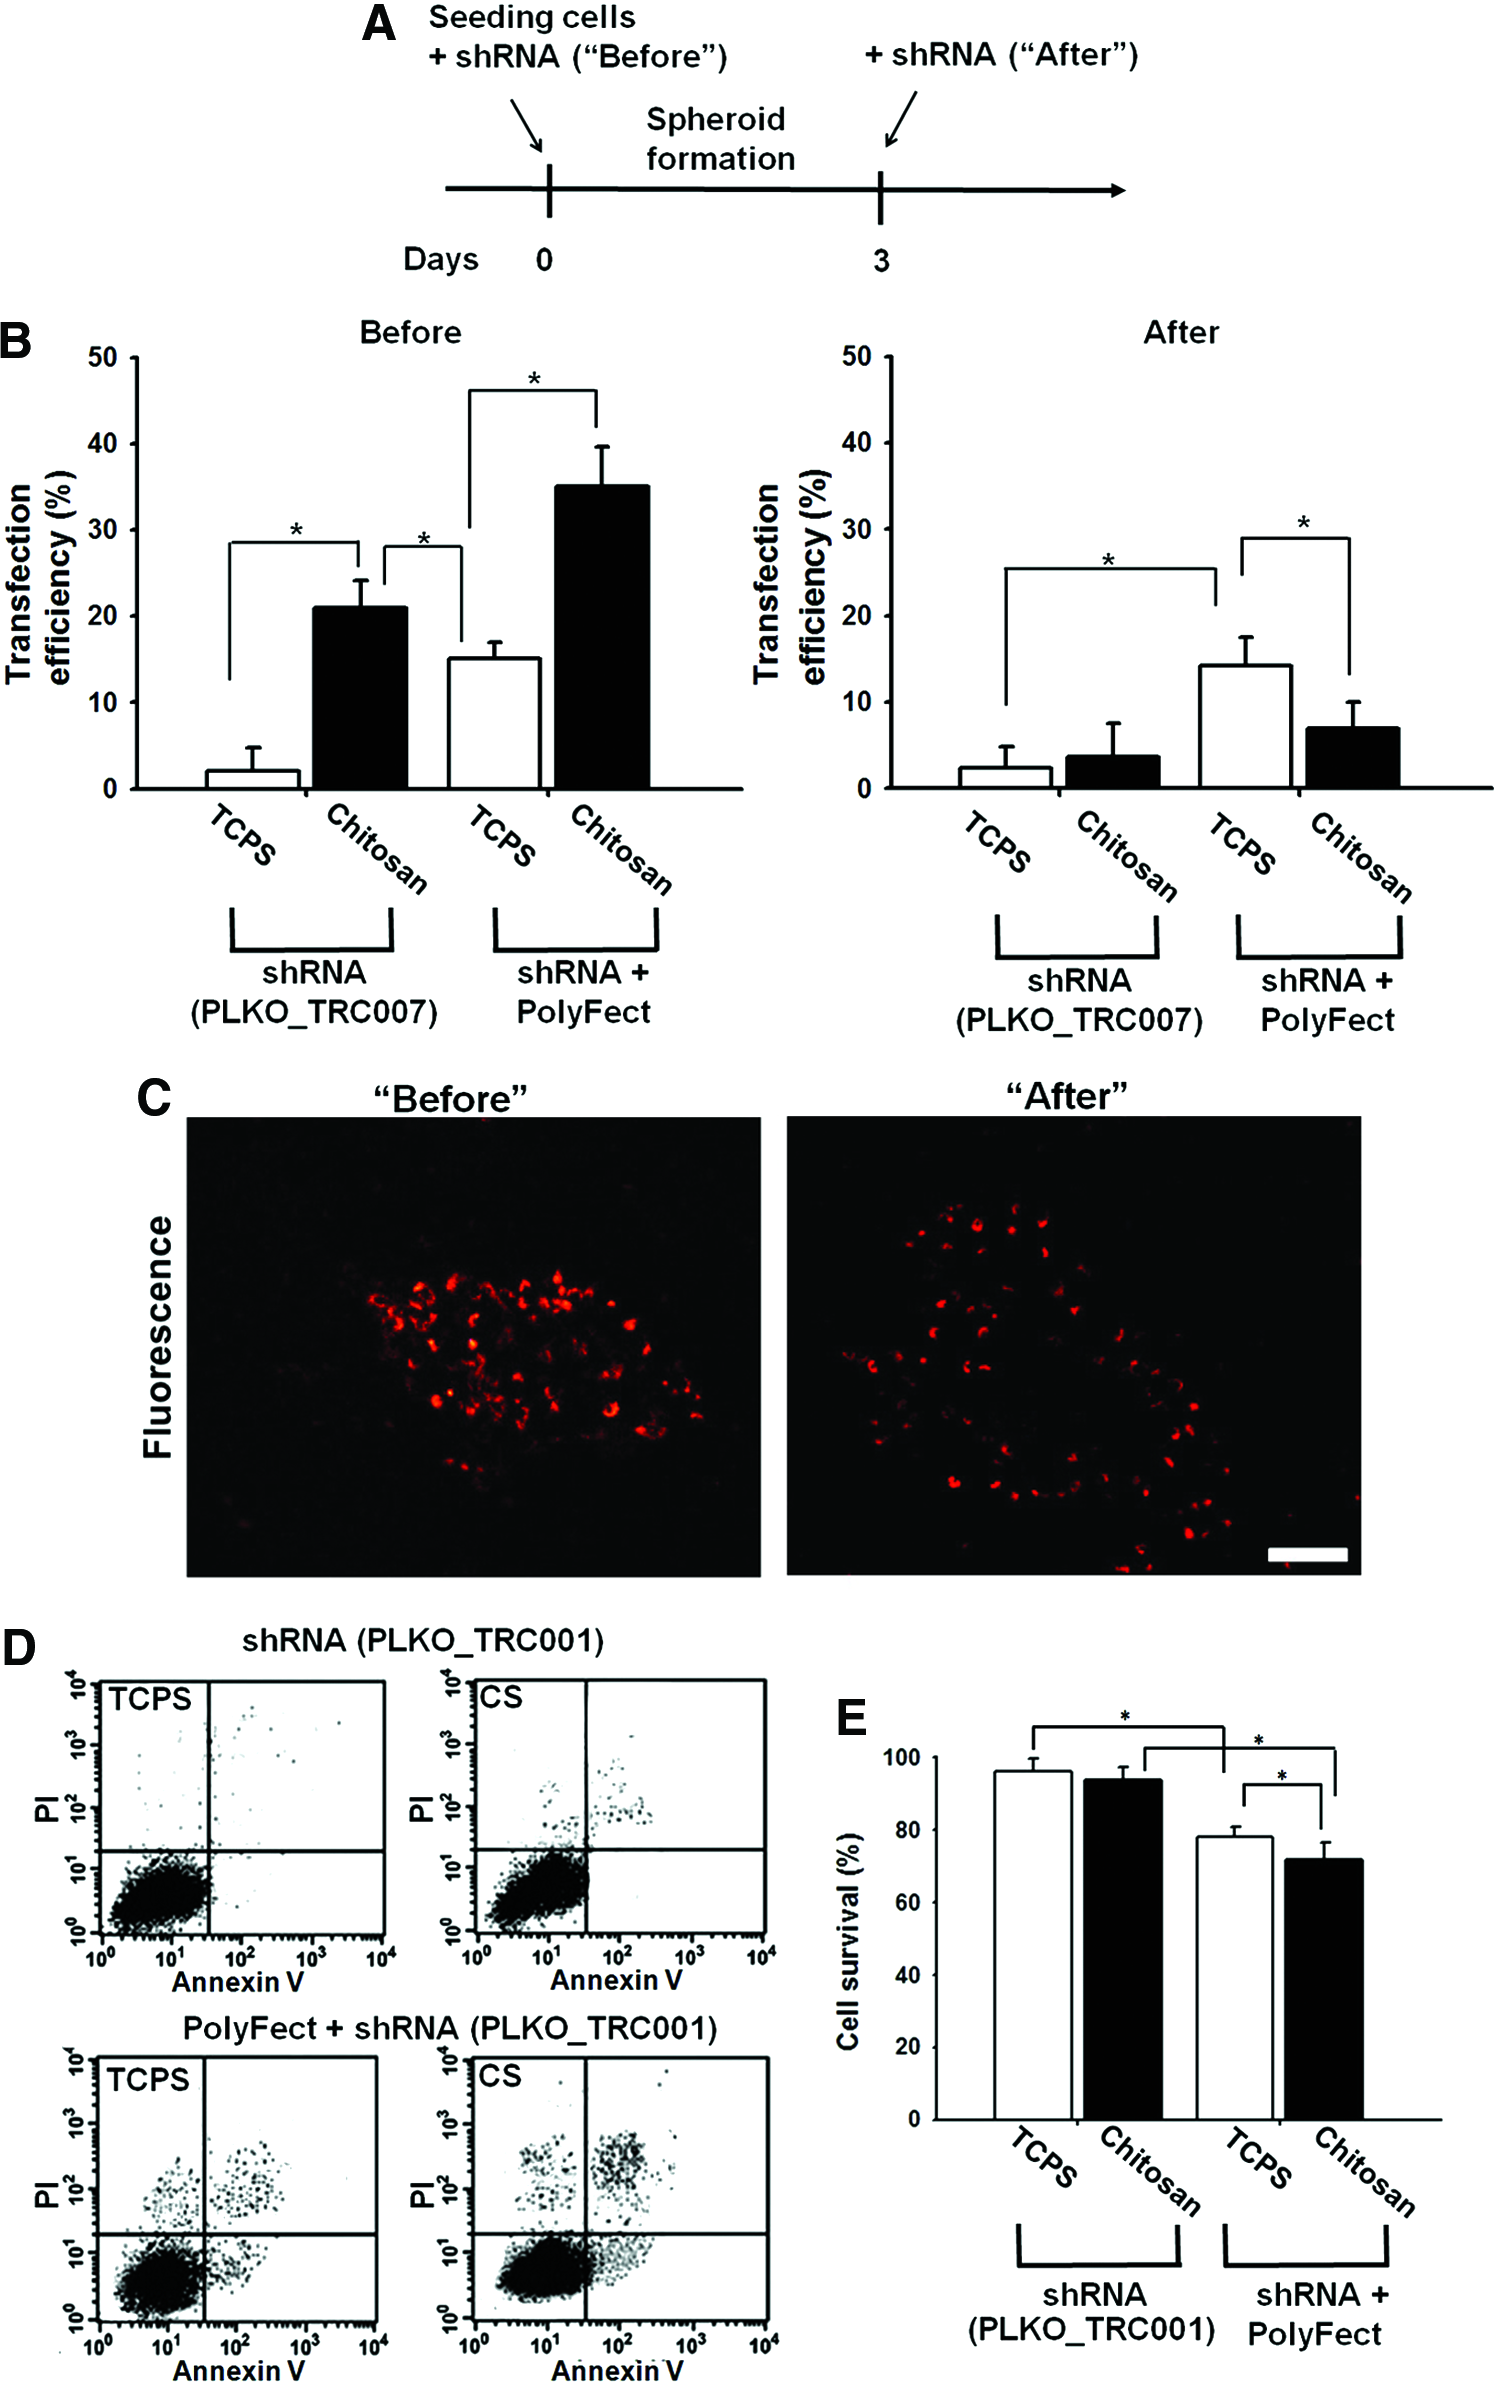
Growing HGFs on chitosan facilitated shRNA transfection.
Since the neural crest gene expression was highly associated with the spheroid-forming ability of HGFs, 18 we further hypothesized that the true FoxD3-silenced cells may soon lose their ability to form spheroids. This was supported by gene silence experiments (Fig. 6A). The Slug- or Sox 10-silenced cells kept the ability to form spheroids on chitosan while FoxD3-silenced cells did not form spheroids. Based on the hypothesis, we developed a novel protocol to select highly FoxD3-silenced cells by chitosan. As shown in Figure 8A, the transfection was performed on chitosan substrates, and, after transfection, HGFs that formed spheroids were separated from those that did not form spheroids. The HGF-S and the HGF-N were independently collected and analyzed (Fig. 8B). The extent of FoxD3 silence was analyzed by RT-PCR and the results are shown in Figure 8C. Regardless whether PolyFect was used, the highly FoxD3-silenced HGFs (“HGF-N”) could be successfully selected by culturing on chitosan. This was confirmed with the protein expression of FoxD3 by western blots (Fig. 8D).

The novel way to select highly silenced cells by chitosan.
Since PolyFect may cause damage to HGFs and affect their self-renewal or differentiation capacities, we further tested the effect of FoxD3 silence without using PolyFect on the neural differentiation of HGFs. As shown in Figure 9, the expression of nestin, GFAP, and β-tubulin (Fig. 9A) was inhibited to an extent proportional to that of gene silence, which indicated that the neurogenic differentiation of HGFs was significantly correlated with FoxD3 gene expression and could be inhibited by the silence of FoxD3 gene. This tendency was further confirmed with the immunostaining of neural-associated markers in Figure 9B.
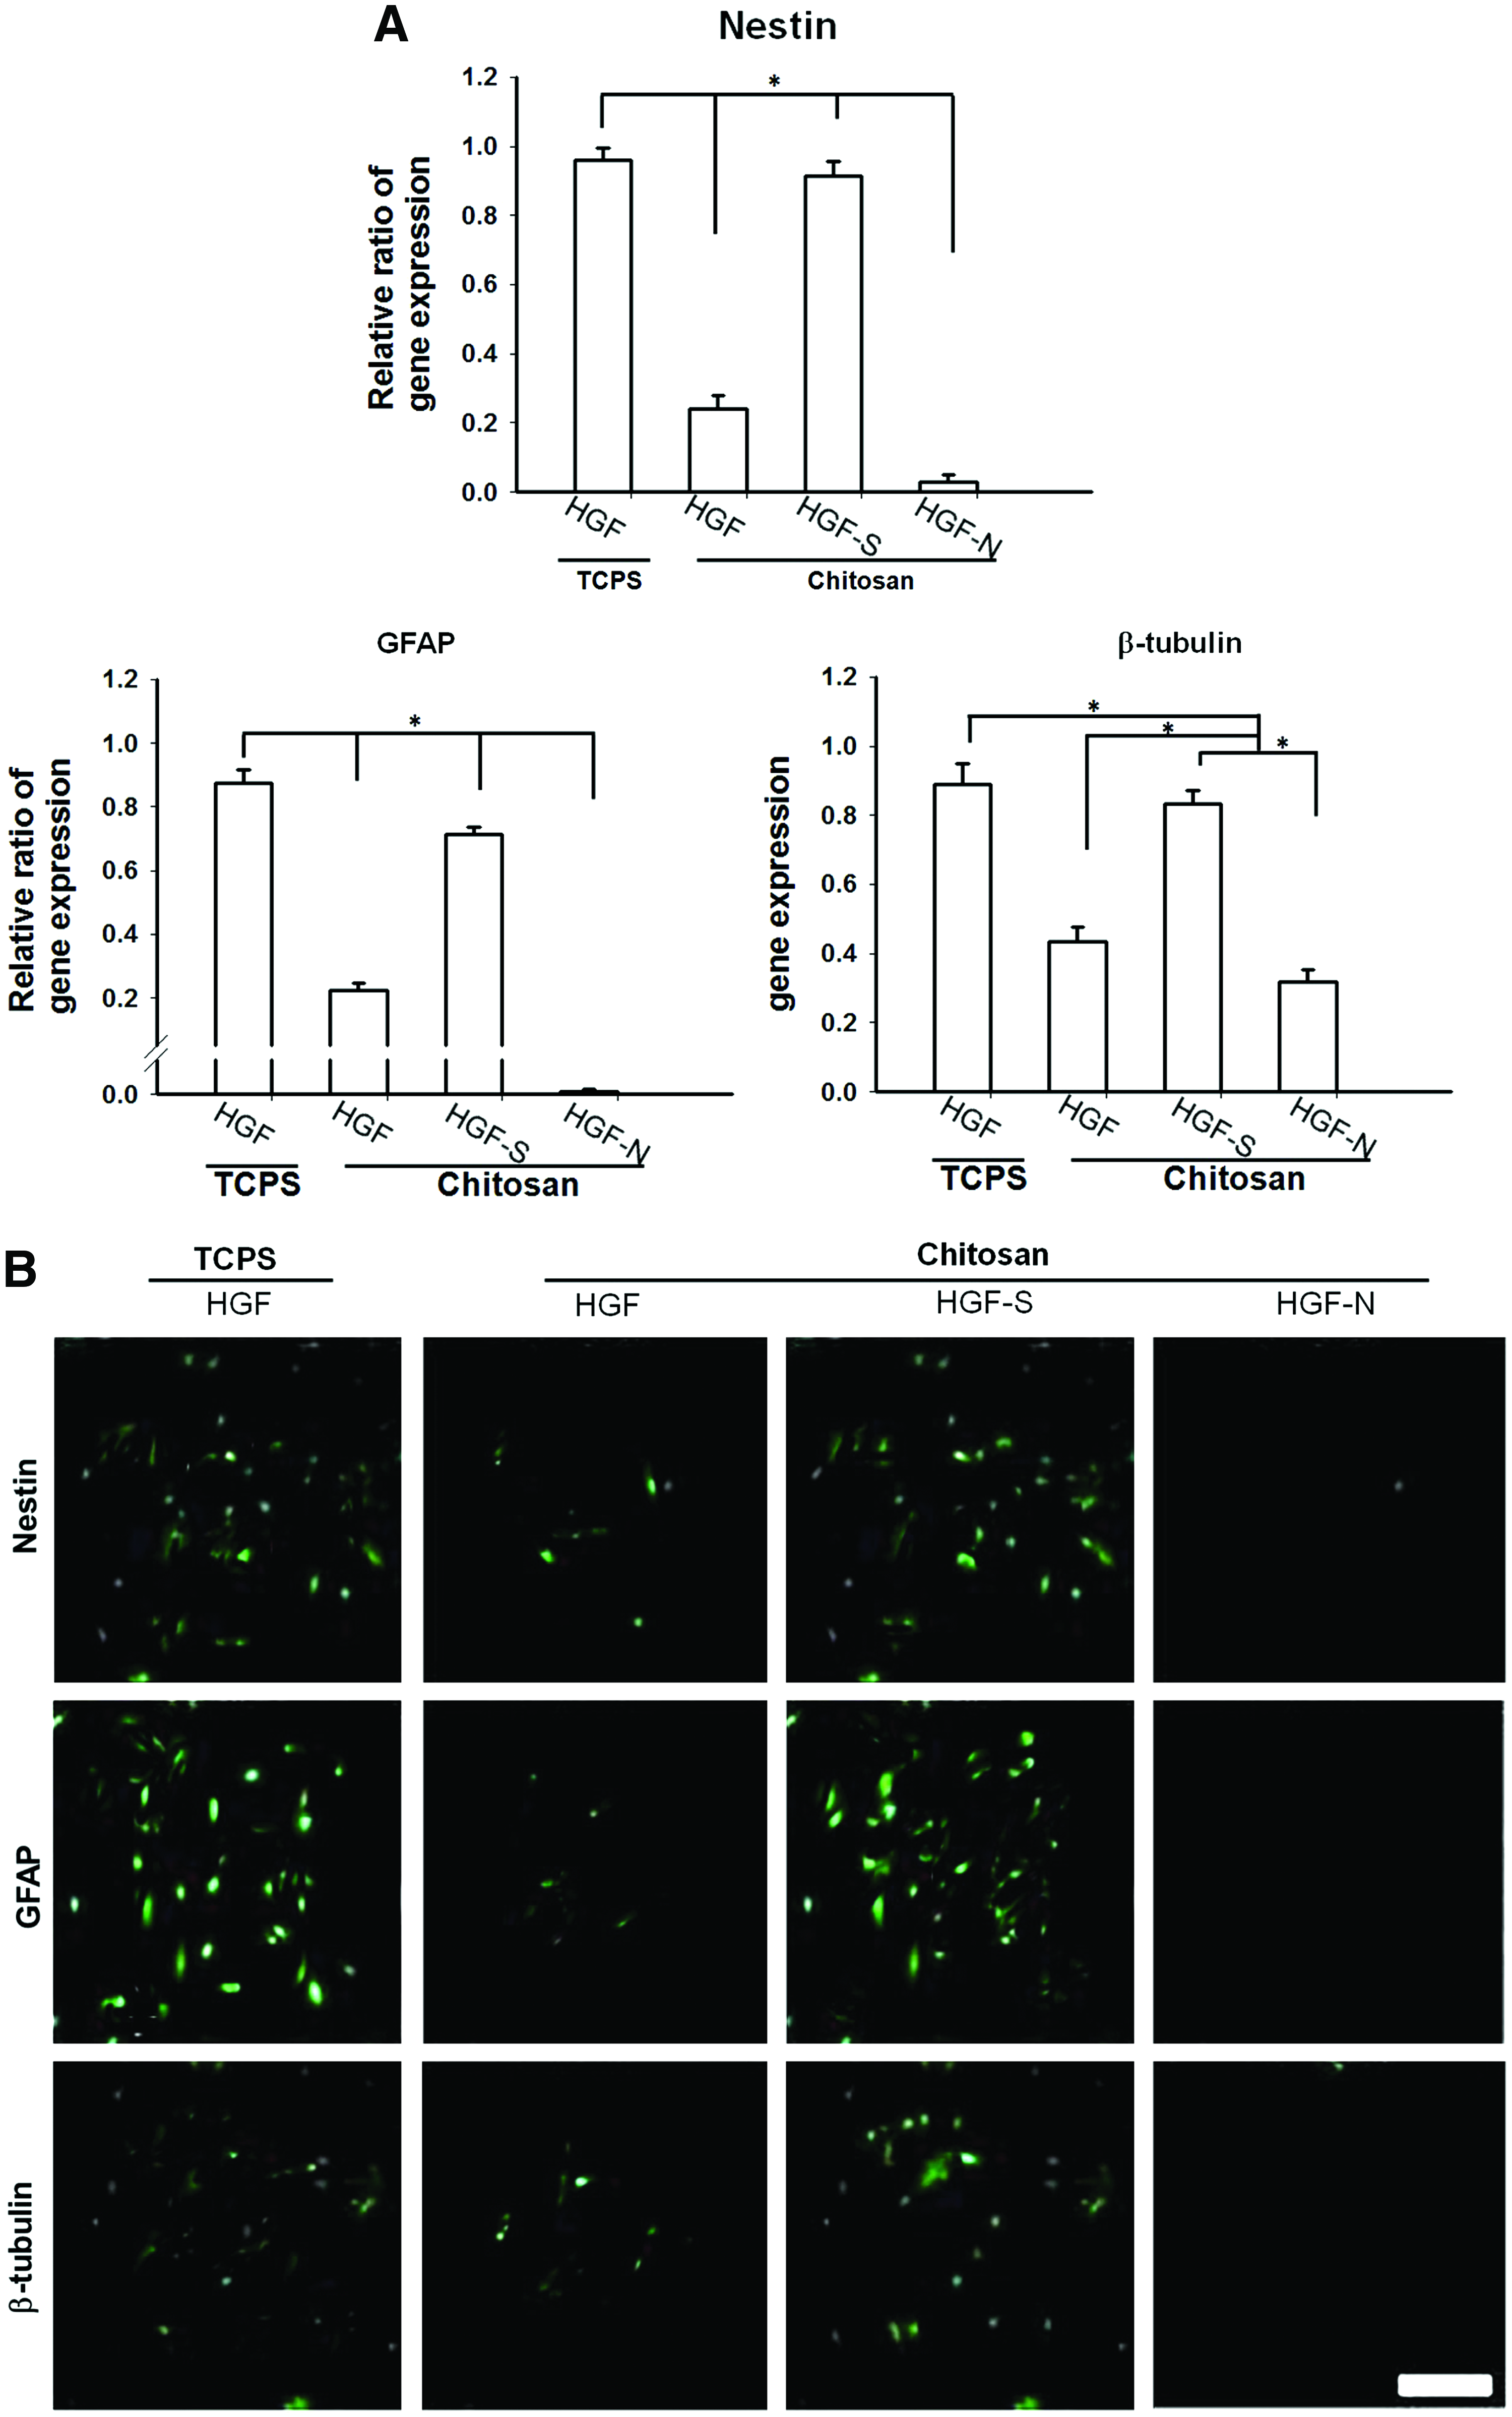
The effect of gene silence on neural differentiation of HGFs. Cells were exposed to shRNA without using PolyFect. Therefore, TCPS reflected poorly (ineffectively) silenced cells.
Discussion
Experimental data and clinical results in recent years have suggested that MSCs may have potential applications in transplantation or gene delivery because of the immunomodulatory properties of MSCs. 25 The identification of conveniently accessible MSCs such as HGFs has become an important issue in the cell-based therapy. We observed that the doubling time of HGFs (∼56.5 h) was faster than that of SHED (∼65.2 h) and comparable to that of HBMSCs (∼56.8 h). The latter was very close to that (∼58.5 h) reported in literature. 26
Neural crest cells are known to play a major role in dental development because of their potential to differentiate into odontoblasts, dental pulp, apical vasculature, and neurons.15,27,28 DPSCs and SHED were reported to be derived from neural crest cells. 29 HGFs had higher expression of neural crest marker genes (Sox10, FoxD3, and Slug) than SHED and HBMSCs, suggesting that HGFs may also have certain association with neural crest cells. In addition, HGFs demonstrated better chondrogenic potential than MSCs from bone marrow in this study. Moreover, knockdown of Sox10 affected the Sox9 expression during the chondrogenic differentiation of HGFs. The close relation between Sox9 and Sox10 in neural crest development 30 may partially account for the above observations.
Literature has indicated that FoxD3 is an important regulator for the self-renewal of neural crest stem cells.31,32 The role of FoxD3 in HGFs has not been reported so far. Using conventional RNAi techniques, we demonstrated that the neural crest marker genes of HGFs may be closely related to their differentiation potential. Unlike the regular HGFs that migrated quickly when seeded on chitosan, HGFs with FoxD3-specific knockdown were observed to be mostly static and seldom form spheroids on chitosan. At the same time, the expression of RhoA was inhibited by FoxD3 knockdown. Therefore, both the high mobility and spheroid-forming ability of HGFs on chitosan seemed to be associated with the FoxD3 expression. Dynamic FoxD3 modulation has been linked with the neural crest development and migration.33,34 In our study, blocking FoxD3 adversely affected the migration of HGFs, perhaps partially through the inhibition of RhoA activity. The significant Runx2 upregulation in HGFs after FoxD3 knockdown may also be connected with the reduced migratory ability upon the switch from MSC-like to osteoprogenitors.18,35 On the other hand, we noticed that the differentiation behavior of HBMSCs and SHED was less affected by the silence of the neural crest genes being studied. It may be ascribed to the lower expression of these genes in these cells, which subsequently play a lesser role in their self-renewal and multipotency.
Because FoxD3 plays a critical role in the properties of HGFs, we developed a new culture substrate-mediated RNAi method to demonstrate that we were able to silence FoxD3 without a transfection agent. It was interesting to note that HGFs on chitosan were only transfected effectively when they were exposed to shRNA before spheroid formation. If shRNA was added after spheroid formation, then only those cells on the outer layer of the spheroids were transfected. This may be attributed to the differential migratory ability of the cells within a spheroid (e.g., cells on the outer layer might migrate faster), or the limitation of mass transfer within a spheroid36,37 (e.g., shRNA might not penetrate the spheroid). This finding suggested that spheroid formation and cell location within the spheroid may be critical to gene delivery. Using biomaterials as culture substrates may modulate these factors and thereby the gene delivery or gene silence. Since the transfection efficiency of target-specific RNAi agents usually correlates with toxicity, 21 using biomaterial substrates to enhance the delivery of RNAi molecules (particularly the more potent and sustainable shRNA) may be an effective strategy to break such correlation and reduce the off-target effects.
Selection of highly silenced cells by culturing on chitosan may offer a novel method to conduct the gene knockdown study and simultaneously prevent the cells from the possible damage of transfection agents. Finally, since stem cells that lose their self-renewal may become flattened on chitosan substrates, this “spheroid formation and spreading” phenomenon may be potentially useful to select the truly affected cells from a cell population, for example, tumor spheroids, 37 for drug screening, or to further combine with RNAi therapeutics.
Conclusions
HGFs have greater neural and chondrogenic differentiation potentials compared with HBMSCs, which may be associated with the greater neural crest marker gene expression of FoxD3 and Sox10. In particular, FoxD3 gene expression is critical to the spheroid formation of HGFs on chitosan substrates. Based on these principles, shRNA constructs may be delivered to HGFs without using transfection agents that sacrifice the cell viability. Besides, FoxD3-silenced HGFs may be selected by cell spreading on chitosan. The novel and effective biomaterial-mediated gene silencing platform can be used to clarify the functions of important genes involved in cell–material interaction.
Footnotes
Acknowledgments
This work was supported by the Program for Stem Cell and Regenerative Medicine Frontier Research (NSC102-2321-B-002-033) sponsored by the National Science Council of Taiwan, R.O.C. The authors would like to thank Ms. Huei-Jhen Lin for assistance with experiments.
Disclosure Statement
No competing financial interests exist.
References
Supplementary Material
Please find the following supplemental material available below.
For Open Access articles published under a Creative Commons License, all supplemental material carries the same license as the article it is associated with.
For non-Open Access articles published, all supplemental material carries a non-exclusive license, and permission requests for re-use of supplemental material or any part of supplemental material shall be sent directly to the copyright owner as specified in the copyright notice associated with the article.