
Abstract
Components of the extracellular matrix (ECM) have recently been shown to influence stem cell specification. However, it has been challenging to assess the spatial and temporal dynamics of stem cell-ECM interactions because most methodologies utilized to date require sample destruction or fixation. We examined the efficacy of utilizing the endogenous optical signals of two important ECM proteins, elastin (Eln), through autofluorescence, and type I collagen (ColI), through second harmonic generation (SHG), during mouse embryonic stem cell differentiation. After finding favorable overlap between antibody labeling and the endogenous fluorescent signal of Eln, we used this endogenous signal to map temporal changes in Eln and ColI during murine embryoid body differentiation and found that Eln increases until day 9 and then decreases slightly by day 12, while Col1 steadily increases over the 12-day period. Furthermore, we combined endogenous fluorescence imaging and SHG with antibody labeling of cardiomyocytes to examine the spatial relationship between Eln and ColI accumulation and cardiomyocyte differentiation. Eln was ubiquitously present, with enrichment in regions with cardiomyocyte differentiation, while there was an inverse correlation between ColI and cardiomyocyte differentiation. This work provides an important first step for utilizing endogenous optical signals, which can be visualized in living cells, to understand the relationship between the ECM and cardiomyocyte development and sets the stage for future studies of stem cell-ECM interactions and dynamics relevant to stem cells as well as other cell and tissue types.
Introduction
C
The ECM is the relatively stable structural material located under epithelial cells and surrounding cells of connective tissue. The composition of this structural material plays a significant role in embryonic development, regulating the proliferation and differentiation of stem cells into different lineages.6–13 The ECM provides adhesion substrates, imparts structural support, stores and sequesters soluble factors, and transduces mechanical signals. Indeed, isolated cardiac cells require the ECM to maintain or acquire function, 14 and changes in cardiac ECM composition and distribution during development are crucial for tissue specification.15,16 Most ECM components are so important that rodents lacking genes encoding these proteins do not survive the early postnatal period. 17
To harness the potential of the ECM to aid in appropriate cardiac differentiation and to serve as a delivery vehicle for therapeutic applications, it is imperative that we better understand the relationship between the ECM and cardiomyocytes during differentiation. The ideal manner to determine the extent to which ECM proteins influence stem cell differentiation would be to observe this interaction in live, differentiating stem cells. To pursue that line of inquiry, we sought to identify and apply minimally invasive, high-resolution imaging techniques that could be used for examining the ECM in both fixed and live cells. Additionally, studies of differentiation in the developing mouse heart 18 demonstrate that the ECM is an important component of the cardiovascular progenitor niche, suggesting that the microenvironment influences the differentiation of cardiac cells. Because of this impact of the microenvironment and because complex three-dimensional (3D) cellular aggregates, such as embryoid bodies (EBs), are likely to consist of multiple heterogeneous microenvironments, it is imperative to examine the role of the ECM in differentiation at the level of the cell rather than at the level of the aggregate.
This study was designed, in particular, to determine whether endogenous optical signals of the ECM, namely endogenous fluorescence of elastin (Eln) and second harmonic generation (SHG) characteristic of fibrillar collagens (i.e., type I collagen [ColI]), could effectively discern changes in the ECM during cardiac specification. Endogenous fluorescence of Eln can be detected with fluorescence microscopy when excited with the appropriate wavelength. SHG signals arise from nonlinear optical interactions with a noncentrosymmetric structure (such as that of collagen) to produce structural definition at submicron resolution.19–21 As SHG is a nonfluorescence phenomenon, it is straightforward to separate SHG from autofluorescence such as that from Eln.
We selected Eln and ColI as both play an important role in heart development22–25 and we have a noninvasive way to detect these ECMs. Of note, ColI is the most abundant ECM protein in the heart 26 and is important not only for structural stability but also for regulating intracellular calcium handling and electrophysiological characteristics. 27 Eln is important for tissue flexibility, and high expression in embryonic ventricles relative to neonatal ventricles suggests that Eln (or lack thereof) may signal the maturation of functional sarcomeres,28–30 indicating its importance in mammalian heart development.
Based on the important roles ColI and Eln play in cardiac development, we postulate that these proteins may also be crucial for cardiomyocyte differentiation outside the body. Therefore, we tracked Eln and ColI deposition in developing mouse EBs and noted differential temporal expression between the two ECM proteins up to 12 days following EB formation. In addition, we looked at expression of Eln and ColI relative to expression of cardiac troponin T (cTnT), a marker for mature cardiomyocytes. Interestingly, there was a slight enrichment of Eln in regions with cardiomyocytes, while in contrast, ColI was noticeably reduced in regions with differentiating cardiomyocytes. This study provides an important first step in establishing endogenous optical signals as a valid and informative methodology for examining the role of the ECM during stem cell differentiation, including cardiomyocyte differentiation.
Materials and Methods
Stem cell culture
D3 mouse embryonic stem cells were cultured in Dulbecco's modified Eagle's medium+Glutamax (Invitrogen) with 10% fetal bovine serum (Invitrogen), 1% nonessential amino acids (Invitrogen), 0.0007% β-mercaptoethanol (MP Biomedicals, LLC), and 1% penicillin/streptomycin (Lonza).31–33 Leukemia inhibitory factor (Millipore) and bone morphogenetic protein 4 (R&D Systems) were added to media at 2000 U/mL and 10 ng/mL, respectively, to maintain pluripotency. 34 Mouse EBs were prepared using the hanging drop method. 35 After 3 days of formation, EBs were transferred to 35-mm gridded imaging dishes (ibidi). EBs were fixed after 3, 6, 9, and 12 days of development. Each plate was rinsed twice with 1× phosphate-buffered saline (PBS; Sigma) and fixed with 4% paraformaldehyde (EMS) in PBS for 15 min. Plates were rinsed twice with 1× vPBS.
Immunolabeling
Mouse EBs were rinsed twice with 2 mL of 1× PBS. Nonspecific antibody binding was blocked using 1 mL of BGST blocking solution (5% bovine serum albumin [Fisher Scientific], 1% glycine [Sigma], 2% normal goat serum [Chemicon/Millipore], and 0.1% Triton-X 100 [Fisher Scientific] in 1× PBS) at room temperature for 30 min. Rabbit anti-Eln (Millipore; 1:100), rabbit anti-ColI (Abcam; 1:100), or mouse anti-cTnT (Thermo Fisher Scientific; 1:200) were diluted in BGST and cells were incubated at 4°C overnight. After rinsing thrice for 5 min in 1× PBS, with agitation, cells were incubated with 1:500 dilution of secondary antibody, goat anti-rabbit fluorescein isothiocyanate (FITC; Invitrogen) for anti-Eln and anti-ColI, and goat anti-mouse Alexa Fluor 546 (Invitrogen) for cTnT in BGST for 1 h at room temperature, then rinsed with 1× PBS. Cells were mounted in 4′,6-diamidino-2-phenylindole (DAPI)/DABCO (2.5% DABCO [Sigma], 50% glycerol [Sigma], and 50 μg/mL DAPI [Sigma] in 1× PBS) for imaging.
Imaging
Multiphoton laser scanning microscopy imaging
Mouse EBs were imaged using multiphoton laser scanning microscopy (MPLSM) 32 with the following excitation and emission settings: for endogenous Eln—780 nm excitation, 520/35 nm emission; for ColI SHG (backward)—890 nm excitation, 445/20 nm emission; for Eln and ColI Ab—890 nm excitation, 520/35 nm emission. Images were collected with a Plan Apo VC, 20× air, 0.75 NA, 1.0- mm WD objective (Nikon), at a resolution of 512×512. An in-house acquisition software package (WiscScan) was used to collect bright-field and intensity images.
Epifluorescence imaging
Some day 12 mouse EBs labeled with anti-cTnT antibodies were imaged using an IX71 inverted bright-field fluorescence microscope (Olympus) using the TRITC band setting of the Sedat quad filter set (Chroma Technology Corporation), a 20× UPlanFluor objective (NA=0.5), and Slidebook software (Intelligent Imaging Innovations), with an exposure time of 1500 ms.
Image analyses
To compare the similarities between endogenous and antibody signals, we performed quantitative overlay analysis, using Fiji 36 and Matlab (MathWorks, Inc.), on day 12 mouse EB images collected on the MPLSM. In Fiji, we applied a Z-projection to the z-stack and normalized the dynamic range of the projected image using an autowindow-level algorithm. In Matlab, we manually set a threshold for each image to extract the signal, then aligned the antibody image with the corresponding endogenous image by applying vertical and horizontal shifts to correct the shifts produced by the MPLSM. Finally, we overlaid the endogenous image over the antibody image and calculated the percentage of the endogenous signals that matched antibody signals. In the overlaid image, three colors were set to differentiate the matched endogenous signal, unmatched endogenous signal, and unmatched antibody signal. This procedure was applied to at least 10 fields of view.
To assess the change in Eln and ColI endogenous signals in developing mouse EBs, intensity per pixel values of the MPLSM/SHG images were quantified using Fiji software for each developmental time point, days 3, 6, 9, and 12 (n≥10 fields of view corresponding to approximately the same number of EBs). The pattern of expression of Eln and ColI endogenous signals was also qualitatively analyzed as follows: for ColI, images were separated into categories dependent on whether fibers were present or absent and the percentage of each category was determined at each time point; for Eln, images were separated in categories dependent on whether the fluorescence intensity was of the punctate or fibril form and the percentage of each category was determined at each time point.
To determine the relationship between endogenous Eln and ColI signals and cTnT antibody fluorescence, images for these respective signals in the same locations were compared. Fields of view were categorized based on intensity of either cTnT or SHG. cTnT images were collected on either an epifluorescence microscope or MPSLM. Eln and ColI endogenous images were collected exclusively using the MPLSM. Image analyses were conducted using FIJI. 36
First, regional intensity was determined for Eln and SHG inside and outside of regions with cTnT intensity. This was accomplished by creating a Z-projection of 16 slices (1 μm apart) of respective z-stacks, then converting the cTnT image to binary format, and creating regions of interest (ROI) to delineate inside and outside. These ROIs were applied to the cTnT, Eln, and SHG projections, and mean intensity inside and outside was recorded. The ratio of inside to outside for each field of view was calculated (n=14 fields of view, two independent experiments). Second, spatial correlation of cTnT to SHG was determined. This was accomplished by creating a Z-projection of 16 slices (1 μm apart) of respective z-stacks, then converting both the cTnT and SHG images to binary format. The percent area with signal was calculated for each, and the area occupied by SHG was plotted against the area occupied by the cTnT label (n=29 fields of view, two independent experiments).
Statistical analyses
Graph construction and statistical analyses were performed using Prism (GraphPad) software. Fluorescence intensity over time was compared using a one-way analysis of variance, followed by Tukey's multiple comparisons test, with significance at p<0.05. Comparison of regional intensity difference in ECM with its relationship to cTnT labeling was performed using a t-test between Eln and SHG, with significance at p<0.05. To compare the cTnT and SHG field of view area relationship, the R2 and Pearson r values were determined.
Results
Validation of endogenous Eln fluorescence through colocalization with anti-Eln immunofluorescence
SHG has been used extensively in a variety of tissues to address biological questions regarding ColI.37–41
In contrast, Eln endogenous fluorescence has not been routinely used and the small number of existing studies utilize a variety of excitation and emission imaging parameters, with limited validation of specificity for Eln protein.37,42–47 Because of the discrepancies among optimal imaging parameters for Eln, it was essential to compare the endogenous Eln signal with immunofluorescence using an anti-Eln antibody with MPLSM. We found that 780 nm excitation and 520 nm emission are the optimal imaging parameters for Eln in terms of maximum intensity associated with structures reminiscent of elastic fibers (Supplementary Fig. S1; Supplementary Data are available online at
To assess the relationship between endogenous optical signals and immunofluorescence for Eln, we examined mouse EBs 12 days after formation. This stage of EB development was chosen because the EBs are relatively mature at this point, containing a variety of cell types, and are therefore more likely to contain substantial amounts of ECM proteins than their less mature counterparts. EBs were plated on gridded imaging dishes, thus permitting the same location to be imaged for endogenous fluorescence, then stained with immunofluorescence, and imaged again. Images of the endogenous fluorescence were collected with MPLSM using 780 nm excitation with a 520/35-nm bandpass emission filter (Chroma) for Eln (endogenous, Fig. 1A). The EBs were then immunolabeled for Eln, and identical locations to those imaged for endogenous signals were reimaged using 890 nm (excitation) with a 520/35-nm bandpass emission filter (Chroma) to detect the FITC secondary antibody (Eln Ab, Fig. 1A).

Colocalization of endogenous fluorescence with elastin antibody in day 12 embryonic bodies (EBs).
To determine the specificity and sensitivity of the endogenous fluorescence of Eln, the percentage of the endogenous signal corresponding to immunofluorescence signal was determined as follows: specificity, [(pixels containing endogenous fluorescence and immunofluorescence)/(total pixels containing endogenous fluorescence); 82%±10%]; sensitivity, [(pixels containing both endogenous fluorescence and immunofluorescence)/(total pixels containing immunofluorescence; 42%±15%]. Of note, one image showed substantially lower specificity and sensitivity than the others. We therefore conducted Grubbs' test for outliers and found it to be an outlier in terms of specificity (measured value, 21%), but not in terms of sensitivity (measured value, 16%). Therefore, we have not included the data point in the graph or reported average percentage for specificity measures, but have included it in the graph and reported average percentage for sensitivity measures. Overall, the average specificity is quite high, but the sensitivity is decidedly lower than immunofluorescence (Fig. 1B).
Endogenous signals reveal changes in Eln and ColI during mouse EB development
To assess changes in Eln and ColI during EB development, the intensity of Eln endogenous fluorescence and ColI SHG were examined. Endogenous images were collected on the MPLSM as described above from day 3, 6, 9, and 12 EBs. Qualitative analysis of changes in Eln and ColI during EB development revealed that in 100% of the images obtained from early stages of development (days 3 and 6), endogenous Eln expression is of a punctate pattern. Short fibril-like structures can be detected in 50% of images at day 9 and in 57% of the images at day 12 (Fig. 2A). For ColI, early stages of development (days 3 and 6) exhibit no visible collagen fibers, while later stages of development (days 9 and 12) express a significant increase in fibers, with 50% of images at day 9 and 81% of images at day 12 exhibiting collagen fibers (Fig. 2A). Quantitative analysis was conducted by measuring the intensity of each of the endogenous signals at each developmental stage. We found that Eln intensity increased from day 3 to 9 and then decreased slightly from day 9 to 12 (Fig. 2B). In contrast, SHG intensity increased significantly from day 3 to 12 (Fig. 2C).
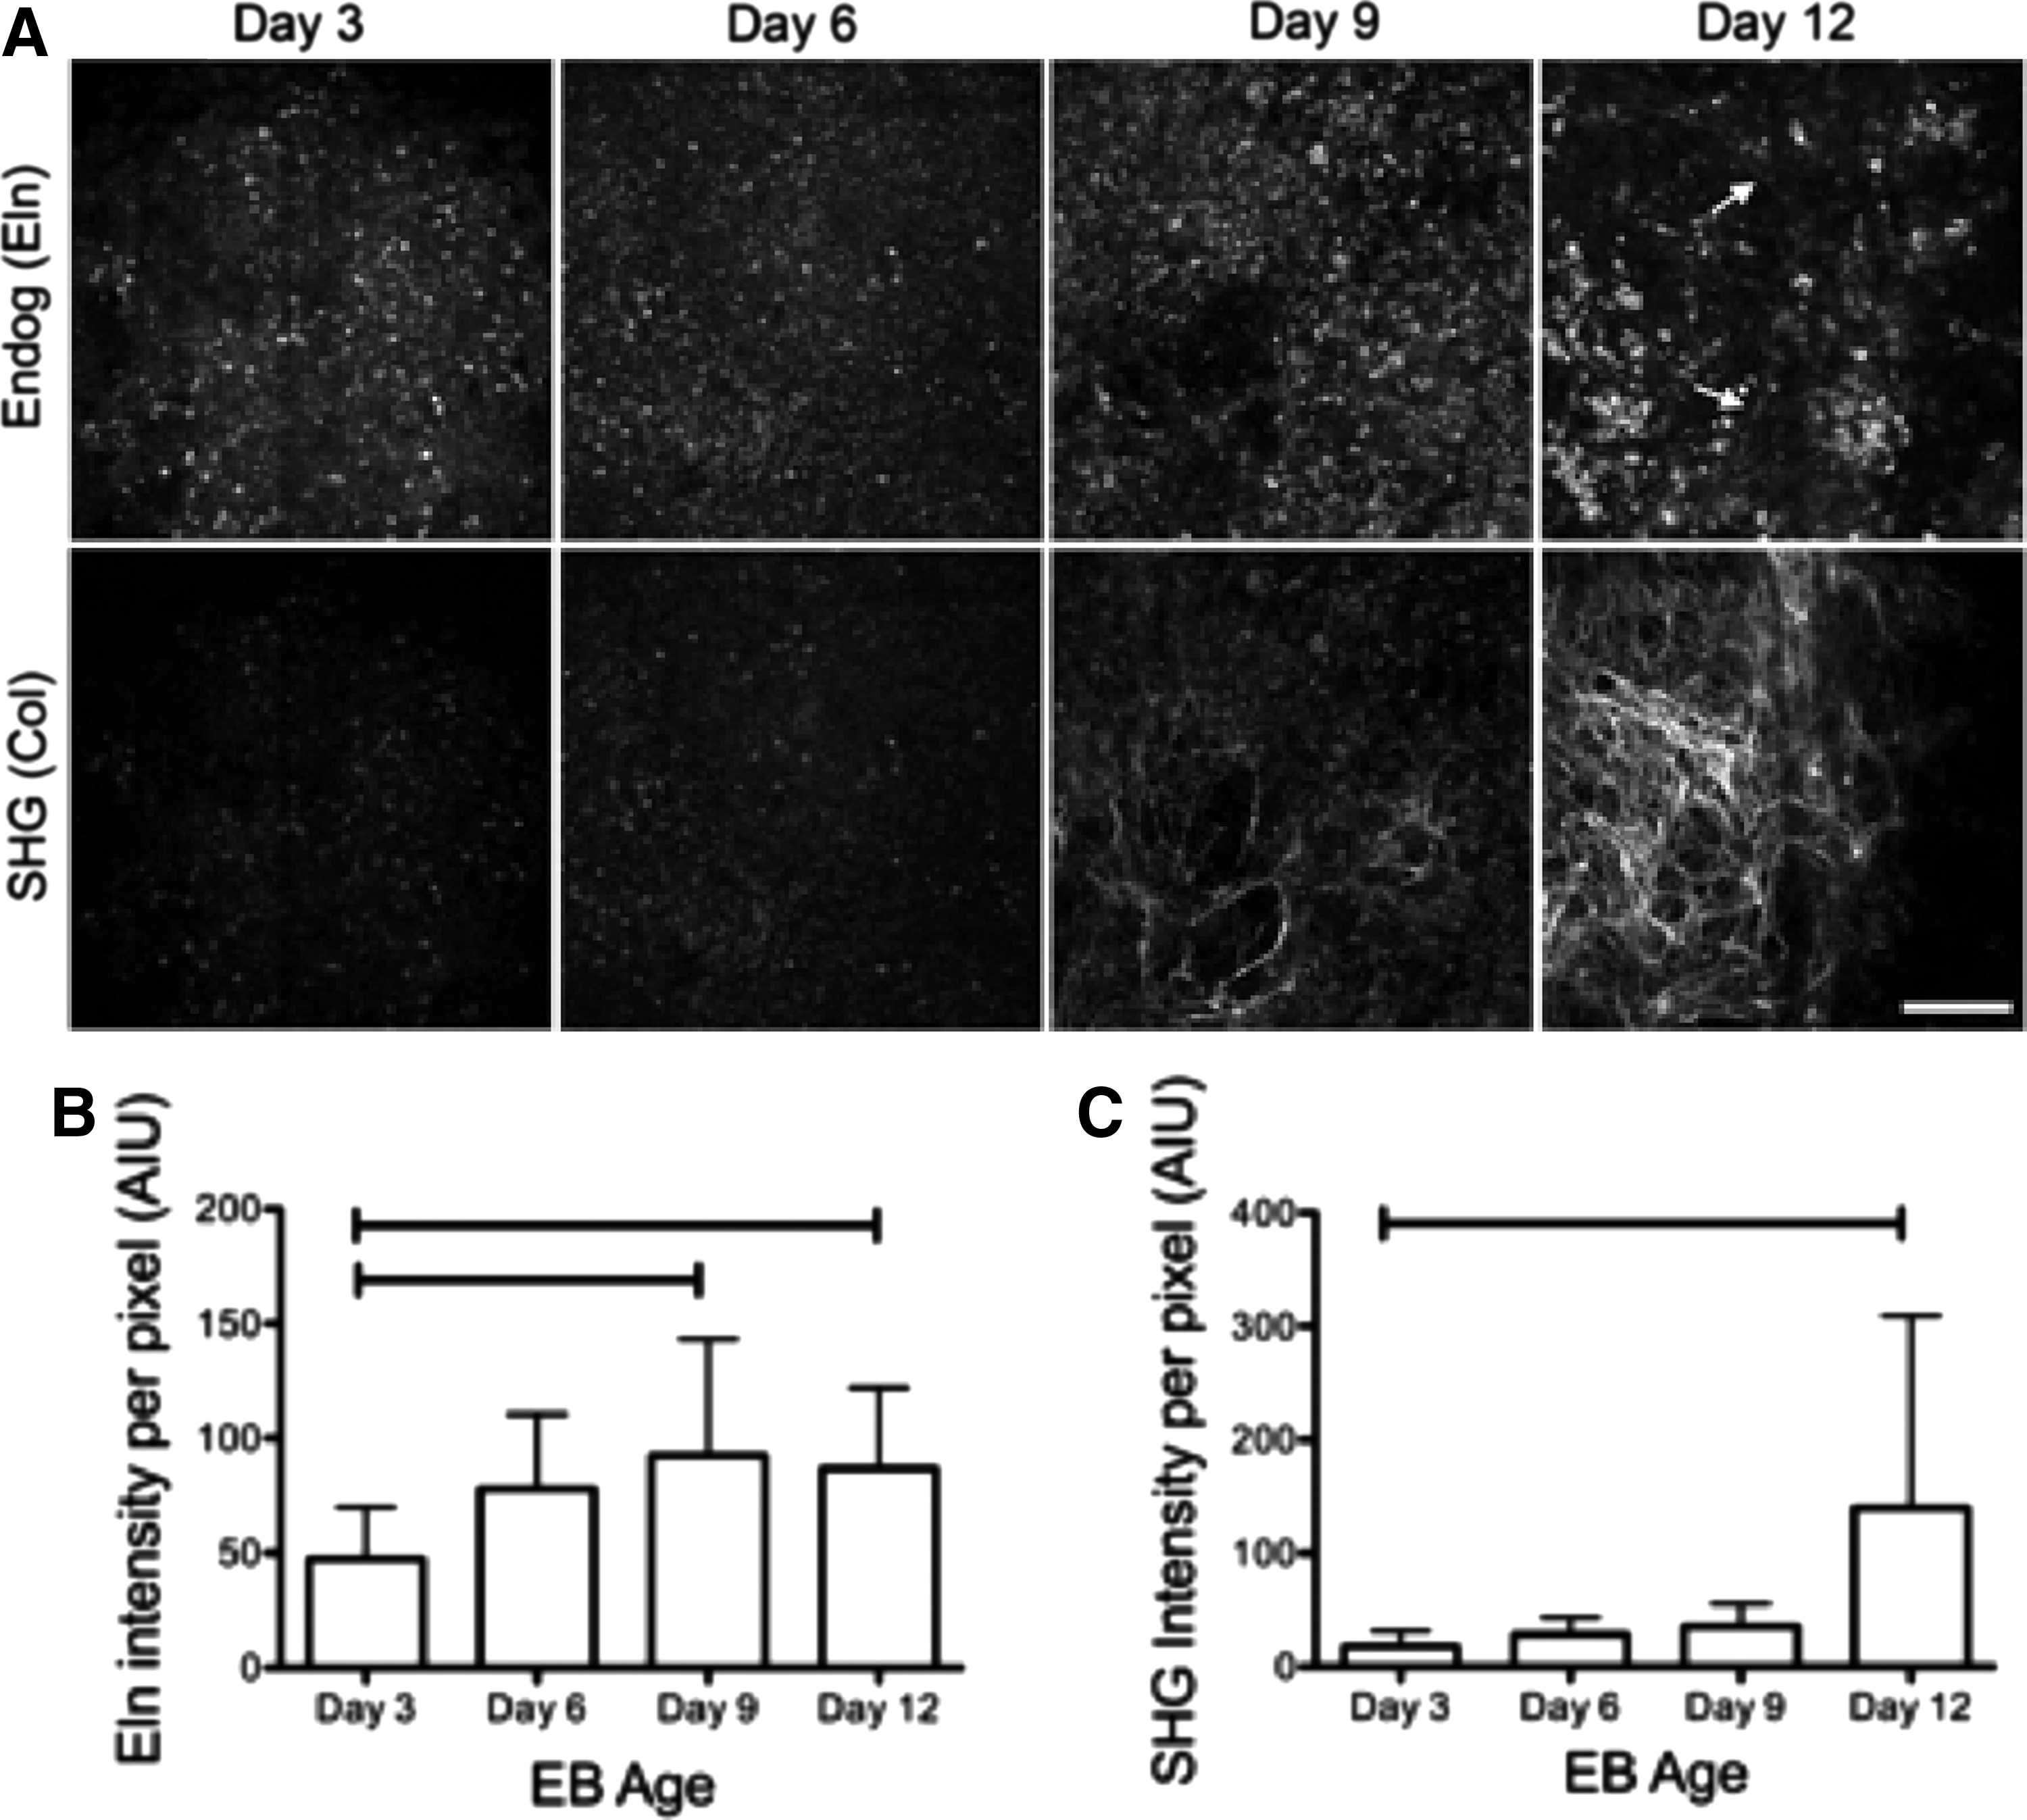
Time course of changes in Eln endogenous fluorescence and second harmonic generation (SHG) of collagen in mouse EBs.
Relationship between the location of Eln, ColI, and cardiomyocytes
To compare the relationship between Eln, ColI, and stem cell-derived cardiomyocytes in day 12 mouse EBs, we examined the relative location of endogenous Eln and ColI signals to that of cTnT immunolabeling as a marker of cardiac differentiation (Fig. 3A). The intensity of the three signals was determined in identical regions. Using image sets that exhibited both the presence of the cTnT label and a strong SHG signal, the ratio of the intensity of ColI associated with (i.e., overlapping with) intensity of cTnT to the intensity of ColI separate from cTnT was determined. Similarly, the ratio of the intensity of Eln associated with (i.e., overlapping with) intensity of cTnT to the intensity of ColI separate from cTnT was determined. Thus, a ratio >1 suggests a positive association between cTnT and the ECM protein of interest, while a ratio <1 indicates a negative relationship.
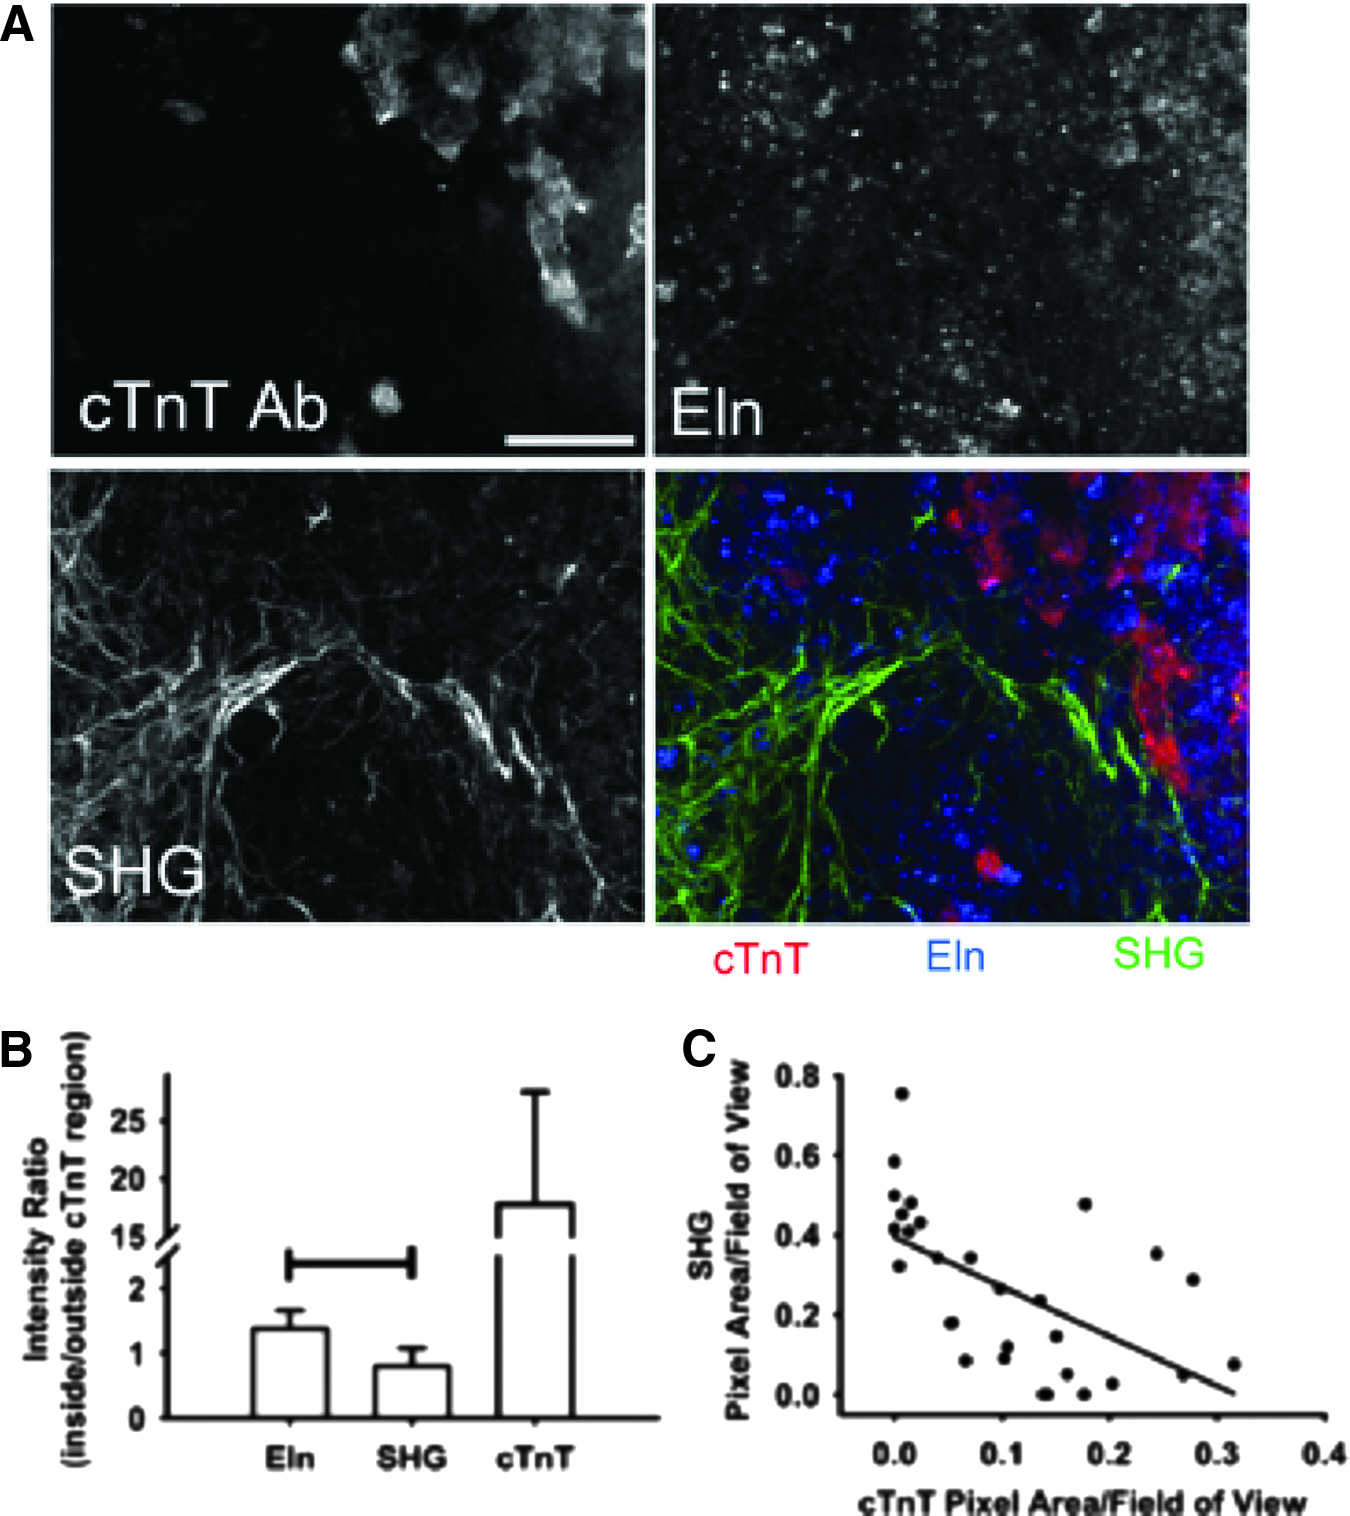
Spatial relationship between endogenous signals of extracellular matrix (ECM) components and cardiomyocytes.
The cTnT intensity ratio was determined to confirm the ability of this analysis method to distinguish between intensity differences inside and outside the troponin-labeled region. Eln intensity exhibited a positive relationship with the location of cTnT label (ratio, 1.4±0.3), while the ColI SHG intensity ratio (ratio, 0.8±0.3) suggested a negative relationship (Fig. 3B). However, this ratio did not support the dramatic separation between the SHG signal and cTnT label that was apparent by eye. Therefore, we utilized all fields of view collected, including those that did not contain SHG or cTnT label, and assessed the percent area occupied by SHG and by cTnT. When the percent area occupied by SHG is plotted against the area occupied by cTnT, a distinct negative correlation emerges (Fig. 3C). These results suggest that Eln and ColI exhibit different spatial relations with differentiated cardiomyocytes in EBs.
Discussion
This study provides two important advances for matrix biology. First, we show that endogenous properties of the ECM can be detected in cellular aggregates, such as of embryonic stem cells, which could then be used to track the spatial and temporal distribution of ColI and Eln ECM in live cultures—a finding of far-reaching import, especially in tissues containing substantial amounts of or changes in ColI or Eln with development, disease, or normal homeostasis. Second, we demonstrate that differentiation of cardiomyocytes appears to be spatially related to the accumulation of Eln and scarcity of fibrillar ColI several days after EB formation. Future studies will further characterize these changes dynamically in live cellular aggregates and will probe whether direct manipulation of Eln or ColI in vitro and in vivo can enhance or inhibit cardiomyocyte differentiation. We postulate that studying the ECM dynamics of many tissues, including lung tissue, blood vessel, and wound/scar formation, would also benefit from this approach.
The demonstrated import of Eln in the context of cardiomyocyte differentiation is surprising to us as Eln of the cardiovascular system is most commonly associated with the arterial structure. Elastic fibers are observed in high concentration in the elastic lamellae and are thought to be crucial for recoil following distension associated with the pumping of blood in the vessel.48–50 The heart, on the other hand, must contract and relax; a function largely associated with the work of the sarcomeres of mature cardiomyocytes, which when isolated from tissue exert a force of ∼5 nN/μm2.51–55
Elastic fibers are perhaps less necessary in the adult heart, but is there some utility for elastic fibers in the developing heart? The developing heart experiences low filling pressure (end-diastolic pressure of between 2.5 and 8 mm Hg) and therefore the fetal heart might need to be more compliant to attain the sarcomere lengths needed to develop enough tension to pump. This possibility is supported by the fact that more compliant isoforms of titin, the molecular spring of cardiac muscle, are found in the fetus.56,57 Elevated Eln and components of the elastic fiber in the fetus could also increase compliance and may provide biochemical signals to transition the fetus to the altered pumping dynamics experienced after birth. We observed here an increase in Eln intensity from day 3 to 9 and slight decrease from day 9 to 12 of EB formation (Fig. 2). These results are reminiscent of those found with embryonic cardiac development, namely that Eln content increases in the developing heart to day 16.5 in mice and then decreases through the postnatal period. 40
We observed an increase in collagen production with EB development. Similarly, gene expression studies indicated an increase in collagen type I with EB development. 58 However, because of the heterogeneity within an EB or other cellular aggregates, this type of bulk analysis, although informative, does not provide information on the microenvironment at the level of the cell. Cellular level analyses are essential for uncovering subtle, but significant, localized ECM influences, such as our observation of a negative correlation between ColI and cardiomyocytes. This negative correlation of ColI accumulation with cardiomyocyte differentiation is a trend that is just emerging in the literature.
A 2011 study screened various ECM proteins for their ability to maintain and expand murine cardiac progenitor cells. Of those ECMs tested (ColI, ColIV, laminin, and fibronectin), ColI was the least supportive of CPC health. 18 Similarly, the ECM derived from cardiac tissue has been shown to enhance cardiomyocyte maturation of rat cardiac progenitor cells 59 and human embryonic stem cells. 60 Together with our studies, these results suggest that ColI might have a dampening effect on early differentiation of cardiomyocytes or it may impact on the growth and division of cardiomyocytes or their precursors through a mechanism we do not yet understand. The imaging techniques we describe here, because they can be performed on live cultures without manipulation required of staining protocols, could be used to better understand the relationship between ECM components and differentiation.
The ability to follow the distribution of ColI and Eln over time in live cells could also be used to help create biosynthetic matrices that could help induce the differentiation and delivery of embryonic stem cells in vivo to promote the formation of functional mature cell types, including cardiomyocytes. Many groups are utilizing bioreactors to stimulate matrix production in engineered tissues before implantation.61–70 It would be useful to be able to characterize tissues that are formed in a bioreactor and directly implanted rather than sacrificing a representative construct for histologic analysis. A further addition to such an approach could be the utilization of fluorescent reporter elements associated with the maturation of certain cell types. In this way, the steps of cellular specification could be linked with expression and accumulation of ColI and Eln. Finally, the advancement of multiphoton-based imaging allows for in vivo imaging in certain accessible locations, including the skin and brain through visualization chambers. Thus, an engineered ECM-containing matrix could be imaged noninvasively following transplant and changes in matrix could be tracked over time.
The challenges of this approach lie largely with the discrepancy of imaging parameters used to image Eln endogenous fluorescence and the sensitivity of detection.37,42–47 In this study, we attempt to hone in on the best parameters in a systematic way and, in addition, provide tangible evidence to support specificity and sensitivity claims. We show high specificity, but are limited somewhat by the sensitivity. To enhance sensitivity, one could consider coupling measurement of intensity with that of fluorescence lifetime (i.e., the time the fluorophore remains in the excited state).71,72 In addition, although the imaging parameters used for SHG are well outlined in the literature, SHG lacks specificity for collagen type as it can detect several different fibrillar collagens. The simultaneous use of forward and backward SHG could improve the separation of different fiber types. 73
As demonstrated in this article, SHG and MPLSM-based contrast offer powerful methods for monitoring collagen and Eln structure, respectively, in intact tissues. Imaging is the only currently available method providing collagen and Eln quantitative measurement at cellular resolution. Of available imaging methods, SHG and MPLSM offer specificity and depth resolution. Although future work needs to be done to improve detection of ECM fiber structure in intact tissue, strong evidence is emerging from a number of studies ranging from cardiac and lung to breast and brain tissues40,74–82 that monitoring ECM fiber topology and structure temporally and spatially will be of great value.
Although groups are improving antibodies for collagen, currently available antibodies do not well distinguish different collagen types. Furthermore, while proven histology approaches for both collagen83,84 and Eln85,86 are more inclusive of fiber types, they require fixation and potentially physical sectioning before staining, obviating the application of these methods to live samples and limiting the 3D assessment of the microenvironments. Although SHG and MPLSM, in their current form, have limitations, overcoming these deficiencies is the focus of ongoing work by several groups. For example, SHG in its current standard implementation is not able to differentiate collagen types, cannot detect nonfibrillar collagen, and is sensitive to changes in the microenvironment, complicating quantitative measurements across tissue types and preparations. Furthermore, despite its improved depth over other optical imaging methods, SHG is still limited when examining whole tissues. Similarly, Eln imaging by MPLSM exhibits limitations, such as depth penetration, and consistent quantification methods and has unique issues due to the requirement of Eln autofluorescence for high-sensitivity MPLSM detection.
For future studies that characterize and quantify ECM fibers with stem cell differentiation, there is great potential of employing emerging methods that improve Eln and SHG collagen imaging. This includes improved forward and backward-based SHG detection,73,87–91 which discriminates collagen types. Additional efforts to improve the depth resolution of SHG seek to identify ideal wavelengths for optical penetration with SHG. 92 Several groups studying the role of the microenvironment on the SHG signal are examining the source of contrast in the collagen structure itself, including how changes in cross-linking can complicate consistent quantitative results.93–95
Thus, imaging Eln and ColI without the addition of exogenous labels and probes affords a unique opportunity to compare spatial and temporal ECM dynamics with cell behaviors. We envision growing uses for the detection of Eln and ColI endogenous signatures, especially in the context of cardiac regeneration, and encourage continued identification and evaluation of other endogenous markers of the ECM state.
Acknowledgments
This work was funded by the National Institutes of Health Award, RC1HL100014, and the University of Wisconsin Applied Research Award, B19-2510.
Footnotes
Disclosure Statement
No competing financial interests exist.
References
Supplementary Material
Please find the following supplemental material available below.
For Open Access articles published under a Creative Commons License, all supplemental material carries the same license as the article it is associated with.
For non-Open Access articles published, all supplemental material carries a non-exclusive license, and permission requests for re-use of supplemental material or any part of supplemental material shall be sent directly to the copyright owner as specified in the copyright notice associated with the article.