
Abstract
Schwann cells (SCs) aid in nerve repair in the peripheral nervous system, and their ability to migrate into the injury site is critical for nerve regeneration after injury. The majority of studies on SC behavior have focused on SC alignment through contact guidance, rather than migration. The few studies on SC migration primarily investigated the migration of individual cells over several hours with time-lapse microscopy. However, during neural tissue repair, SCs do not migrate as single cells but as a population of cells over physiologically relevant time and length scales. Thus from a practical perspective, there is a need to understand the migration of large populations of SC and the collective guidance cues from the surrounding environment in designing optimal transplantable scaffolds. This study investigates a large population of migrating SCs over a period of 2 weeks on patterned polydimethylsiloxane (PDMS) microgrooved channels of different sizes. Two methods were used to quantify the migration velocity of a large cell population that minimized the confounding effect due to cell proliferation: one based on a leading edge velocity and a second based on a binary velocity. Both approaches showed that the SC population migrated the fastest on the smallest sized microgrooved channels. The insights provided in this study could inform on future designs of transplantable scaffolds for peripheral nerve regeneration.
Introduction
S
Studies of SC migration have informed on scaffold design for neural regeneration, from peripheral nerve injury to spinal cord injury.2,4 To improve the alignment of regenerating axons and to accelerate the migration of SCs, three-dimensional channels have shown promise. 7 However, due to limited knowledge on migrating SC populations within the channels, there have been few recent breakthroughs in scaffold designs. Numerous in vitro studies have focused on controlling SC behavior through contact guidance achieved by micropatterning extracellular matrix proteins, 8 nano- or micro-fibers,9–13 microgrooves, and channels.14–16 However, the majority of studies on microgrooved substrates have focused on SC alignment,14,15,17 rather than migration.
Studies on SC migration have focused primarily on single-cell motility, with one study tracking the migration of a small group of cells over several hours using time-lapse microscopy.16,18 However, the cells were isolated from each other with minimal cell–cell interaction and migrated randomly. Furthermore, the study neglected cell proliferation, resulting in a model of averaged migration of several individual cells. 18 Thus, it is unclear how this model would inform on the migration of a large proliferating population of cells over a period of days. During neural tissue formation and repair, SCs do not migrate as discrete single cells but as a population of cells over physiologically relevant time and length scales.19,20 Thus, from a practical perspective, a better understanding of the dynamic interactions between a migrating population of SCs and the collective guidance cues from the surrounding environment could provide more relevant insights into neural tissue repair that could influence future designs of transplantable scaffolds.3,21,22 Thus, there is a need to understand how large populations of SCs migrate into the injury site, under a complex environment where cell–cell interaction, cell proliferation, and extracellular guidance exert influence.23,24
This study investigates a large population of migrating SCs over a period of 2 weeks. We developed a method to quantify the migration speed of a large cell population while minimizing the confounding effect of cell proliferation. Micropatterned polydimethylsiloxane (PDMS) surfaces of different channel sizes, which served to mimic the topography and orientation of channel structures in transplantable scaffolds, 25 were used to investigate the migration of populations of SCs over 2 weeks. The migration velocities of the SC populations on different channel sizes were quantified and compared using two methods: one based on a leading edge velocity and a second based on a binary velocity.
Materials and Methods
Materials
PDMS substrate was prepared using the Sylgard 184 silicone elastomer kit purchased from Dow Corning (Midland, MI). Borofloat33 4"-Wafer was purchased from WRS Materials (Reno, NV); SU-8 photoresist was purchased from Microposit™ (Marlborough, MA); and Poly-
Microgrooved substrate fabrication
Microgrooved substrates were fabricated as previously described. 26 Briefly, patterns were designed in AutoCAD (Autodesk, San Rafael, CA), with 50, 100, and 150 μm spacing, in 1 × 3 cm rectangular sections, as shown in Figure 1. These patterns were printed on mylar films, which were used as masks to generate selectively polymerized regions on silicon wafers during the photolithography process. Photoresist SU-8 was spin-coated at 2000 rpm for 40 s and baked at 110°C for 1 min on a hot plate. Through conventional photolithography, the photoresist was patterned to expose openings on silicon wafers as desired. The alternating grooves and plateau patterns were then transferred onto PDMS by curing a 10:1 solution of base and curing agent in a polystyrene tissue culture dish at 60°C for at least 2 h. After curing, the crosslinked PDMS was peeled off and cut at the edges into separated pieces. A substrate was fit into each well of a six-well plate, which was treated with a PX-250 plasma cleaning/etching system (March Instruments) for 3 min at 165 mTorr and 65 sccm flow of O2. The substrates were subsequently incubated with poly-D-lysine (PDL) solutions at 37°C for 2 h before cell seeding. After the PDL coating, the surface was rinsed with sterile water. A piece of rectangular silicone insert was attached to the flat surface with one side aligning to the end of channels, which was used as a medium holder to maintain initial attachment of the cells within the square area. The medium holder also helped ensure that the distance between the cell and channels was 50 μm (width of the wall thickness) before commencing the migration study. The entire design is illustrated in Figure 1.
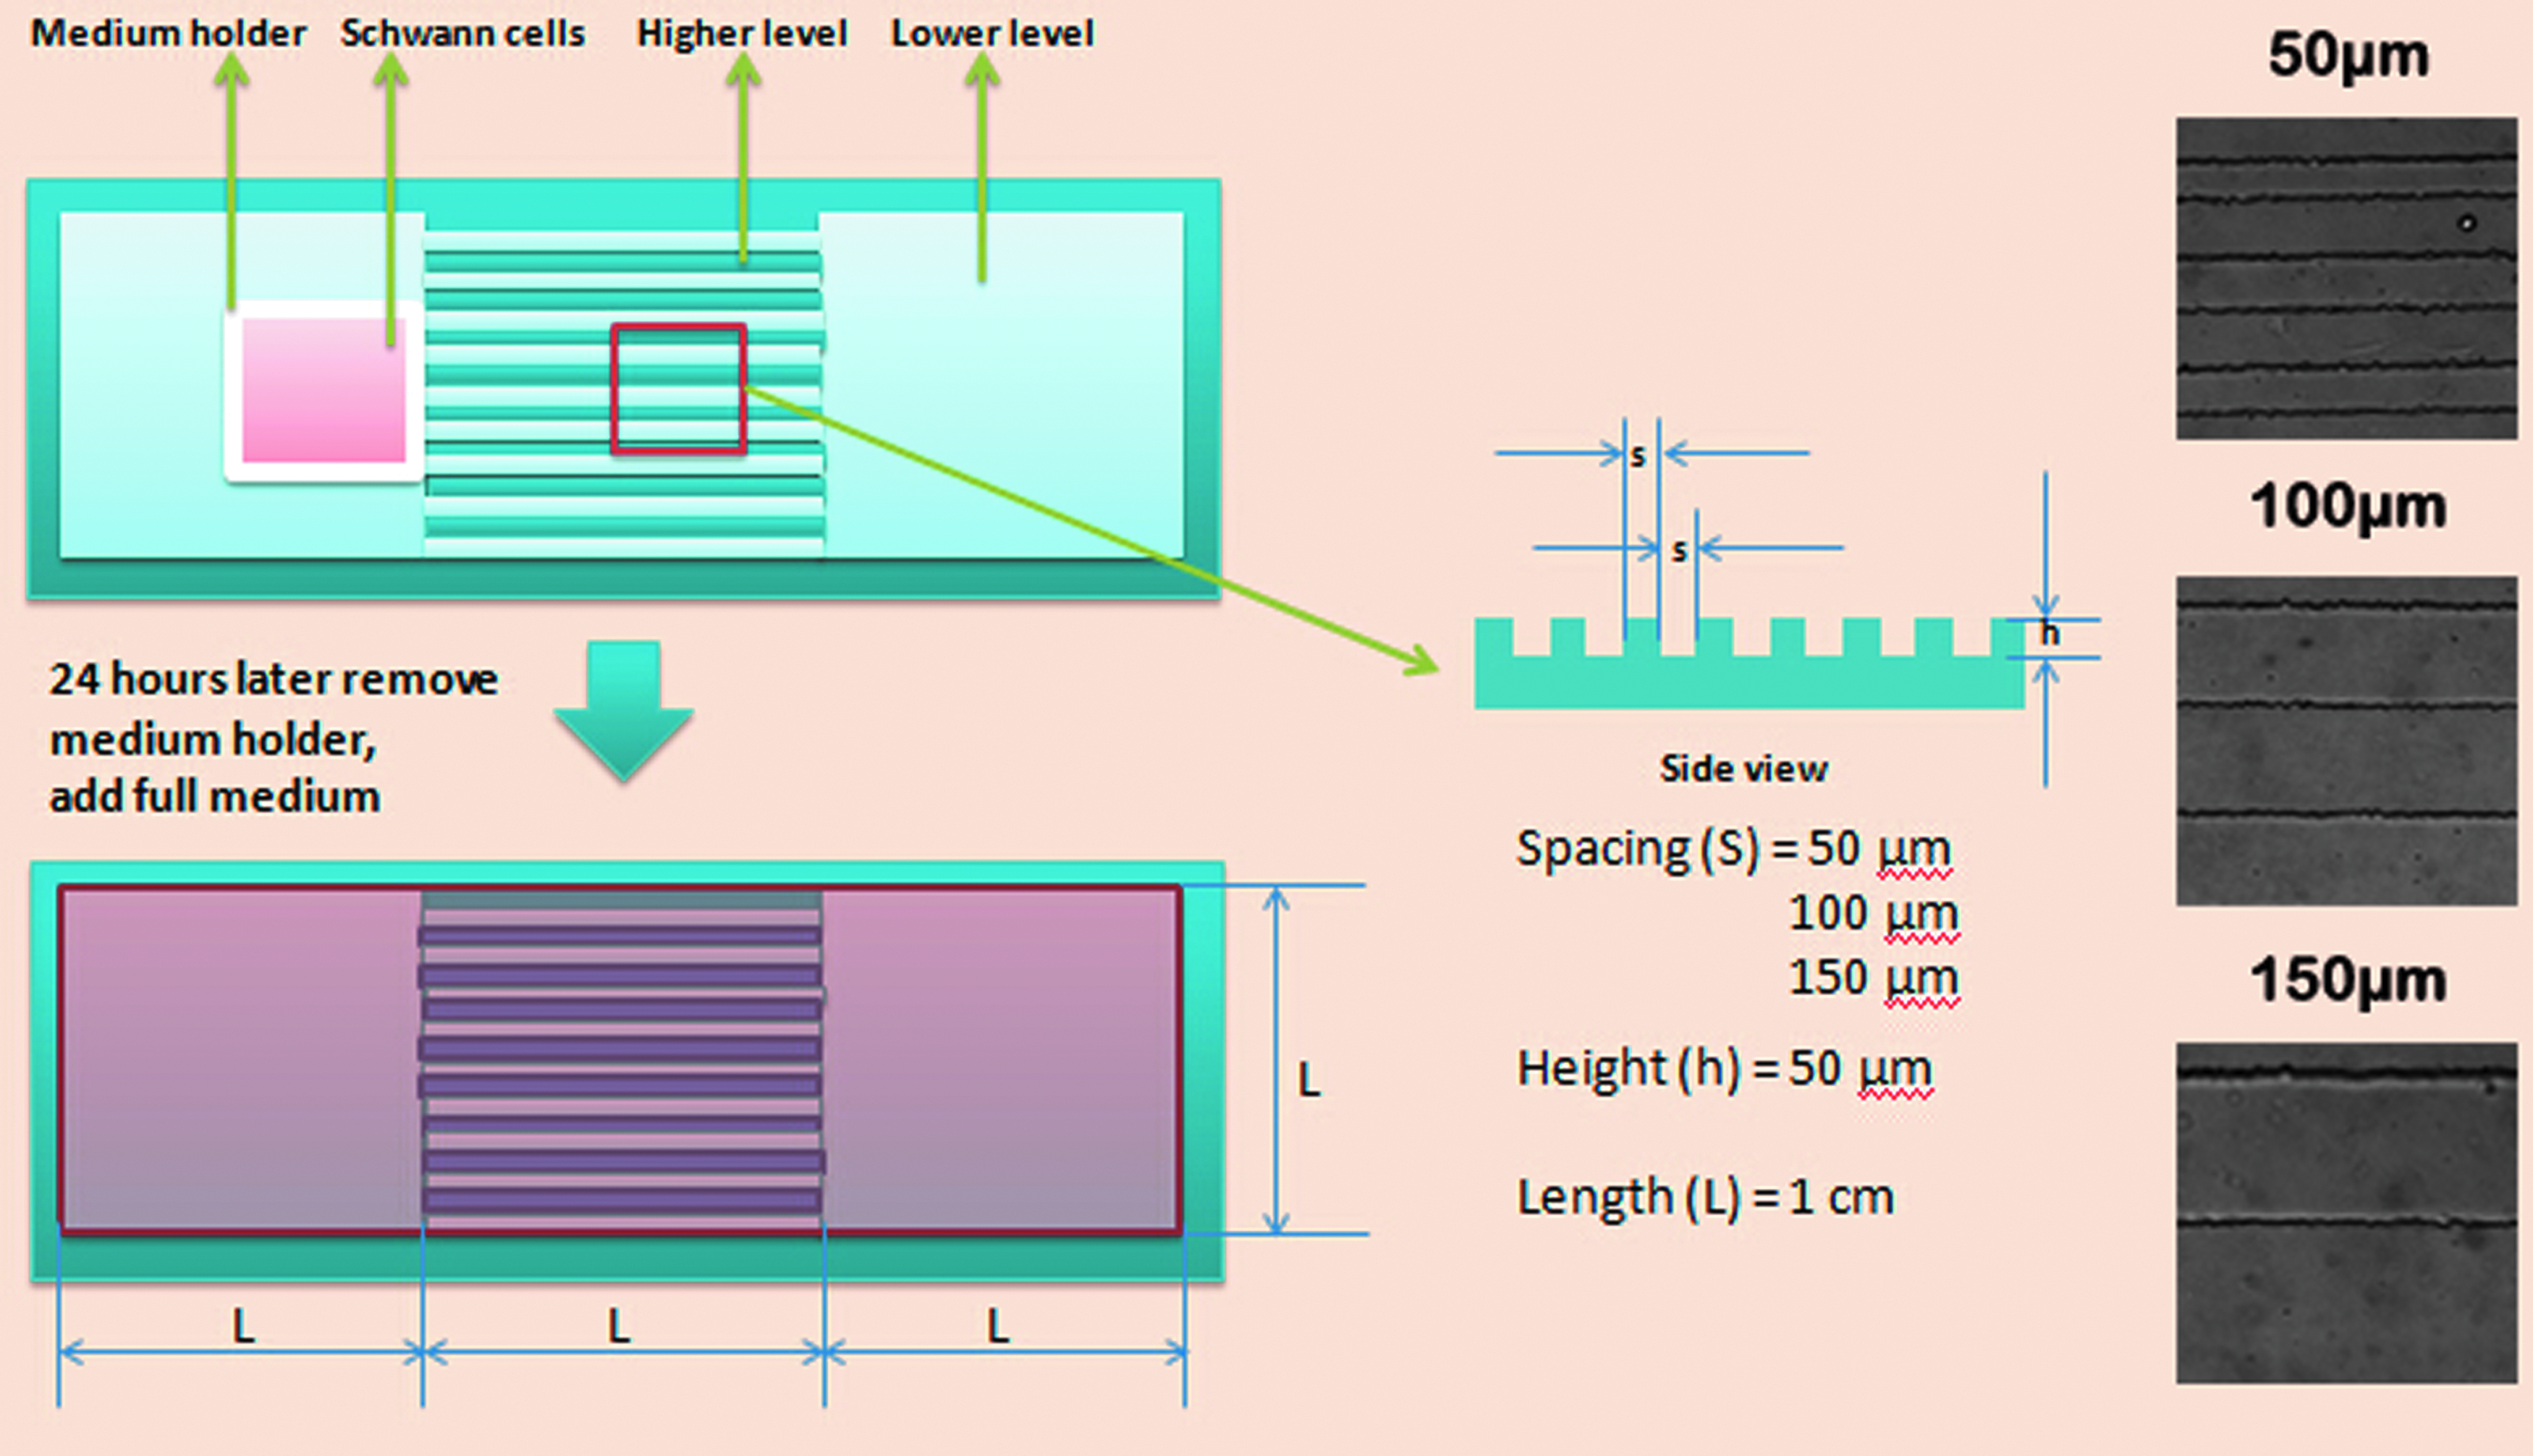
Schematic of channel design and PDMS preparation. PDMS culture substrate consists of channels and two flat surfaces at each end. The flat areas are leveled with the groove, and the ridges are 50 μm in height. Both the grooves and ridges are of equal widths. Three different channel sizes, 50, 100, and 150 μm, are prepared. After coating with PDL, a square medium holder is placed at one end of the flat area near the edge of the channels. SCs are seeded in the holder for initial attachment. After 24 h, the holder is removed and the medium is added to the entire surface. Phase-contrast images of the three different channel sizes, 50, 100, and 150 μm, are shown on the right. PDL, poly-D-lysine; PDMS, polydimethylsiloxane; SCs, Schwann cells. Color images available online at
Cell culture
All procedures for cell isolation were approved by the Institutional Animal Care and Use Committee at Michigan State University. SCs were isolated using the same protocol as previously described. 27 One-day-old pups were sacrificed by decapitation. The sciatic nerves were extracted by making an incision from the tail up the spine to the inner thigh near the foot. Nerve sections were cut into small pieces, transferred into dissociation medium containing collagenase and trypsin, and incubated for 45 min at 37°C. Mechanical dissociation was performed using a fire-polished glass Pasteur pipette. Cells were then centrifuged for 5 min and resuspended in DMEM containing 10% heat-inactivated FBS and 1% antibiotic (penicillin/streptomycin). The purification procedure began by adding AraC into the medium after 48 h of culture, followed by antibody selection using anti-Thy 1.1 antibody and Rabbit Complement on day 5. After purification, the cells were cultured in complete SC growth medium containing DMEM, 10% FBS, 1 × Penn/Strep, 21 μg/mL BPE, and 4 μM forskolin and placed in a humidified incubator containing 5% CO2 at 37°C. The medium was replaced every 2 days until the cells reached 80–90% confluence. Confluent cells were detached using 0.25% trypsin-EDTA and plated at a density of 100,000 cells per milliliter with 150 μL added to each medium holder.
Immunocytochemistry
Immunocytochemistry was performed at room temperature on cells that were seeded on the PDMS substrates for 6 days. Cells were rinsed with PBS, followed by fixation with 4.0% paraformaldehyde in PBS for 15 min, rinsed three times in PBS, permeabilized with 0.1% Triton X-100 in PBS for 15 min, and washed three times with PBS. After washing, the cells were blocked in 1% BSA for 30 min. After BSA blocking, the cells were incubated with mouse S-100 primary antibody (1 μL stock per 500 μL of 1% BSA solution) for 1 h, followed by three washes in 1 × PBS; then, they were incubated with anti-rabbit Alexa Flour 546 secondary antibody (1:500 dilution in 1% BSA solution) for 1 h, followed by three washes in 1 × PBS. Confocal laser scanning microscopy images were obtained with an Olympus FluoView1000 laser scanning confocal microscope using a 40 × oil objective.
Migration quantification
Figure 2 illustrates a flowchart for quantifying the migration velocities. The overall process is presented in Figure 2a. Phase-contrast images were collected with a Leica DM IL inverted microscope (Bannockburn, IL) equipped with a SPOT RT color camera (Diagnostics Instruments, Sterling Heights, MI) using a 10 × objective. Image-Pro Plus Version 4.5 was used to process the images. For each set of experiments, images were taken daily of each sample in a grid pattern for the entire 1 × 1 cm patterned surface. A grid composed of successive rectangular images, with each rectangular image consisting of 1600 × 1200 pixels or 1212.12 × 909.09 μm, was numbered sequentially by column from end to end of the microgrooves and by row from top to bottom, as shown in Supplementary Figure S1 (Supplementary Data are available online at
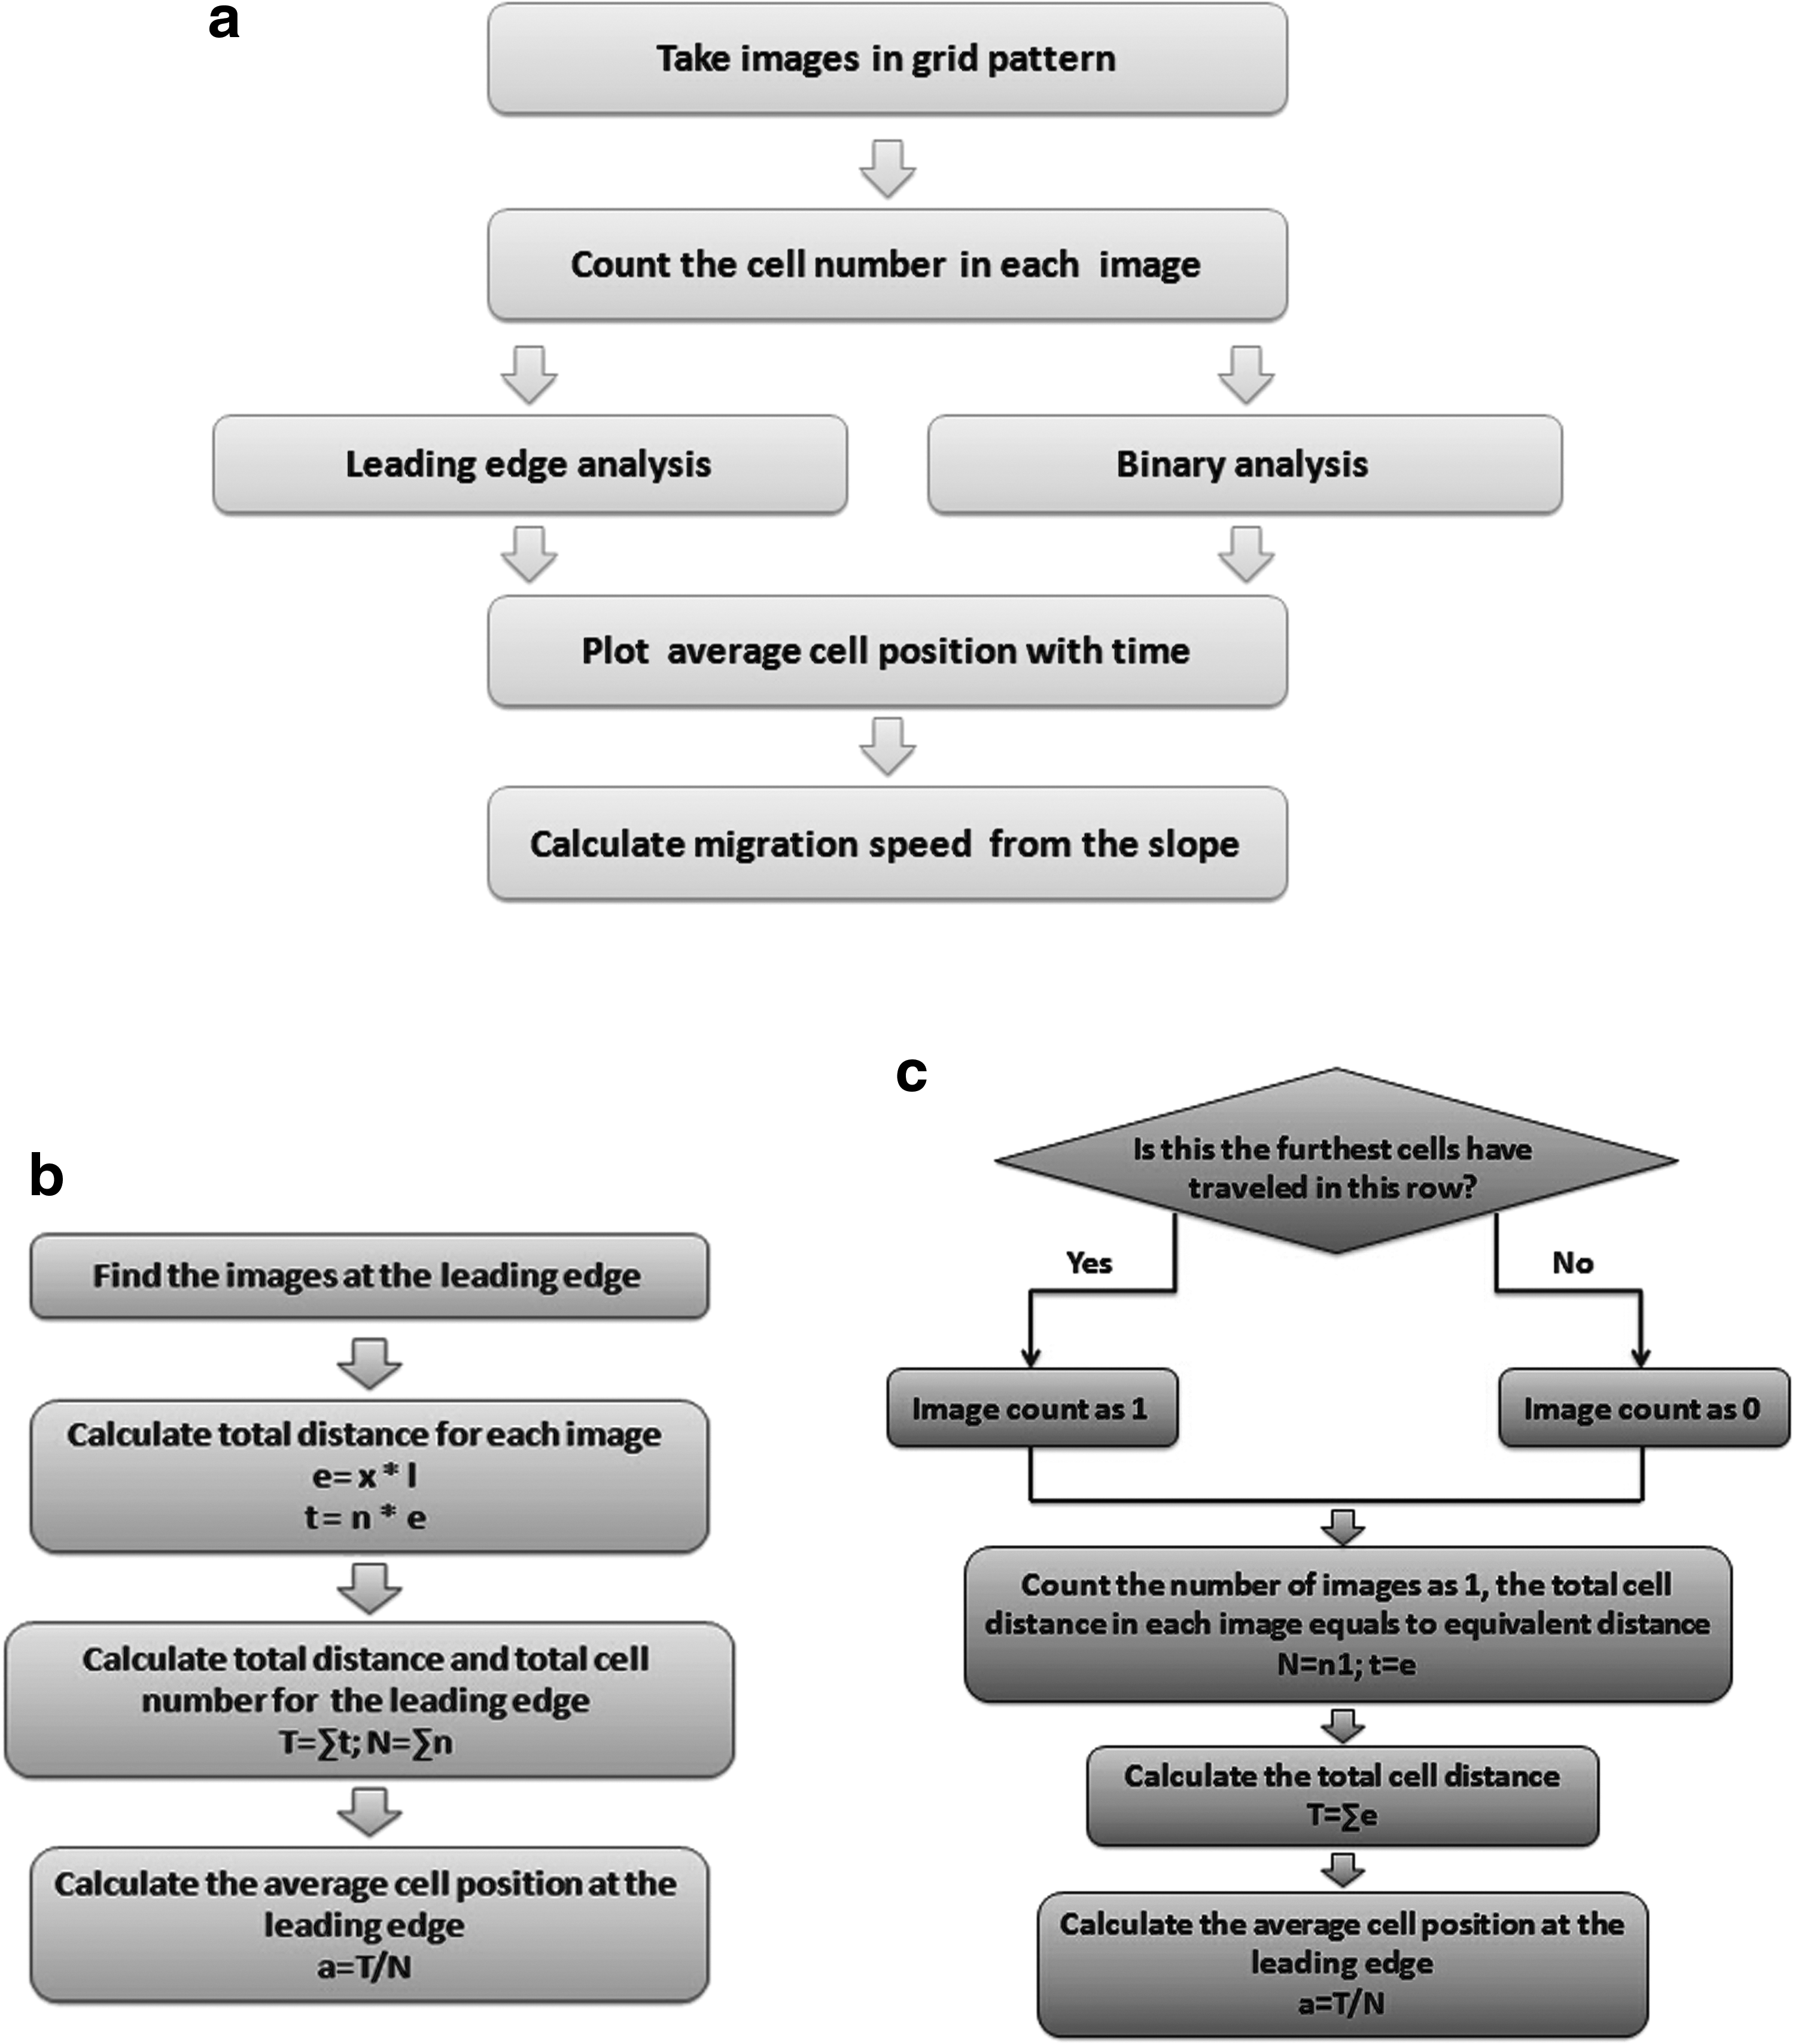
Flowcharts illustrating the various steps in the quantification of SC migration speed.
An equivalent distance (e) of image x–y was calculated by multiplying the column number (x) by the length of the image (l).
The total cell distance (t) in image x–y was calculated by multiplying the number of cells (n) in image x–y by the equivalent distance (e).
After generating the grid, the distance a cell traverses was further analyzed using two different methods of calculating migration speed.
(1) The leading edge velocity (shown in Fig. 2b) uses the furthest image in each row, which represents the leading edge of the migrating cell population. The total cell distance (T) is calculated as the sum of the total cell distance for each image in the leading edge. The total cell number (N) in the leading edge is a sum of the cell number in each image in the leading edge.
The average cell position (a) in the leading edge is defined by the total cell distance divided by the total number of cells in the leading edge.
By plotting the average cell position with time (days), the migration speed in the leading edge is determined by the slope.
(2) The binary velocity (shown in Fig. 2c) uses a binary counting process that counts whether an image contains at least one cell, yes (1), or not, no (0), by asking “is this the furthest the cells have traversed in this row?” In this case, the total number of cells (N) equals the number of images that are counted as “1” (n1), and the total distance the cells traverse (t) in each image equals the equivalent distance (e).
The total cell distance (T) in the binary analysis is the sum of the equivalent distance of the images counted as “1,” and the average distance (a) in the binary analysis is calculated as the total cell distance T divided by the number of images counted as “1” (n1).
The slope obtained by plotting the average distance over time gives the migration speed of the cell population in the binary analysis. The process of generating, analyzing, and calculating the migration speeds from the data using both the leading edge and binary methods for one set of experiments is provided in the Supplementary Data.
For statistical significance, the experiments were repeated four times. Two-sample Student's t-test was used to determine statistical significance. A p-value of <0.05 was considered statistically significant.
Quantification of the orientation angles of the cells is described in Liu et al., 28 where we briefly counted the number of cells in parallel orientation (90° ± 10° angle) to the channels that was normalized to the total number of cells on each surface. This ratio of cells in the parallel orientation is reported by the mean value plus standard deviation. Two-sample Kolmogorov–Smirnov test was applied to evaluate the statistical significance. A p-value of <0.05 was considered statistically significant.
Results and Discussion
Design of microgrooved substrate
The micropatterned substrate is made of PDMS, which is a biocompatible, transparent, and FDA-approved polymer with stable mechanical properties, and it can be easily shaped. 29 Compared with other hydrogels that swell or shrink, the shape of the PDMS substrate after crosslinking remains stable over time and under different temperatures and pressures. 30 The current microgrooved substrate (Fig. 1) for cell migration contains two flat areas at each end of the microgrooves that are flush with the grooves, with 50 μm-high ridges. This design differs from previous studies by enabling SCs to migrate from a flat area onto the microgrooves to the flat area at the other end. The flat areas at the ends permit simulation of SC migration during the repair process, wherein the SCs have to migrate from the host tissue to the injury site through the channels of a transplanted scaffold. In this design, the SCs are initially seeded within a medium holder that is placed onto one of the flat surfaces to maintain an isolated environment for SC seeding and attachment. After the initial 24 h of cell attachment, the medium holder is removed and fresh medium is added to cover the entire surface. Different-sized channels (50, 100, and 150 μm) with equal-sized grooves and ridges (Fig. 1) are prepared such that the migration is similar on both the grooves and ridges.
SCs migrated on both the grooves and ridges
The protocol of SCs isolation is provided by our collaborator, according to the literature; after the purification steps, the purity is ∼98–100%. 31 After the initial 24 h of attachment, the SCs initially migrated in all directions across the 50 μm distance that was presented on removal of the medium holder, until the SCs reached the microgrooves, where they migrated directionally on the microgrooved surface. Surprisingly, the cells migrated onto both the grooves and ridges (Fig. 3a), suggesting that the cells must climb onto the 50 μm ridge. This is in contrast to previous studies where the SCs were directly seeded onto the grooved surface, resulting in random migration in all directions. Confocal fluorescent images in Figure 3b and c show that the migrating SCs reached the ridges and grooves 2 days after removal of the holder (which is 6 days after seeding) and the start of the migration. Some cells were found on the flat area at the other end of the microgrooves; however, the majority of cells remained at the start of the grooves. It took ∼2 weeks for the population of cells to cross the entire microgrooved surface (i.e., to the other end of the microgrooves). To analyze the migration behavior of the SC population across the channels, we captured images every other day for 2 weeks until the entire microgrooved surface was covered with SCs.

Migration of SCs into the channels. SCs are seeded at one end of the flat area on the PDMS culture substrate; after removal of the holder, the cells migrate into the channels.
Comparison of SC migration on different microgrooved surfaces
Although this study focuses on the migration behavior of SC populations on the microgrooved surfaces over a period of 2–3 weeks, there is a significant confounding effect due to the proliferation of the SCs. Therefore, the advancing SC population is the combined result of both SC migration and proliferation. The proliferation is more prominent at the entrance of the channels, whereas migration predominates at the leading edge of the SC population. Thus, to minimize the confounding effect due to proliferation, we calculated two different migration velocities, a leading edge and a binary velocity, based on the distance traversed by the cells. Both methods aim at determining migration while minimizing the effect of proliferation at the backend of the migrating population.
The leading edge is defined as the furthest location that the cells traversed in each row, and it is indicated by the column number of the image (Supplementary Fig. S2). Figure 2b shows a flowchart for the leading edge quantification. To calculate the leading edge migration, only the cells in the grids at the leading edge of the microgrooved surface are counted and the total distance the cells migrated is calculated by summing the total distance traversed by each cell in each image (t) in the leading edge, which is denoted as the total cell distance (T). To calculate the average distance (a), which indicates the average position of the migrating cells in the leading edge, the total cell distance (T) of the leading edge is divided by the total number of cells (N) in the leading edge grid. The average distance (a) is plotted versus time to determine the front of the SC population over time. The slope of the plot provides the migration velocity of the SC population with units of micrometers traversed per day, as shown in Supplementary Figure S3.
To verify the results of the leading edge method, we further developed another method called a binary method. The idea behind the binary processing method is that at least one of the cells in this image has traversed that far, but it ignores the actual number of cells in the image. Using the binary method that counts images as yes (1) or no (0), the entire grid is converted into a binary field and only the images marked as “1” are selected for further calculation, as shown in Supplementary Figure S4. The average position (a) is calculated by summing the total distance traversed (t) by the cells (i.e., the furthest column number denoted as “1”) divided by the number of images counted as 1. This is plotted over time, and the slope provides the binary migration velocities of these cells (Supplementary Figure S3).
Figures 4 and 5 show a comparison of the relative migration on the microgrooved surfaces for three different-sized microgrooves using both the leading edge and binary processing methods. The average migration velocity shows some variance between the different batches of cells. To minimize the impact of cell batch variance, the ratio of the average migration velocity of each channel size is divided by the migration velocity on the 150 μm microgrooved channel. This ratio indicates how much faster the cells traversed on each microgrooved channel over the 150 μm microgrooved surface. Using both quantification methods (Figs. 4 and 5), the relative migration results show that the cells traversed differently along the three different-sized microgrooves and were the fastest on the smallest sized (50 μm) microgrooved surface.
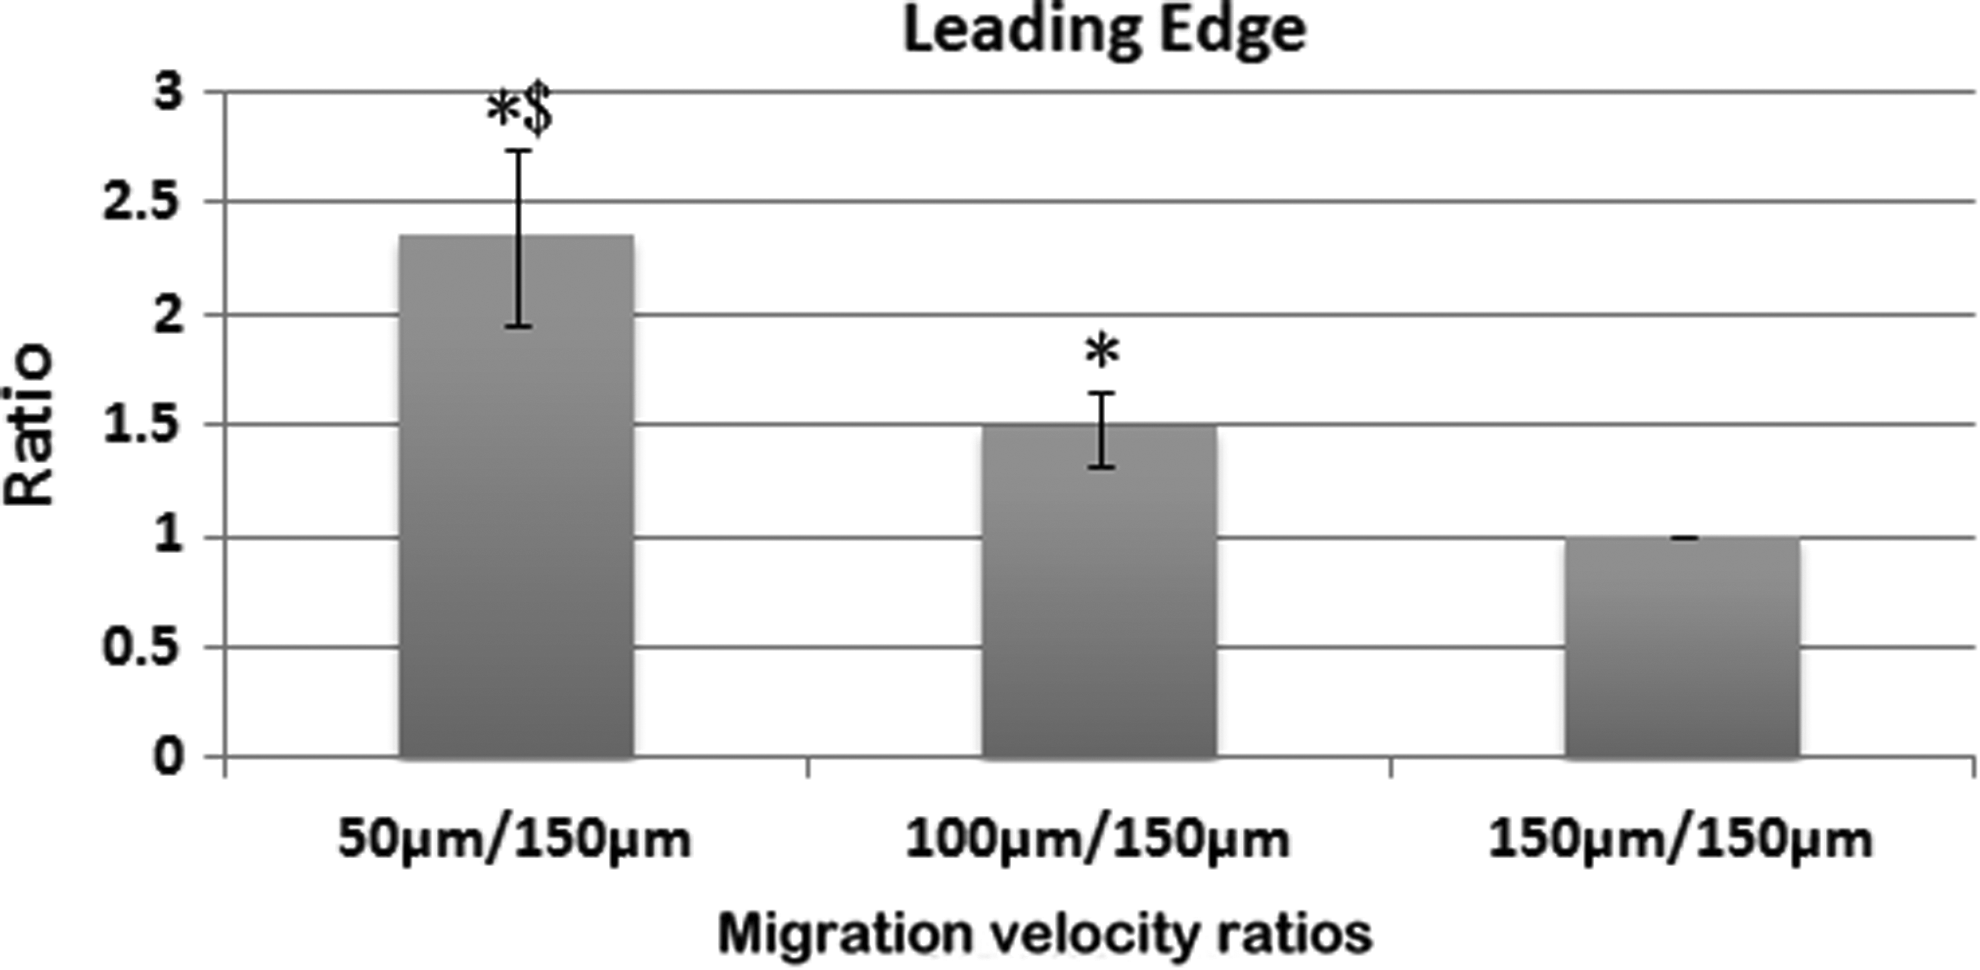
Comparison of SC migration in the different-sized channels using the leading edge velocity. The migration speed of the leading edge in the different-sized channels is normalized to the speed in the 150 μm-sized channels. * < 0.05 when compared to the 150 μm channels; $ < 0.05 when compared to the 100 μm channels. (N = 5).
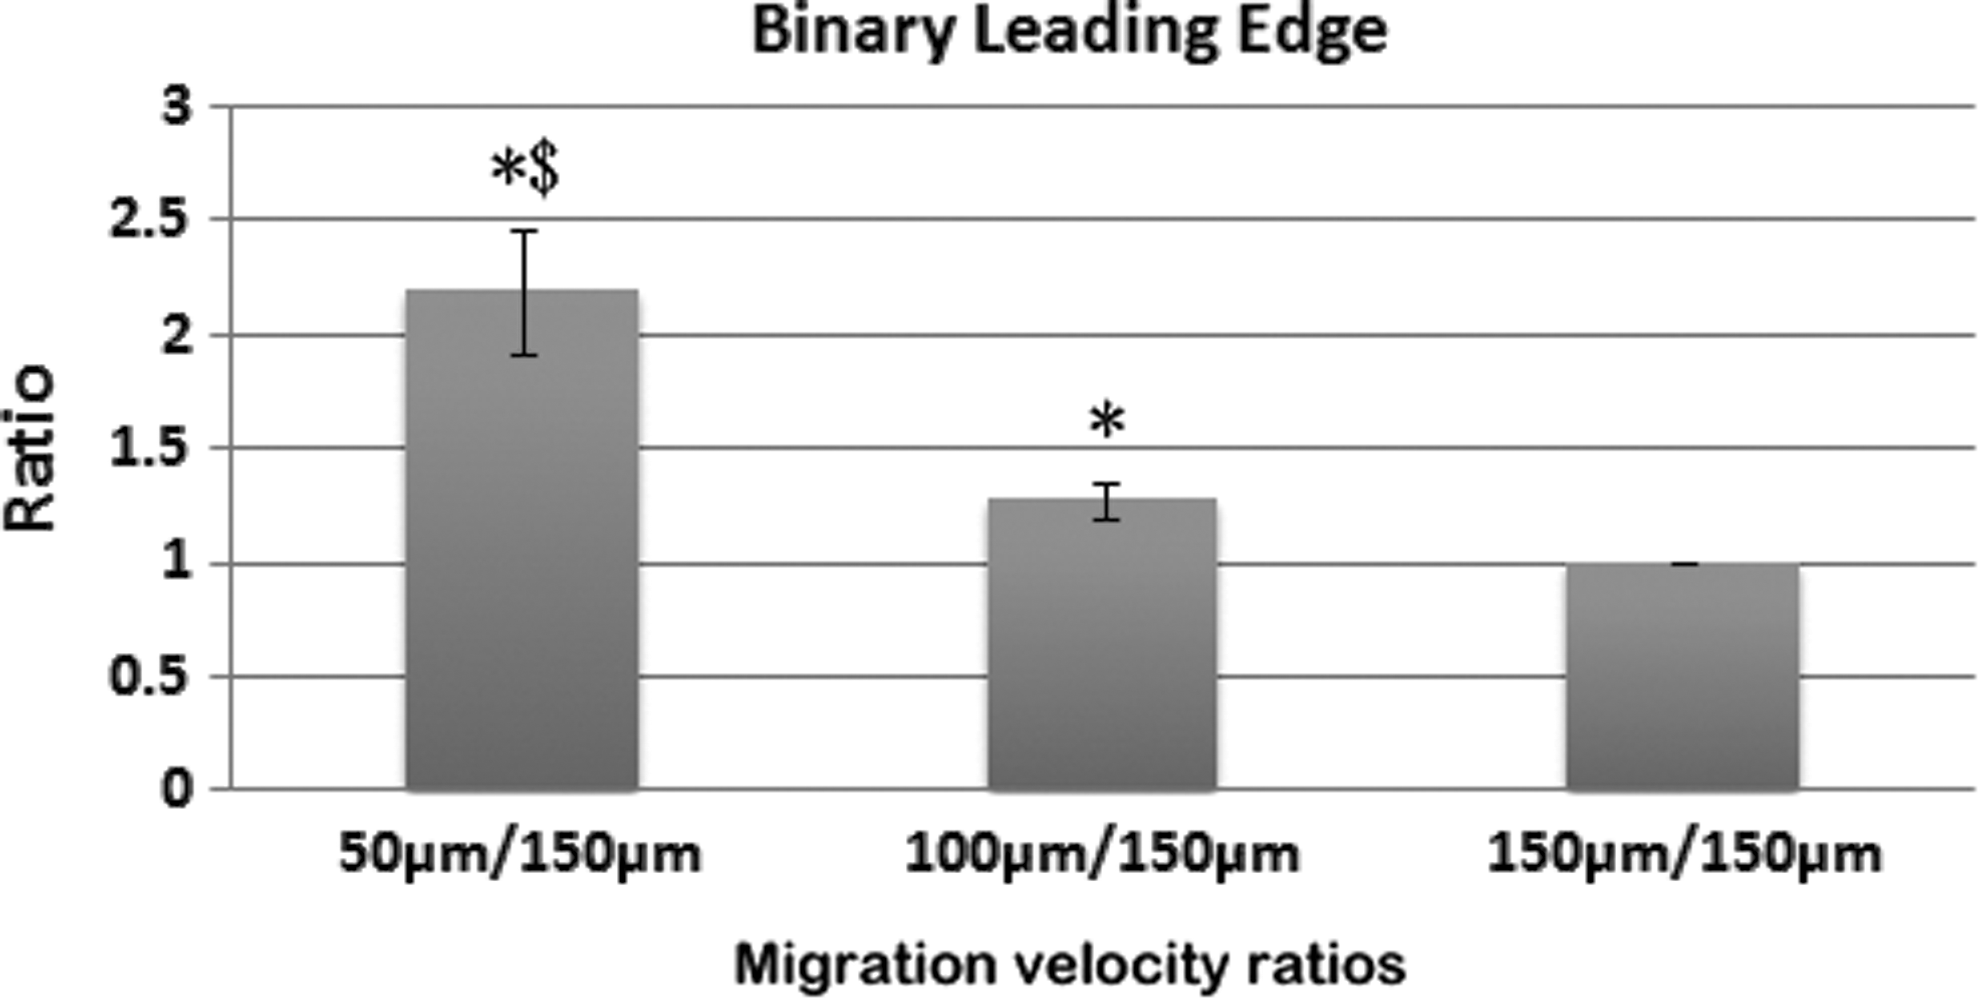
Comparison of SC migration in the different-sized channels using the binary velocity. The binary migration speed in the different channels is normalized to the binary speed in the 150 μm-sized channels. * < 0.05 when compared to the 150 μm channels; $ < 0.05 when compared to the 100 μm channels. (N = 5).
The ratios calculated using the leading edge method differ slightly from the binary method. The calculation based on the leading edge counts the real number of cells located at the leading edge, where the cell number for a grid in each row represents the frequency at which the cells traverse a certain distance. Therefore, the results based on the leading edge method indicate how far the cells migrated on the different-sized microgrooved channels. In contrast, the binary method simplifies the actual number of cells in each image with a yes (1) or no (0), and it indicates how far the cells can migrate on the different microgrooved surfaces. The results from both methods consistently show the fastest SC migration on the smallest-sized microgrooved surface.
Prior studies investigated the migration of single cells over a few hours32,33; however, the results do not inform on how tissues within a complex environment of large populations of cells would behave. Recently, an SC migration study on microgrooved surfaces using time-lapse microscopy demonstrated that the anisotropic microgrooved surface promoted cell migration in the direction parallel to the microgrooves. 16 However, the migration speed was calculated based on the net distance a single cell traversed over several minutes and did not provide clear trends as a function of the microgroove size. Although the study calculated the net migration speed in the direction parallel to the microgrooves, the speed was bi-directional since the cells were seeded directly onto the microgrooved surfaces and migrated in both directions. In contrast, the current experimental design in which the cells are seeded on a flat area on one side of the microgrooves induced directionality, resulting in the migration of the cells to the flat area on the other side. Therefore, this design would better simulate a migration behavior of the SC population into scaffold channels. To our knowledge, this is the first study on the migration over an extended period of a large population of SCs on a microgrooved substrate, and in which the migration speed of the SC population was quantified using the leading edge and binary methods.
Comparison of SC alignment in different channels
Previous studies indicated that cell morphology is causally linked to cell motility.34,35 The bipolar morphology of SCs includes a long, spindle-shaped soma that is flanked by two thin extensions, rendering them an ideal cell type for migration. 36 The direction of migration follows the long axis of the cell body; therefore, the orientation of a cell determines the direction in which it migrates. 37 We evaluated the SC orientation on the different-sized microgrooved surfaces, quantified the cell orientation angle after 6 days of culture, and calculated the ratios of cells that aligned in the channel direction. Figure 6 shows a comparison of the ratio of aligned cells on the different-sized microgrooved channels and found that the ratio of aligned cells on the 50 μm channel surface is significantly higher than those on the 100 and 150 μm surfaces, with the ratio on the 100 μm also being significantly higher than that on the 150 μm microgrooved channel. Thus, the cell alignment on the microgrooved surface exhibits a similar trend to the cell migration speed, that is, both are the greatest on the smallest-sized microgrooved channel.
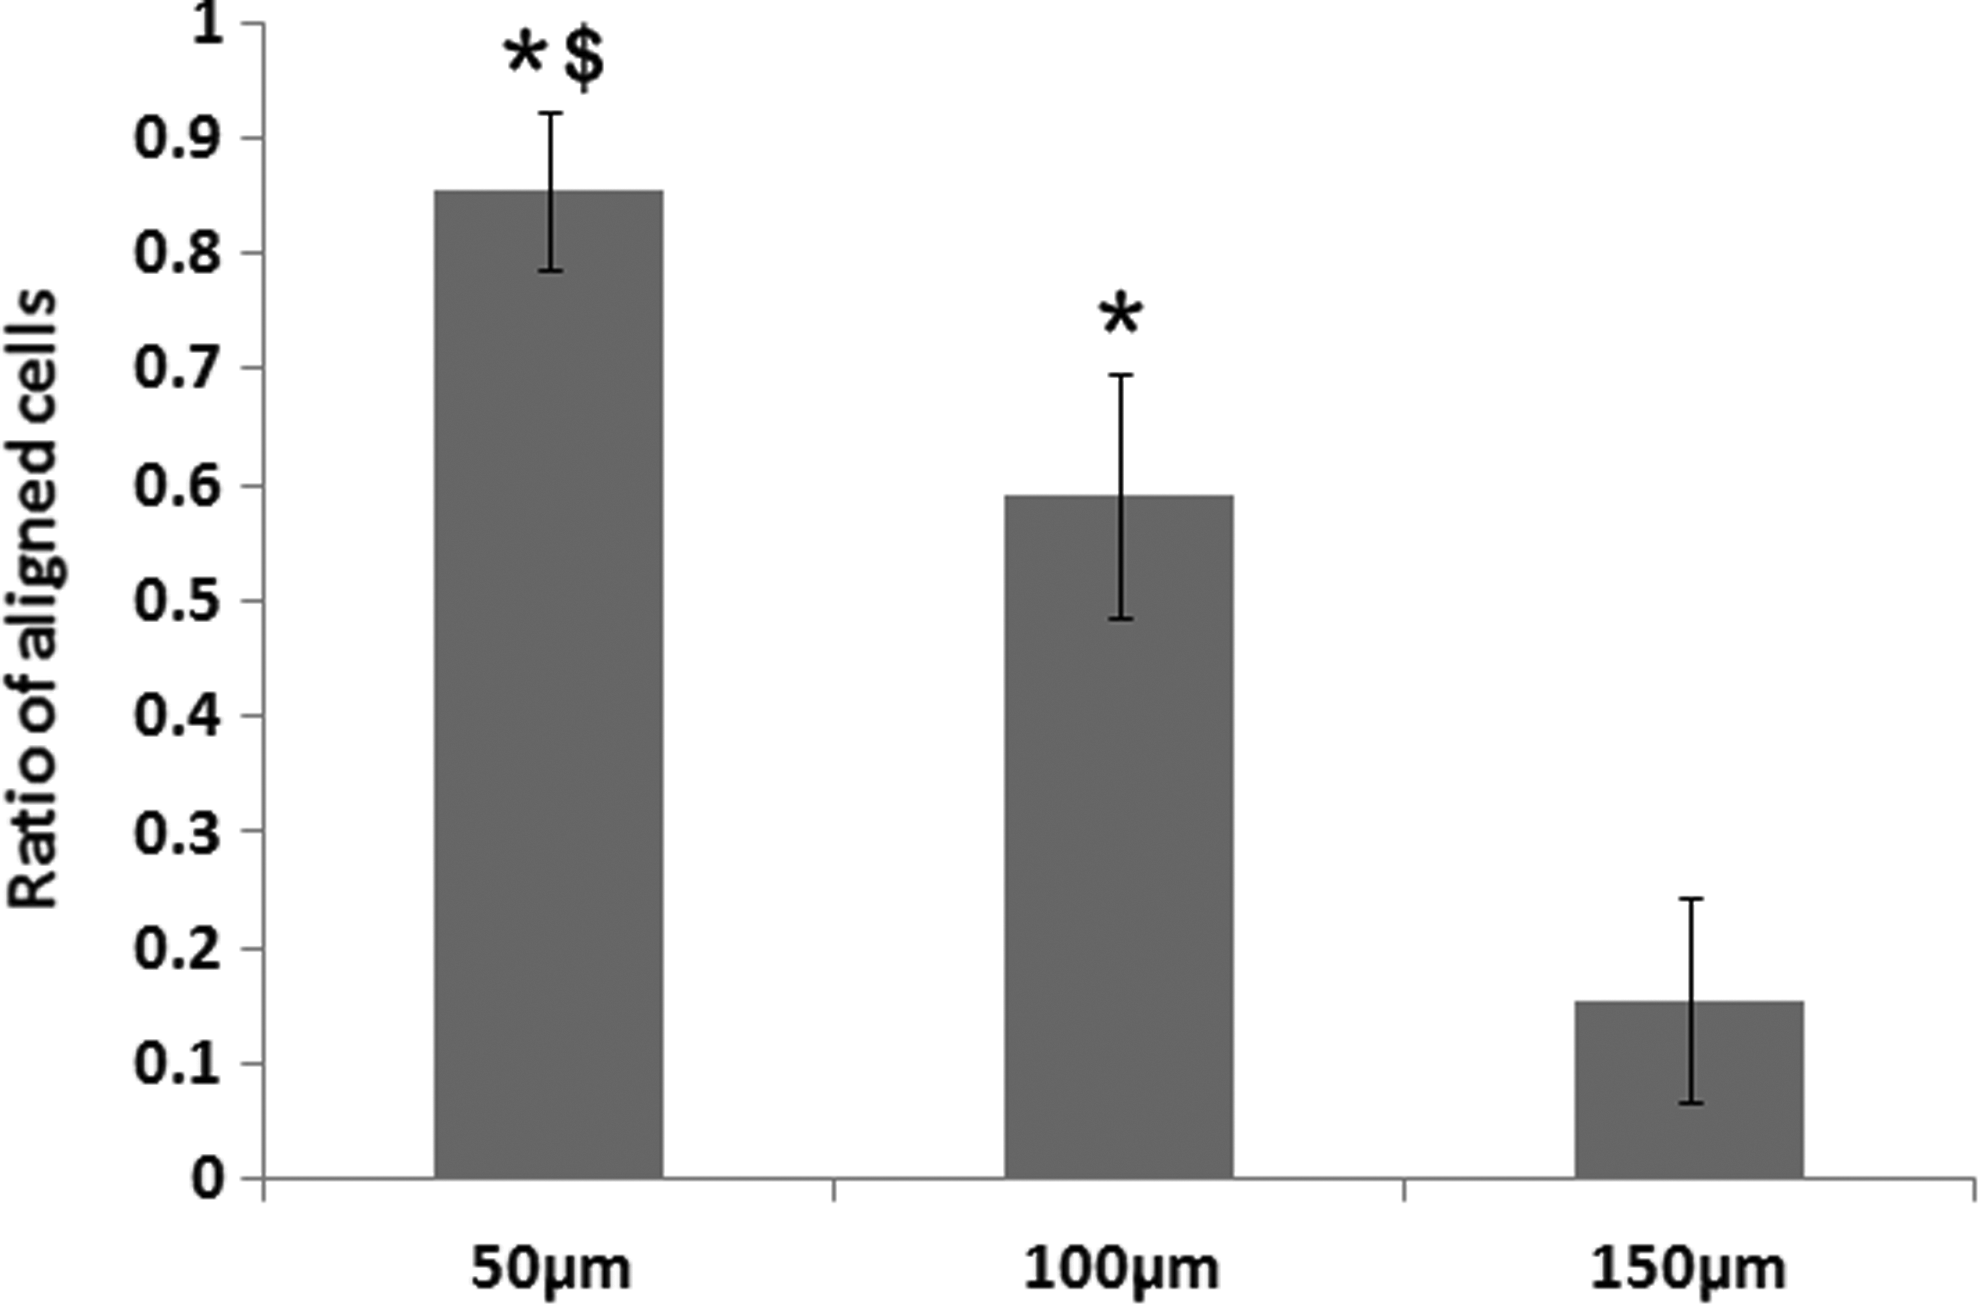
Comparison of SC alignment in the different-sized channels. The orientation angles of the cells are measured after 6 days of culture on the different-sized channels. The ratios of aligned cells (within a range of 180° ± 10°) are plotted for the different-sized channels. * < 0.05 when compared to the 150 μm channels; $ < 0.05 when compared to the 100 μm channels. (N = 5).
It was demonstrated that cytoskeletal filaments and focal adhesions align along the edges of subcellular grooves, 38 which was explained by the contact guidance that resulted from the mechanical stresses created through cell adhesion.39,40 Studies have shown that actin microfilaments and microtubules align parallel to subcellular-sized grooves on surfaces.41–43 Although cell alignment on subcellular-sized grooved surfaces has been investigated, none to date have explored the motility of cells on microgrooved substrates with dimensions larger than the cell body, that is, sizes close to the dimensions of channels in transplantable scaffolds, until this study.
Conclusion
This study investigated and quantified the cell alignment and migration on large-scale anisotropic topography over a period of weeks. Two strategies were used to calculate the velocity of the migrating SC population. Both methods aimed at minimizing the confounding effects due to cell proliferation, and showed similar trends, that is, the SC population migrated the fastest on the smallest-sized microgrooved surface. The results of the SC migration presented in this study provide insights that could inform on future designs of transplantable tissue scaffolds.
Footnotes
Acknowledgments
This study was supported in part by the National Science Foundation (CBET 1547518 and CBET 1510895) and the National Institutes of Health (R21CA176854 and R01EB014986). The authors thank Dr. Melinda Frame from the Center for Advanced Microscopy at Michigan State University for help with confocal microscopy imaging. They also thank Dr. Xiaopeng Bi for the assistance with the photolithography at Michigan State University.
Disclosure Statement
No competing financial interests exist.
References
Supplementary Material
Please find the following supplemental material available below.
For Open Access articles published under a Creative Commons License, all supplemental material carries the same license as the article it is associated with.
For non-Open Access articles published, all supplemental material carries a non-exclusive license, and permission requests for re-use of supplemental material or any part of supplemental material shall be sent directly to the copyright owner as specified in the copyright notice associated with the article.