
Abstract
Tissue scaffolds with living cells fabricated by three-dimensional bioprinting/plotting techniques are becoming more prevalent in tissue repair and regeneration. In the bioprinting process, cells are subject to process-induced forces (such as shear force) that can result in cell damage and loss of cell function. The flow behavior of the biomaterial solutions that encapsulate living cells in this process plays an important role. This study used a rheometer to examine the flow behavior of alginate solution and alginate–Schwann cell (RSC96), alginate–fibroblast cell (NIH-3T3), and alginate–skeletal muscle cell (L8) suspensions during shearing with respect to effects on cell viability and proliferation. The flow behavior of all the alginate–cell suspensions varied with alginate concentration and cell density and had a significant influence on the viability and proliferation of the cells once sheared as well as on the recovery of the sheared cells. These findings provide a mean to preserve cell viability and/or retain cell proliferation function in the bioprinting process by regulating the flow behavior of cell–biomaterial suspensions and process parameters.
Introduction
B
In the bioprinting process, the biomaterials selected for cell encapsulation facilitate the transport of necessary nutrients without causing an immunoreaction from the host after implantation. 28 However, encapsulating cells into biomaterials in the bioprinting process is challenging because the cells are subjected to process-induced forces, such as shear force, that may cause cell damage and thus loss of cell functions. 29 Billiet et al. reported that printing pressure and needle geometry used in a cell-laden scaffold fabrication process play important roles in the viability of blended cells (hepatocarcinoma cells) because both factors affect the shear stress induced as well as the period that cells are exposed to shearing (i.e., the exposure time). 30 They also noticed that the density of blended cells affects the apparent viscosity of the medium but unfortunately were not able to quantitatively examine the relationship between shear stress/exposure time and cell viability or the influence of cell density on cell viability. While previous investigations show that cell damage occurring in printing/plotting depends on cell manipulation parameters, temperature, and needle geometry,31–33 a comprehensive investigation into cell viability and proliferation as well as their correlation to the flow behavior of biomaterial solutions has yet to be conducted.
Process-induced forces that cells experience in bioprinting cause the deformation of the cell structure and, as a result, can rupture the cell membrane or cytoskeleton if the forces and/or exposure time exceeds certain thresholds. 34 Following bioprinting, some cells have the ability to recover from the damage caused by process-induced forces.35,36 However, most investigations have focused on cell survival in the bioprinting process,37–39 with few reports on cell recovery thereafter. In addition, the process-induced forces can affect cell growth or proliferation even after they are removed; this is of importance for the ensuing tissue repair and regeneration and highlights the need to investigate cell viability and proliferation subsequent to the bioprinting process.
This article presents a comprehensive study of cell viability and proliferation during and after the action of shear force that cells experience during bioprinting. Alginate was chosen as the biomaterial for cell encapsulation, and three different types of cells—Schwann cell line RSC96, fibroblast cell line NIH-3T3, and skeletal muscle cell line L8—were selected due to their common use in tissue engineering. Experiments to examine flow behavior were designed and conducted using alginate solutions of varying concentrations and featuring varying cell types and densities. Experiments aimed at examining the effects of shear force on cell damage were also carried out, with the percent cell damage measured and quantified as a function of shear stress, exposure time, and cell density. Cells from both sheared and nonsheared suspensions were cultured, and their ability to recover and proliferate over a 48-h time frame was evaluated. The results of this study inform methodologies for regulating the flow behavior of biomaterial solutions to preserve cell viability and/or retain cell function during and after the bioprinting process.
Materials and Methods
Cell culture
The Schwann cell line (RSC96), fibroblast cell line (NIH-3T3), and skeletal muscle cell line (L8) purchased from the American Type Culture Collection were maintained in a humidified incubator at 37°C, with a 5% CO2 atmosphere and standard Dulbecco's modified Eagle's medium (DMEM; Sigma-Aldrich) supplemented with 10% fetal bovine serum (FBS; Gibco, Life Technologies) for culturing.
Materials
Sodium alginate of medium viscosity (Alginic acid sodium salt from brown algae, A2033; Sigma-Aldrich) was thoroughly dissolved in calcium-free DMEM (Gibco, Thermo Fisher Scientific) to create a 4.0% w/v alginate stock solution for the flow behavior tests. To prepare alginate solutions for the cell recovery tests, sodium alginate was first dissolved in deionized water to form a 0.2% w/v solution. A 0.22-μm bottle-top filter (Thermo Scientific) was used to sterilize the alginate solution. The filtered medium was then removed to a −40°C freezer for 24 h and later freeze-dried (FreeZone Freeze Dryer; Labconco) under sterile conditions for 72 h. The freeze-dried alginate was dissolved again in calcium-free DMEM with 1.0% antibiotic (penicillin 100x; Sigma-Aldrich) to achieve a 2.5% w/v alginate stock solution. MTT [3-(4,5-dimethylthiazol-2-yl)-2,5-diphenyltetrazolium bromide] powder purchased from Sigma-Aldrich was dissolved and filter sterilized to obtain a 5 mg/mL solution in 10 mM PBS. Calcein AM, propidium iodide (PI), and Hoechst stain were purchased from AnaSpec. Trypan blue was purchased from Sigma-Aldrich.
Characterization of flow behavior
Influence of alginate concentration and temperature on flow behavior
Alginate solution flow behavior was characterized on a rheometer with a cone-and-plate geometry and a CP-41 spindle (RVDV-III; Brookfield) (Fig. 1A). For each test, 2 mL alginate solution of various concentrations (1.0%, 2.0%, 3.0%, and 4.0% w/v) was loaded into the gap between the cone and plate (Fig. 1B). During the shear process, the cone is programmed to rotate at preset speeds, and the shear stress applied to the sample is recorded. To evaluate the influence of temperature on the flow behavior, shearing experiments for all alginate solutions were conducted at temperatures of 15°C, 20°C, 25°C, 30°C, 35°C, and 40°C controlled using a water bath (TC-102 calculating water bath; Brookfield). For each condition, five samples were sheared, and the average thereof is reported herein.

Schematic of rheometer.
Influence of cell densities on flow behavior
RSC96, NIH-3T3, and L8 cells were each mixed by a pipette with a 1.0% alginate solution to obtain uniform cell suspensions with cell densities of 5 × 10⁵, 1 × 10⁶, 5 × 10⁶, and 1 × 10⁷ cells/mL. Before this step, detached cells in a 50-mL plastic tube were centrifuged for 5 min, and the standard DMEM with 10% FBS was then replaced by calcium-free DMEM so as to avoid gelation of alginate by calcium ions. A 2 mL alginate–cell suspension was loaded into the rheometer to test the flow behavior at different shear rates. For all three kinds of cells, the experiment for each cell density was repeated five times at room temperature.
Characterization of cell damage under shearing
Influence of alginate concentration on cell damage
For shearing, 2 mL cell–alginate mixtures with a cell density of 1 × 10⁶ cells/mL were loaded into the rheometer, which was rotated at a speed of 40 rpm. Cell suspensions with varying alginate concentrations (1.0%, 1.5%, 2.0%, and 2.5% w/v) were sheared for 10 s at room temperature (∼21°C), and the cell viability was examined. To ensure a sterile experimental environment, the rheometer was placed underneath a hood that had been cleaned three times with 70% ethanol. The parts of the rheometer to be in immediate contact with cells, including the plate and cone, were immersed in 70% ethanol for 10 min and then dried for more than 15 min in the hood before use. To examine cell damage, 100 μL cell suspension after shearing was transferred to a plate; 30 μL 0.2% Trypan blue (a dye used to stain damaged cells) was added, and the number of damaged or dead cells was then counted and recorded with the help of an optical microscope (Leica Microsystems). The examination of cell damage was repeated on five cell suspension samples sheared by the rheometer. As a positive control, a group of cell–alginate suspensions were retained in tubes and not sheared. The difference in cell damage (calculated as a percent) between the sheared and control groups was attributed to the corresponding shear stress.
Influence of exposure time on cell damage
A 2% cell–alginate suspension with a cell density of 1 × 10⁶ cells/mL was loaded into the rheometer, which was set at a speed of 40 rpm. Shearing periods of 10, 30, 60, and 120 s were examined to evaluate the influence of exposure time on cell damage. The same procedure using Trypan blue and a microscope as described above was conducted for cell damage examination. Each test was repeated five times for each of the three cell types.
Influence of cell density on cell damage
2.0% alginate–cell suspensions with cell density of 5 × 10⁵, 1 × 10⁶, 5 × 10⁶, or 1 × 10⁷ cells/mL were prepared using a pipette to ensure a homogeneous distribution of cells. For each test, a 2 mL cell suspension was delivered to the rheometer, which was set at a speed of 40 rpm for suspensions with a low cell density (5 × 10⁵ or 1 × 10⁶ cells/mL) and 45 rpm for suspensions with a high cell density (5 × 10⁶ or 1 × 10⁷ cells/mL). This test was repeated five times for each cell density.
Evaluation of cell recovery and proliferation after shearing
Live/dead assay for cell viability evaluation
To investigate the recovery of cells after experiencing shear force, a live/dead assay was performed to evaluate the viability of the three cell types 3, 6, and 48 h later after the removal of shear force. An alginate–cell suspension with a cell density of 1 × 10⁶ cells/mL was loaded into the rheometer and sheared at a speed of 40 rpm. After shearing, 100 μL cell suspension was transferred into a well of a 12-well plate to which 900 μL cell culture medium (calcium-free DMEM, 10% FBS, and 1% antibiotic) was then added. After placing the plate into a cell culture incubator for 3 h, a DMEM solution containing 0.5 μg/mL calcein AM and 25 μg/mL PI, which selectively stains live and dead cells, respectively, was added to the well. The plate was incubated for an additional 30 min at 37°C before examination using a fluorescent microscope (Carl Zeiss Axiovert 100). Both live and dead cell numbers were manually counted and analyzed using ImageJ (National Institutes of Health) from six images randomly taken from the cell suspension well, and the viability of cells was calculated as the percentage of live cells among the total cells. The same evaluation was conducted after 6 and 48 h. The shearing test and subsequent examination of cell viability were repeated three times. As a positive control, the cell viability of cell suspensions retained in the tube without shearing was examined. The recovered cell numbers were then obtained by comparing the observations made at different time points.
The influence of exposure time on viability and recovery of the three types of cells was subsequently examined. Alginate–cell suspensions with an alginate concentration of 2% and a density of 1 × 10⁶ cells/mL were sheared for a period of 60 or 120 s using the rheometer. The cell viability assay described above was used at 3, 6, and 48 h later upon removal of shear force. To investigate the effect of cell density, 2% alginate–cell suspensions with cell density of 1 × 10⁵ or 1 × 10⁷ cells/mL were sheared at either low speed (40 rpm) or high speed (45 rpm), respectively, for 60 s. Then, 10 μL high-cell density suspension and 200 μL low-cell density suspension were transferred into the 12-well plate, and the viability assay conducted as described above.
MTT assay for cell proliferation evaluation
The influence of shear force, exposure time, and cell density on the proliferation of cells was analyzed using an MTT assay. Suspensions of the three cell types were prepared as before and delivered into 12-well plates after being sheared in the rheometer. To determine the effect of shear force and exposure time on cell proliferation, 100 μL cell suspensions were pipetted into each well of the 12-well plate to which 700 μL cell culture medium (calcium-free DMEM with 10% FBS and 1% antibiotic) was then added. To determine the effect of cell density on cell proliferation, 10 μL high-density (1 × 10⁷ cells/mL) cell suspension or 200 μL low-density (5 × 10⁵ cells/mL) cell suspension was delivered into wells of the 12-well plate. Alginate–cell suspensions not subject to shear force were treated as positive controls, and alginate solutions with no cells were prepared as the negative control.
An MTT assay was performed to evaluate cell proliferation. Cell suspensions (including positive and negative controls) in the 12-well plates were treated with 80 μL MTT reagent (5 mg/mL) and incubated for 3 h at 37°C in a 5% CO2 atmosphere. The culture medium was then carefully removed and replaced by a dimethyl sulfoxide solution (800 μL per well) to dissolve the formazan precipitate. After incubating for another 15 min, the uniformly dissolved formazan precipitate medium was transferred to 96-well plates (100 μL per well) and read by a microplate reader (SpectraMax 190; Molecular Devices) at 555/650 nm at room temperature. Absorbance was read after 3, 6, and 48 h of incubation time. Each test was repeated three times for individual cell types.
Because MTT absorbance values can be significantly disturbed if alginate gels form in the medium, it is essential to eliminate the formation of alginate hydrogels before the MTT assay. A test used to examine the gelation of alginate triggered by FBS was conducted due to the minute amount of calcium ions present in the FBS. A 900 μL pure FBS solution was delivered into a microtube that contained 100 μL 2.5% alginate solution. Alginate gelation was examined after 30 min, 2 h, and 24 h of uniform mixing at room temperature. Three microtubes were prepared to ensure the reliability of the result.
Hoechst/PI staining for cell viability and proliferation evaluations
Hoechst/PI staining for cell viability and proliferation evaluations was also performed to verify the recovery ability of cells after experiencing shear force. Fluorescent Hoechst and PI dyes were used to selectively stain live and dead cells (Hoechst) and dead cells only (PI). Solutions, including alginate–NIH-3T3 suspensions with a fixed cell density (1 × 10⁶ cells/mL) but different alginate concentrations (1.5% and 2.5%), 2% alginate–L8 suspensions with a fixed cell density (1 × 10⁶ cells/mL), and 2% alginate–RSC96 suspensions with varying cell densities (5 × 10⁵ and 1 × 10⁷ cells/mL), were prepared and sheared using the rheometer. Cell suspensions were then cultured in 96-well plates (special plates for fluorescent plate reader, 100 μL per well) in an incubator after the shear force was removed. Before observation, cells were stained using Hoechst (1 μg/mL) and PI (25 μg/mL) for 20 min in the incubator, and the culture medium with fluorescent dyes was then transferred into microtubes to centrifuge for 10 min at 800 rpm. After aspirating the old medium and adding fresh DMEM to the microtubes, the retained cells (including live and dead cells) were delivered back to the same 96-well plates with 100 μL per well. The fluorescent absorbance was obtained at an excitation/emission wavelength of 355/460 nm for Hoechst and 520/617 nm for PI using a fluorescent microplate reader (SpectraMax M2e; Molecular Devices) after the cells were cultured for 3, 6, and 48 h. This entire evaluation was conducted three times.
Statistical analysis
Mean values and standard error of the mean of all data were calculated. Statistical significance was determined by ordinary one-way analysis of variance, and multiple comparisons were performed using Tukey's test and GraphPad Prism (GraphPad Software) with an acceptable significance level of p < 0.05.
Results
Figure 2 illustrates the effect of temperature and alginate concentration on measured shear stresses applied to an alginate solution. The shear stress decreases with temperature for all alginate concentrations, which suggests the alginate solution becomes less viscous as the temperature increases. The shear stress also increases with alginate concentration for any given temperature, which suggests the alginate solution becomes more viscous as the alginate concentration increases. The 3% and 4% alginate solutions were observed during these experiments to be much more viscous than the 1% and 2% solutions. Due to limits in the shear stress that could be measured by the rheometer, shearing experiments were performed at a lower shear rate of 5 s−1 for 3% and 4% solutions (Fig. 2A) and a higher shear rate of 100 s−1 for 1% and 2% solutions (Fig. 2B).
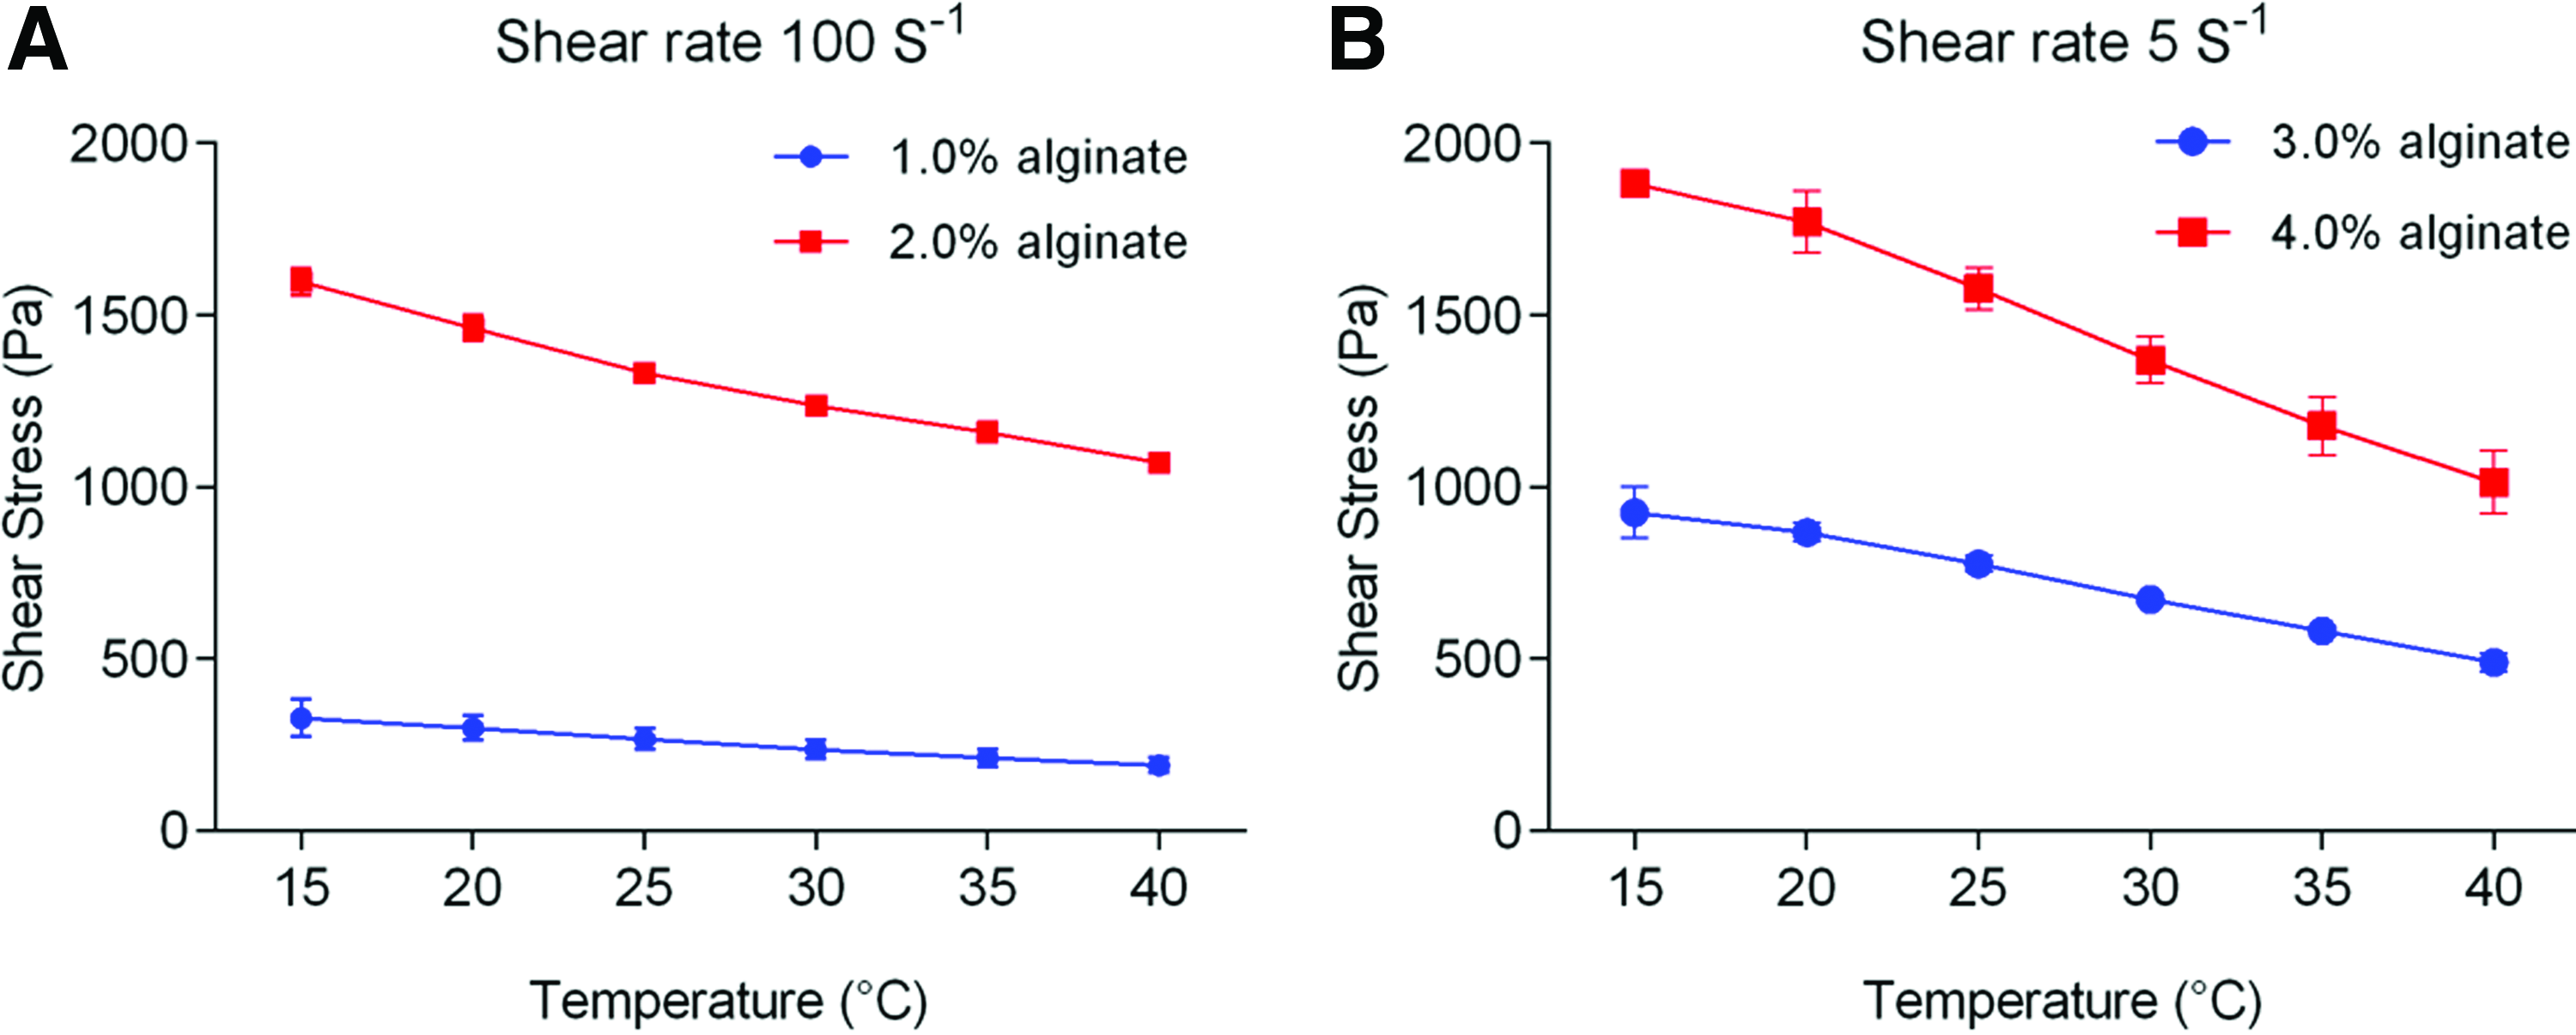
Influence of temperature and alginate concentration on flow behavior of alginate solution.
Figure 3 depicts the influence of cell density on the flow behavior of 1% alginate solutions mixed with three kinds of cells. Similar to the alginate-only solution, the alginate–cell suspensions responded to shear in a nonlinear manner. The solution without cells experienced the highest shear stress compared to the alginate–cell suspensions for the same shear rate. As cell density increased, the shear stress decreased, and the change in shear stress depended on both the type of cells and the number of cells added. At a shear rate of 400 s−1, for example, the shear stress was reduced by 7.73%, 6.19%, and 10.83%, with the addition of 5 × 10⁵ RSC96 (Fig. 3A), L8 (Fig. 3B), and NIH-3T3 (Fig. 3C) cells/mL, respectively, compared to the solutions without cells. If the cell density increased to 1 × 10⁷ cells/mL, the shear stress was reduced by 36.21% for RSC96 cells, 40.08% for NIH-3T3, and 32.35% for L8 cells.
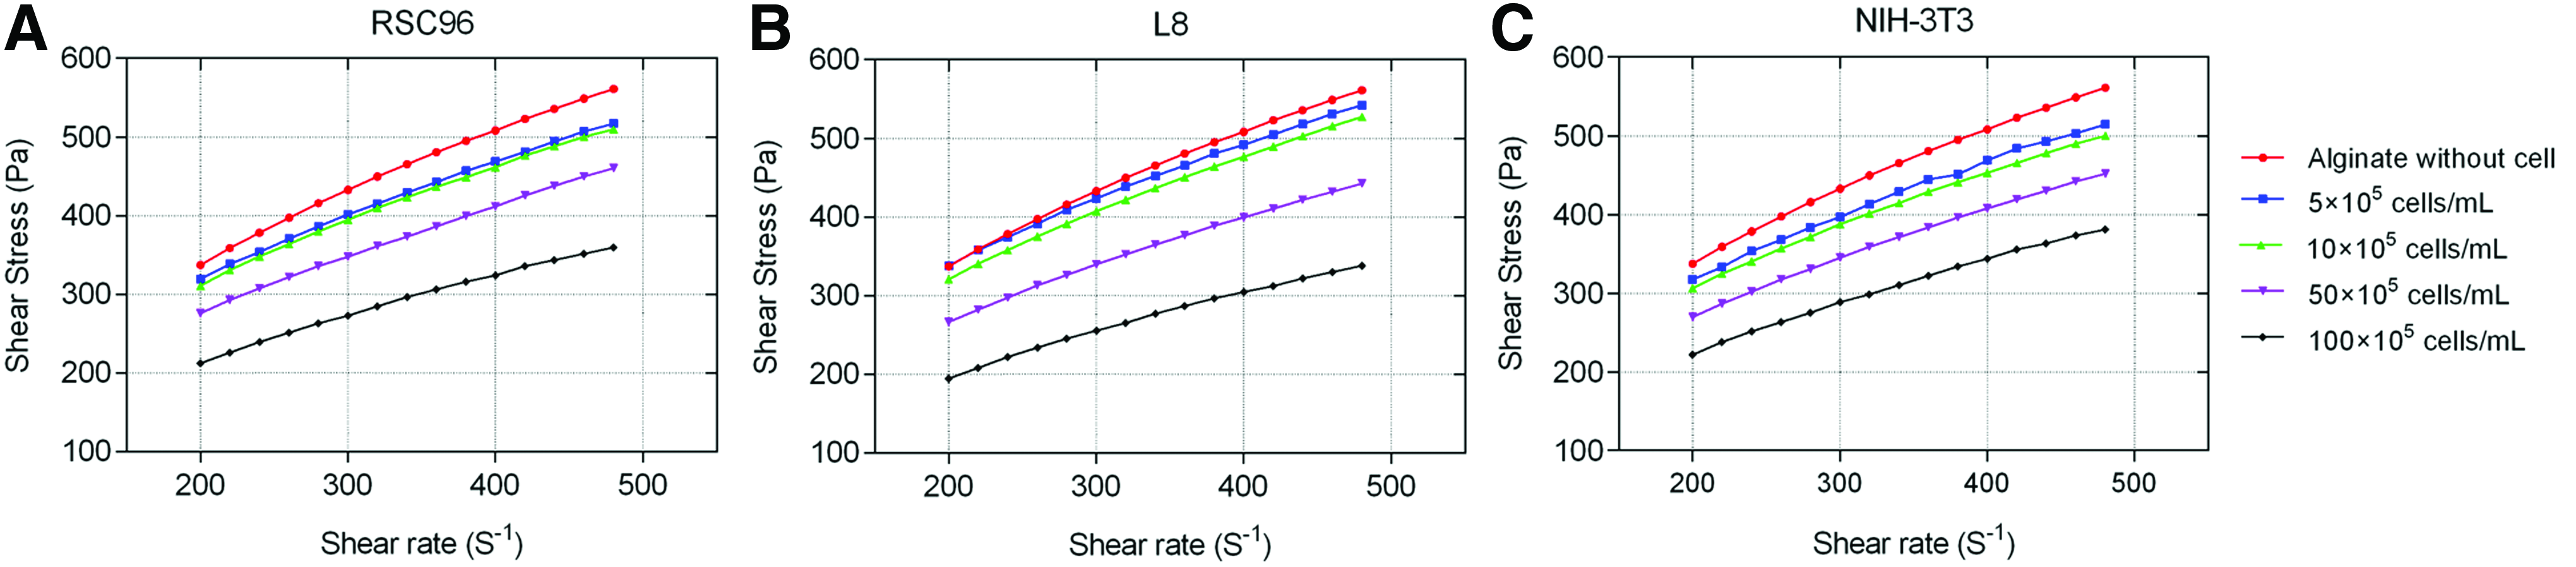
Influence of cell type and density on flow behavior of alginate–cell suspension.
Figure 4 shows the cell damage measured after cells were exposed to varying shear stresses for 10 s. For all cell types, the damage not surprisingly worsened as the shear stress increased. For example, Figure 4A shows that 4.89% ± 0.89% and 5.21% ± 0.74% of RSC96 cells were damaged after being sheared at 300 Pa (1.0% alginate solution) and 600 Pa (1.5% alginate solution), respectively; these percentages increased to 10.73% ± 0.80% and 21.36% ± 2.39% for shear stresses of 1100 Pa (2.0% alginate solution) and 1700 Pa (2.5% alginate solution), respectively. The same cell damage trends were also observed for L8 and NIH-3T3 cells (Fig. 4B, C). Low levels of damage (2.62% ± 0.30% for L8 and 2.94% ± 1.26% for NIH-3T3) were induced by a low shear stress of 300 Pa (1.0% alginate solution) but increased with the shear stress applied. For a shear stress of 1700 Pa (2.5% alginate solution), the percent cell damage rose to 13.87% ± 1.65% and 14.10% ± 2.79% for L8 and NIH-3T3 cells, respectively, both of which are lower than corresponding data for RSC96 cells.
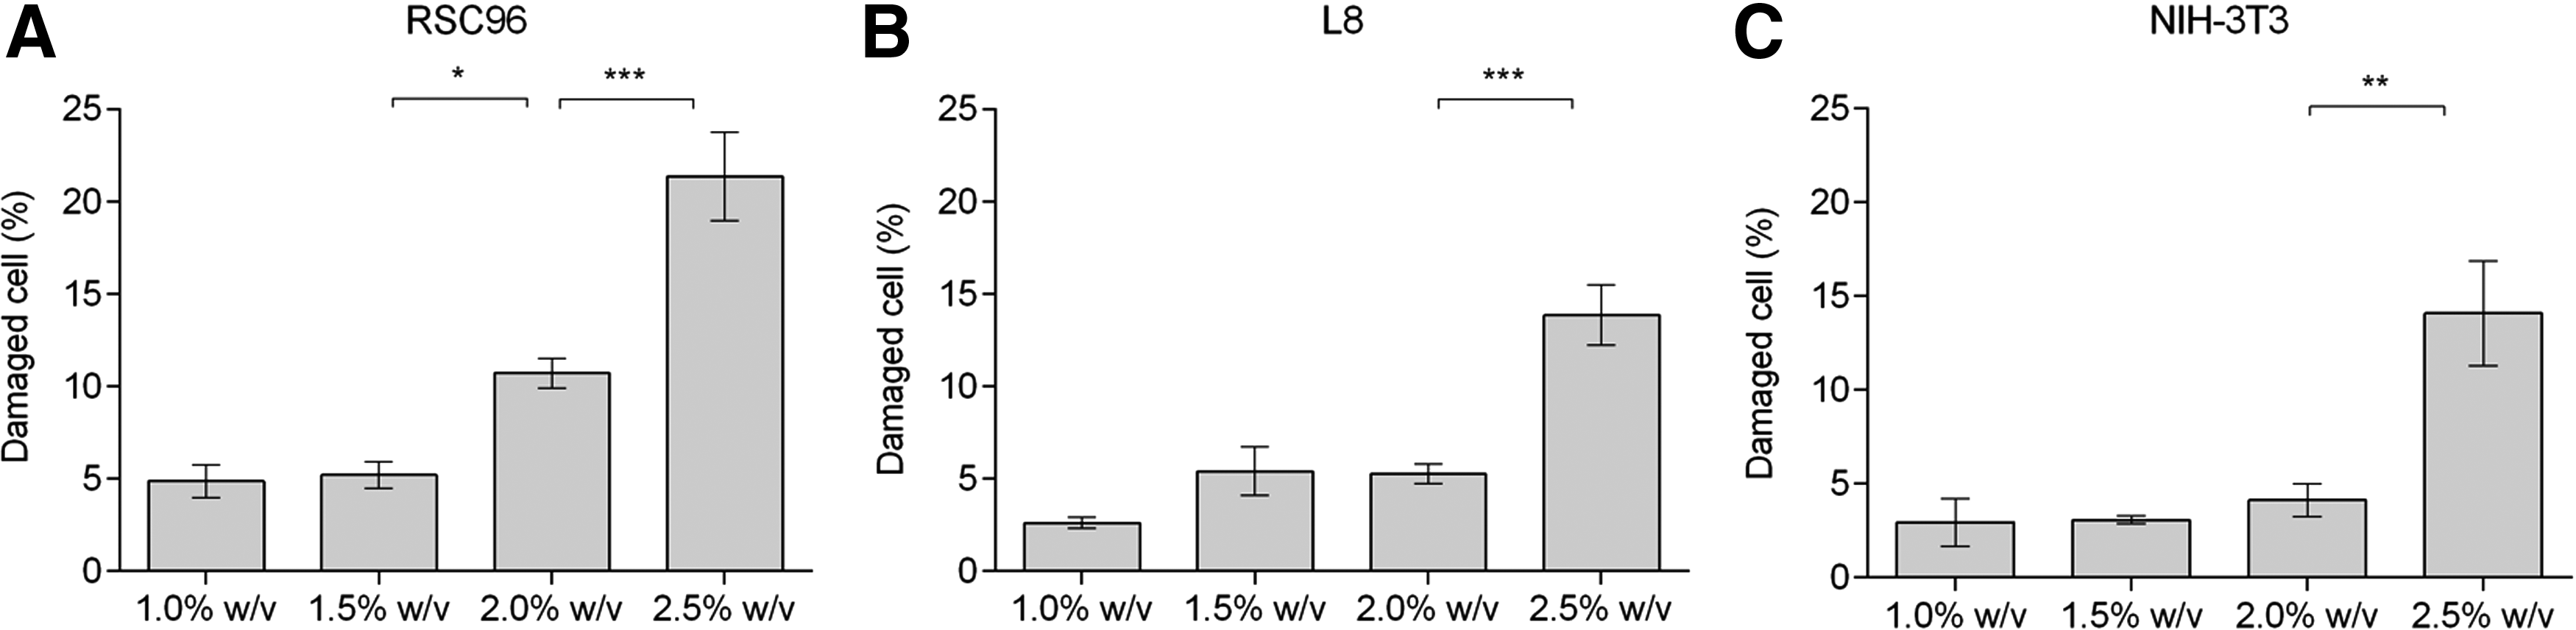
Percentage of damaged cells in alginate–cell suspension at varying shear stresses from 300 to 1700 Pa.
Figure 5 exhibits the effects of shear period on cell damage for the three cell types. It is clear from figures that the number of damaged cells increased with shear time. In Figure 5A, for example, the percent damaged RSC96 cells slowly increased from 10.73% ± 0.80% to 12.64% ± 1.01% as the shear period extended from 10 to 60 s and then rapidly increased to 28.50% ± 1.63% after cells were exposed to shear stress for 120 s. Damage to NIH-3T3 cells (Fig. 5C) follows a similar trend and reached 25.97% ± 0.29% after being sheared for 120 s. In contrast, damage to L8 cells increased slowly and steadily as the shear period increased to 120 s (Fig. 5B), with a consequent lower percent damaged cells (15.76% ± 2.15%) than observed for either RSC96 or NIH-3T3 cells.
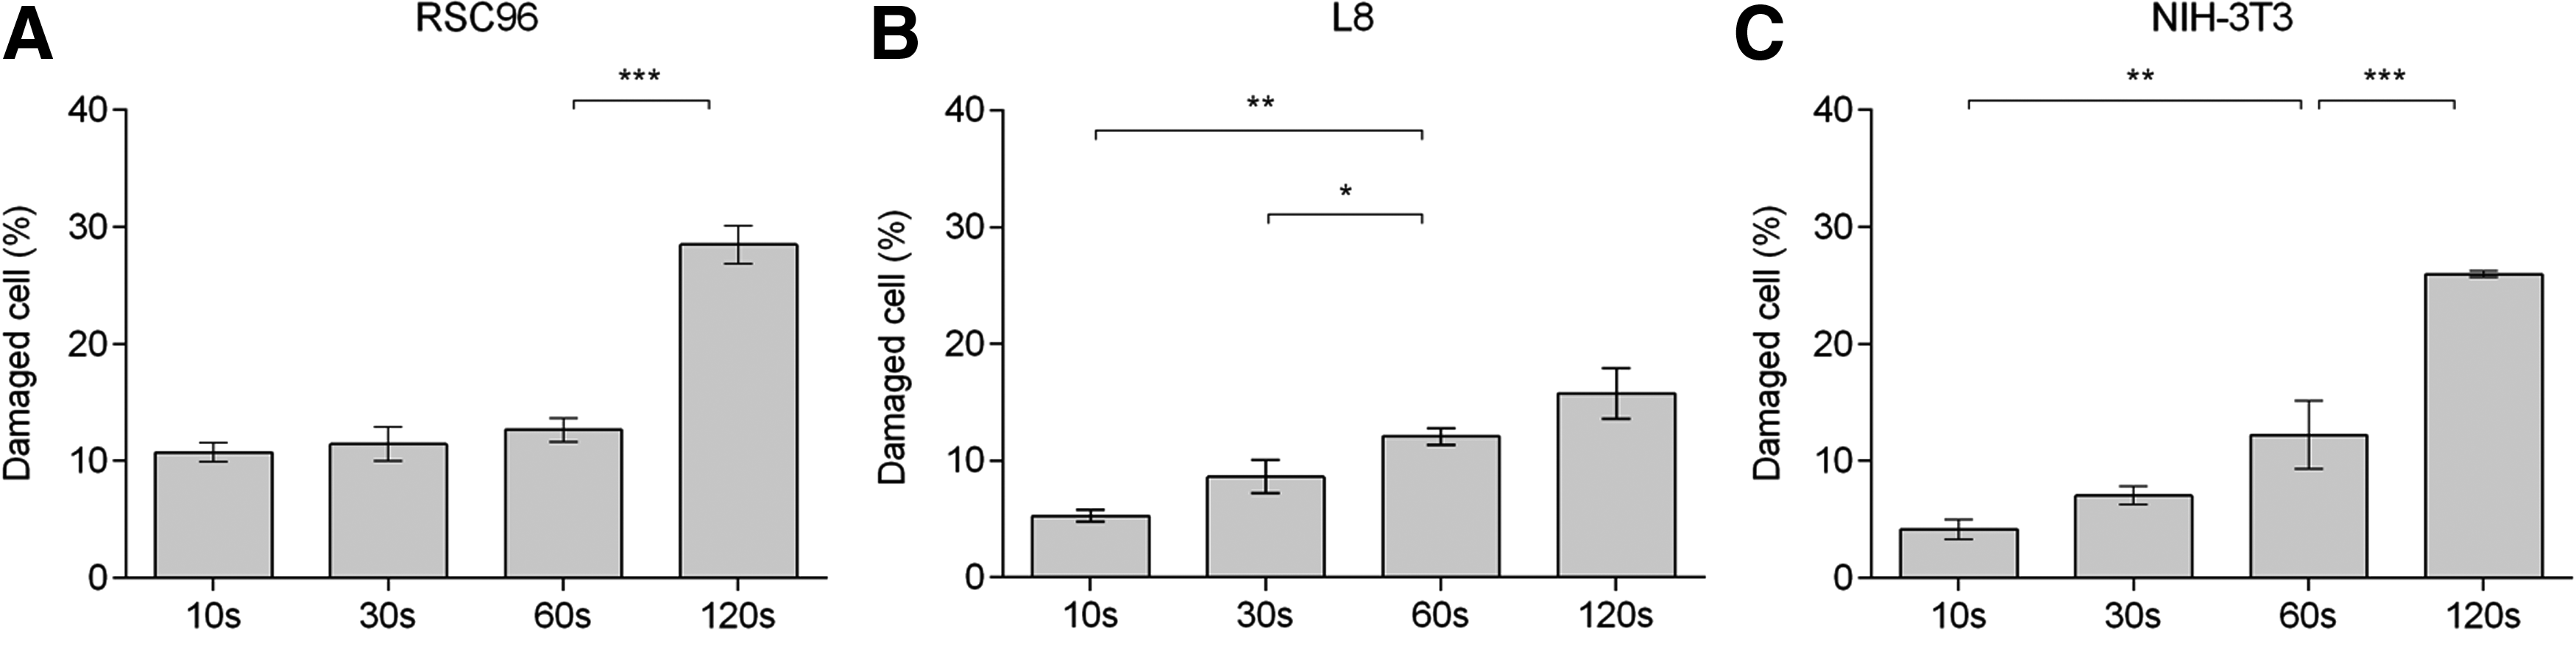
Percentage of damaged cells in alginate–cell suspension at varying shear times.
Figure 6 shows the effect of cell density on cell damage after the shearing process. Overall, cell damage for the three cell types for a fixed shear period declined as cell density increased. Figure 6A and C shows that 12.21% ± 1.94% and 12.64% ± 1.01% of RSC96 cells were damaged and 12.59% ± 2.81% and 12.20% ± 2.91% of NIH-3T3 cells were damaged at densities of 5 × 10⁵ and 1 × 10⁶ cells/mL, respectively. The L8 cell damage rate was higher (18.67% ± 3.09%; Fig. 6B) for the low-cell density cell suspension (5 × 10⁵ cells/mL). Notably, the percent damage for all cell types decreased when cell densities increased to 1 × 10⁷ cells/mL at 4.03% ± 1.22%, 4.82% ± 0.86%, and 4.62% ± 0.76% for RSC96, L8, and NIH-3T3 cells, respectively.
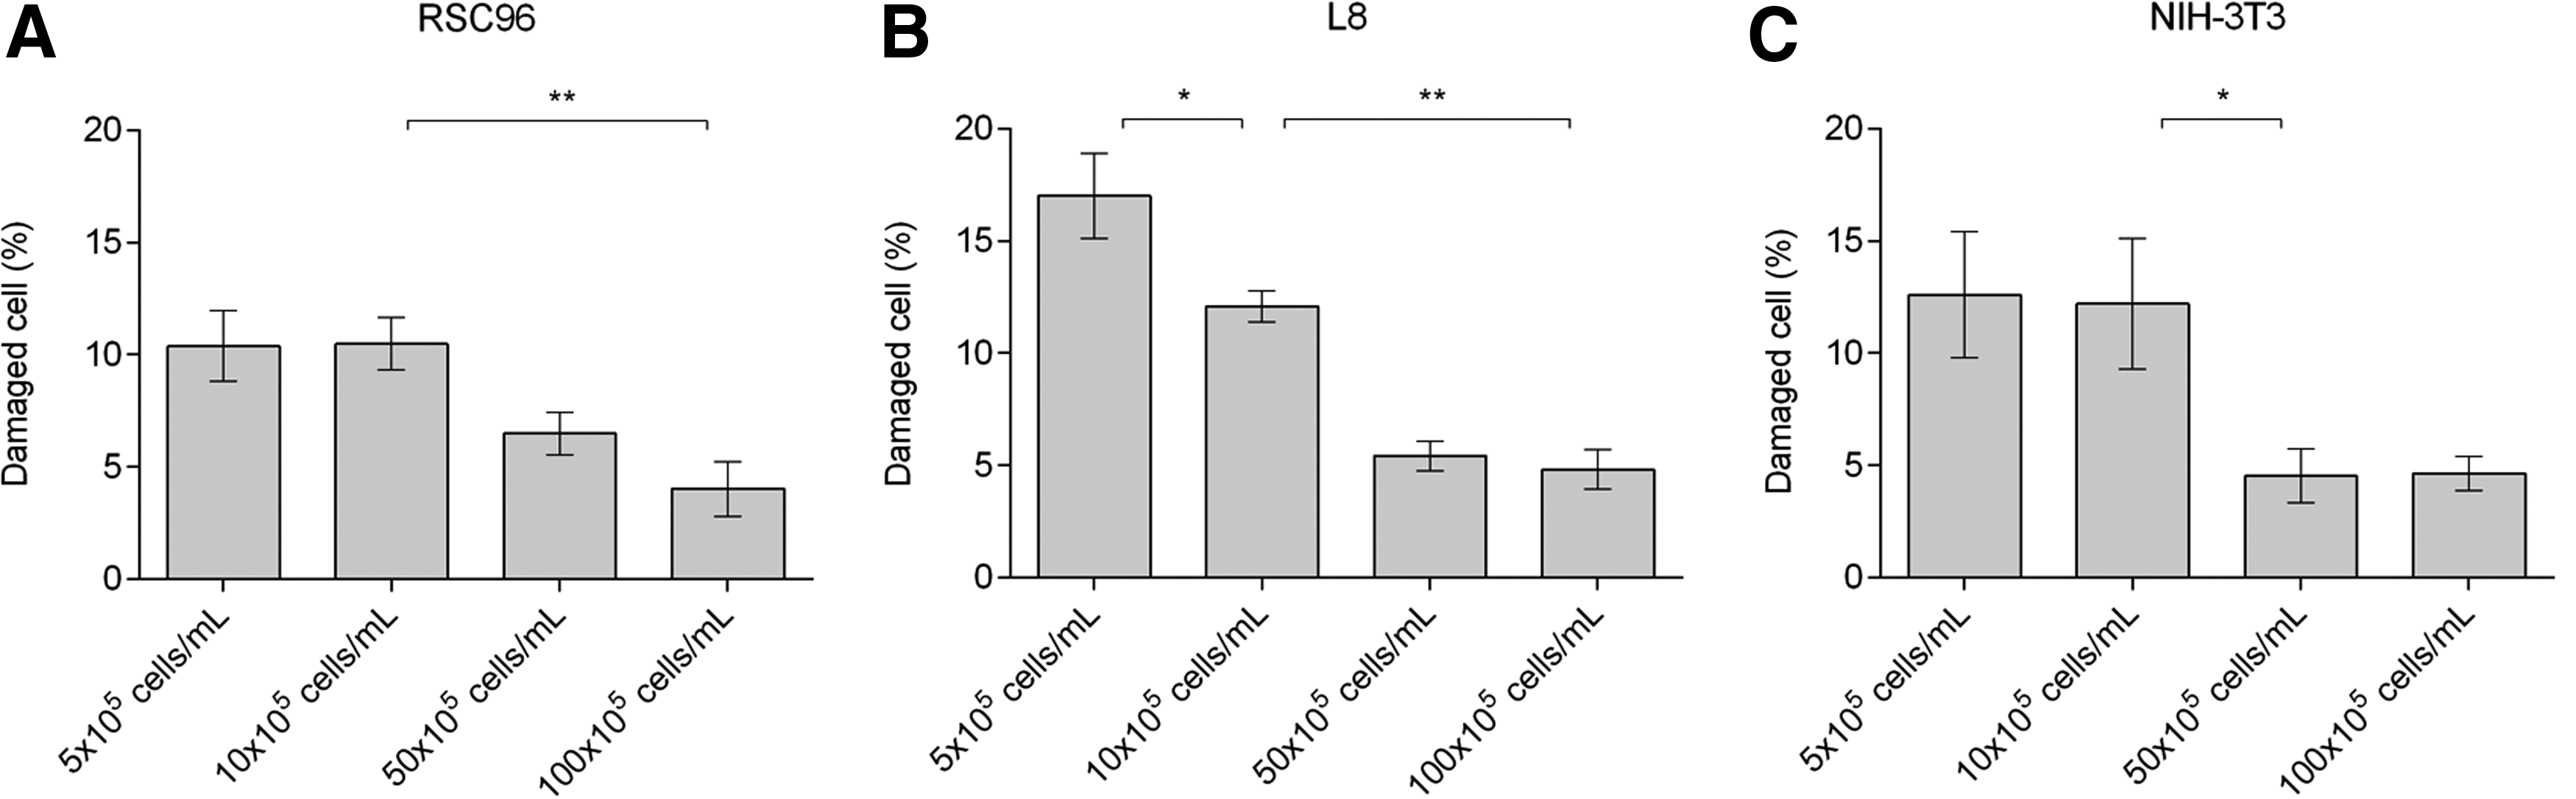
Percentage of damaged cells in alginate–cell suspension affected by cell density.
Microscopic observations of live and dead cells at 3, 6, and 48 h for the three tested cell types indicate that greater cell death was induced by higher shear stress (Fig. 7A–C), longer exposure time (Fig. 7D–F), and lower cell density (Fig. 7G–I). After the cells were sheared at controlled shear stresses of 600 Pa (1.5% alginate) or 1700 Pa (2.5% alginate), cell viabilities for NIH-3T3 cells (Fig. 7J) were 93.29% ± 1.37% and 82.99% ± 1.85% after 3 h and 95.50% ± 1.37% and 87.71% ± 3.64% after 48 h, respectively. The comparable viabilities of L8 cells (Fig. 7K) were 91.27% ± 1.83% and 81.27% ± 3.09% after 3 h and 95.42% ± 0.60% and 89.45% ± 1.82% after 48 h. Figure 7L shows the effect of cell density on the viability of RSC96 cells. Cell viability values were 93.82% ± 1.62% (1 × 10⁷ cells/mL) and 87.03% ± 2.75% (5 × 10⁵ cells/mL) after 3 h but, as observed for the other two cell types, increased to 95.19% ± 1.26% and 91.11% ± 2.24% after 48 h. There is very little change in cell viability for all cell types between 3 and 6 h of culture time, which suggests that only a few cells die during this period.
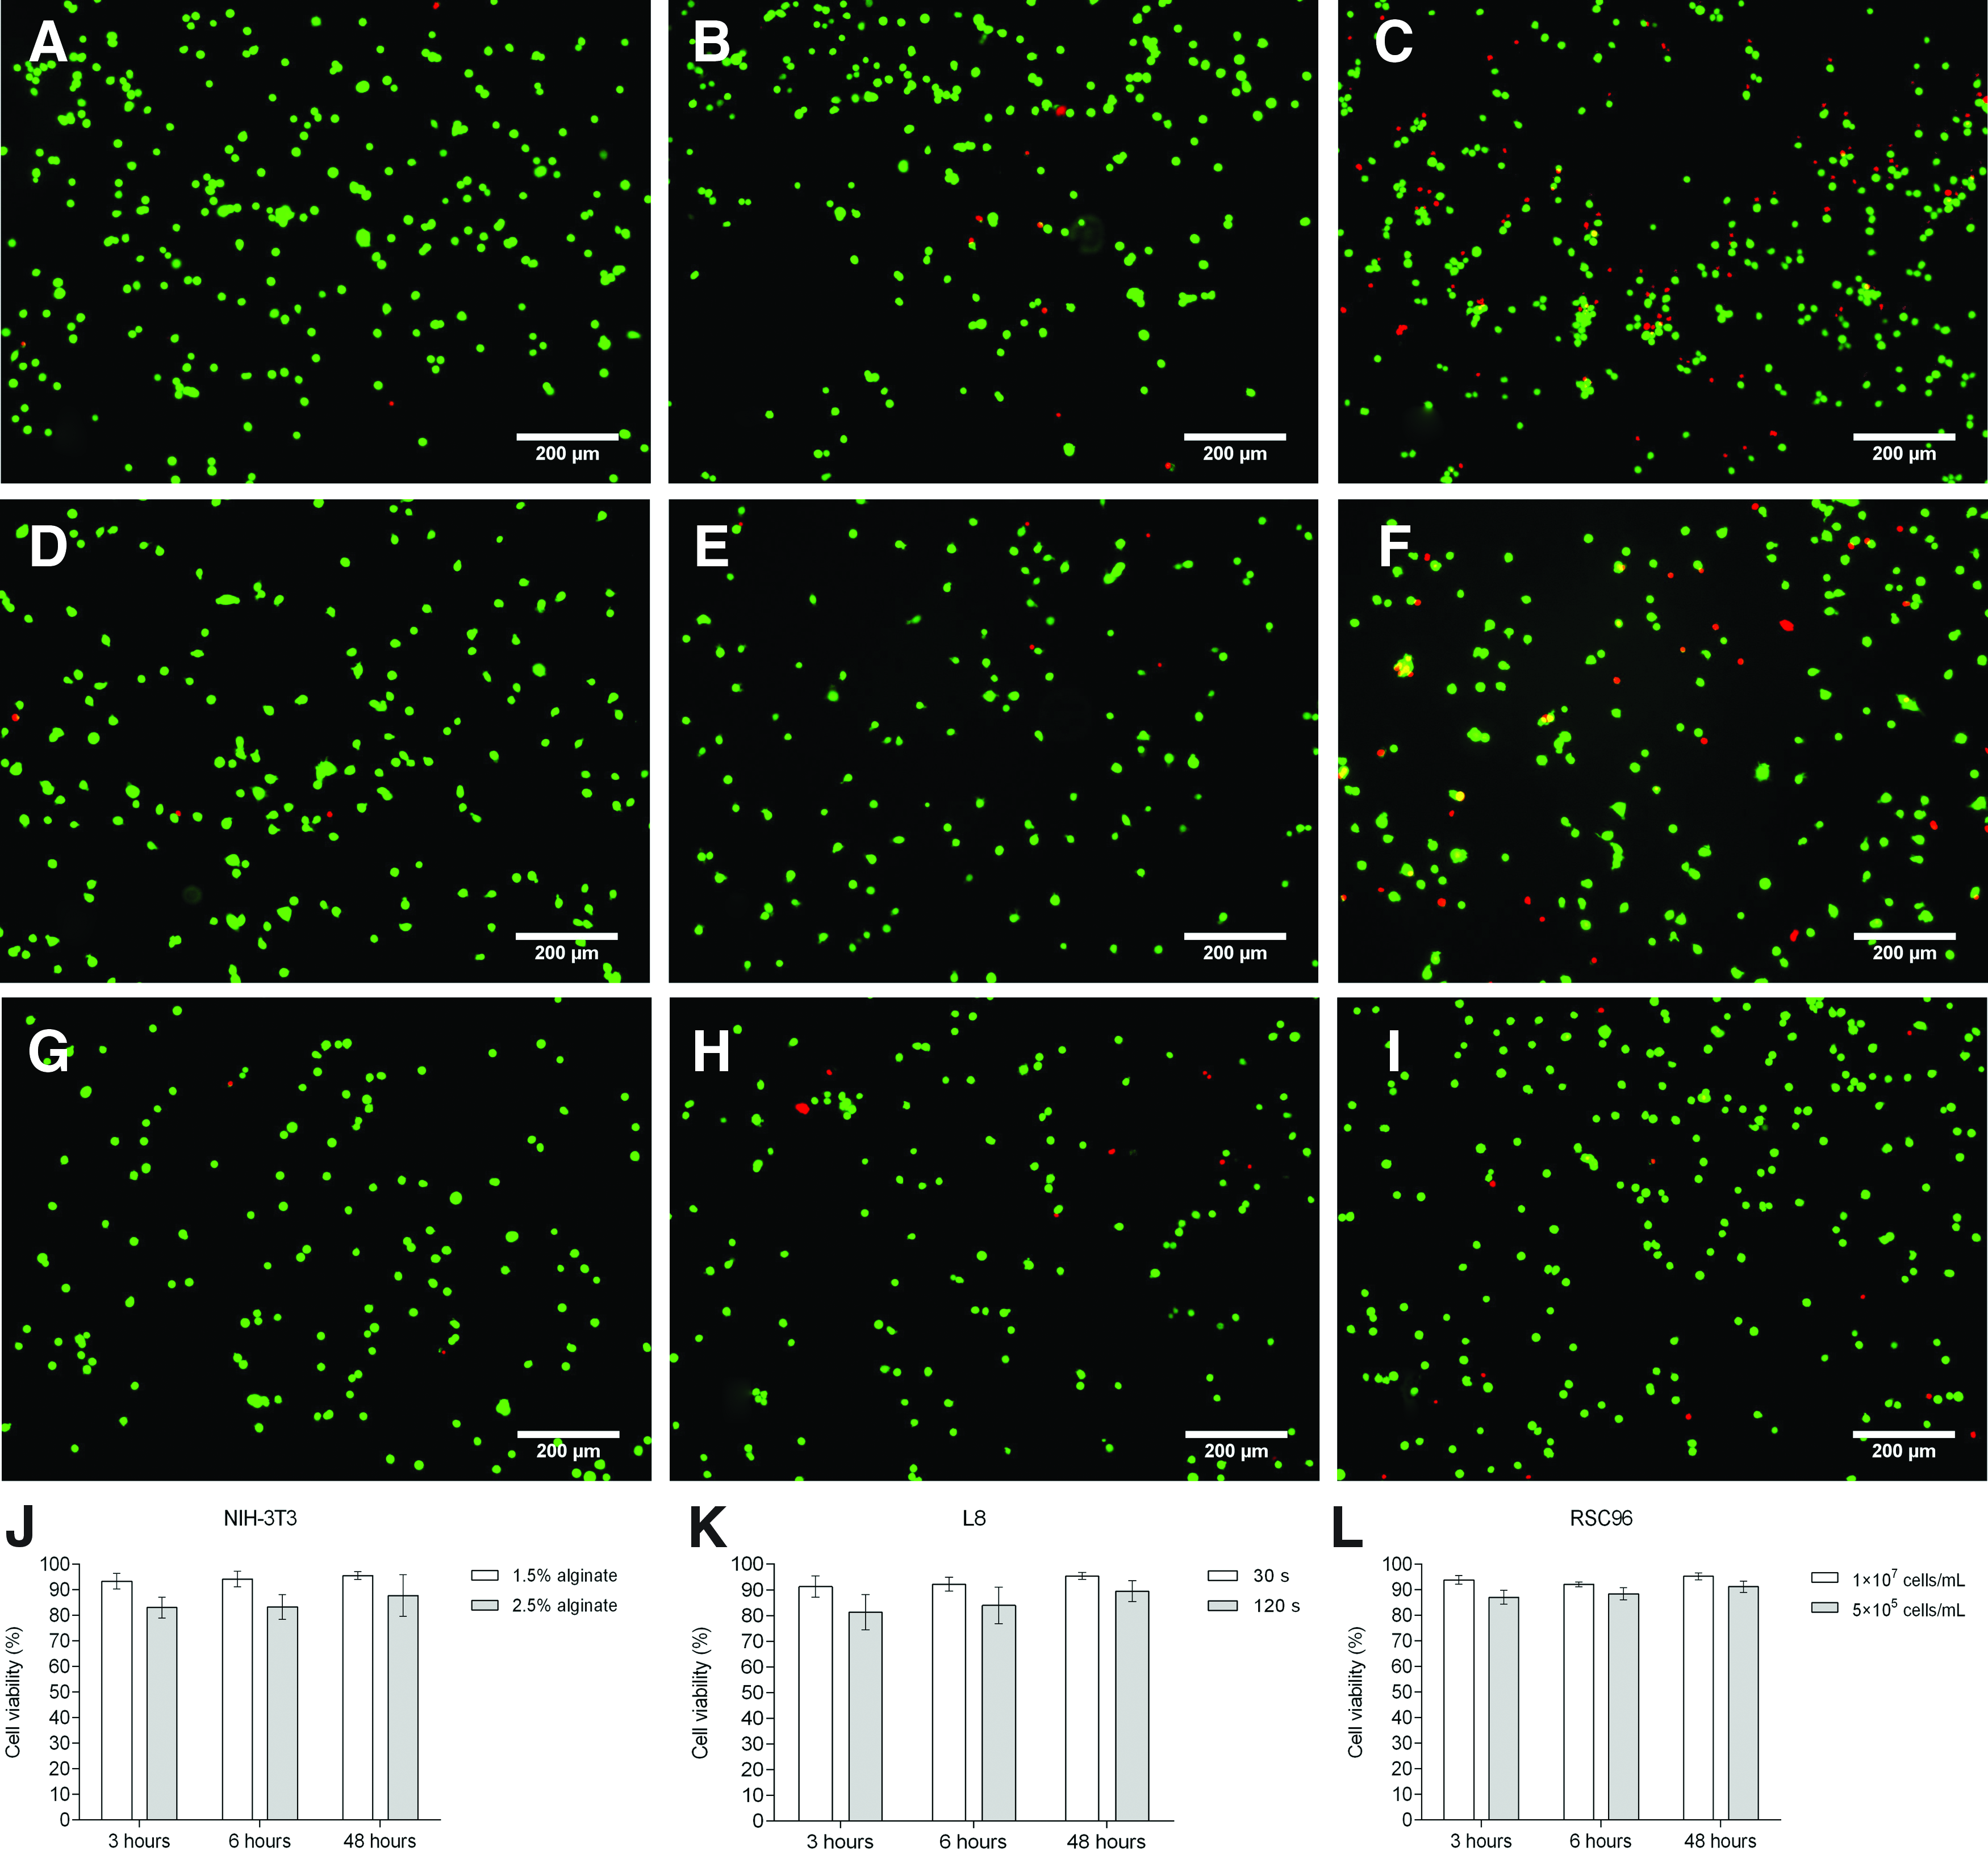
Cell viability upon removal of the shear force.
An MTT assay was performed to evaluate the proliferation and recovery properties of three cell types 3, 6, and 48 h after shear force was removed. As our methods indicated that gel was seldom formed by FBS, the effect of alginate hydrogel on the MTT assay was considered insignificant. Figure 8 shows the effect of shear stress on cell proliferation. The absorbance values of all sheared cell suspensions were less than those for nonsheared cells after 6 h, which verifies that cells are damaged during shearing. The two positive controls (1.5% and 2.5% alginate–cell suspensions) had close absorbance values, so data for only the 1.5% alginate nonsheared cell suspensions are presented. The absorbance values of sheared RSC96 cells after 6 h in culture were 90.32% (1.5% alginate) and 82.58% (2.5% alginate) of those of nonsheared controls (Fig. 8A); corresponding data for L8 were 95.97% and 86.29% (Fig. 8B) and 99.46% and 85.94% (Fig. 8C) for NIH-3T3. After 48 h, the MTT absorbance for sheared cells decreased compared to nonsheared cells, specifically to 83.96% and 72.61% for RSC96 cells, 89.50% and 82.22% for L8 cells, and 90.77% and 85.27% for NIH-3T3 cells, respectively, suggesting that the proliferation rate of cells slowed after they were disturbed by shear force.
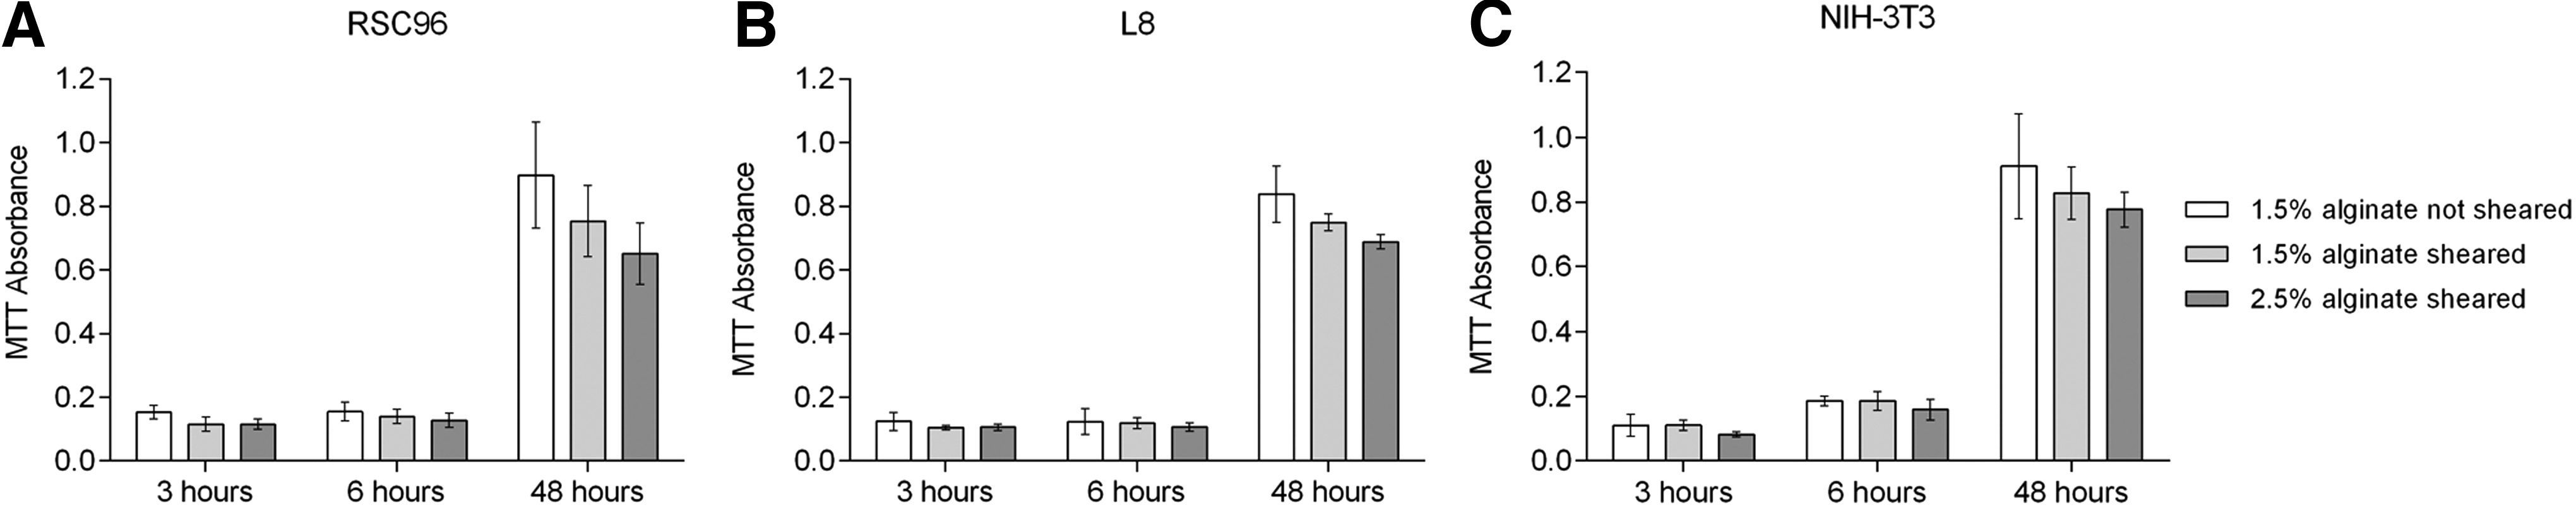
MTT absorbance of cells affected by varying shear stresses.
Figure 9 shows the effect of shear period on cell proliferation. Similar to the effect of shear stress, cell proliferation, as indicated by MTT absorbance for cell suspensions 6 h postshearing, was less than for corresponding nonsheared cell suspensions. For instance, the MTT absorbance values of RSC96 cells (Fig. 9A) were 93.85% (30 s) and 86.15% (120 s) of those of nonsheared cell suspensions; corresponding values for L8 and NIH-3T3 cells were 92.63% and 86.32% (Fig. 9B) and 94.48% and 84.83% (Fig. 9C), respectively. These results verify observations from the cell damage tests that indicate a longer shear period leads to greater cell death, but compared to nondamaged cell percentages indicated from Figure 5, the percentages of MTT absorbance are higher. Damage to sheared RSC96 cells decreased after 48 h to 92.83% and 81.73% after being sheared for 30 or 120 s, respectively, with the same decreasing trends found for both L8 cells (90.72% and 82.02%) and NIH-3T3 cells (92.42% and 82.53%).
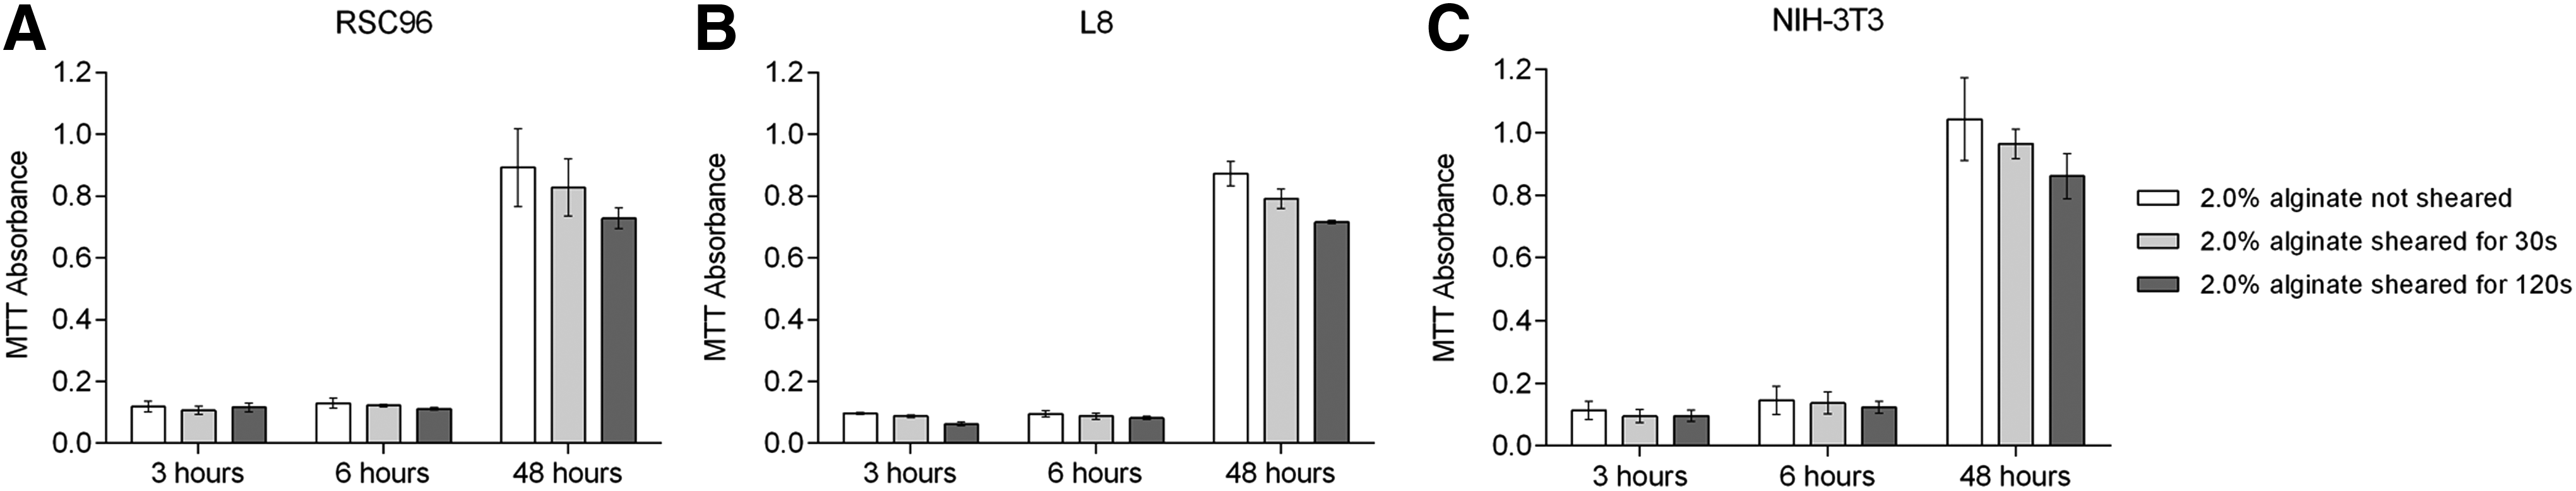
MTT absorbance of cells affected by varying shear times.
The influence of cell density on the proliferation of different types of cells was also evaluated. Absorbance values after 6 h suggest fewer living cells in the sheared cell suspensions than in the nonsheared cell suspensions (Fig. 10). Specifically, the absorbance of sheared RSC96 cells with high cell density (1 × 10⁷ cells/mL) was 93.33% of that for nonsheared cells after 6 h; the percentage decreased to 91.00% for the low-cell density (5 × 10⁵ cells/mL) cell suspension (Fig. 10A). The absorbances of L8 cells (Fig. 10B) were 96.97% and 90.91% of the positive control for high- and low-cell density cell suspensions, respectively. The response of NIH-3T3 cells to shear force shares (Fig. 10C) the same trend as the other two cell types at 94.74% (1 × 10⁷ cells/mL) and 88.42% (5 × 10⁵ cells/mL), respectively. The percentages for all cell types were decreased at 48 h compared to the values at 6 h, and more decrease was observed for the sheared suspensions with low cell density, which suggests that the proliferating rate of sheared cells is further reduced if fewer cells are included in the suspension.
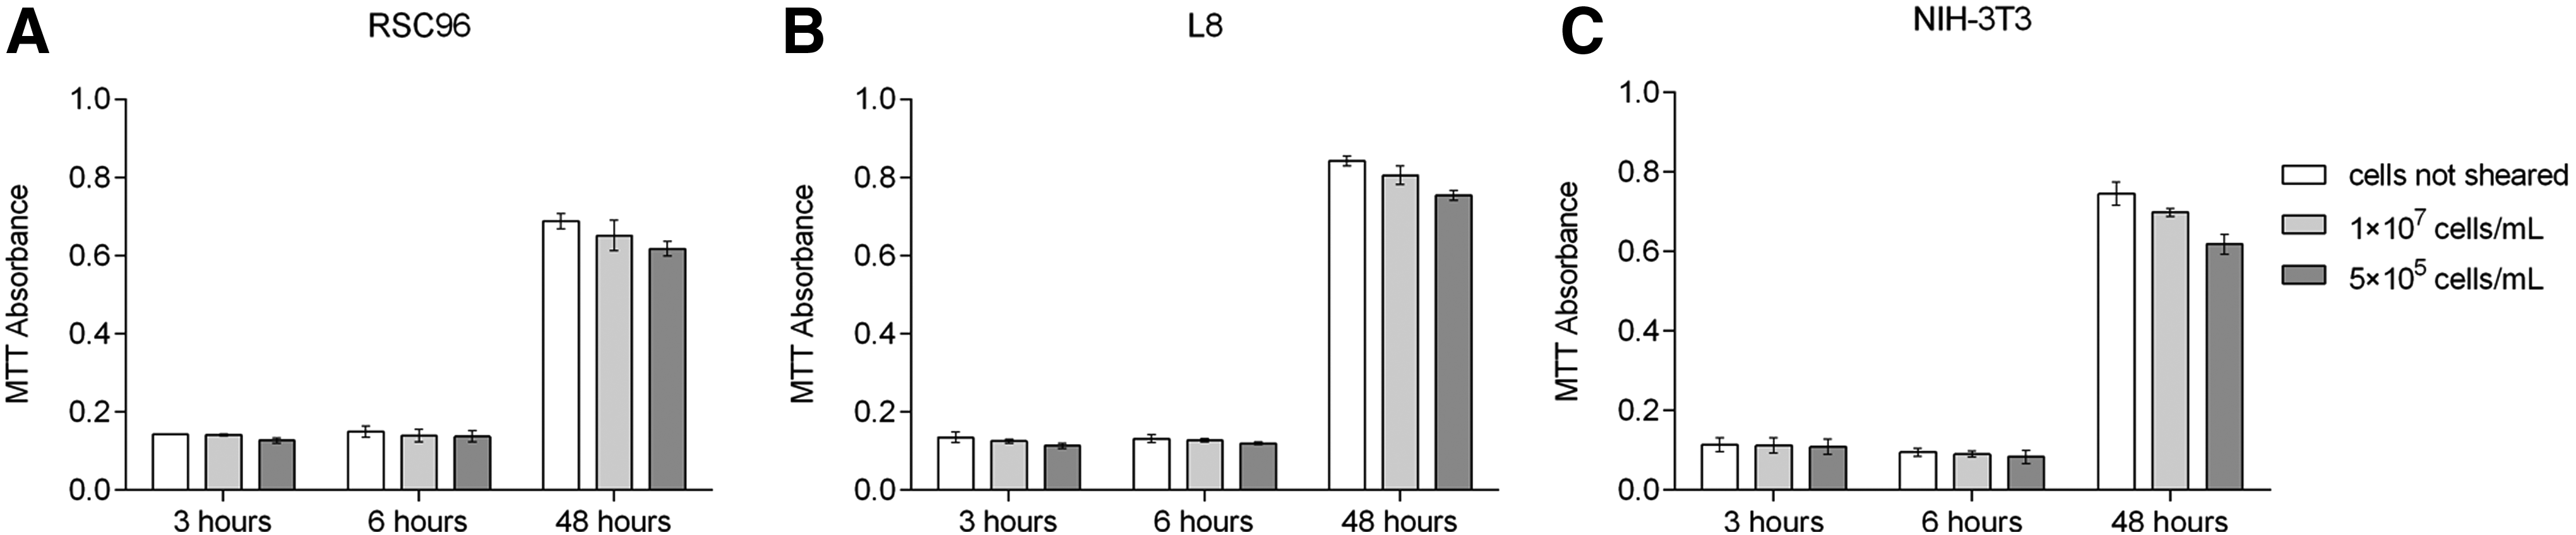
MTT absorbance of cells affected by cell density.
The results of the Hoechst/PI staining assay are presented in Figures 11 and 12, with absorbance values of the cell suspensions presented as a percentage of those for nonsheared controls. For each cell type under different shear conditions, only a slight change in fluorescent absorbance occurred from 3 to 6 h, while the distinctions became obvious after 48 h (Fig. 11A–C). Compared to nonsheared cells, the absorbance of sheared cells decreased as cell culture time extended to 48 h for all conditions evaluated. Overall, increasing shear stress or shear time, or decreasing cell density, adversely affected cell proliferation. The results from PI staining confirm the results of the cell viability tests, that is, that more cells were damaged with higher shear stress, longer exposure time, or lower cell density (Fig. 12A–C). The figure also shows that the absorbance percentages of sheared cells were relatively steady across the different time points, which suggests that the number of dead cells did not change much within the first 48 h after shearing.
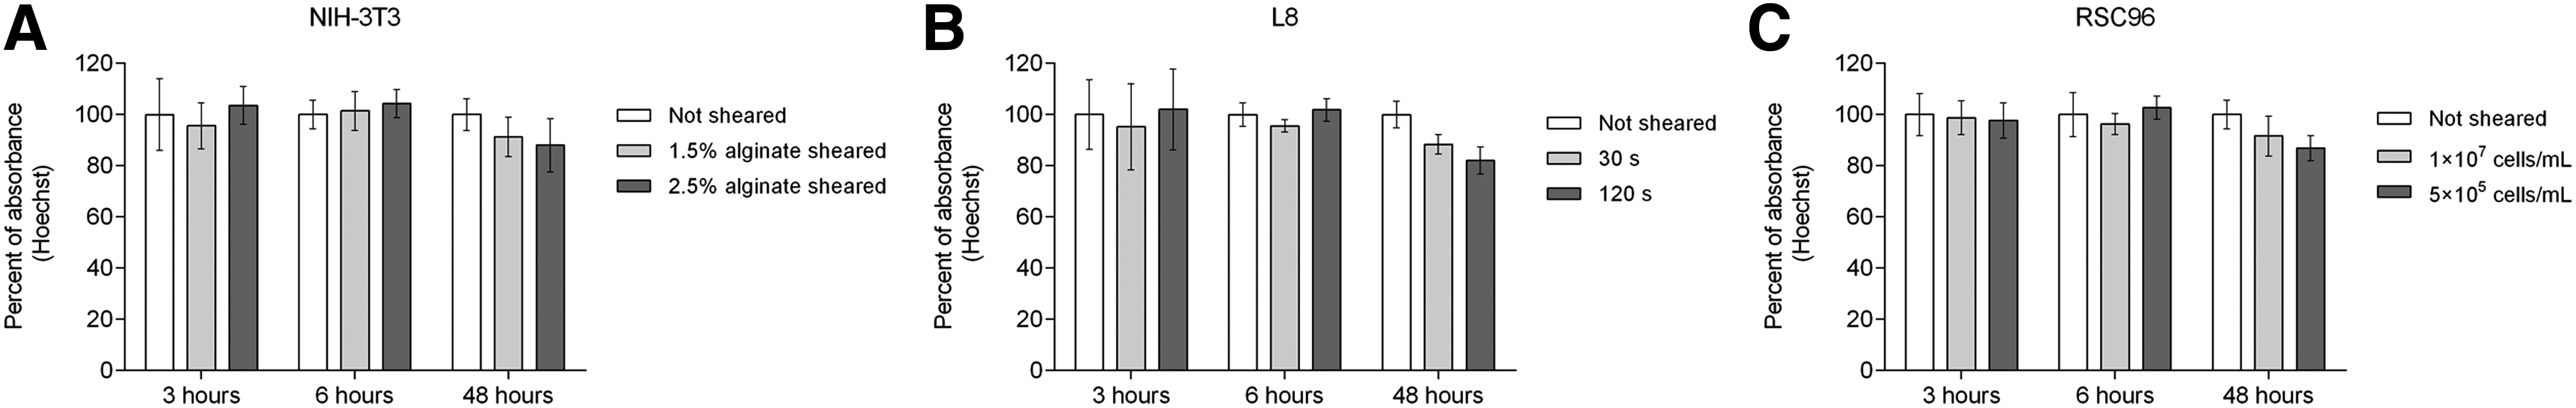
Absorbance of cells stained by Hoechst.
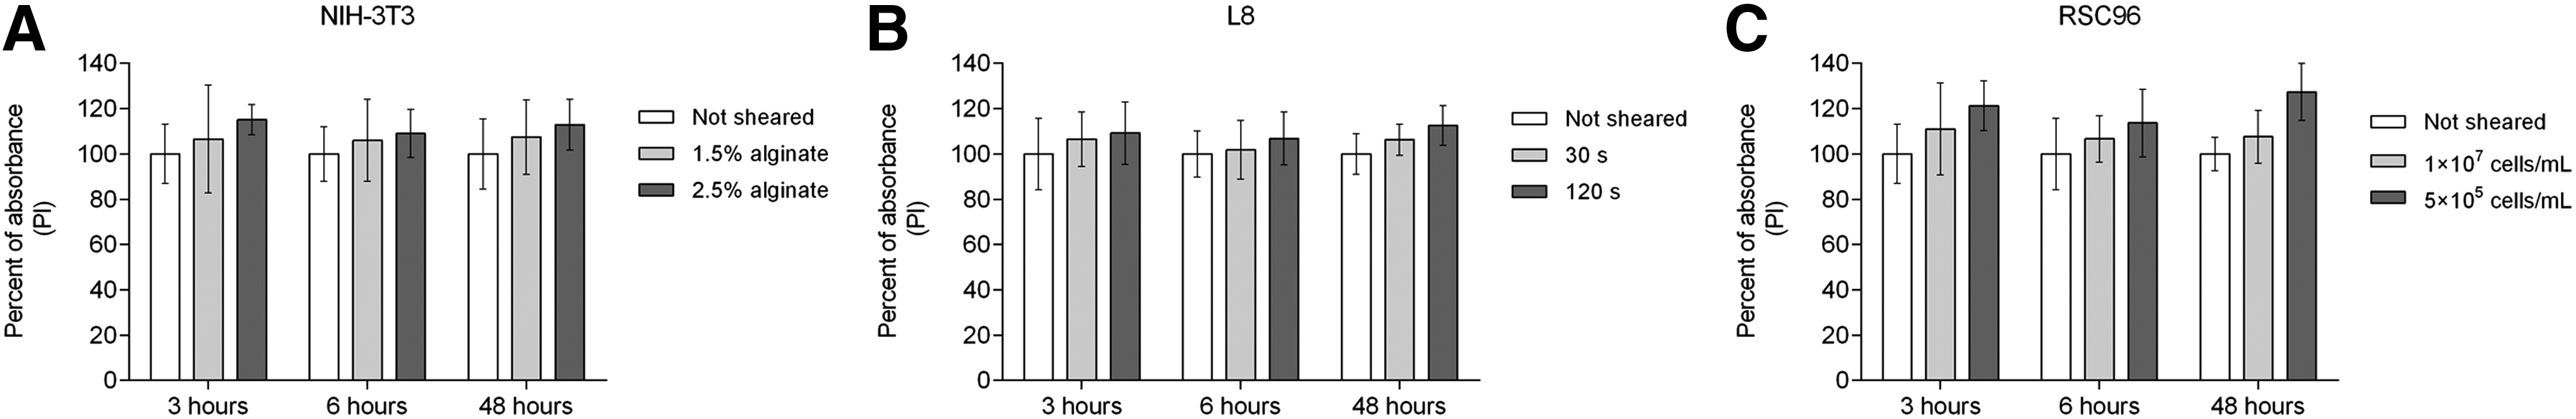
Absorbance of cells stained by propidium iodide (PI).
Discussion
3D bioprinting/plotting techniques for tissue scaffold fabrication have become popular due to their ability to manipulate biomaterial–cell suspensions with a high density of living cells. Cells in suspensions for tissue scaffold fabrication can be protected from immunoreactions by the biomaterials or the later-formed gels once the scaffolds are implanted into hosts.7,40,41 However, the performance of the cells can be significantly affected by the flow behavior of the cell suspensions in the printing process. Thus, the present study evaluated the flow behavior of cell–alginate suspensions as expressed by stress–strain curves. The collected data demonstrate that the flow behavior of the suspensions can be notably altered by the concentration of alginate, the environmental temperature, or the incorporated cell type and number.
Our results agree with conclusions that more incorporated cells reduce the shear stress of suspensions. 32 This phenomenon is likely due to cell–cell and cell–biomaterial solution interactions because the flow behavior of the single-phase alginate solution changes as it becomes a two-phase solution as cells are encapsulated. 30 One percent alginate solution was used to form the cell suspensions evaluated for flow behavior using a rheometer. This is because cell suspensions in a high-alginate concentration solution would significantly increase the viscosity, which introduces the potential errors in suspension delivery. Therefore, the lowest alginate concentration among the four concentrations considered at the outset of the present study was used for the remainder of the experiments to ensure the accuracy of the transferred volume and the reliability of the results obtained.
Cells are subjected to shear force in the bioprinting process when the cell suspensions are forced to flow through the nozzle tip. The shear force applied to the cells is determined not only by the properties of the suspension but also by the dispensing pressure and nozzle size. 31 The elastic capability of cells normally allows them to withstand deformation induced by shear force and recover to their original shape once the force is removed. 42 However, cell damage caused by structural failure occurs when the forces applied to the cells exceed their tolerance limits. 34 In the present study, more than 15% of cells were damaged when a shear stress of 1700 Pa was applied for just 10 s. This demonstrates the negative effects of shear force on the cells and informs the choice of appropriate values of dispensing pressures and nozzle diameters in scaffold bioprinting to ensure high cell viability. The effect of exposure time on cell viability suggests that cell manipulations should not exceed 2 min at a shear stress of 1100 Pa or the percent damaged cells climb above 15%. This result informs nozzle selection for scaffold bioprinting because the shear time cells experience may exceed the threshold of cell toleration and lead to significant cell death if the nozzle tip is too long.
Different types of cells in various organs and tissues have different physical, chemical, and biological properties. 43 Cells in either soft or mineralized tissues subject to uniform situations of mechanical stress transmission and sensation would have various responses to the external stimulation. Estimates of mechanical properties of cells using a wide range of methods indicate that the measured elastic modulus of isolated cells generally ranges from 0.1 kPa (alveolar epithelium) to an approximate upper limit of 40 kPa (myocytes). 44 The magnitude of the elastic properties is believed to be determined by diverse molecular structures, such as the cell membrane and cytoskeleton, which can distinguish the abilities of diverse cell types to withstand forces and recover to their normal phenotype. 45 In this study, Schwann cells were the weakest of the three cell types with respect to the applied shear force because more cells were damaged when the shear force or exposure time increased. This can be explained by the inherent elastic ability of cells themselves. Schwann cells are the major glial cells in the peripheral nervous system and have inherently weak mechanical properties compared to other tissues, such as skeletal muscles or bones.46–48 Thus, the ability of Schwann cells to endure external forces would be limited by their intrinsic characteristics, which makes them more susceptible to damage.
The results of this study also demonstrate that increasing cell density has a positive effect on protecting cell viability. For all three cell types tested, the number of damaged cells decreased with increasing cell density (Fig. 6). When the cell density reached a relatively high level (e.g., 1 × 10⁷ cells/mL), less than 5% of the cells were damaged after being subjected to 1100 Pa of shear stress for 60 s. This indicates that interactions between cells likely protect them from damage caused by shearing, and greater cell numbers heighten this protection.
An evaluation of cell recovery and proliferation was carried out using multiple methods, including an MTT assay, a live/dead assay, and Hoechst/PI staining, to ensure the reliability of results. We expected our results to reflect the existence of three distinct cell states after shearing: unchanged cells with regular phenotypes, cells that survived but are damaged or quiescent, and dead cells. Cells that are damaged but still alive may have the ability to recover to their regular functions or may remain quiescent without any cellular expression and slowly die. With the assistance of the live/dead assay (Fig. 7), an increase in live cell numbers for all cell types was observed after culturing the sheared cells for 6 h compared with results from cell damage tests (Figs. 4–6). This can be explained by the recovery of damaged cells after a certain period in culture. The assumption is supported by the steady number of living nonsheared cells, which changed only slightly after 6 h, indicating that the increase in the viability of sheared cells represents the recovery of injured cells. Moreover, the MTT assay results indicate similar absorbance values after 3 and 6 h for all examined cells; this suggests that cell proliferation does not occur within this short period and supports the premise that the increase in cell viability is due to the recovery of damaged cells. Cell proliferation continued to 48 h as confirmed by the results of both the live/dead and MTT assay; absorbance values kept increasing, while a relatively constant number of dead cells were found under the fluorescent microscope, which indicates that the increasing cell numbers are due to cell regeneration. Hoechst/PI staining results also verify the occurrence of cell proliferation because the absorbance of Hoechst-stained cells continued to increase, while values from PI staining remained constant.
Alginate solution can gel upon encountering calcium ions, which would affect the accuracy of absorbance values for the MTT assay when used for cell proliferation tests. To avoid this complication, the present study used calcium-free DMEM and confirmed that gelation was insignificant. Irregular MTT values for sheared and nonsheared cells were noted for the 3-h samples, wherein the absorbance of nonsheared cells was lower than that of sheared cells in some cases (Figs. 8–10). This was attributed to the loss of poorly attached cells when the culture mediums were aspirated out (MTT protocol) just 3 h after cell suspensions were delivered into 12-well plates. 49 To address this issue, Hoechst/PI staining tests were applied, and special manipulations in the examining process were conducted. The results of the Hoechst/PI staining assay agree with observations from the cell damage testing, and the absorbance values at 6 and 48 h concur with results from both the live/dead and MTT assays. After 48 h, results from the MTT assay and Hoechst/PI staining indicated a significant increase in cell numbers for all samples, although the absorbances of the sheared cell suspensions were less than those for corresponding control samples. However, cell proliferation of sheared cells was less than that for controls, especially for cells subjected to a higher shear stress or a longer shear period. Thus, the selection of dispensing pressure and nozzle size in tissue scaffold bioprinting is important because the related shear force and shear time lead to not only cell damage but also significantly reduced cell proliferation if improper parameters are used. Our results also indicate that cell density plays an important role in preserving cell proliferation because cell suspensions with high cell densities were able to better maintain their proliferation capacity after shearing compared to those with low cell densities.
The combined results of the cell damage test, live/dead assay, MTT assay, and Hoechst/PI staining from the present study show relatively constant dead cell numbers for all the sheared cell suspensions, indicating that few living cells died within the first 48 h in culture. The proliferation rate of sheared cells was lower than that for nonsheared cells, which demonstrates that some sheared cells might have still been alive after 48 h but had lost their proliferation capacity.
Conclusions
This article presents our investigations into the flow behavior of biomaterial–cell suspensions and the impact of shear force on cell viability and proliferation, as exemplified using alginate–Schwann cell, alginate–fibroblast cell, and alginate–skeletal muscle cell suspensions. The examination of flow behavior extends previous studies and demonstrates that not only temperature and biomaterial concentration but also cell density can significantly alter the flow behavior of cell suspensions. Furthermore, data for all cell suspensions examined in this study indicate that increasing the cell density can reduce the shear stress for a given shear rate. Moreover, our results show that cell viability and proliferation can be affected by shear stress, shear time, and cell density. These findings provide a means to preserve the cell viability and/or to retain cell proliferation function in the bioprinting process by regulating the flow behavior of cell–biomaterial suspensions and process parameters. In addition, the data and results of this study provide useful information for future characterization of the cell damage in 3D printing processes using mathematical models to predict the viability and proliferation of cells encapsulated in biomaterials/scaffolds.
Footnotes
Acknowledgments
The authors acknowledge financial support from the Natural Sciences and Engineering Research Council of Canada (NSERC) and the Saskatchewan Health Research Foundation (SHRF). The authors thank Dr. David J. Schreyer and Dr. Tuanjie Chang from the College of Medicine at the University of Saskatchewan for their help with experiments.
Disclosure Statement
No competing financial interests exist.