
Abstract
Human pluripotent stem cells (hPSCs) are viewed as promising candidates for applications in regenerative medicine and therapy due to their proliferative and pluripotent properties. However, obtaining clinically significant numbers of hPSCs remains a limiting factor and impedes their use in therapeutic applications. Conventionally, hPSCs are cultured on two-dimensional surfaces coated with a suitable substrate, such as Matrigel™. This method, however, requires a large surface area to generate sufficient cell numbers to meet clinical needs and is therefore impractical as a manufacturing platform for cell expansion. In addition, the use of enzymes for cell detachment and small molecule inhibitors to increase plating efficiency may impact future cell behavior when used for routine subculturing. In this study, we describe a protocol to generate and maintain hPSC aggregates in a three-dimensional suspension culture by utilizing thermoresponsive nanobridges. The property of the polymer used in the nanobridges enables passaging and expansion through a temperature change in combination with mechanically applied shear to dissociate aggregates; thus, we eliminate the need of enzymes or small molecules for cell dissociation and viability, respectively. Utilizing this platform, maintenance of human embryonic stem cells for three continuous passages demonstrated high expression levels in key pluripotent markers.
Introduction
H
Currently, two-dimensional (2D) monolayer cell cultures, which have low efficiency for high-throughput cell expansion, continue to be utilized in the majority of stem cell systems. Therefore, scalable technologies are required for the implementation of hPSCs in therapeutic and pharmacologic applications. In addition, the limitations of 2D cell culture can result in misleading and nonpredictive data when studying in vitro responses. 3 In comparison, three-dimensional (3D) cell cultures can provide scalable technologies as this platform is not subjected to surface limitation.
A number of promising methods have been reported for generation of 3D pluripotent hPSC cultures, including the use of microcarriers,4,5 suspension cultures,6,7 scaffolds,8,9 and hydrogels.10,11 Recently, Chen et al. reported a method for suspension culture of human embryonic stem cells (hESCs) utilizing a small molecule (Rho-associated protein kinase inhibitor [RI]). These cultures achieved an average of a fourfold increase at each passage, attaining an accumulated 1 × 10¹³-fold increase over 21 passages. 12 In comparison, Lei and Schaffer reported the use of a synthetic polymer hydrogel using a temperature increase for gel formation to culture hPSCs in 3D. 11 This achieved a 20-fold expansion after 4–5 days of culture utilizing RI. These studies show that the suspension culture platform is advantageous allowing reproducible, controllable, automation systems for mass production of quality cells, concurrently eliminating labor-intensive and time-consuming methods involved with adherent culture vessels.
While this brings us closer to large-scale, controlled, automated systems, it does not resolve the issue with genomic instability, which has been reported following the use of enzymatic or nonenzymatic treatment during passaging of hPSCs.12–16
We have previously reported hESC expansion as 3D suspension cultures, using thermoresponsive nanobridges where formation and passaging of hESC aggregates were facilitated through temperature control and mechanical shear. 17 While using the same basic polymer (poly(N-isopropylacrylamide) [PNIPAM]) as Lei and Schaffer, our system, termed as nanobridges, included two components: (1) nanoworms, which consist of a block copolymer of PNIPAM attached to polystyrene, and (2) block copolymer of PNIPAM-b-ECM, in which PNIPAM is conjugated to an extracellular matrix (ECM). 17
Investigations into signaling mechanisms within hPSCs have reported that the ECM influences cell survival, growth, and differentiation. 18 These reports demonstrate that an ECM component is critical for the maintenance of hPSCs. ECM proteins are difficult to isolate and only present in minute amounts in their native form. 19 Identification of critical ECM proteins has demonstrated that different variants of a full-length wild-type ECM protein affect proliferation and maintenance of hPSC cultures.20,21 Fibronectin has been reported as a key ECM protein required for hPSC maintenance.8,22 Thus, we generated a recombinant fibronectin (rFN) fragment to conjugate to PNIPAM for use in the hPSC aggregate cultures. Production methods of the fibronectin fragment have been previously published.23–25
It is critical to note that, due to genetic variation and, possibly, derivation methods, cell agglomeration and proliferation of 3D cell cultures will vary between different cell lines and under different media conditions. Thus, optimization of polymer components needs to be performed when introducing either new cell lines or different media with our nanobridges. In this study, we describe the use of the PNIPAM-b-ECM and nanoworms to generate 3D hPSC suspension cultures, including strategies to determine optimal concentrations of PNIPAM-b-ECM and nanoworms for aggregate formation, dissociation, maintenance, and passaging.
Materials and Methods
Preparation of cells
Routine culture of hESCs was performed in a six-well tissue culture dish (Cat. No. 140675; ThermoFisher Scientific). Two hESC lines, WA09 (WiCell, Wisconsin, MI) and HES3-NKX2-5eGFP/w (a kind donation from Andrew Elefanty and Ed Stanley), 26 were used in the work reported here.
At subconfluency (80–90%), the medium was aspirated and the well washed with 2 mL of PBS−/−. The PBS−/− was removed and 1 mL of an appropriate dissociation reagent added (Gentle Cell Dissociation Reagent; STEMCELL Technologies or TrypLE™ Select; Invitrogen). While the recommended treatment time is between 3 and 5 min at room temperature (RT), the morphology of the cells was assessed every minute. As cells started to detach, 1 mL of mTeSR1™ complete medium (Cat. No. 05870; STEMCELL Technologies) was added into the culture dish to neutralize the dissociation reagent, followed by gentle pipetting to obtain a single cell suspension. It was critical not to overtreat the cells with dissociation reagents as this impeded aggregation.
The cells were transferred into a 15 mL conical tube and centrifuged at 480 g for 3 min. The supernatant was aspirated and 1 mL of mTeSR1 complete medium was added to resuspend the cell pellet for cell counts. Cell counts and viability were performed in triplicate using 0.4% Trypan Blue solution (Cat. No. T8154; SIGMA) in a 1:1 ratio with the cell sample. After determining the cell count, the cell suspension was reconstituted to a cell density of 1 × 10⁶ cells/mL in mTeSR1.
Determining optimal polymer component concentrations for aggregate formation and dissociation
Aggregate formation
The proposed mechanism for aggregate formation and dissociation is schematically represented in Figure 1A. The ECM we utilized was a fragment of rFN created in-house. A range of concentrations for PNIPAM-b-rFN and nanoworms17,27 were identified to establish the optimal concentration for each polymer component to create 3D aggregates. The layout as shown in Figure 1F was designed to separately test concentrations of the polymer components. Preparation guidelines written below were designed for a complete biological setup, which consisted of six technical replicates in 96-well plates (COSTAR® 96-well Ultra-Low Attachment plate, Cat. No. 7007; Corning). Solutions of hESCs with PNIPAM-b-rFN in mTeSR1 media (solution A) and nanoworms in mTeSR1 media (solution B) were prepared separately.
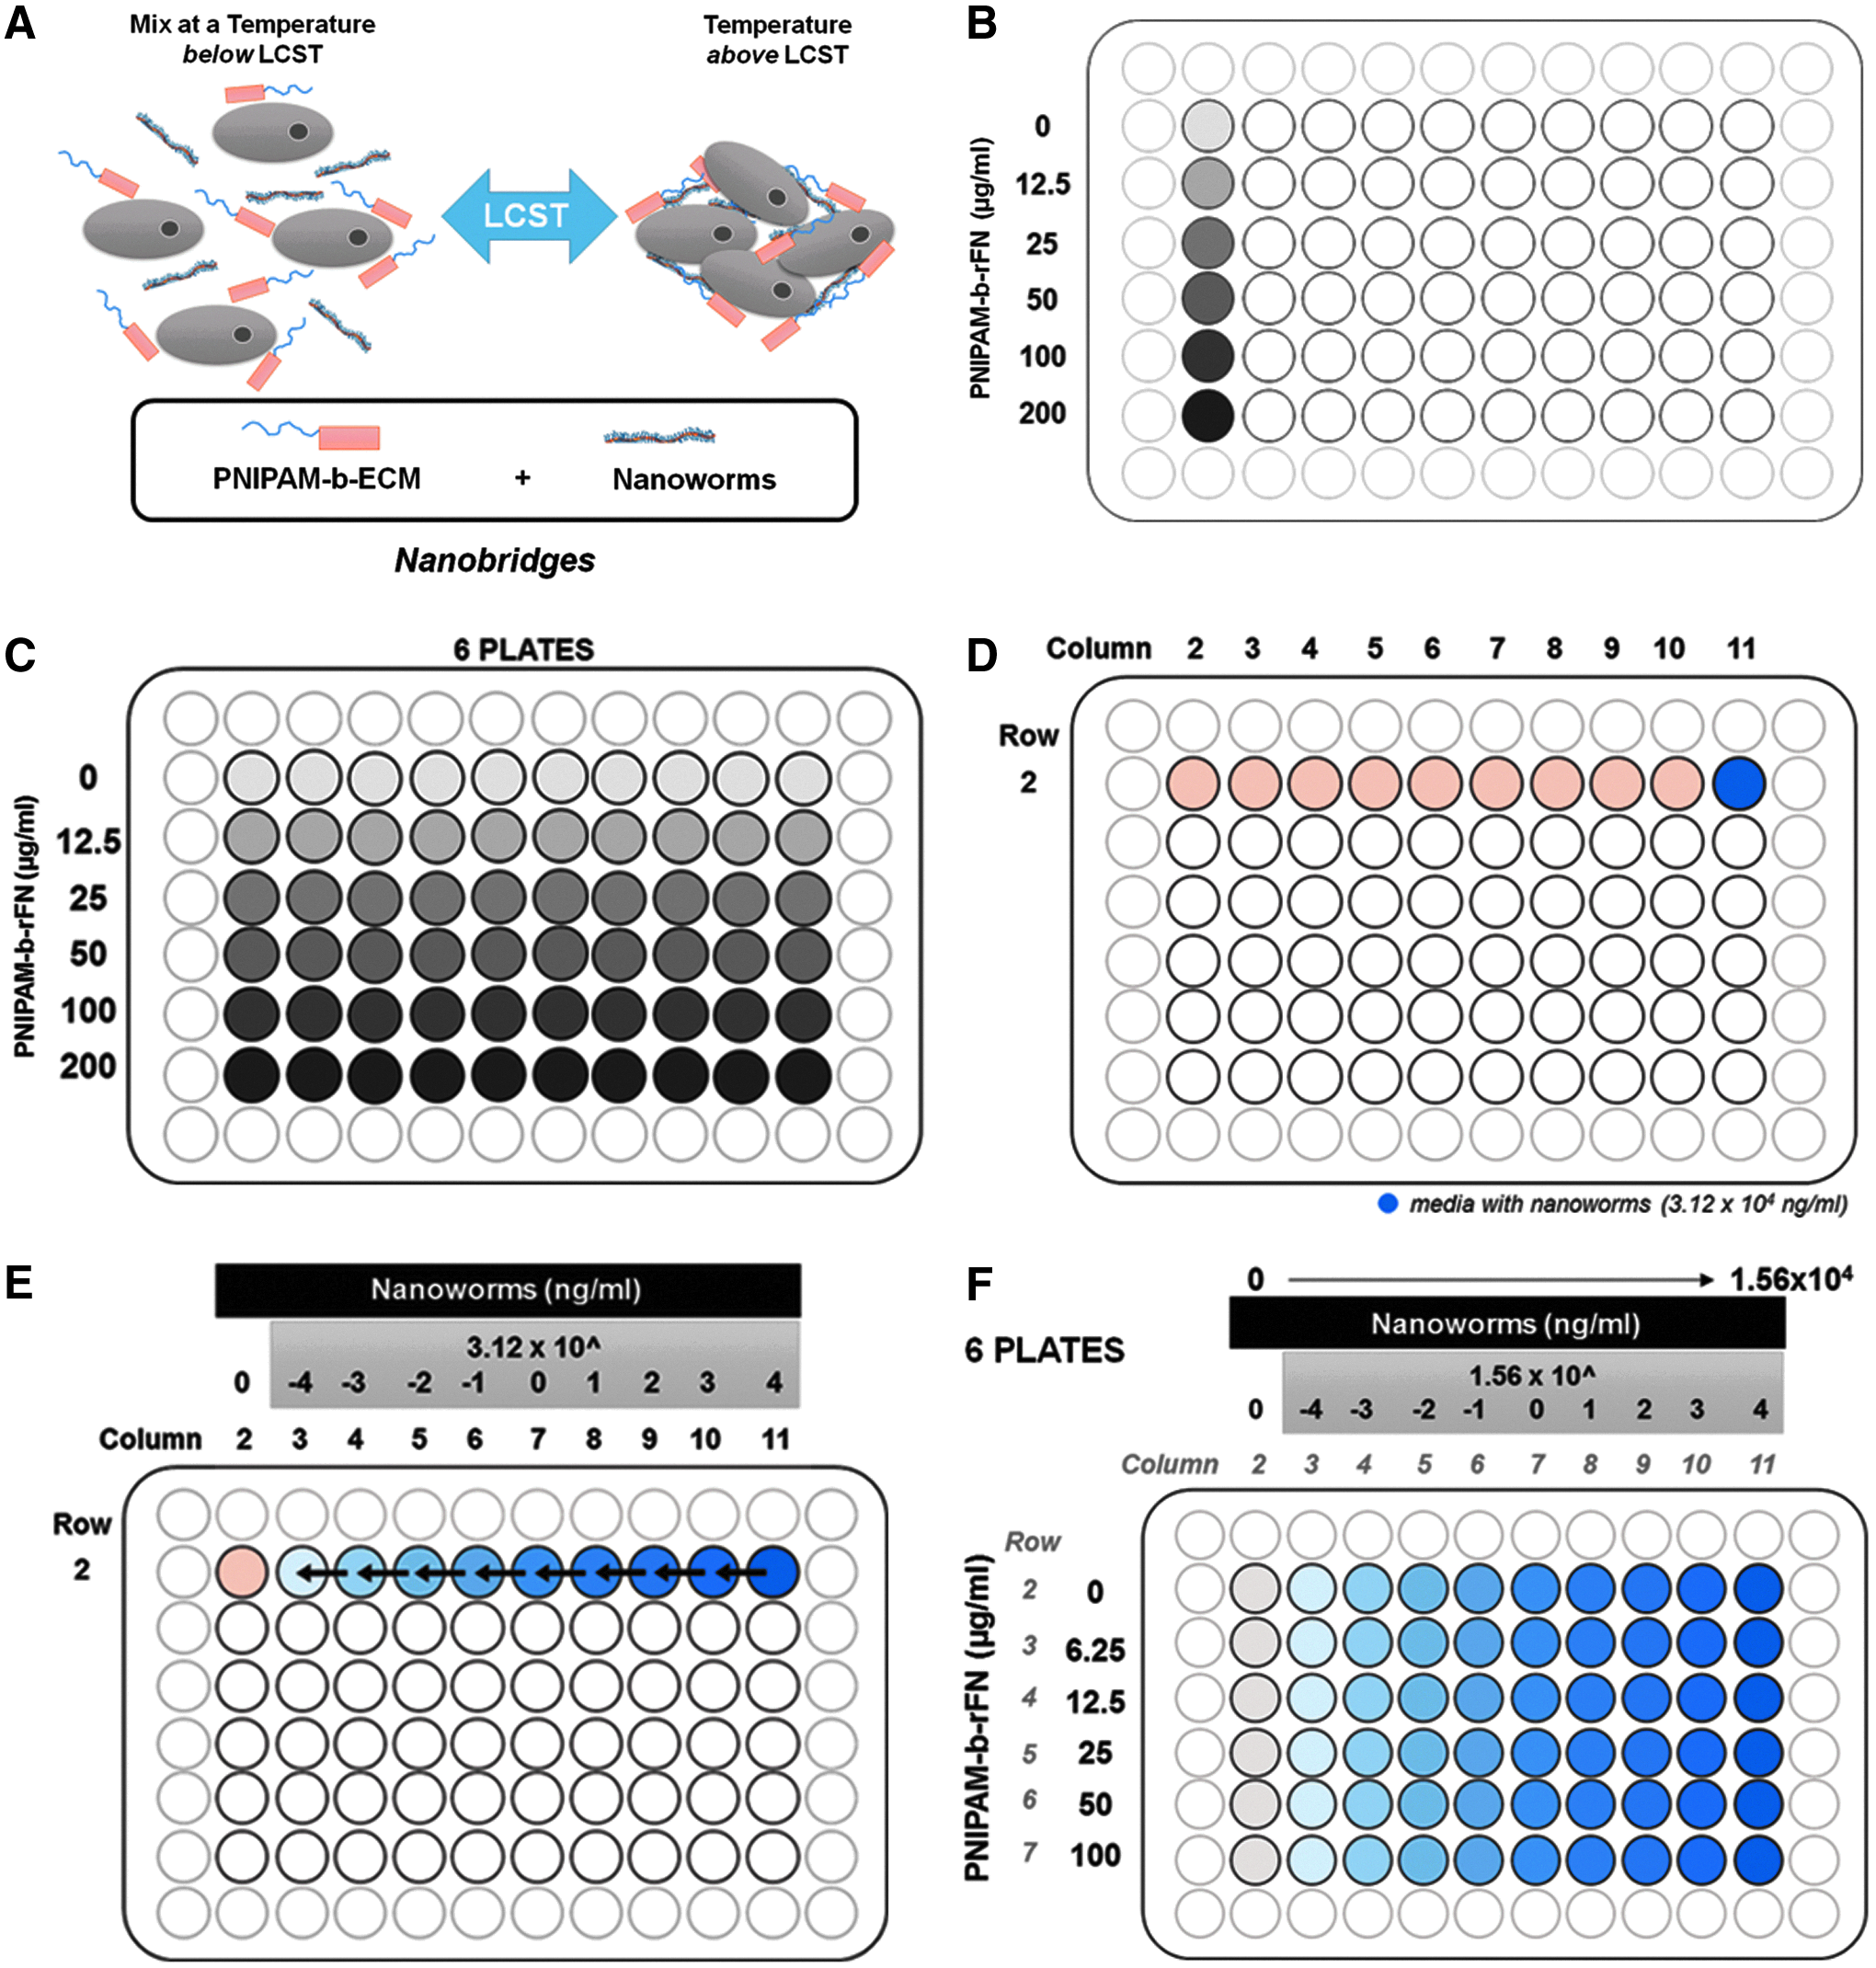
Representations of plate organization to determine concentrations of thermoresponsive polymer components for optimal hESC aggregate formation.
Solution A: The respective volumes of media, hESCs, and PNIPAM-b-rFN, calculated according to the volumes in Table 1, were added into a 96U DeepWell plate (Cat. No. 278743; Thermo Scientific) as shown in Figure 1B. Extra volume of mixture solution was included within the final amount to ensure that the volume contained enough solution for all six plates.
PNIPAM, poly(N-isopropylacrylamide); rFN, recombinant fibronectin.
Solution B: In a second 96U DeepWell plate, a serial dilution of nanoworms was prepared using a starting concentration of 3.12 × 10⁴ ng/mL, diluting 10-fold to 3.12 × 10⁻⁴ ng/mL in the mTeSR1 medium. Nine hundred forty-five microliter of mTeSR1 media per well was aliquoted from columns 2 to 10 in row 2 as shown in Figure 1D. On the same plate, to the well in row 2, column 11, 32.76 μL of 1 mg/mL of nanoworms and 1017.24 μL of mTeSR1 media were added (Fig. 1D). Volumes were added to achieve a solution with 3.12 × 10⁴ ng/mL of nanoworms. A 10-fold serial dilution was performed starting with column 11, and moving across to column 3 of the 96U DeepWell plate, to obtain the various concentrations of nanoworms as illustrated in Figure 1E.
Ninety-six well plate format
Following preparation of the solutions, the centrifuge was prewarmed to 37°C and 25 μL of solution A aliquoted into the 60-well format of 6 plates of 96-well Ultra-Low Attachment plates (Fig. 1C). To these six plates, 25-μL aliquots were added from the wells in row 2 of the serially diluted nanoworms (Fig. 1E), using 10 out of a 12-channel pipette, after which the wells were resuspended two to three times to ensure the solutions were mixed homogenously. The resulting plates, with varying concentrations of PNIPAM-b-rFN and nanoworms (Fig. 1F), were centrifuged in a prewarmed, 37°C centrifuge, at 480 g for 5 min. After centrifugation, all six plates were transferred into the incubator at 37°C, 5% CO2.
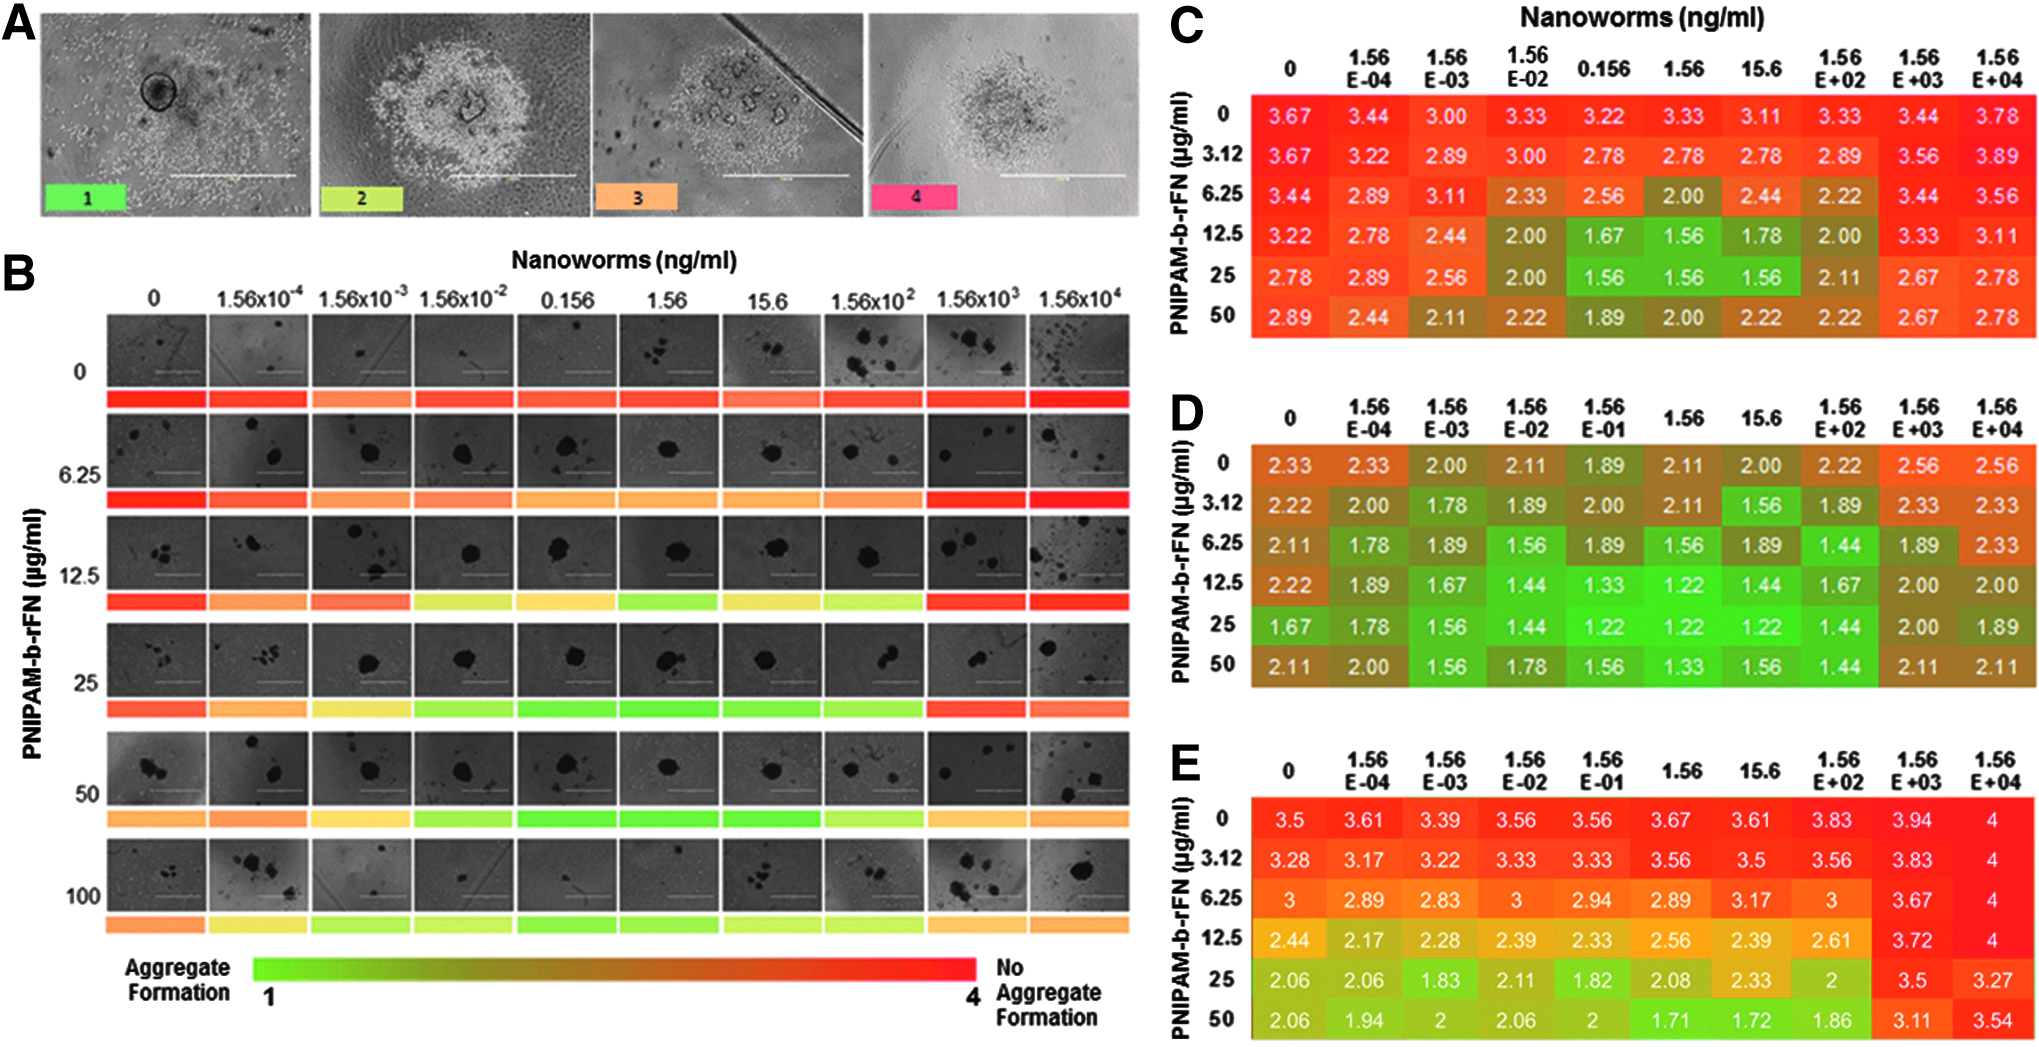
Three days later, aggregate formation of the cells was examined by scoring each well to assess the formation efficiency. Assessment was based on uniformity of density, spherical structure, and smoothness of the aggregate boundary as shown in Figure 2A. All three parameters were used to determine the optimal concentrations of both polymer components for consistent aggregate formation.
Optimization strategy for determination of concentrations of polymer components for aggregate formation and dissociation.
Aggregate dissociation
The following section comprises the setup of the 60 inner wells of a COSTAR 96-well Ultra-Low Attachment plate for assessment of dissociation efficiency. Using optimal polymer concentrations from the above titrations, cells, at a concentration of 70,000/mL, were mixed with the PNIPAM-b-rFN and left for a couple of minutes at RT for the PNIPAM-b-rFN to attach to the cells. The nanoworms were added to the solution mixture of PNIPAM-b-rFN and cells, mixed well, and a total volume of 50 μL aliquoted into each well of a COSTAR 96-well Ultra-Low Attachment plate.
The calculations for the amount of cells, polymer components, and media are as shown in Table 2 and can be adjusted accordingly to the total volume required. The mixture was gently resuspended after every few aliquots to maintain an even distribution of cells. The 96-well plates were centrifuged in a prewarmed 37°C centrifuge at 480 g for 5 min and incubated at 37°C, 5% CO2.
To seed a full COSTAR® 96-well Ultra-Low Attachment plate, in which 60 wells are used with the periphery wells filled with sterile PBS−/−. Total volume for the entire plate is equivalent to 3 mL. It is important to prepare extra volumes of suspension mixture to ensure all wells have the correct volume. An example given here is for 3.5 mL of cell, PNIPAM-b-rFN at 50 μg/mL and nanoworms at 1.56 ng/mL suspension mixture. Alternative volumes of the respective components require calculating.
Following 3 days of incubation, spent media were removed by tilting the plate, allowing the aggregates to settle in the bottom edge, and removing ≈45 μL, wells were refreshed with an equal amount of RT media without polymer. After 5 min of incubation at RT, aggregate formation was scored across wells for the entire plate either by live microscopic visualization or performed later on scanned images. The aggregates were then gently pipetted through a 200-μL pipette tip, keeping the number of pipetting steps standardized at 30 times. The dissociation efficiency was then assessed by scoring the morphology of the aggregates where there was no dissociation 1; partial dissociation 2; clumps 3; and small clumps 4.
Routine passaging and maintenance of 3D hPSC cultures
Following aggregate formation, spherical aggregates of uniform density, with a defined, smooth boundary were formed, by day 3 of culture. When aggregates became larger than 600 μm in diameter, passaging was performed.
Passaging of aggregates
Fresh mTeSR1 media were prepared, including optimal concentrations of the PNIPAM-b-rFN and nanoworms, and maintained at RT. The aggregate plate was carefully tilted to an angle of 40–60° to allow the aggregate in each well to settle to the bottom edge. The medium was removed from the top of the well using a 200-μL multichannel pipette and 50 μL of the fresh media, with PNIPAM-b-rFN and nanoworms, were added to each well.
Aggregates were left for a 5-min incubation at RT to lower the media temperature to below the lower critical solution temperature (LCST) of 32°C. Aggregates were then passaged, using a multichannel pipette fitted with 200-μL pipette tips, by gentle repeat pipetting to break the aggregates into small clumps. The cell suspension was increased to 150 μL of the freshly prepared media, with PNIPAM-b-rFN and nanoworms, and split 1:3 to new wells of 50 μL each. The 96-well plates were centrifuged in prewarmed 37°C condition at 480 g for 5 min and transferred back into incubator.
Routine media changes
Media were refreshed every second day or when the media turned yellow by tilting the plate, allowing the aggregates to settle on the lower edge of the well and removing ≈45 μL/well. An equal amount of fresh prewarmed media, without polymer, was then added.
Validation and characterization
Following establishment of the 3D aggregate cultures, characterization was performed at p3 and p7 to ensure hESCs remained karyotypically normal and maintained their pluripotent markers. Standard protocols were used for karyotyping analysis of hESCs. 28 Teratoma production was performed as previously reported 17 by injecting hESCs in a 1:2 dilution of Corning® Matrigel® matrix intramuscularly into the hind leg of CB17 severe immunodeficiency (SCID) mice. Implants were removed after 8 weeks, fixed, sectioned, and stained with hematoxylin and eosin.
Immunofluorescent staining
Aggregates were replated onto precoated Matrigel dishes and fixed with 4% paraformaldehyde 24 h later. Plates were stained with primary antibodies: mouse IgG2a anti-OCT3/4 (Santa Cruz) and rabbit IgG1 anti-NANOG (Merck Millipore). Isotype-specific secondary antibodies used were conjugated to Alexa Fluor® 488 and 647 and nuclei were counterstained with Hoechst 33342. Fluorescence staining was imaged and analyzed using the IN Cell Analyzer and IN Cell Investigator (GE Healthcare).
RNA extraction and reverse transcription–quantitative polymerase chain reaction
The full protocol used closely adheres to recent guidelines on conducting and reporting on quantitative polymerase chain reaction (qPCR) results. 29 All genes of interest were referenced to three housekeeping genes: human β-actin, hypoxanthine phosphoribosyltransferase, and glyceraldehyde-3-phosphate dehydrogenase, 30 using the Pfaffl method. 31 All experiments were conducted in triplicate. Primer sequences used for qPCR are as shown in Table 3.
Cell proliferation and viability and aggregate size distribution analysis
Cell counts and viability studies were performed using a selection of aggregates. Aggregates were single cell suspended using TrypLE Select (Invitrogen), stained with 0.4% Trypan Blue solution, and counted on a hemocytometer. Aggregate size distribution analysis was performed by collecting bright field images of aggregates using an EVOSfl inverted microscope (Advanced Microscopy Group) on days 10, 11, and 18. Diameters of aggregates were measured in μm using Image J (v1.41). Aggregate diameters were then classed and histograms were generated using GraphPad Prism 7 (GraphPad Software, Inc.).
Statistical analysis
All experiments were conducted on, at least, three biological replicates with three technical replicates for each biological experiment unless otherwise stated. Data were presented as mean with standard deviation in all graphs and histograms. Statistical analysis was conducted using one-way ANOVA, with Tukey's multiple comparisons test to evaluate significant differences in data across different groups. Analyses were done using GraphPad Prism 7 (GraphPad Software, Inc.). p Values <0.05 were considered significant.
Results
Determining optimal nanobridge concentrations for hESC aggregate formation and dissociation
We utilized two hESC lines (WA09 and HES3-NKX2-5eGFP/w) and two commercially available media (StemPRO® and mTeSR1) to establish the concentrations of both polymer components. A single cell suspension of hESCs was prepared before aggregate formation, and when establishing the initial cultures, we determined that overexposure of both hESC lines to enzymatic dissociation reagents impaired formation of 3D aggregates (data not shown).
To determine the optimal concentrations of the nanobridges, hESC aggregates were formed at a concentration of 3500 cells per aggregate in the presence of PNIPAM-b-rFN and nanoworms. Following 3 days of incubation, aggregates were assessed for formation and attributed a score of 1–4 (Fig. 2). A score of 1 represents a defined, round, dense aggregate (full); a score of 2 was defined as one large and several small clumps of cells, or several medium clumps of cells (partial); a score of 3 was defined as small clumps of cells (clumps); and a score of 4 was defined as no aggregate or clump formation (no aggregate formation).
Figure 2B demonstrates the range of formations across the different polymer concentrations. Heat maps were generated from the scored aggregates on a per well basis from the six biological replicates. These data generated an average score for aggregate formation with varying polymer component concentrations. Figure 2C and D show heat maps generated from HES3-NKX2-5eGFP/w cultured in StemPRO and mTeSR1 media, respectively, while Figure 2E shows a heat map generated from WA09 cultured in StemPRO media.
As observed in Figure 2, PNIPAM-b-rFN demonstrated aggregate formation between 12.5 and 50 μg/mL with nanoworm concentrations between 0.156 and 15.6 ng/mL. Assimilation of the serial titration data demonstrated that PNIPAM-b-rFN and nanoworm concentrations of 50 μg/mL and 1.56 ng/mL, respectively, gave the most consistent aggregate formation across alternative cell lines and media.
Formation and dissociation efficiencies of hESC aggregates in the presence of nanobridges
Using the optimal concentrations of the nanobridges, experiments were established to compare the effect of the polymer components on the aggregate formation and dissociation. Aggregates were created in three conditions: media only, media with rFN (50 μg/mL), and media with PNIPAM-b-rFN (50 μg/mL) and nanoworms (1.56 ng/mL).
HES3-NKX2-5eGFP/w and WA09 aggregates cultured in mTeSR1 in the presence of either an rFN or the nanobridges formed with significantly higher efficiency (p < 0.05) compared to media alone. No significant differences were observed in either hESC line cultured in StemPRO (Fig. 3A). The data demonstrated that while addition of an rFN aided aggregate formation, with comparable efficiencies to the nanobridges, the presence of the nanobridges gave significantly higher aggregate dissociation efficiencies to partial, clumps, and small clumps for both hESC lines in both media (Fig. 3B).
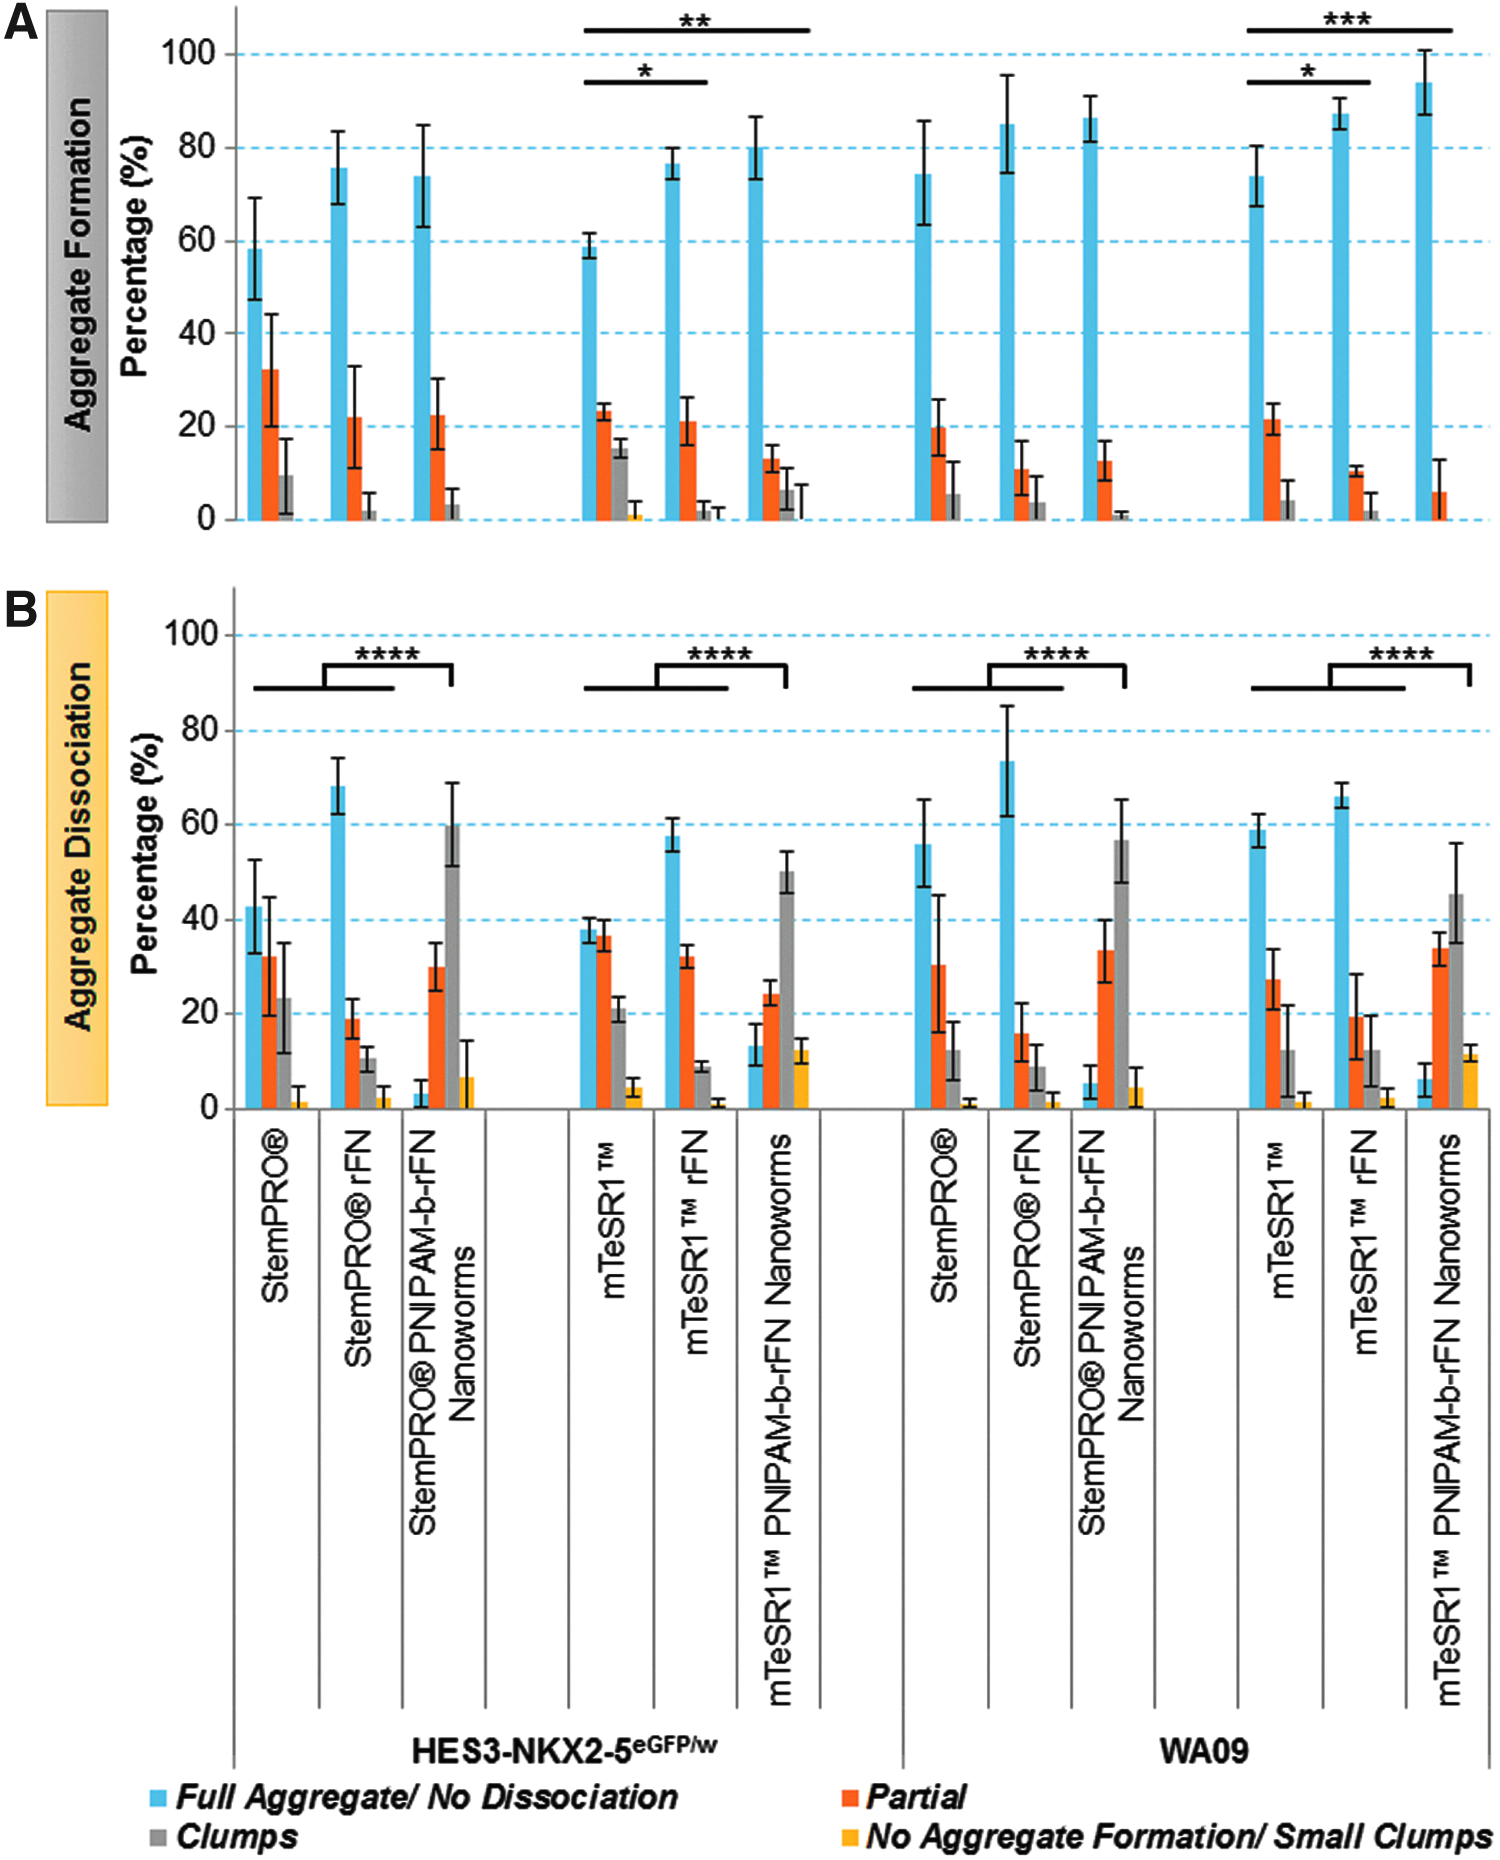
Effect of polymer components on aggregate formation and dissociation efficiencies of hESC aggregates.
Results demonstrated that in the absence of the nanobridges, only 39.1% ± 4.8% of the aggregates dissociated into partial/clumps/small clumps as opposed to 94.1% ± 2.8% in the nanobridges aggregates, thus demonstrating that dissociation efficiency was poor in the absence of nanobridges. Taken together with previously published data, 17 this indicates that the nanobridges contribute to consistency in efficient aggregate formation and dissociation.
Routine culture of 3D hESC aggregates
Cell aggregates were reestablished within 24 h of passaging when small aggregates could be observed. These aggregates continued to grow and proliferate over the subsequent days. On days 3 and 10 of culture, the temperature was lowered to below the LCST and the aggregates were passaged using gentle pipetting to form small clusters of cells. Using StemPRO or mTeSR1 media, we determined that 30 repeat pipettings gave an optimal clump size; however, this number needs to be established for different media and alternative cell lines. Following passaging, the cultures were then equally distributed into three new wells with fresh media containing the nanobridges. HESC lines were cultured and expanded for 18 days/three passages.
Characterization of hESC aggregates in the presence of nanobridges
Samples were acquired at p1, p2, and p3 for cell counts and aggregate size distribution with qPCR and immunostaining performed at p3.
Proliferation and cell viability
Sixty aggregates were collected per biological replicate (n = 3) to examine cell proliferation and viability. Proliferation data demonstrated that while initial growth was slow, the fold growth increased exponentially over the three passages as shown in Figure 4A. Following 18 days of culture, HES3-NKX2-5eGFP/w achieved an average growth fold of 22.9 ± 3.9 in StemPRO and 19.0 ± 4.5 in mTeSR1, while WA09 attained a growth fold of 35.9 ± 6.2 and 32.0 ± 6.5 in StemPRO and mTeSR1, respectively, demonstrating that WA09's proliferation was superior compared to HES3-NKX2-5eGFP/w. High cell viabilities (minimally 85%) were recorded across the two cell lines in both media, with the lowest viability reported at 85.6% ± 4.6% for WA09 in mTeSR1 media.

Characterization of growth, viability, aggregate size distribution, and karyotype of cells from hESC aggregates cultured in the nanobridges.
Aggregate growth
The hESC aggregates were passaged on days 3 and 10. Before passaging, day 3 aggregates were imaged and the width measured, the average width was determined to be 501 ± 71 μm for both cell lines in both media. On day 10, the aggregate width was measured before passage. For prepassaging, the average diameter of HES3-NKX2-5eGFP/w and WA09 aggregates in mTeSR1 (Fig. 4C, D) was 564 ± 53 and 589 ± 94 μm, respectively. Aggregate size, reassessed on day 11, one day postpassaging, demonstrated formation of relatively homogenous aggregates with an average diameter of 213 ± 33 and 192 ± 10 μm for HES3-NKX2-5eGFP/w and WA09, respectively. As shown in Figure 4C and D, these aggregates had regrown to an average diameter of 507 ± 33 and 652 ± 173 μm for HES3-NKX2-5eGFP/w and WA09, respectively, by day 18.
These data indicate that the aggregates continue to proliferate, forming larger, denser aggregates during the period between passages. Data for aggregate widths for HES3-NKX2-5eGFP/w and WA09 in StemPRO can be found in our original publication. 17
Karyotypic analyses, gene and protein expression, and teratoma formation
To establish if the hESCs remained karyotypically normal, we extended the culture period to seven passages. Analysis demonstrated stable karyotypes for both hESC lines cultured in the presence of the nanobridges (Fig. 4E–G).
As shown in Figure 5, no significant change in gene expression levels for pluripotent markers OCT4 or NANOG were observed between the two media in HES3-NKX2-5eGFP/w. In comparison, their differentiated controls, cultured in Albumin Polyvinylalcohol Essential Lipids (APEL) media, were significantly downregulated (p < 0.005). Immunostaining and quantification of replated HES3-NKX2-5eGFP/w and WA09 aggregates, cultured in the presence of nanobridges in both media, demonstrated that a high percentage of cells retained their pluripotent markers OCT4 and NANOG (Fig. 5). The percentage of HES3-NKX2-5eGFP/w positive for OCT4 and NANOG were 91.6% ± 6.4% and 84.1% ± 7.7%, respectively, while expression levels for WA09 were 85.2% ± 0.4% and 79.1% ± 0.6%, respectively.
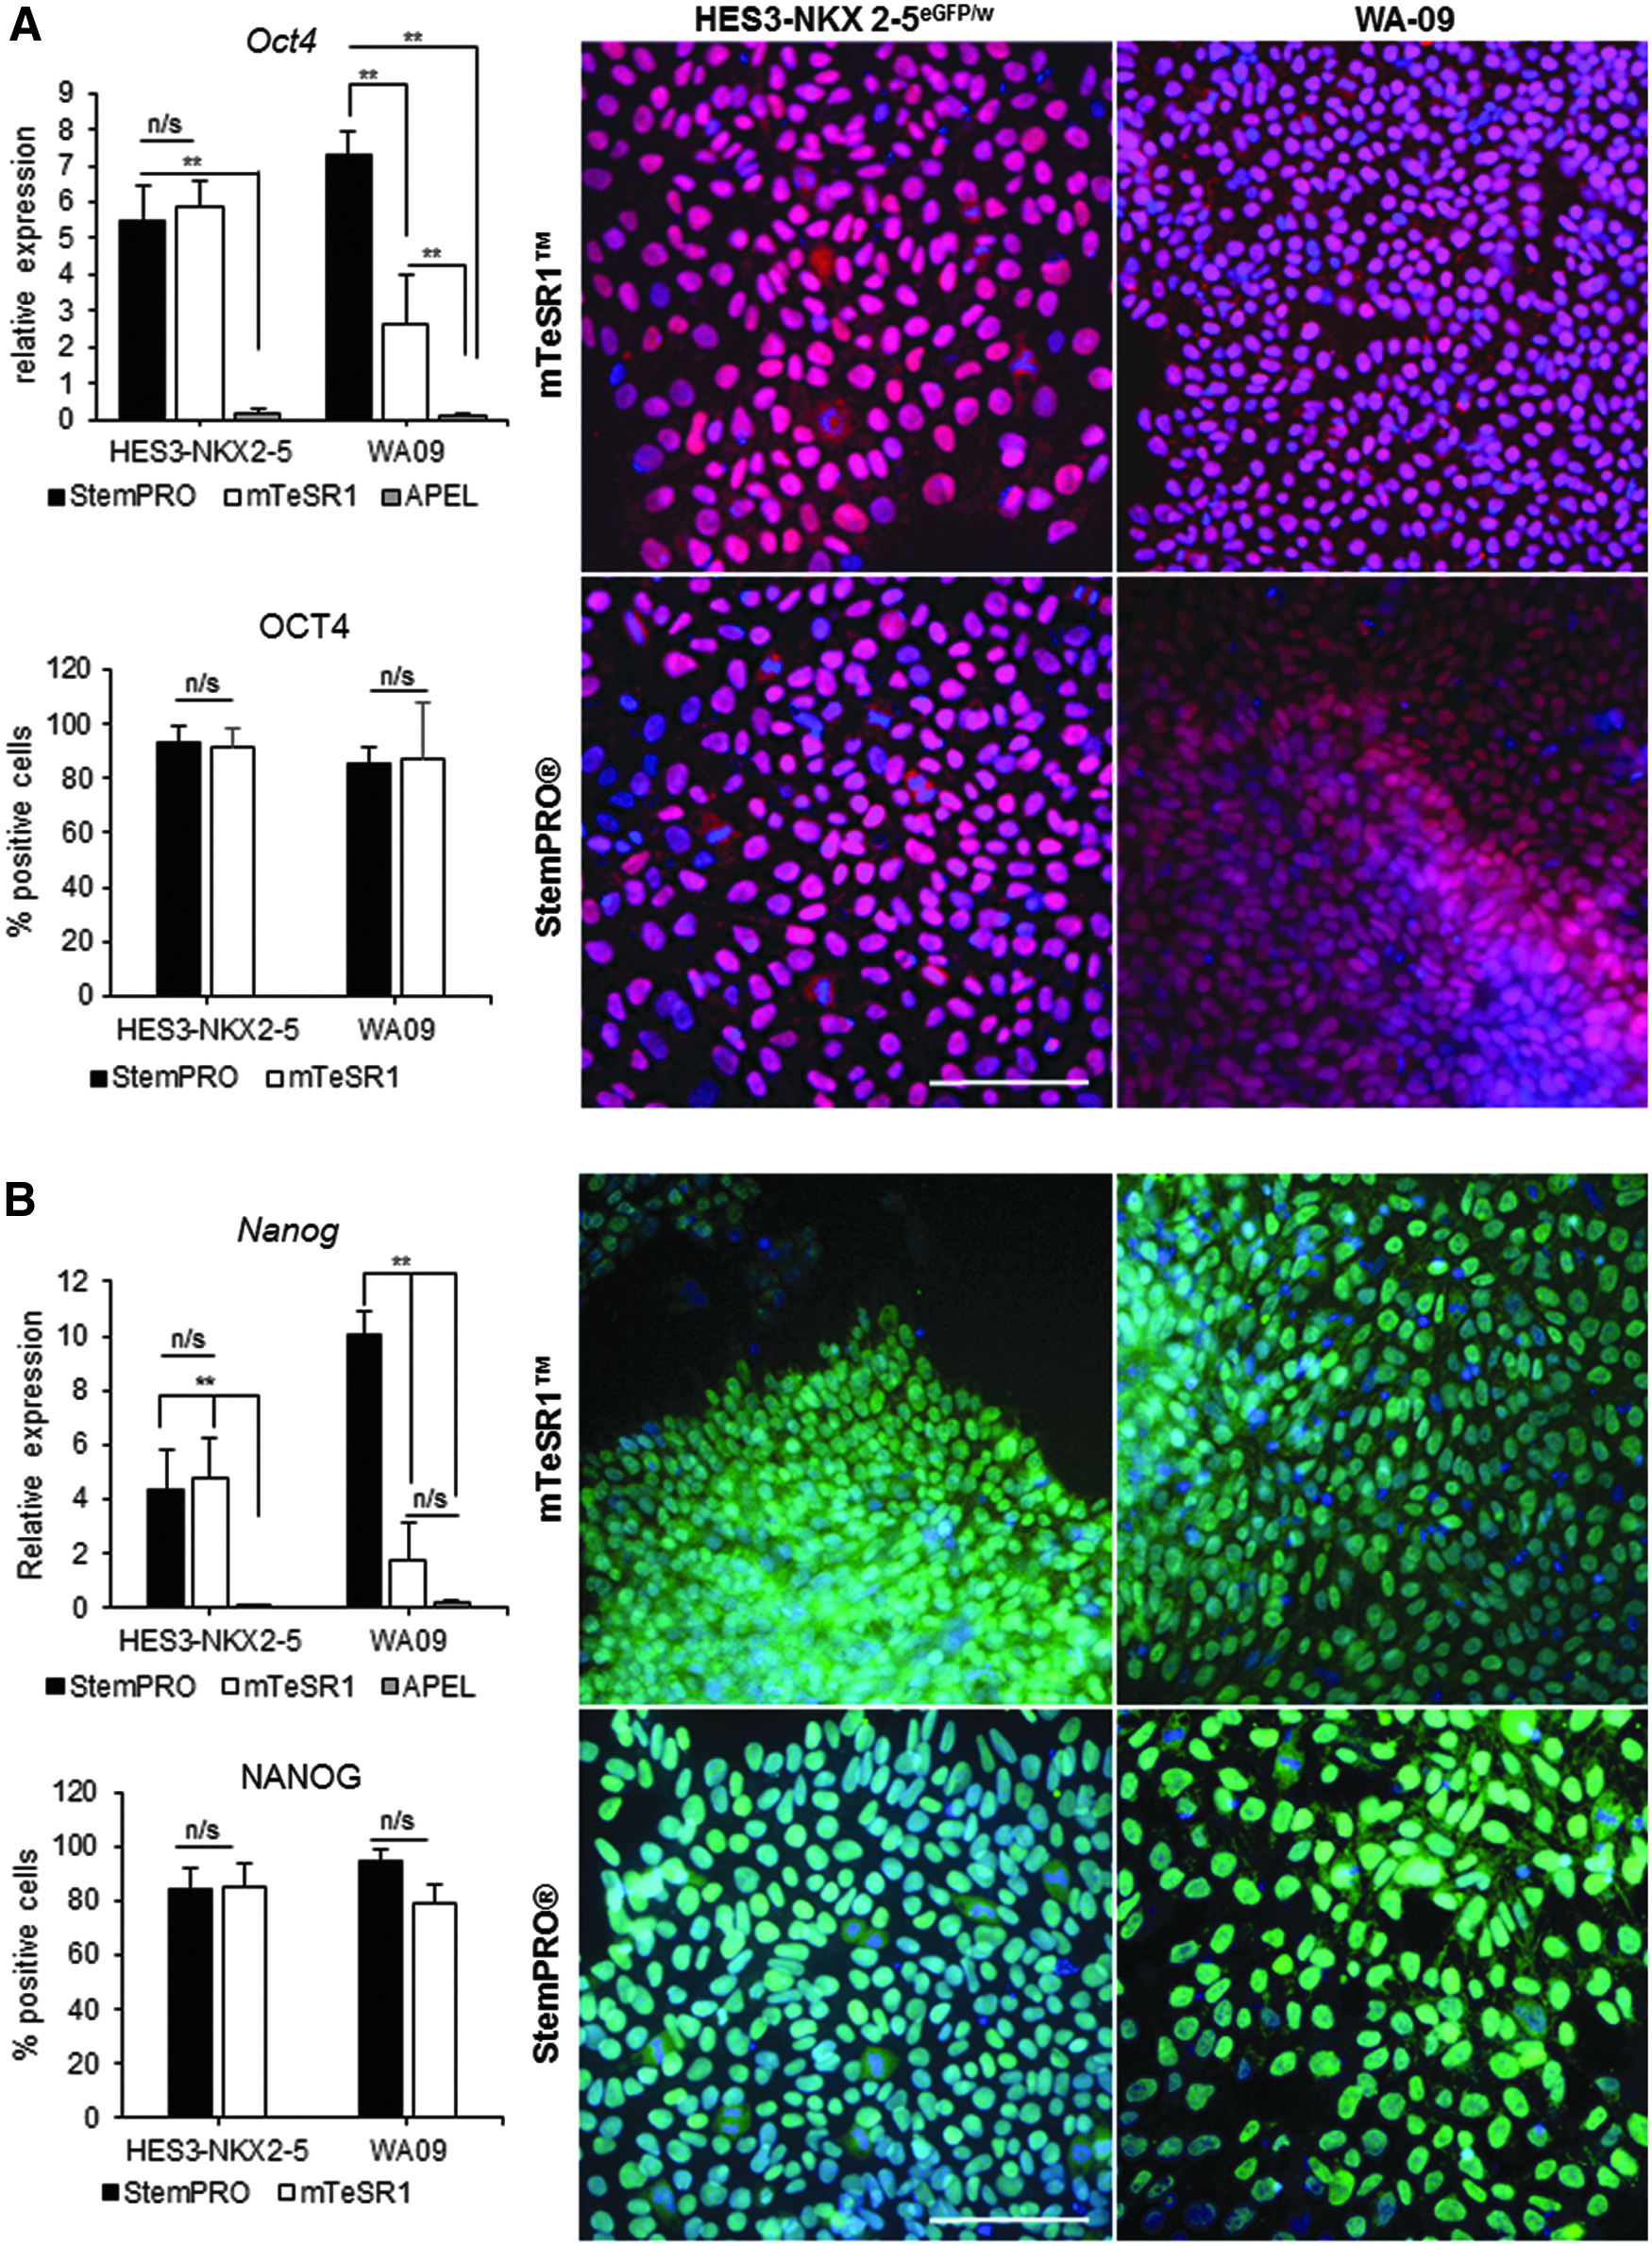
Characterization of pluripotency markers of hESC aggregates cultured with nanobridges. Relative gene expression, immunostaining, and quantification (against the nuclear marker Hoechst 33342) of positively stained day-18 aggregates, cultured with nanobridges, for HES3-NKX2-5eGFP/w and WA09 using pluripotent markers
Teratoma formation demonstrated that hESCs cultured with nanobridges retained their ability to differentiate into the three germ-line lineages (Supplementary Fig. S1; Supplementary Data are available online at
Discussion
In recent years, 3D cell culture technologies have rapidly advanced encompassing a number of different approaches, including scaffold cultures, microcarriers, and hydrogels. Although there are a variety of techniques for 3D cell culture, the appropriate method depends on the cell type and endpoint of the culture. 32
Currently, cell numbers from 2D cultures needed to meet therapeutic and pharmacological needs require cell factories and substrate coating for cell attachment which is labor-intensive and cumbersome. As an alternative, suspension cultures provide an attractive platform to produce high-quality hPSC cultures, while controlling and consistently monitoring environmental conditions to ensure reproducibility and robustness. These concepts motivated the development of 3D hPSC culture platforms33–36 to overcome fundamental issues impeding the routine use of hPSCs in drug development and therapeutic applications. In this study, we have provided a detailed methodology for use with our two-component thermoresponsive nanobridges conjugated to an ECM. 17
It has been reported that hPSCs become susceptible to apoptosis and are unable to grow and proliferate as single cells without matrices for attachment.37–39 Chemically synthesized recombinant peptides from laminin,8,40–42 vitronectin,23,43 arginylglycylaspartic acid,44,45 and fibronectin43,46,47 have been reported to maintain long-term proliferation of undifferentiated hESCs. We generated a fragment of an rFN for conjugation to the PNIPAM. While aggregates could form in the presence of rFN alone, we failed to get consistent disaggregation under mechanically applied shear. In addition, and in contrast to the nanobridge aggregates, much higher shear was required to dissociate the nonpolymer aggregates, thus confirming that the nanobridges perform a critical role in the dissociation.
Observations from our laboratory have consistently demonstrated that by the second passage, reaggregation without the nanobridges is impaired, resulting in the formation of smaller clumps instead of well-formed aggregates. In addition, we observed a decrease in cell viability following withdrawal of the nanobridges during passaging. We maintained the number of pipetting steps for disaggregation at a consistent number to create small clumps of cells. Data presented in this study reveal that while the nanobridges may not be critical in the initial creation of 3D aggregates, it is critical for both dissociation and reaggregation during passaging.
This method permits the proliferation of hPSCs, while maintaining core pluripotent markers and consistently high (>85%) cell viabilities, demonstrating an average of 19–35-fold increase over three passages, which is above that of concurrently run 2D cell cultures. 33 This observation in the difference in proliferation rate may be attributed to cell line preference for a particular ECM as a result of varying degrees of integrin subunit expression between cell lines. 23
Lei and Schaffer and Lin et al. both reported a 20-fold growth rate over a 5-day period using PNIPAM-PEG hydrogels in Essential 8™ medium.11,48 Data from Lei and Schaffer 11 showed fold expansion between p0 and p20 to be an average of ≈10-fold per passage. However, it was observed that their data demonstrated a 20-fold expansion between p20 and p21, which remained relatively constant at 20 per passage until the end of their cultures. In comparison, our fold expansion rate using the nanobridges with either mTeSR1 or StemPRO was between 6 and 11.7 per passage, numbers that are equivalent to Lei and Schaffer (p0-20).
Both Lei and Schaffer and Lin et al. utilized RI in their cultures, which has been shown to prevent apoptosis in dissociated hESCs and can significantly improve hPSC proliferation rates in suspension cultures.11,48,49 Lei and Schafer's data suggest that without RI, their fold increase significantly decreased to ≈2. When we increased the platform size from a 96-well to a 6-well platform, RI was added to hESC nanobridges in mTeSR1 cultures during aggregation; however, we found no benefit using RI as aggregates started clumping in static cultures (data not shown). This suggests that the use of rFN conjugated to the PNIPAM gives an advantage as cultures do not need the support RI provides.
Cost-effective, safe, functional, and robust methods are needed to generate large numbers of hPSCs for preclinical testing platforms, drug development, and clinical applications. These results bring the perspective of bulk hPSC production closer. However, it remains critical to continue optimizing the system toward large-scale production formats by demonstrating the feasibility of culturing hPSCs in bioreactors involving increasing volumes or titers. Studies involving the use of larger volumes in spinner flasks (50-mL) and expansion to higher volume cultures in a bioreactor (100–500-mL) will provide controlled process parameters, and will progress and benefit this work.
In summary, our study provides proof-of-concept that the nanobridge system is capable of supporting hESC culture and generating large numbers of cells for a range of hPSC lines required in clinical and therapeutic applications. This system could be further developed as a robust platform for use in a controllable automated system for mass production of quality cells, eliminating labor-intensive and time-consuming methods involved with adherent cultures.
Footnotes
Acknowledgments
The authors gratefully acknowledge the Stem Cells Australia, an ARC Special Research Initiative, StemCore production facility (QLD), The JEM Research Foundation, and The Merchant Charitable Foundation for their support and funding in this work. Z.J. acknowledges the financial support of ARC Future Fellowship. We thank E. Stanley and A. Elefanty, University of Melbourne, for the HES3-NKX2-5eGFP/w cell line.
Disclosure Statement
No competing financial interests exist.
References
Supplementary Material
Please find the following supplemental material available below.
For Open Access articles published under a Creative Commons License, all supplemental material carries the same license as the article it is associated with.
For non-Open Access articles published, all supplemental material carries a non-exclusive license, and permission requests for re-use of supplemental material or any part of supplemental material shall be sent directly to the copyright owner as specified in the copyright notice associated with the article.