




Abstract
Magnetic cell delivery system, termed as magnetic targeting, has been developed for minimal invasive cell transplantation. Cells are magnetically labeled with nano-sized iron particles. However, the temporal change in iron particles in vivo has not been clarified. In addition, the influence of magnetic resonance imaging (MRI) after magnetic targeting therapy has never been investigated. In this study, magnetically labeled bone marrow mesenchymal stem cells (MSCs) were injected into rabbit knee joint with an articular cartilage defect, with or without existence of the magnetic field (m-MSC group and MSC group). Phosphate-buffered saline was injected as a control. Articular cartilage defects were assessed by MRI using a 4.7 Tesla magnet at 1, 4, and 12 weeks after treatment. Articular cartilage defects were also evaluated using Safranin-O staining, type II collagen immunostaining, and Berlin blue staining at 1, 4, and 12 weeks after treatment. In the assessment using T2 mapping of MRI, the area of repaired tissues with T2 had a value similar to that for articular cartilage. This was significantly larger in the m-MSC group than that in the other groups at 12 weeks after treatment. Histological findings by Safranin-O staining and type II collagen immunostaining also revealed better cartilage repair in the m-MSC group than in the other groups. T2 mapping of MRI was, therefore, considered to successfully reflect the degree of cartilage repair. In contrast, T2* images of MRI showed hypointense areas in cartilage defects in the m-MSC group. The T2* hypointense area in the m-MSC group was significantly larger than that in the other groups at 1 and 4 weeks, but not at 12 weeks after treatment. In the histological assessment, iron particles stained with Berlin blue could be detected in repaired tissues at 1 and 4 weeks, but not at 12 weeks after treatment. The T2* hypointense area seems to indicate the existence of iron particles. These findings suggest that MRI can evaluate the regenerative process of cartilage with magnetic targeting and kinetics of ferucarbotran after magnetic targeting of MSCs. MRI can be used safely without inhibiting the cartilage repair, after magnetic targeting of MSCs.
Impact Statement
This study is very important as a preclinical study of magnetic resonance imaging (MRI) assessment after magnetic targeting of mesenchymal stem cells. The findings of this study show that MRI is useful for evaluating the regenerative process of cartilage with magnetic targeting and kinetics of iron particles, and is less invasive without any complications.
Introduction
Articular cartilage does not have blood circulation, it consists of a few cell components and abundant extracellular matrix, so that it can withstand the daily mechanical stress. However, once cartilage is damaged, it is difficult to repair, because it is arduous to supply nutrients and cells for repairing.
Several methods have been reported for cartilage repair, including bone-stimulating techniques.1–4
Recently, numerous studies reported the availability of amounts of mesenchymal stem cells (MSCs) for cartilage repair.5,6 In previous studies, MSCs were transplanted by various methods. 7 However, it has been observed that confining MSCs to a cartilage defect without a scaffold is difficult, and a large number of MSCs are needed to treat a cartilage defect. Intra-articular injection of MSCs was reported in studies in an animal model and a clinical trial.8,9 Intra-articular injection of MSCs enhanced cartilage repair in a dose-dependent manner. 10 But excess use of the injection caused formation of intra-articular loose bodies. 11 For effective and safe treatment, appropriate dose of MSCs should be injected into the joint and accumulated into the cartilage lesion.
Magnetic cell delivery system, termed magnetic targeting, was developed for minimally invasive and safe treatment. 12 In this system, MSCs were labeled with nano-sized super paramagnetic iron oxide (SPIO) particles (ferucarbotran). Labeled cells with SPIO does not inhibit function or differentiation capacity. 13 Injected MSCs can be controlled and delivered to the lesions by magnetic force. Our previous study demonstrated the delivery of magnetically labeled mesenchymal stem cells (m-MSCs) into an osteochondral defect using a magnetic field. The results obtained showed good repair of the defects. 14 A first-in-human clinical trial of MSC magnetic targeting for articular cartilage defect was also reported. 15
Recently, quantitative magnetic resonance imaging (MRI) techniques to understand the profound regenerative process and kinetics of various cells as they occur in living animals have been developed.16,17 SPIO particles have been clinically used as an MRI contrast agent and also for in vivo cell tracking. 18 MRI was, therefore, used for the assessment of SPIO kinetics in the knee joint in this study. However, magnetic field during an MRI scan might move the transplanted m-MSCs from the lesion and negatively affect cartilage repair after MSC magnetic targeting. The influence of MRI on cartilage repair after MSC magnetic targeting is important for the safety of treatment for clinical application.
The purpose of this study was to evaluate cartilage repair using MRI after MSC targeting and clarify the in vivo kinetics of SPIO particles and the influence of MRI on cartilage repair process after MSC targeting.
Materials and Methods
The protocol for this study was approved by the Committee of Research Facilities for Laboratory Animal Science (Graduate School of Biomedical and Health Sciences, Hiroshima University, Hiroshima, Japan). All animal experiments were carried out in accordance with the guidelines for animal experimentation.
Preparation of MSCs
Cell isolation and in vitro expansion of bone marrow-derived MSCs were performed according to the methods described in a previous study. 19 In brief, 2.5–2.9 kg Japanese white rabbits were anesthetized with an intravenous injection of xylazine (3 mg/kg) and ketamine (10 mg/kg). Bone marrow (9 mL) was aspirated from the iliac crest with 1 mL of heparin using an 18-gauge needle. The bone marrow aspirate was centrifuged for 5 min at 420g, and the resulting supernatant, including heparin sodium, was discarded. The extract was resuspended in 2 mL of culture medium comprising Dulbecco's modified Eagle's medium (Gibco BRL, Carlsbad, CA) supplemented with 10% fetal bovine serum (Sigma-Aldrich Corp, St Louis, MI) and 1% antibiotics (penicillin, streptomycin, and fungizone; BioWhittaker, Walkersville, MD). Then, 2 mL of the suspension was seeded onto 100-mm culture dishes, and 8 mL of the culture medium was added to each dish. The dishes were incubated under a humidified atmosphere at 5% carbon dioxide and 37°C. The medium was not changed for the first 5 days, and then it was changed every 3 days thereafter. The cells proliferated and reached confluence ∼2 weeks after seeding. The cells were then harvested by treatment with 0.25% trypsin. To expand the MSCs, 3 × 10⁵–5 × 10⁵ of the harvested cells were seeded onto 100 mm culture dishes. On reaching confluence again, the cells were reseeded under the same conditions. Cells at passage 2 were used in this study. MSCs were magnetically labeled in accordance with a previous study. 14 After culture for 2 weeks, ferucarbotran (Resovist®; FUJIFILM RI Pharma Co., Ltd., Tokyo, Japan) was added to the culture medium (97.5 μg Fe/mL) and incubated for 12 h. Uptake of iron particles into the cytoplasm of MSCs was confirmed by microscopy. The m-MSCs were then washed twice with phosphate-buffered saline (PBS; Wako Pure Chemical Industries Ltd., Osaka, Japan) before injection.
Animal model and creation of a cartilage defect
Thirty-nine Japanese white rabbits (female, 2.5–2.9 kg each) were anesthetized by an intravenous injection of xylazine (3 mg/kg) and ketamine (10 mg/kg). The medial parapatellar approach was used to expose the knee joint. Osteochondral defect (diameter 2 mm; depth 1 mm) was created in the center of the right medial femoral condyle with a cylindrical punch. Immediately after surgery, the rabbits received treatments. They were divided into three groups: in the m-MSC group, 1 × 10⁶ of m-MSCs were injected into the osteochondral defect area in the presence of a magnetic field generated by a 1 Tesla neodymium magnet for 10 min; in the nonlabeled MSCs group (MSC group), 1 × 10⁶ of MSCs were injected directly into the osteochondral defect area with a magnetic field; and in the control group (Control group), only PBS was injected directly into the osteochondral defect area. In each group, MRI was performed at 1, 4, and 12 weeks without sacrifice after treatment. Besides, three rabbits were sacrificed at 1 week, and five rabbits were sacrificed at 4 and 12 weeks after treatment in each group just after MRI scan for the histological assessment.
Magnetic resonance imaging
MRI of both knees was performed using a 4.7 Tesla superconducting magnet system (BioSpec47/40USR; Bruker BioSpin, Ettlingen, Germany), with a combination of transmit quadrature volume coil (154 mm inner diameter) and 30 mm receiver surface coil. The rabbits were anesthetized with sustained inhalation of 2.0% isoflurane. Thereafter, they were placed on the animal bed in a supine position, with knees extended and fixed using a dedicated device, held on the inside of the magnet center. The sagittal magnetic resonance (MR) sequence consisted of rapid acquisition with refocused echoe images (repetition time [TR]: 2000 msec, echo time [TE]: 7.4 msec, rare factor: 6, flip angle [FA]: 90–180°, matrix: 256 × 256, field of view [FOV]: 35 × 35 mm, thickness: 1 mm, number of slices: 10, number of average: 12, and acquisition time: 12 min 48 sec); T2*-weighted gradient recalled echo images (TR: 500 msec, TE: 11 msec, FA: 30, matrix: 256 × 256, FOV: 35 × 35 mm, thickness: 1 mm, number of slice: 10, number of average: 7, acquisition time: 10 min 2 sec) and multislice multiecho images with spine echo technique (TR: 1800 msec, TE: 9.3–93.0 msec with interval 9.3 msec, FA: 90–180°, matrix: 256 × 256, FOV: 35 × 35 mm, thickness: 1 mm, number of slices: 10, number of average: 2, and acquisition time: 15 min 22 sec) were obtained. Imaging analysis for T2 mapping was performed according to the methods described in a previous study. 17 T2-calculated maps were generated using three-dimensional image analysis software program (VirtualPlace; AZE, Tokyo, Japan). For T2 measurements, the region of interest (ROI) was drawn manually at the knee cartilage on the healthy side and over the whole osteochondral defected area. T2* images were analyzed according to the methods described in the previous study, with dedicated image processing software (ImageJ, National Institutes of Health, Bethesda, MD). 20 Total area of the transplanted m-MSCs was measured as hypointense areas in the intra-articular cavity.
Macroscopic and histological analyses
After MRI, the rabbits were sacrificed at 1, 4, and 12 weeks, and excised at distal femur, then femoral condyles were initially examined macroscopically using macroscopic scoring system that was previously developed (gross grading scale). 21 The samples were fixed in 4% paraformaldehyde phosphate-buffered solution (Wako Pure Chemical Industries Ltd.) for 48 h. These samples were decalcified with ethylenediaminetetraacetic acid solution and embedded in paraffin blocks, which were cut into 5-μm sections along the axial plane, deparaffinized, and hydrated. For the histological assessment, the sections were stained with hematoxylin and eosin and Safranin-O. For immunohistochemical staining with antibodies against type II collagen, the sections were incubated with 10% antigen retrieval reagent (Immunoactive; Matsunami Glass Ind., Ltd., Osaka, Japan) in PBS. The slides were blocked in hydrogen peroxide solution (3% H2O2) for 10 min, followed by washing with PBS. These were incubated overnight with primary antibodies at 4°C. The antibody reaction procedures were followed by a treatment with an avidin-conjugated peroxidase (Vectastain ABC-Elite Lit; Vector Laboratories, Burlingame, CA), and then visualization was performed using a 3,3′-diaminobenzidine substrate kit (Vector Laboratories). Each sample at 4 and 12 weeks was stained with antibodies against type II collagen and graded according to the histological grading score (Wakitani score) for cartilage regeneration. 22 Samples were scored separately and independently by two experienced orthopaedic surgeons, who were blinded to the surgical information and each other's scores.
Statistical analysis
The results are expressed as median (interquartile range). Statistical comparisons among multiple groups were evaluated by the Kruskal–Wallis test, and a pair-wise comparison was performed using the Steel–Dwass post hoc test. A p-value <0.05 was considered to indicate a statistically significant difference.
Results
Macroscopic examination
In the control group, there were no significant changes at the defect area. In the m-MSC and MSC groups, defect areas were filled with the passage of time (Fig. 1). At 12 weeks after treatment, in the MSC group, white fibrous tissues were seen in the osteochondral defect area; in contrast in the m-MSC group, the defect area's border and whitening of repaired tissues resembled the surrounding native hyaline cartilage. On macroscopic scoring, there was no significant difference among the three groups at 1 and 4 weeks after treatment (1 week: m-MSC 7.0 [5.0, 7.5], MSC 3 [2.5, 3.5], and control 3.0 [1.0, 3.5]; m-MSC and MSC p = 0.2, m-MSC and control p = 0.1, and MSC and control p = 0.7; 4 week: m-MSC 9.0 [8.0, 16.0], MSC 6 [5.0, 7.0], and control 5.0 [5.0, 6.0]; m-MSC and MSC p = 0.1, m-MSC and control p = 0.06, and MSC and control p = 0.45). At 12 weeks after treatment, the score in the m-MSC group was significantly better than those in the other groups (m-MSC 12.0 [9.0, 13.0], MSC 8.0 [4.0, 8.0], and control 3.5 [2.3, 4.0]; m-MSC and MSC p ≤ 0.05, m-MSC and control p ≤ 0.01, and MSC and control p = 0.2) (Table 1).
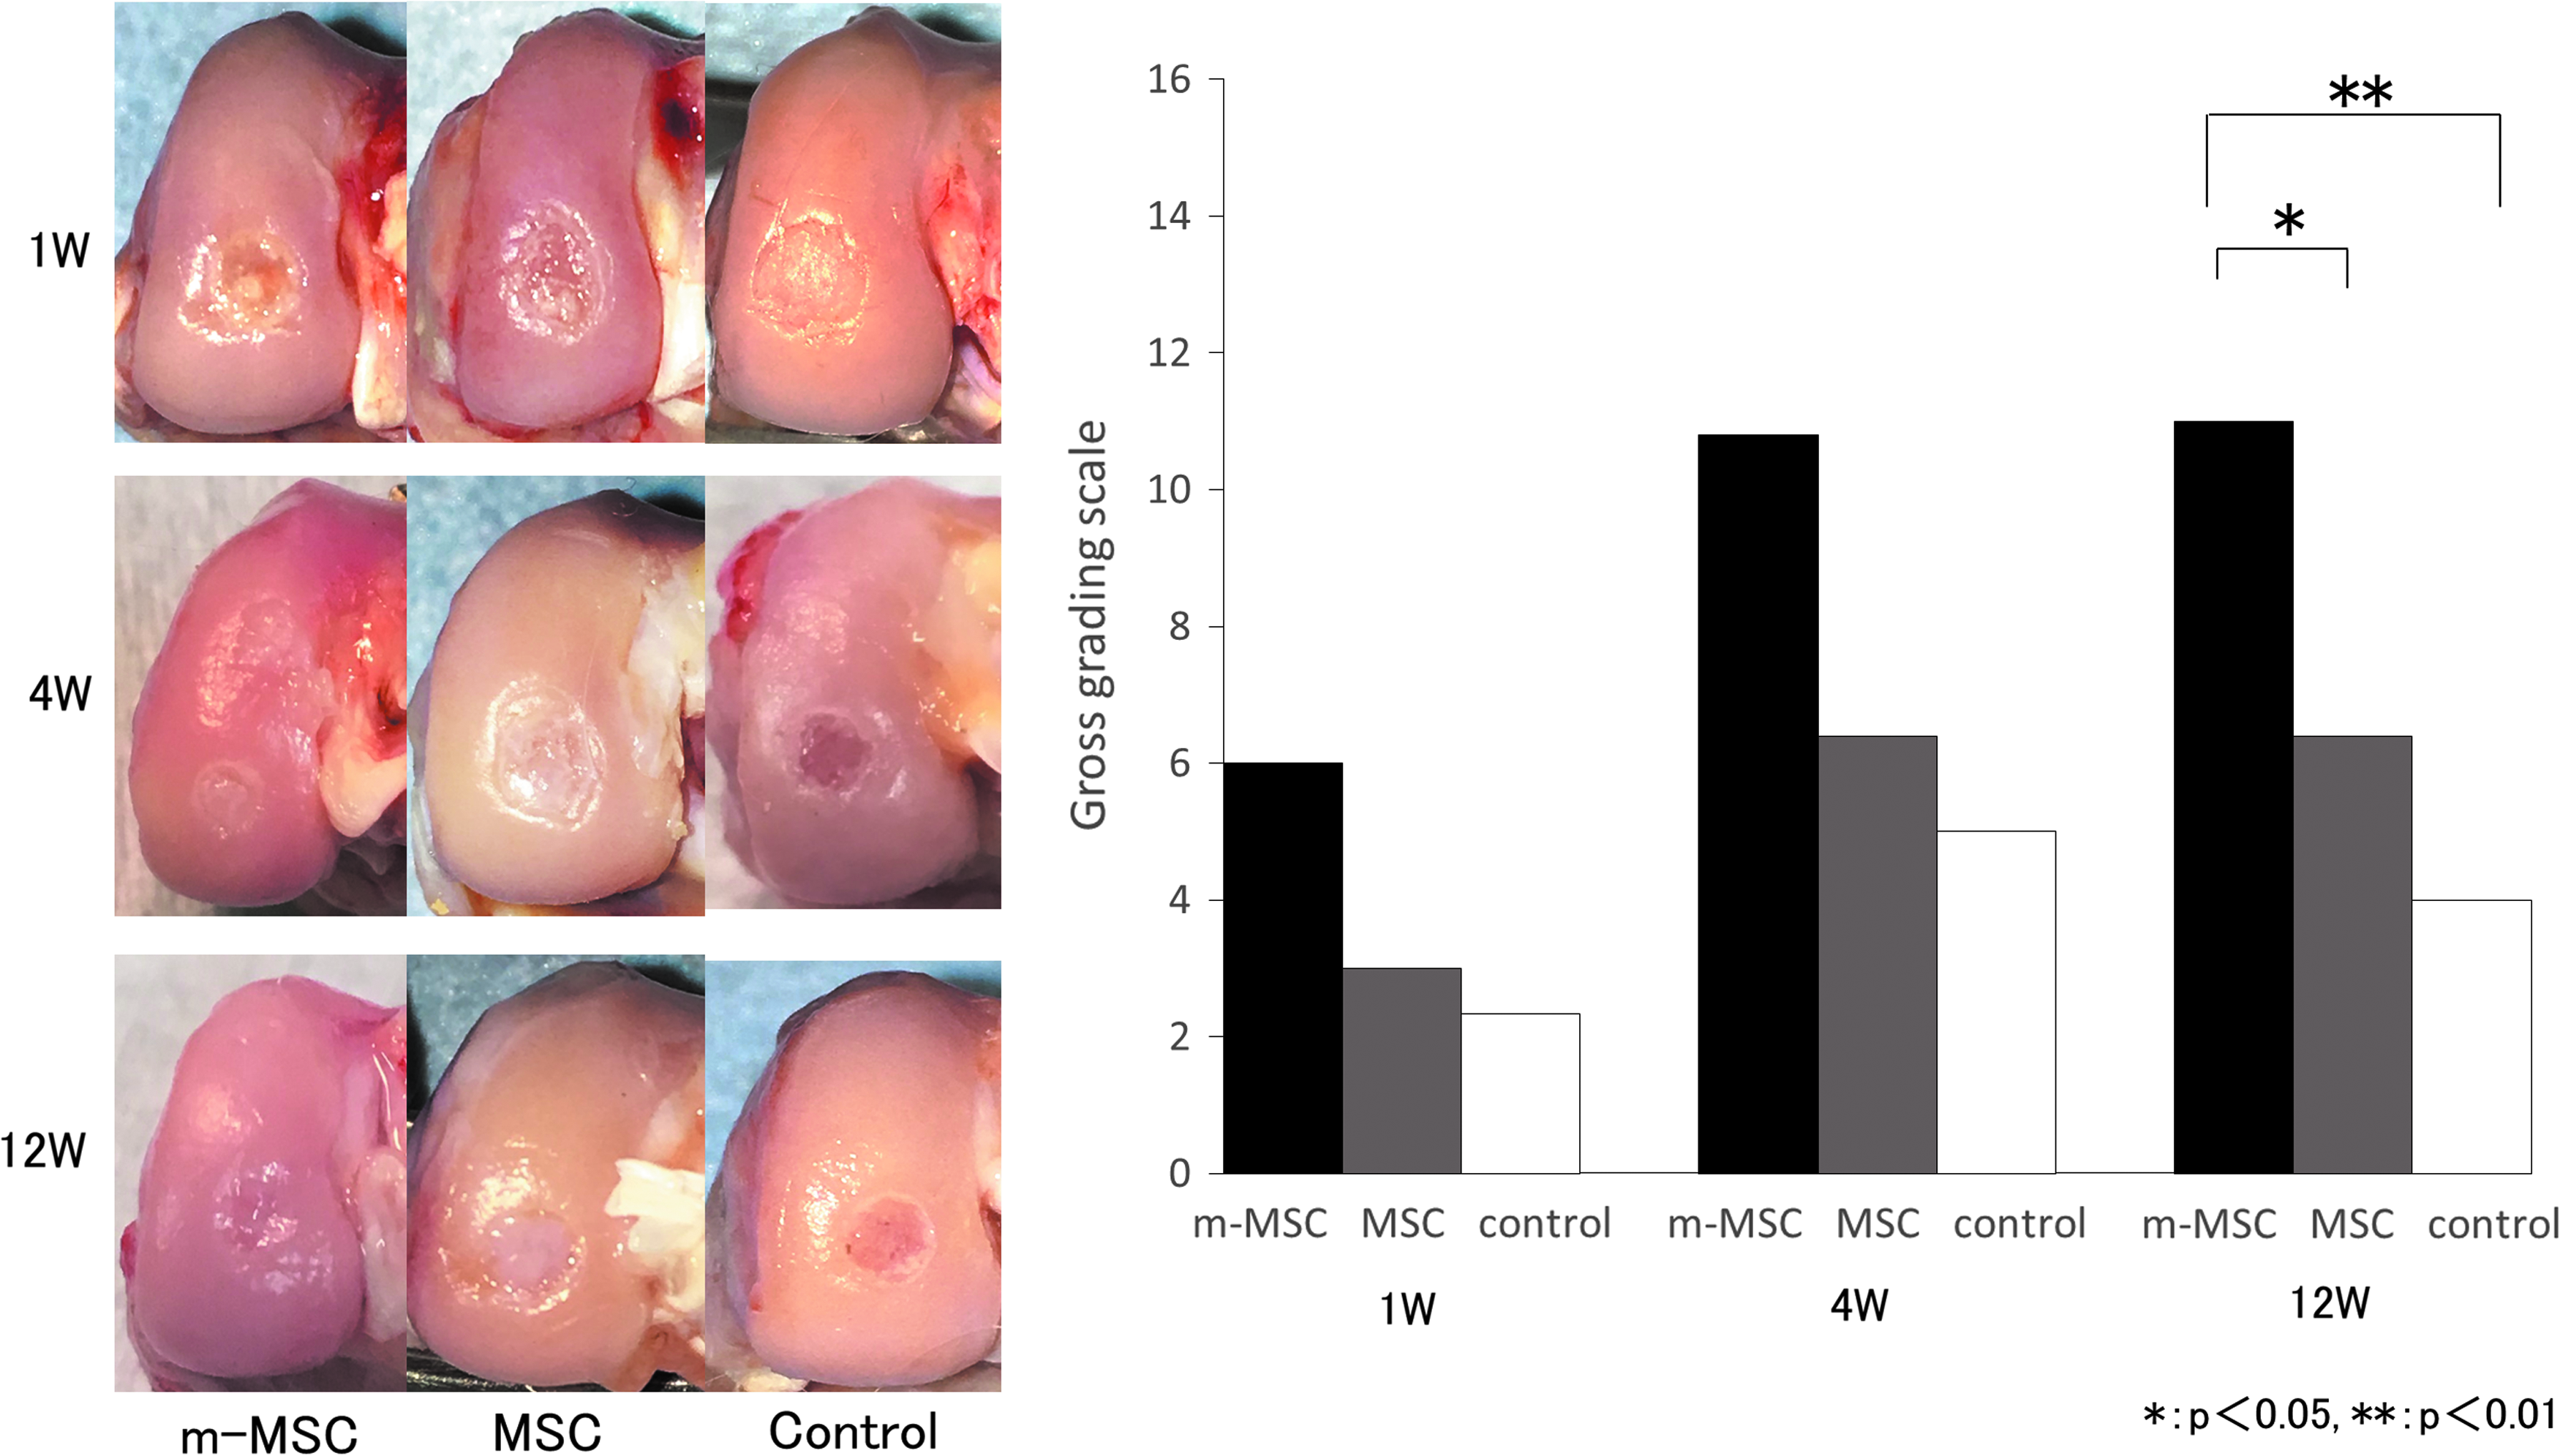
Macroscopic findings of repairing the osteochondral defect area of the m-MSC, MSC, and control groups. In the m-MSC group, the defect area was filled with the passage of time. The defect area's border and whitening of tissues were almost normal at 12 weeks. In the MSC group, the defect area was filled with white fibrous tissues with the passage of time. In the control group, there were no significant changes at the defect area. Gross grading scale for macroscopic evaluation at 12 weeks in the m-MSC group were considerably improved. MSC, mesenchymal stem cell; m-MSC, magnetically labeled mesenchymal stem cell.
Each Parameter of 1-, 4-, and 12-Week of Three Groups
The values represent the median (interquartile range).
MSC, mesenchymal stem cell; m-MSC, magnetically labeled mesenchymal stem cell.
Histological and immunohistochemical evaluations
In the m-MSC group, osteochondral defects were filled by tissues different from those of normal cartilage and subchondral cells (Fig. 2B, C). At 4 weeks after treatment in the m-MSC group, the osteochondral defects were covered by hyaline-like cartilage. However, the surface of the cartilage was irregular (Fig. 2D, E). At 12 weeks after treatment in the m-MSC group, the defect areas were completely filled by repair tissues resembling hyaline cartilage, and the surface was smooth. In contrast, in the MSC group, the osteochondral defects were filled with fibrous tissues by 12 weeks (Fig. 2G, H).

Histological and immunohistochemical assessments of the repaired tissues at 1, 4, and 12 weeks. Histological and immunohistochemical findings of normal cartilage as control images
Immunohistochemical staining of collagen type II showed the superficial layer regenerated with hyaline-like cartilage in the m-MSC group, whereas fibrous tissue was seen in the MSC and control groups (Fig. 2F, I).
A semiquantitative histological evaluation was scored according to the Wakitani score. At 4 weeks after treatment, the score in the m-MSC group was significantly better than that in the control group (m-MSC 4.0 [3.0, 4.0], MSC 8.0 [6.0, 11.0], and control 9.0 [8.0, 11.0]; m-MSC and MSC p = 0.3, m-MSC and control p ≤ 0.05, and MSC and control p = 0.4) (Fig. 2J). In addition, the score in the m-MSC group was significantly better than those in the other groups at 12 weeks after treatment (m-MSC 3.0 [1.0, 3.0], MSC 6.0 [6.0, 8.0], and control 11.0 [11.0, 12.0]; m-MSC and MSC p ≤ 0.05, m-MSC and control p ≤ 0.001, and MSC and control p ≤ 0.05) (Fig. 2K).
Berlin blue staining showed that there were many intracytoplasmic iron particles at the osteochondral defect in the m-MSC group and they decreased with the passage of time and disappeared at 12 weeks after treatment (Fig. 3).
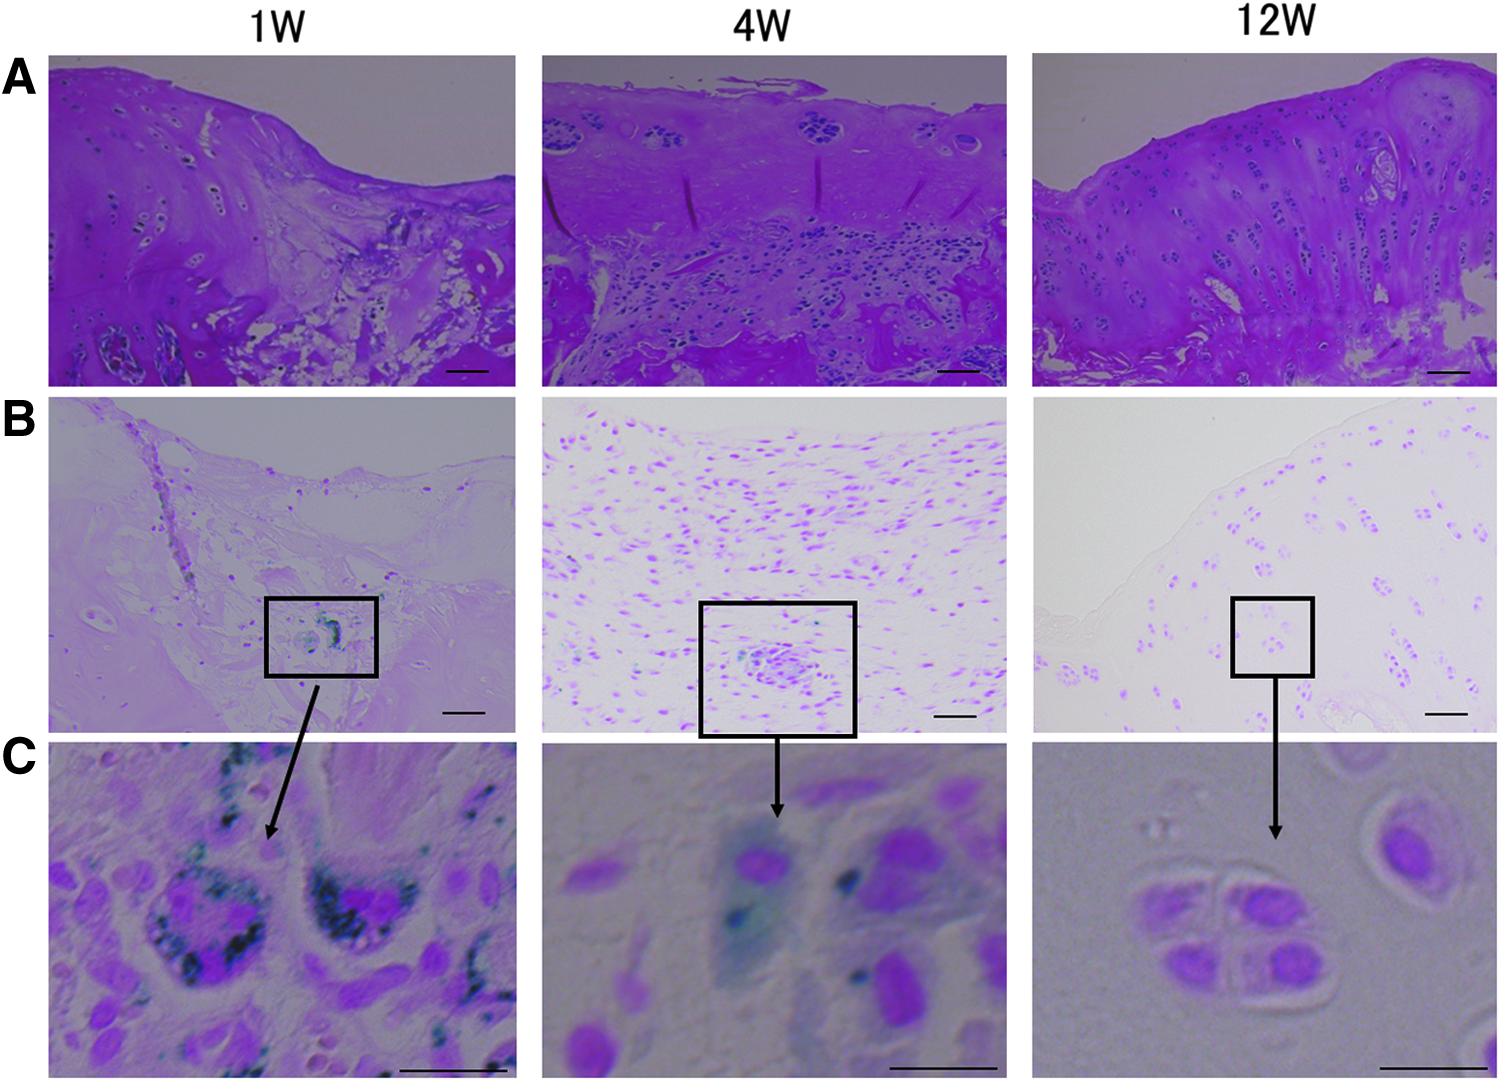
Histological and T2* image assessments of the m-MSC group at 1,4, and 12 weeks.
MRI assessment
Proton density weighted (PDW) images of the osteochondral defect area showed that they were filled with some tissues in the m-MSC and MSC groups (Fig. 4A). T2 mapping showed a colored area, indicating cartilage-like tissue, at a region consistent with the osteochondral defect areas (Fig. 4B). The mean T2 values of the colored area were not significantly different among the three groups (Table 1). However, the colored area in the MSC group was significantly larger than that in the control group, at 12 weeks after treatment. In addition, the colored area in the m-MSC group was significantly larger than those in the other groups, at 12 weeks after treatment (Fig. 5). On the T2* images, there were hypointense areas indicating the existence of ferucarbotran, at a region consistent with the defect areas in m-MSC group at 1 and 4 weeks (Fig. 6A).
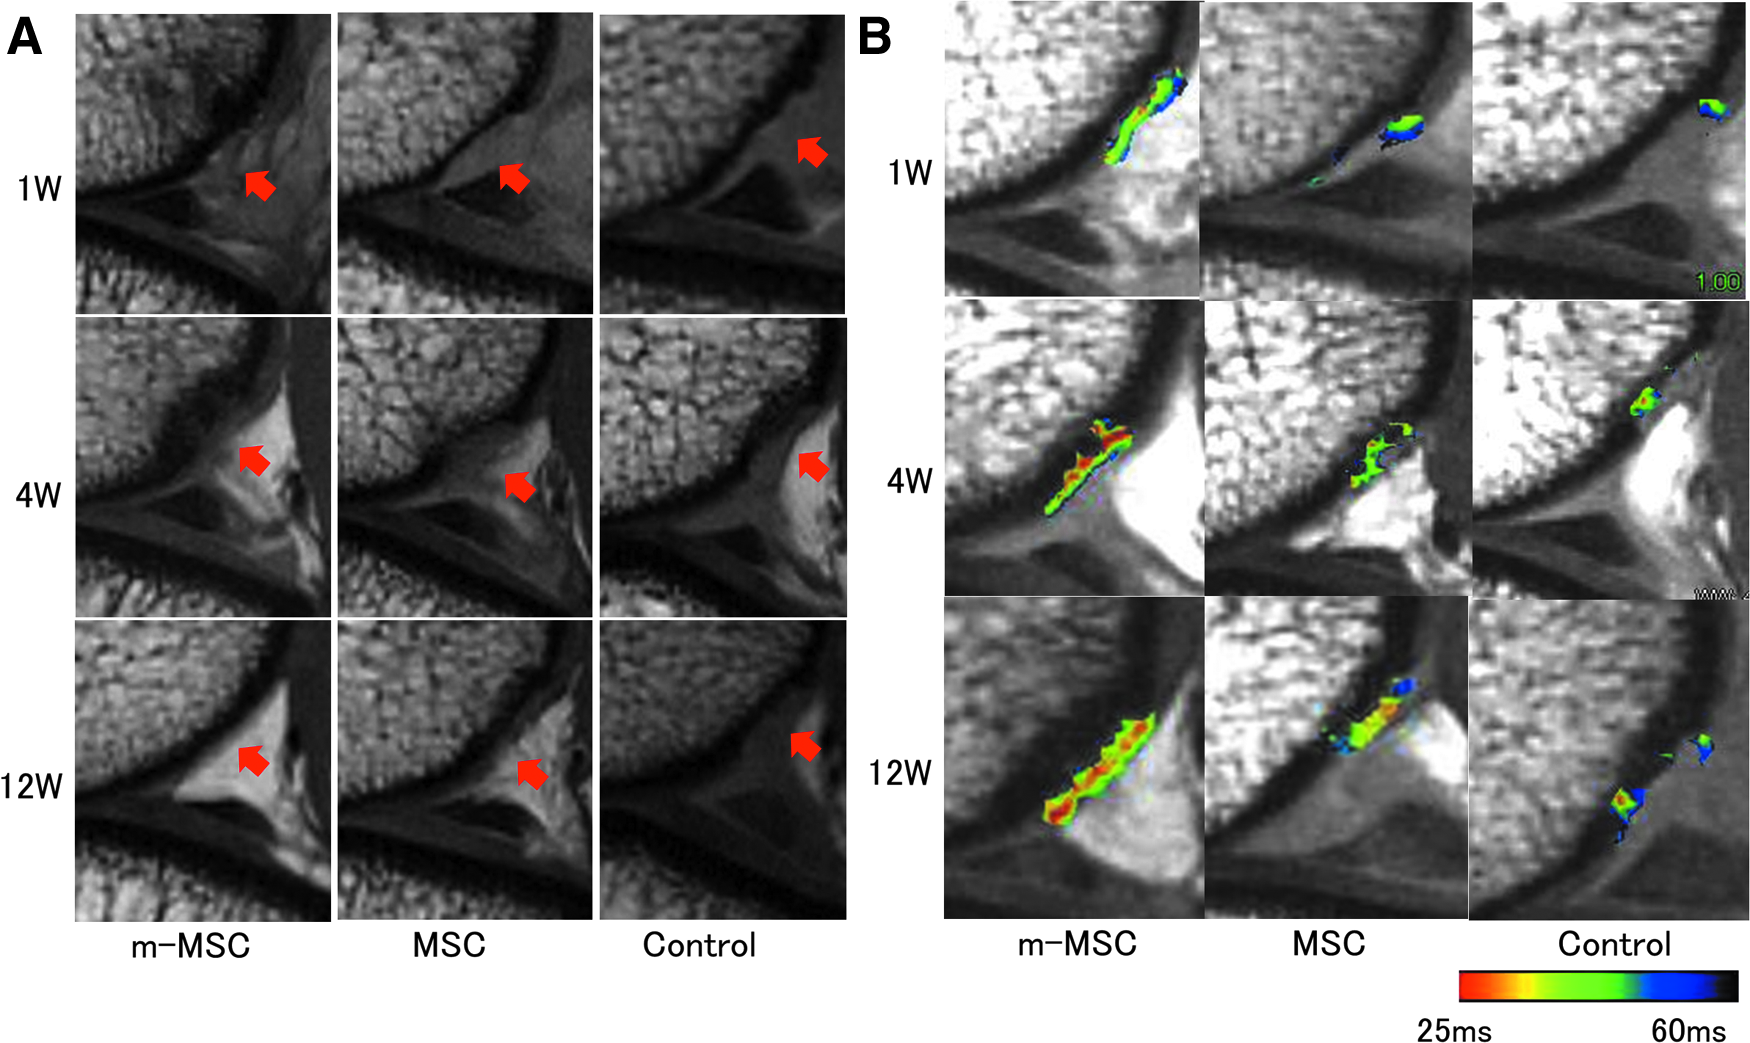
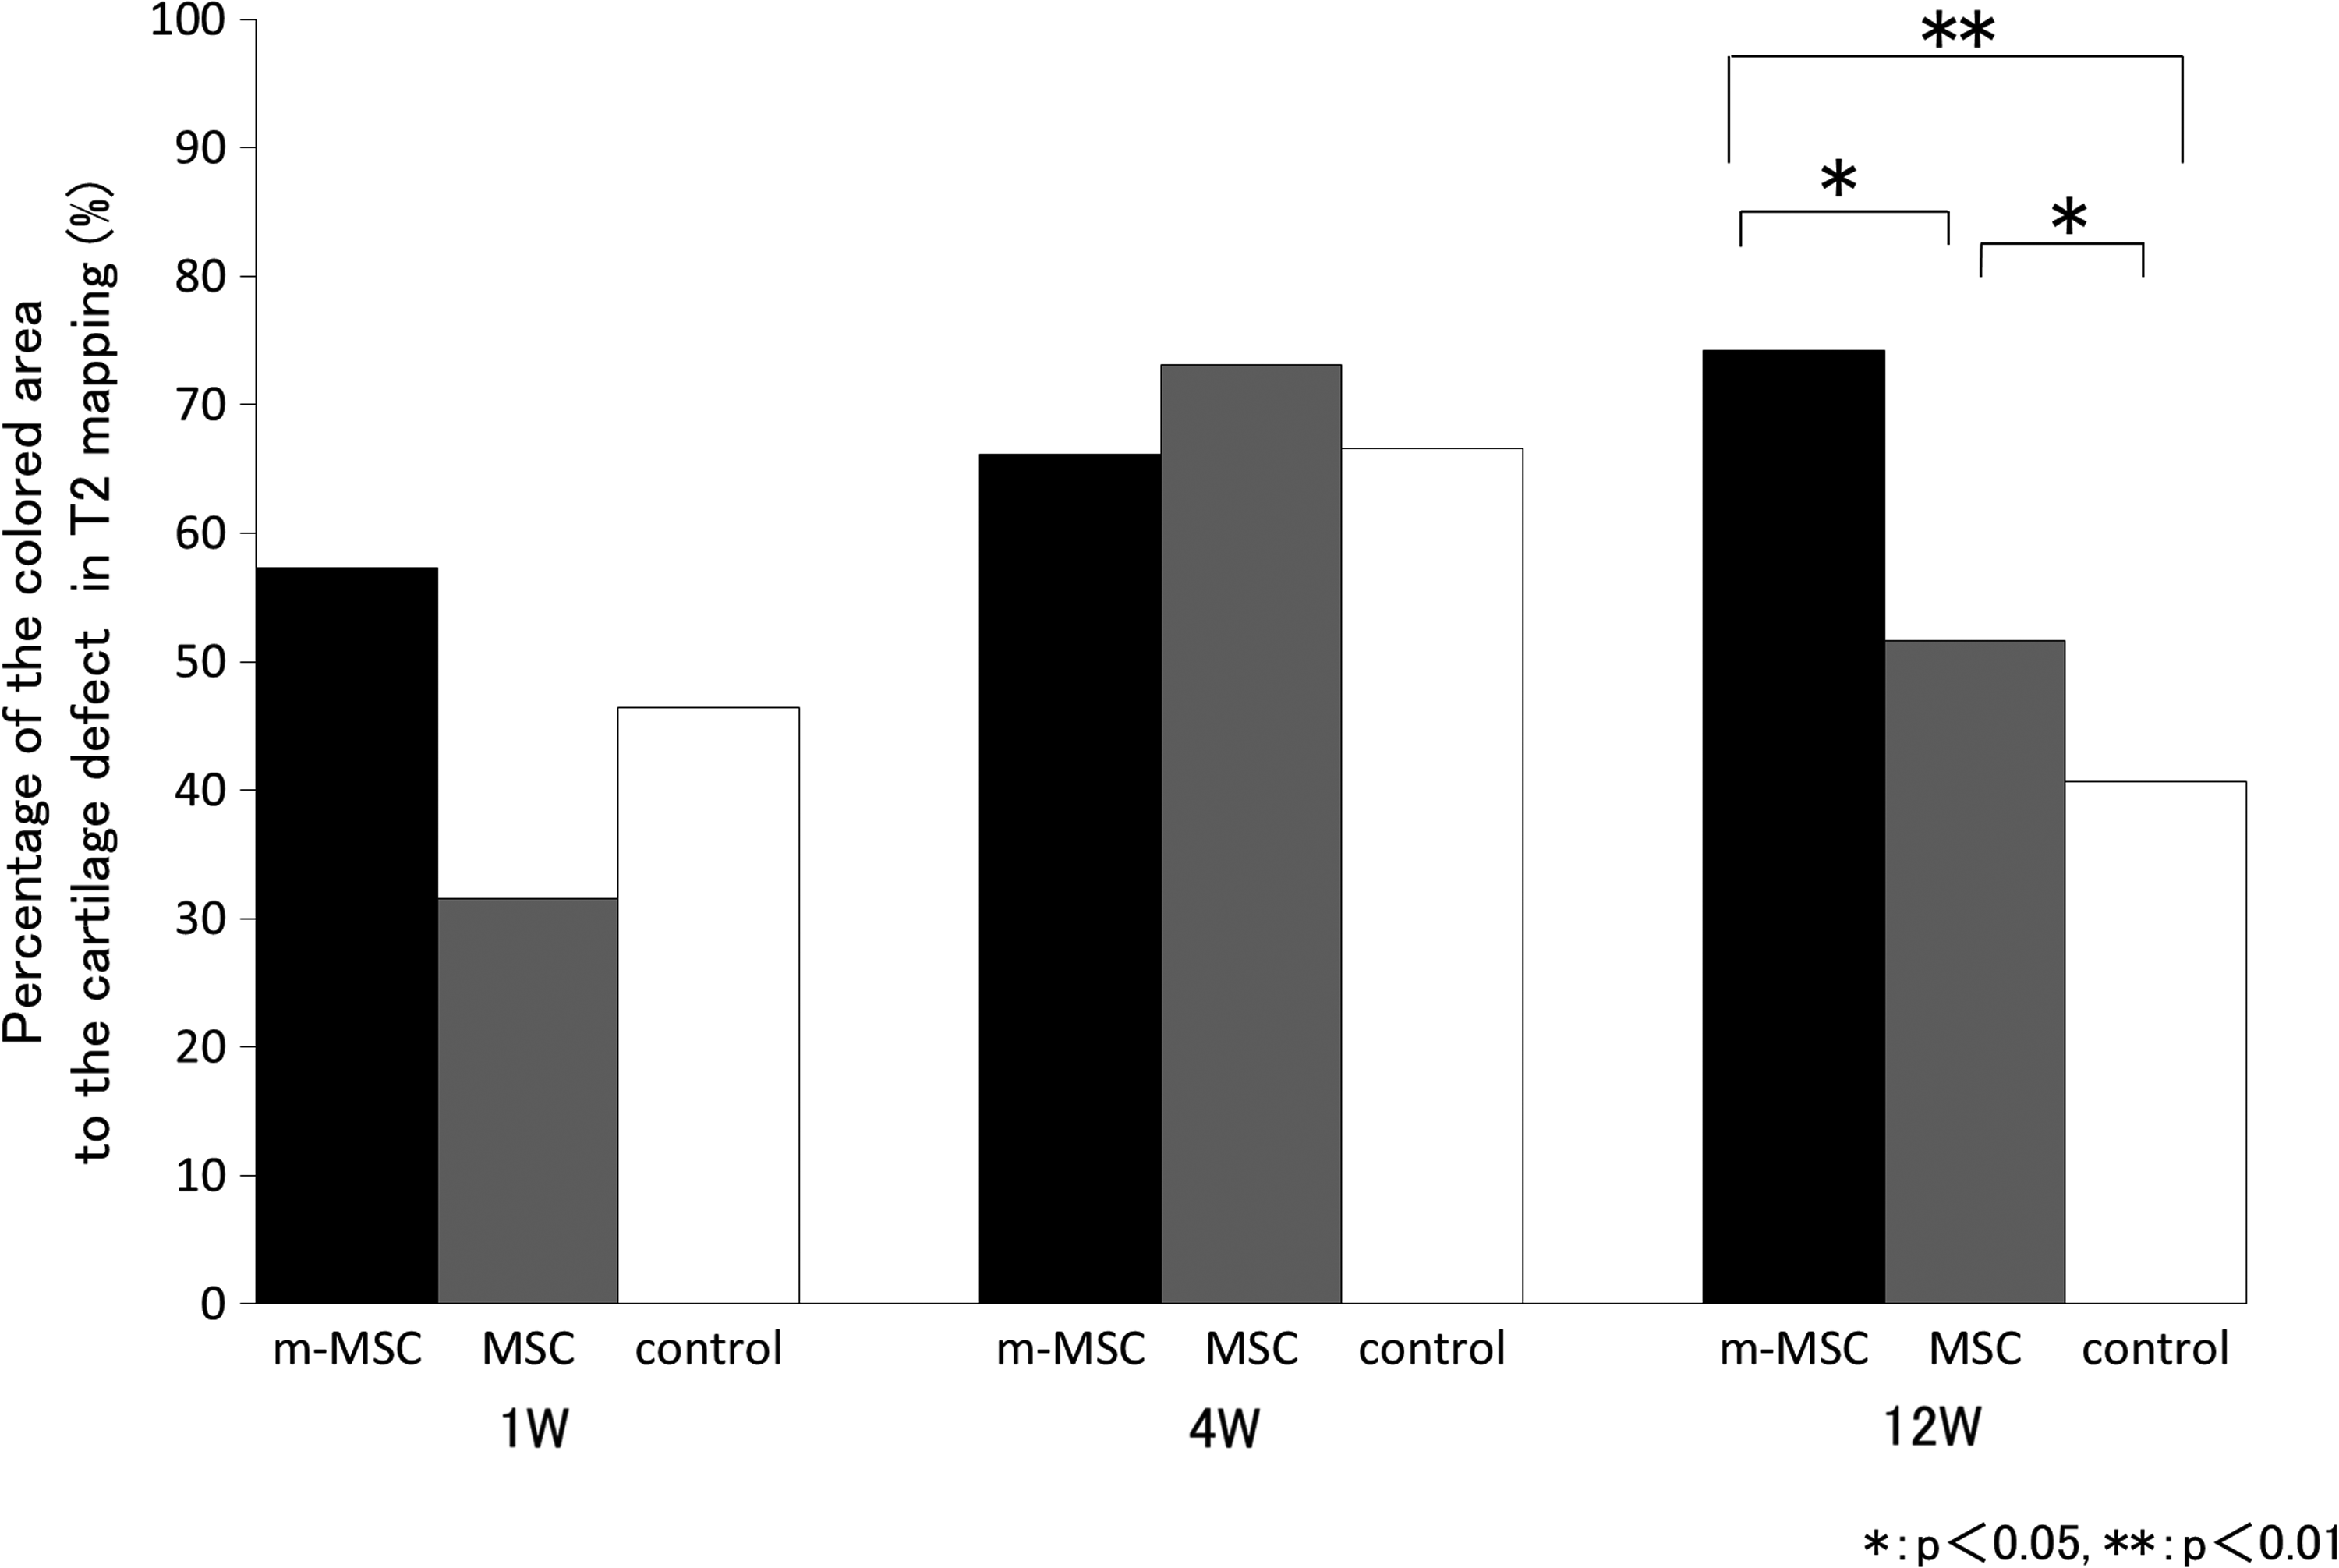
Percentage of the colored area to the cartilage defect in T2 mapping. At 12 weeks, percentage difference was significantly higher in the m-MSC group (*p < 0.05, **p < 0.01).
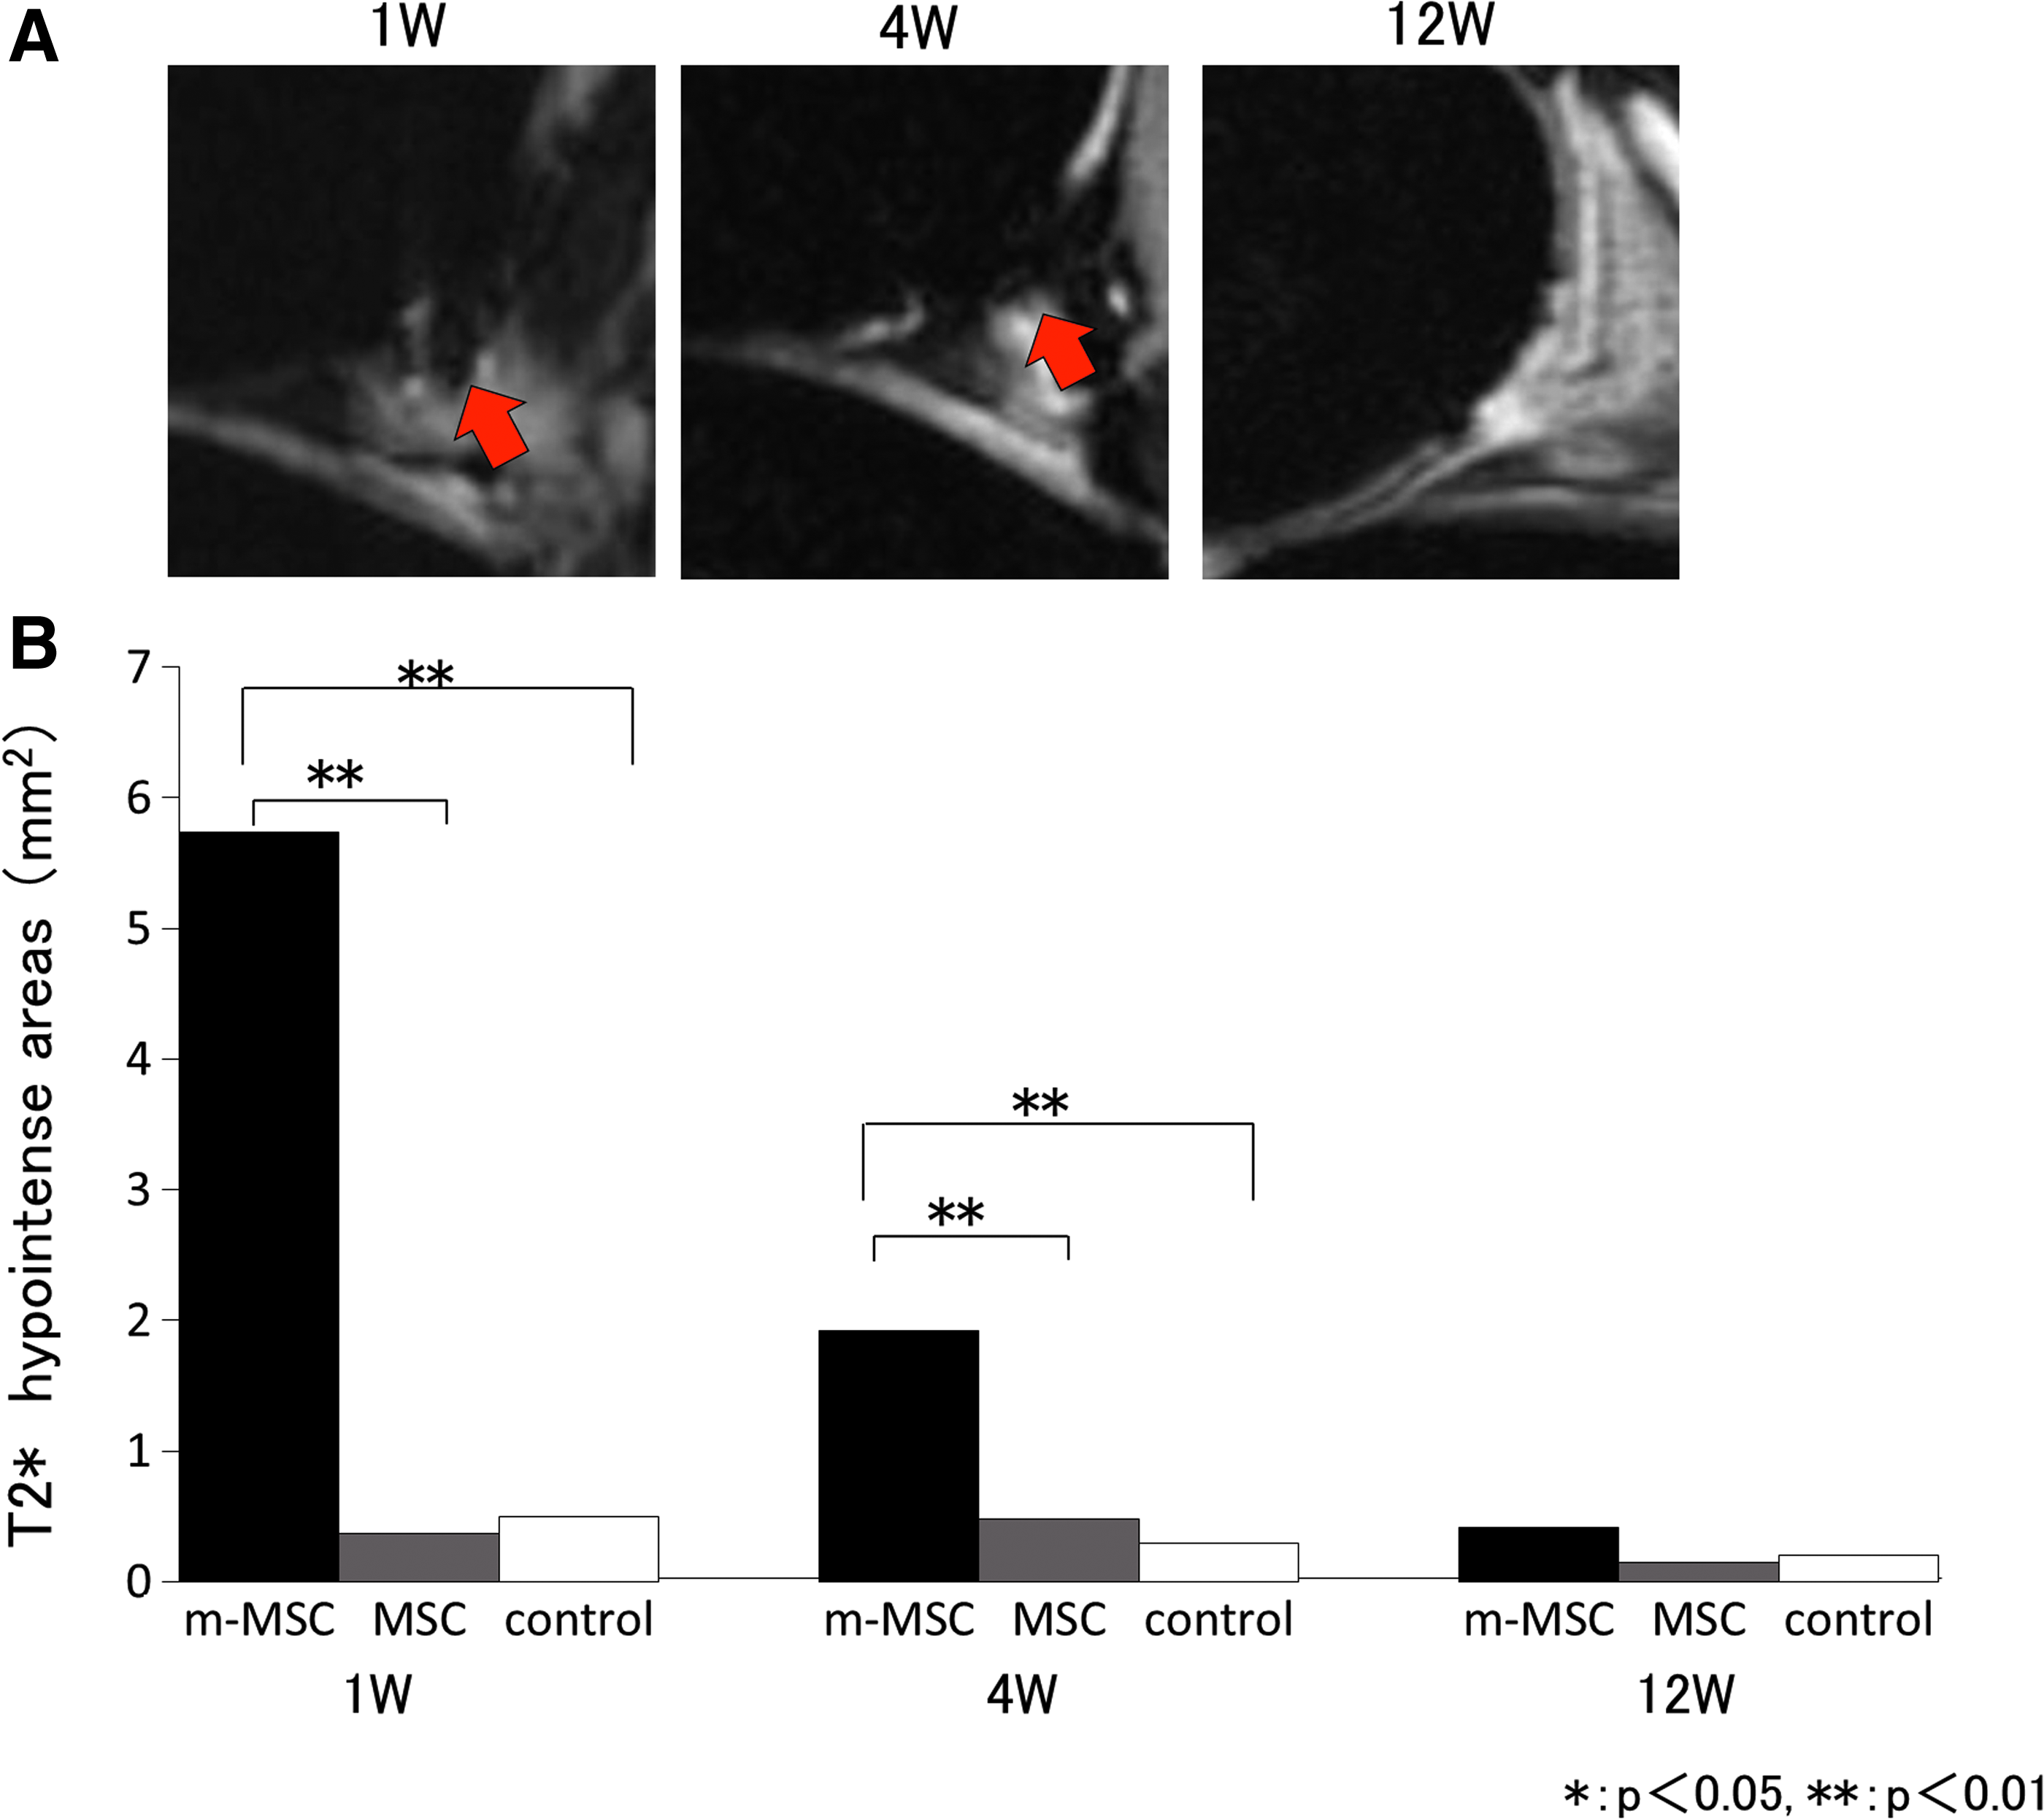
In the m-MSC group, the hypointense areas were significantly broader than those in the other groups and decreased over time (Fig. 6B).
Discussion
In this study, T2 mapping of MRI successfully mirrored the difference in histological cartilage repair. The iron particles were detected in a cartilage defect at 1 week after the injection of iron-labeled MSCs, by Berlin blue staining. Those iron particles decreased at 4 weeks and disappeared at 12 weeks after the injection. The T2* images of MRI detected those iron particles as a hypointense area. The time-dependent reduction of the hypointense area in T2* images successfully reflected the decrease of iron particles in Berlin blue staining. In addition, MRI scan did not inhibit the cartilage repair after the injection of iron-labeled MSCs.
Our previous studies have shown the safety and efficacy of magnetic targeting of bone marrow MSCs for the treatment of an articular cartilage defect in an animal model and a clinical trial.14,15 However, no study has evaluated the validity of MRI for the assessment of cartilage repair and kinetics of ferucarbotran, after magnetic targeting of MSCs. Furthermore, there was no evidence of complication to evaluate regenerative cartilage by using MRI after MSC magnetic targeting, such as peeling off of m-MSC cells from the osteochondral defects.
The PDW images could show the filling of cartilage defects with some tissues. But they could not evaluate the quality of the repaired tissues. In contrast, T2 mapping enabled the detection of the repaired tissues, which had T2 values similar to those of the cartilage. The difference in the assessment of T2 mapping images among the three groups resembled the difference in the histological assessment at 12 weeks after treatment (Figs. 2, 4, and 5). The time-dependent enlargement or the difference between groups of colored area in T2 mapping was thought to reflect histological cartilage repair. The T2 mapping successfully supported the assessment of cartilage repair in this study. The T2 mapping has been reported to provide information about the interaction between water molecules and the collagen network within the cartilage.16,23 In animal studies, T2 mapping has been reported as a means of assessing cartilage repair.24–26 A previous study concluded that T2 values might be an effective biomarker for the overall state of a cartilage sample. 27 In this study, T2 mapping images enabled quantitative assessment of the regenerated tissues, and the regenerative process after magnetic targeting.
Moreover, localization of transplanted m-MSC cells and kinetics of ferucarbotran in the knee joint were evaluated using T2* images in this study. A previous study reported that the decrease in MR signal intensity in vitro was found only in SPIO-labeled MSCs and not in MSCs only. 28 This study showed that m-MSCs appeared as hypointense areas in the intra-articular cavity associated with the decreased signal intensity on iron sensitive T2* images and accumulated at a region consistent with the defect areas in the group treated with m-MSCs and magnetic targeting. There have been several previous reports of visualizing labeled MSCs with nanoscale iron particles using MRI.18,29,30 In previous studies, no influence of various SPIO concentrations was noted on human bone marrow MSC viability or proliferation. 31 Our data also showed that MRI was able to monitor ferucarbotran metabolism similar to histological examination. In the m-MSC group, the hypointense areas on T2* images were significantly broader than those in the other groups at 1 and 4 weeks. The m-MSCs transplated to the knee joint decreased over time in the assessments using MRI and Berlin blue staining. This is in accordance with previous reports of stable labeling and magnetic resonance detection of MSCs labeled with nanoscale iron particles in the joints of rabbits for 12 weeks. 32 The results in this study demonstrate that MRI is able to evaluate the regenerative process of cartilage with magnetic targeting and kinetics of ferucarbotran over time with ease, and is less invasive without any complications.
Our study had several limitations. First, we evaluated the specimens for only 24 postoperative weeks. However, 12 months is ideal to evaluate the matrix organization and cell-type maturation. Second, the sample size was relatively small for evaluation in each group. In this study, because of the small sample size, there were no significant difference in the T2 area values among the groups. However, we were able to compare the percentage of area detected in T2 values for the osteochondral defect area, on T2 mapping between each group because we used a dedicated device for constant imaging of the knee. Third, we did not evaluate multiple time-dependent MRI and histological findings in the same individual. Fourth, we draw ROI manually, so we could not separate defect area from normal cartilage completely. Colored area might reflect the edge of normal cartilage. However, we took MR images as 1 mm thickness and 10 slices to evaluate as precisely as possible. Further studies are needed with larger number of samples. Finally, we have manually drawn the ROIs between the osteochondral defects. Further studies are needed with automatic segmentation to avoid the possible measurement errors caused by manual measurement. 33
Footnotes
Acknowledgments
This work was supported by the Highway Program for Realization of Regenerative Medicine (16bm0504004h0005) to M.O. and the Research Project for Practical Applications of Regenerative Medicine (18bk0104010h0001) to N.K. from Japan Agency for Medical Research and Development.
Disclosure Statement
No competing financial interests exist.