




Abstract
The objective of this study is to visualize cell apoptosis in three-dimensional (3D) cell aggregates based on molecular beacons (MB). Two types of MB for messenger RNA were used: caspase-3 MB as a target for apoptosis and glyceraldehyde-3-phosphate dehydrogenase (GAPDH) MB as a control of stable fluorescence in cells. To enhance the MB internalization into cells, caspase-3 and GAPDH MB were incorporated in cationized gelatin nanospheres (cGNS), respectively (cGNScasp3 MB and cGNSGAP MB). In addition, cGNS co-incorporating caspase-3 and GAPDH MB (cGNSdual MB) were prepared to perform the dual-color imaging for the same cell aggregate. The cGNSMB were incubated with mouse mesenchymal stem cells to label with MB in the two-dimensional culture. The cell apoptosis mediated by the addition of antibody for a death receptor Fas was ratiometrically detected by the cGNSdual MB to the same extent as single MB. The cell aggregates were prepared from MB-labeled cells, and the MB fluorescence was detected from almost all the cells even in the 3D aggregates to show the homogenous distribution. In addition to the Fas-mediated apoptosis, the aggregates were treated with camptothecin of a low-molecular weight apoptosis inducer. The fluorescence of caspase-3 MB was mainly distributed at the surface surrounding site of Fas-mediated apoptotic aggregates rather than the center site, while that of GAPDH MB was detected even in the interior site. On the other hand, in the camptothecin-induced apoptotic aggregates, both caspae-3 and GAPDH MB fluorescence were detected from the interior site of aggregates as well as the surrounding site. It is likely that the MB fluorescence reflected the localization of apoptotic position caused by the different molecular sizes of apoptosis inducer and the consequent penetration into the aggregates. It is concluded that the cGMSMB are a promising system to visualize cell apoptosis in 3D cell aggregates without the destruction of aggregates.
Impact statement
This study demonstrates the methodological feasibility of cationized gelatin nanospheres incorporating molecular beacons (cGNSMB) to visualize cell apoptosis in three-dimensional (3D) cell aggregates without the destruction of aggregates. When cell apoptosis was induced by the addition of anti-Fas antibody and camptothecin of a low-molecular weight drug, the cGNSMB imaging system achieved the discrimination of apoptotic position in aggregates caused by the different penetrations of apoptosis inducers. The imaging technology developed in this study would be useful and informative for wide research fields, including 3D cell culture, drug screening, and transplantation therapy.
Introduction
It has been recognized that cells improve their biological functions in a three-dimensional (3D) state compared with a two-dimensional (2D) state cultured in the conventional cell culture dish or plate. In the 3D environments of cells like living bodies, the biochemical and mechanical signals are upregulated due to the increased cell-cell and cell-extracellular matrix contacts.1,2 Therefore, a variety of 3D cell fabricates have been extensively studied to allow the cell functions to enhance in vitro. For example, aggregates or spheroids of mesenchymal stem cells (MSCs), which are one of 3D multicellular structures, enhance the therapeutic potential by improving the anti-inflammatory and angiogenic properties, stemness, and survival after transplantation in vivo.3–7 However, at present, it is technically difficult to evaluate the cell functions in living 3D cell aggregates. As the conventional assays, biochemical and histological techniques have been widely utilized to evaluate the functions of cell aggregates, while the destruction or fixation is required. The destruction and fixation of cell aggregates result in the loss of information on the position and time-course change of cell functions in the 3D structure. Under these circumstances, it is of prime importance to develop the imaging technology to visualize cell functions in the 3D cell aggregates without the destruction of aggregates. The cell apoptosis is one of fundamental cell functions to be visualized. For the cell transplantation therapy in regenerative medicine, the prevention of cell apoptosis and the enhancement of cell survival in vivo are keys to improve therapeutic efficiency. 8 In addition, the visualization of cell apoptosis in the 3D cell aggregates, spheroids, and organoids would contribute to their quality control in vitro in the use of drug screening, 9 disease modeling, 10 and cell transplantation therapy. 11
Molecular beacons (MB) are activatable imaging probes to specifically detect nucleic acid molecules, such as messenger RNA (mRNA) and microRNA (miRNA), which regulate the biological functions of cells. MB are stem-loop structured nucleic acid derivatives composed of DNA bases. The fluorescent molecule and the corresponding quencher are conjugated at both the 5′ and 3′ ends of MB to be a quenched state. On the other hand, in the presence of target nucleic acids, the specific hybridization by the hydrogen bonds of bases between the MB loop and the target sequences causes the drastic structural change to emit the fluorescence. 12 According to the specific fluorescence, a lot of studies have demonstrated the feasibility of MB to detect intracellular mRNA and miRNA, and the consequent cell functions without the destruction of cells.13–18
Gelatin is a biodegradable polymer, and has been widely utilized for food, pharmaceutical, and medical purposes. The bio-safety and biocompatibility have been proven by the long-term history of practical applications as biomaterial and drug ingredient. Gelatin can be readily crosslinked to form hydrogels to achieve the controlled release of various bioactive molecules. The controlled release system from gelatin hydrogel matrices enables the prolongation of bioactive time periods.19–22 Among the gelatin hydrogels, cationized gelatin nanospheres (cGNS) can be applied to the intracellular controlled release of nucleic acids, such as plasmid DNA, 23 small interfering RNA, 24 and MB.25–27 The cGNS incorporating MB (cGNSMB) are internalized into cells through an endocytotic pathway, and the MB released into the cytosol can specifically detect the intracellular target mRNA to visualize the cell proliferation ability 26 and cell apoptosis 27 in the 2D culture condition. In addition, it has been demonstrated that the cells labeled with gelatin nanospheres incorporating imaging probes in the 2D culture can be fabricated into the 3D structure. The 3D cells fabricated were homogenously labeled with the imaging probes. 28 Based on the findings, it is expected that the 3D cell aggregates are prepared from the cells labeled with cGNSMB in the 2D culture, and the apoptosis in aggregates could be detected by the MB fluorescence. In this study, MB to detect caspase-3 mRNA of an apoptosis target expressing in apoptotic cells are used to visualize the apoptosis in cell aggregates. As a control of stable fluorescence in cells, MB for mRNA of glyceraldehyde-3-phosphate dehydrogenase (GAPDH) of a constantly expressing housekeeping gene are used.
The objective of this study is to visualize apoptosis in 3D cell aggregates based on the cGNSMB imaging system. The cGNS incorporating caspase-3 and GAPDH MB (cGNScasp3 MB and cGNSGAP MB, respectively) were prepared. In addition to the single type of MB, cGNS co-incorporating caspase-3 and GAPDH MB (cGNSdual MB) were prepared to perform the dual-color imaging for the same aggregate. The cGNSMB were incubated with KUM6 cells of a mouse bone marrow-derived MSC line to allow cells to label with MB in the 2D culture. Then, cell apoptosis was induced by an anti-Fas antibody to agonistically stimulate the Fas receptor, so-called “death receptor.” 29 The fluorescent intensity of MB in response to the Fas-mediated apoptosis was evaluated in terms of the MB function to visualize cell apoptosis. In addition, the ratiometric intensity of MB fluorescence (caspase-3 MB/GAPDH MB) was compared with that of single MB to assess the availability of dual-color imaging. The 3D cell aggregates were prepared from the MB-labeled cells, and the Fas-mediated apoptosis was induced to the aggregates. As a different type of apoptosis inducer, camptothecin of a low-molecular weight compound was used as well. The fluorescence of MB was evaluated between the Fas-mediated and camptothecin-induced apoptosis to investigate the localization of apoptotic cells in the 3D aggregates. Finally, the distribution of anti-Fas antibody in the aggregates was examined to compare with the fluorescent localization of MB.
Methods
As the methodological approach, we applied two steps to prepare the MB-labeled cell aggregates: (1) cell labeling with MB in a 2D culture and (2) construction of 3D cell aggregates from MB-labeled cells. In this approach, it is technically possible to homogenously label the whole cells in 3D aggregates with MB. To evaluate the methodological feasibility of this imaging system, the cell apoptosis of aggregates was induced by use of two chemical inducers, anti-Fas antibody and camptothecin, with different molecular sizes. They will show different time profiles of penetration into aggregates and the consequent distribution in the aggregates. Then, the optical sections were observed to assess the apoptotic position in the 3D cell aggregates.
Experiment
Experimental design
Materials
Gelatin with an isoelectric point of 9.0 and the weight-averaged molecular weight of 99,000, prepared by an acidic process of pig skin, was kindly supplied from Nitta Gelatin, Inc., Osaka, Japan. MB for mouse mRNA of caspase-3 and GAPDH were designed by NIPPON GENE Co., Ltd., Tokyo, Japan, and synthesized by Integrated DNA Technologies, Inc., Coralville, IA. The sequences of MB are listed in Table 1. Glutaraldehyde (GA, 25 wt% in water), glycine, concentrated hydrochloric acid (HCl), acetone, and 1-ethyl-3-(3-dimethylaminopropyl) carbodiimide hydrochloride salt (EDC) were purchased from Nacalai Tesque, Inc., Kyoto, Japan. Spermine was purchased from Sigma-Aldrich, Inc., St. Louis, MO. The reagents were used without further purification.
Sequences of Molecular Beacons Used
Underline: stem structure.
GAPDH, glyceraldehyde-3-phosphate dehydrogenase; IBFQ, Iowa Black®FQ; IBRQ, Iowa Black®RQ; MB, molecular beacons.
Preparation of cationized gelatin
Cationized gelatin was prepared by conjugating spermine with the carboxyl groups of gelatin. 30 In brief, spermine was added at a molar ratio of 50:1 to the carboxyl groups of gelatin into 50 mL of gelatin aqueous solution (40 mg/mL). Immediately after that, the solution pH was adjusted to 5.0 by adding 11 M HCl. Double-distilled water (DDW) was added to give the final volume of 100 mL. Next, EDC was added at a molar ratio of 3:1 to the carboxyl groups of gelatin, followed by the agitation at 40°C for 18 h and dialysis against DDW for 3 days with a dialysis membrane (molecular weight cutoff = 12,000–14,000; Viskase Companies, Inc., Willowbrook, IL) at room temperature. The dialyzed solution was freeze-dried to obtain the cationized gelatin. The percentage of amino groups introduced into gelatin was determined by the conventional 2,4,6-trinitrobenzene sulfonic acid (TNBS; FUJIFILM Wako Pure Chemical, Inc., Osaka, Japan) method. 31 The percentage was 59.8 mole% per the carboxyl groups of gelatin.
Preparation of cGNS
According to the preparation procedure previously reported,24,27 cGNS were prepared by the conventional coacervation method. Briefly, aqueous solution of cationized gelatin (50 mg/mL, 1.25 mL) was warmed up to 40°C. Then, 5 mL of acetone was gradually dropped to the solution to form the coacervate. Aqueous solution of 25 wt% GA (20 μL) was immediately added to the solution, followed by chemical cross-linking of cationized gelatin for 6 h. After that, an excessive amount of 0.5 M glycine aqueous solution (2 mL) was added for the blocking of aldehyde groups unreacted. The resulting solution was agitated overnight at 40°C and the residual acetone was evaporated. Then, cGNS were collected by the centrifugation of 16,000 g for 30 min at 25°C and resuspended in DDW. The centrifugation and resuspension procedures were repeated thrice to wash cGNS. The concentration of cGNS was determined by the measurement of weight after drying 100 μL of cGNS suspension.
The apparent size of cGNS dispersed in 10 mM phosphate-buffered saline solution (PBS, pH7.4) was measured by dynamic light scattering (DLS, Zetasizer Nano-ZS; Malvern Instruments Ltd., Worcestershire, United Kingdom). Moreover, the zeta potential of cGNS dispersed in 10 mM phosphate buffer (pH7.4) was measured by electrophoresis light scattering (ELS, Zetasizer Nano-ZS; Malvern Instruments Ltd.). The apparent size and zeta potential of cGNS were 151.8 ± 0.98 nm and 8.44 ± 0.39 mV, respectively.
Preparation of cGNSMB
The cGNSMB were prepared by simply incubating cGNS with MB in DDW. The cGNS (200 μg) and MB (either caspase-3 or GAPDH, 4 μM, respectively) were mixed in DDW at the MB/cGNS ratio of 20 pmole/μg cGNS. After the incubation for 15 min at room temperature, the mixture was centrifuged at 16,000 g for 15 min at 25°C and resuspended in DDW to obtain cGNS incorporating caspase-3 and GAPDH MB (cGNScasp3 MB and cGNSGAP MB, respectively). In addition, cGNS co-incorporating caspase-3 and GAPDH MB (cGNSdual MB) were prepared by incubating cGNS and the mixed solution of caspase-3 and GAPDH MB (1:1) (total 20 pmole MB/μg cGNS). After the incubation for 15 min, the cGNSdual MB were obtained by centrifugation and resuspension in DDW as well. The apparent size and zeta potential of cGNSMB were determined by DLS and ELS measurements, respectively. The measurements were performed independently thrice for each sample unless otherwise mentioned.
Cell culture experiments
KUM6 cells (JCRB1202) of a mouse bone marrow-derived MSC line were purchased from JCRB Cell Bank (National Institute of Biomedical Innovation, Health and Nutrition, Osaka, Japan). The cells were cultured in Iscove's Modified Dulbecco's Medium (IMDM; Thermo Fisher Scientific, Inc., Waltham, MA) supplemented with 10 vol% bovine fetal calf serum (GE healthcare Life Sciences Hyclone laboratories, Inc., Logan, UT) and 1 vol% penicillin and streptomycin (Nacalai Tesque, Inc.) at 37°C in a 5% CO2-95% air atmospheric condition. The cells were detached with 0.25 wt% trypsin-containing 1 mM ethylenediaminetetra acetic acid (EDTA) solution (Nacalai Tesque, Inc.) and continued to culture in 100 mm cell culture dish (Corning, Inc., Corning, NY) to allow to grow until 80% confluency.
Immunofluorescent staining
The cells were seeded in a glass bottom dish of 35 mm in diameter (Matsunami Glass Industries Ltd., Tokyo, Japan) at a density of 1 × 10⁵ cells/dish. After a 24-h incubation, the cells were fixed with 4 vol% paraformaldehyde for 20 min at room temperature. After the blocking (ImmunoBlock™; KAC Co. Ltd., Kyoto, Japan), the cells were incubated with a rabbit monoclonal anti-Fas antibody (1:50, 50027-R004; Sino Biological, Inc., Beijing, China) overnight at 4°C. Next, the cells were washed with PBS thrice, followed by the incubation with a secondary goat anti-rabbit IgG (H+L) antibody conjugated with Alexa Fluor®488 (1:1000, A11008; Thermo Fisher Scientific, Inc.) for 1 h at room temperature. The cell nuclei were stained with 300 nM 4′,6-diamidino-2-phenylindole (DAPI; Thermo Fisher Scientific, Inc.), and then the fluorescent images were taken by a fluorescent microscope BZ-X700 (KEYENCE Co., Ltd., Osaka, Japan).
Induction of Fas-mediated apoptosis
Fas-mediated apoptosis was induced by the agonistic stimulation of Fas receptor with the anti-Fas antibody (Fas Ab) in the presence of actinomycin D (Act D).32,33 Briefly, cells were seeded in each well of six-well multidish culture plate (Corning, Inc.) at a density of 1 × 10⁵ cells/well, and cultured for 24 h. Next, 1 μg/mL hamster monoclonal Fas Ab (clone: Jo2, 554255; Becton, Dickinson and Company, Franklin Lakes, NJ) and 0.1 μg/mL Act D (Enzo Life Sciences, Inc., Farmingdale, NY) were added to the cells, and cultured for further 16 h to induce the apoptosis. The cell apoptosis was evaluated by the flow cytometric analysis using fluorescein isothiocyanate (FITC) Annexin V Apoptosis Detection Kit I (Becton, Dickinson and Company) according to the manufacturer's instruction. The cells cultured with Fas Ab and Act D were collected by trypsinization and washed with cold PBS twice. Then, the cells were resuspended in 10 mM HEPES/NaOH solution containing 140 mM NaCl and 2.5 mM CaCl2 (pH7.4), and FITC-conjugated annexin V and propidium iodide (PI) were added to the suspension. The cell suspension was analyzed on FACSCanto II flow cytometer and FACSDiva software (Becton Dickinson and Company) by counting 10,000 cells.
Fluorescent imaging of apoptosis in the 2D culture
The cells were similarly seeded on the glass bottom dish at a density of 1 × 10⁵ cells/dish, and cultured for 24 h. The medium was changed to OPTI MEM (Thermo Fisher Scientific, Inc.), and cGNSMB (cGNScasp3 MB, cGNSGAP MB, and cGNSdual MB) were added to the cells at the concentration of 10 μg/mL. After a 1-h incubation with cGNSMB, the cells were washed with PBS and cultured for further 5 h. Then, 1 μg/mL Fas Ab and 0.1 μg/mL Act D were added to the cGNSMB-incubated cells to induce the Fas-mediated apoptosis. After the apoptosis induction for 16 h, the cells were observed by the fluorescent microscope BZ-X700. To evaluate the fluorescent intensity, six images were taken at random and analyzed by BZ-X Analyzer (KEYENCE Co., Ltd.). The fluorescent area in the cells was extracted and the averaged brightness of the area was measured as the fluorescent intensity.
Preparation of cell aggregates labeled with MB
The cells were similarly seeded in each well of a six-well plate at a density of 1 × 10⁵ cells/well, and cultured for 24 h. After the medium change to OPTI MEM, the cGNSMB were added to the cells (10 μg/mL), and incubated for 1 h to allow cells to label with MB in the 2D culture. The MB-labeled cells were detached by the trypsinization 5 h later, and the cell number was counted.
Poly(vinyl alcohol) (PVA) (degree of polymerization = 1800 and saponification = 88 mole%) was kindly supplied from Unitika Ltd. (Tokyo, Japan). The PVA solution (1 wt%, dissolved in PBS) was added to each well of round-bottomed (U bottomed) 96-well culture plate (Greiner Bio-One International GmbH, Kremsmünster, Austria) to coat wells with PVA (100 μL/well). After the incubation for 15 min at 37°C, the PVA solution was removed and the wells were washed with PBS twice. Then, the MB-labeled cells were added to each well (500 cells/well, 200 μL/well), and cultured for 3 days to form the aggregates. The cell aggregates were transferred to the glass bottom dish, and observed by confocal laser microscopy IX73/CSU-W1 (OLYMPUS Co., Ltd., Tokyo, Japan) to take the fluorescent images of optical sections and construct the 3D images. Moreover, the size of cell aggregates prepared from MB-labeled cells or original cells was measured from 20 images using the software BZ-X Analyzer to calculate the average diameter.
Fluorescent imaging of apoptosis in the 3D cell aggregates
The cells were similarly incubated with cGNSdual MB in the 2D culture, and the cell aggregates were prepared from the MB-labeled cells as described above. After the aggregate culture for 3 days, the half of medium was changed to the medium containing Fas Ab and Act D (final concentration of 1 and 0.1 μg/mL, respectively). In addition, camptothecin (5 μM; Enzo Life Sciences, Inc.), a DNA-topoisomerase I inhibitor, was used to induce apoptosis.34–36 The cell aggregates induced apoptosis for 16 h were transferred to the glass bottom dish, and observed by the fluorescent microscope BZ-X700 with an optical sectioning module. The optical sections of cell aggregates were taken based on the structured illumination in a grid pattern and the projection onto only the focused areas of sample. 37 The fluorescent intensity as a line profile of optical sections was evaluated by the software BZ-X Analyzer.
To investigate the distribution of Fas Ab in the aggregates, the Fas Ab was fluorescently labeled using HiLyte Fluor™ 555 Labeling Kit-NH2 (Dojindo Laboratories, Kumamoto, Japan) according to the manufacturer's protocol. Then, the cell aggregates were incubated with 1 μg/mL Fas Ab labeled with HiLyte Fluor 555 and 0.1 μg/mL Act D for 16 h. After the incubation, the cell aggregates were collected and washed with PBS, and the fluorescent intensity as a line profile of optical section taken by the fluorescent microscopy was similarly evaluated.
Statistical analyses
The data were expressed as the average ± standard deviation. All statistical analyses were performed using one-way analysis of variance (ANOVA) with a post-hoc Tukey-Kramer multiple comparison test. p-Values <0.05 were considered to be statistically significant.
Experimental Results
Characterization of cGNSMB
Table 2 shows the apparent size and zeta potential of cGNSMB prepared. There was no difference in the values among cGNScasp3 MB, cGNSGAP MB, and cGNSdual MB.
Physicochemical Properties of Cationized Gelatin Nanospheres Incorporating Molecular Beacons Prepared
Average ± standard deviation.
cGNS, cationized gelatin nanospheres.
Analysis of Fas-mediated apoptosis
The expression of Fas in KUM6 cells was evaluated by the immunofluorescent staining (Fig. 1). The Fas expression was experimentally confirmed by positive staining. Figure 2 shows the flow cytometric analysis of Fas-mediated apoptosis induced by the addition of 1 μg/mL Fas Ab, 0.1 μg/mL Act D, and 1 μg/mL Fas Ab plus 0.1 μg/mL Act D for 16 h. The cells treated with only Fas Ab or Act D were double negative for annexin V and PI. On the other hand, the combination of Fas Ab and Act D significantly increased the percentage of apoptotic (annexin V positive) cells.
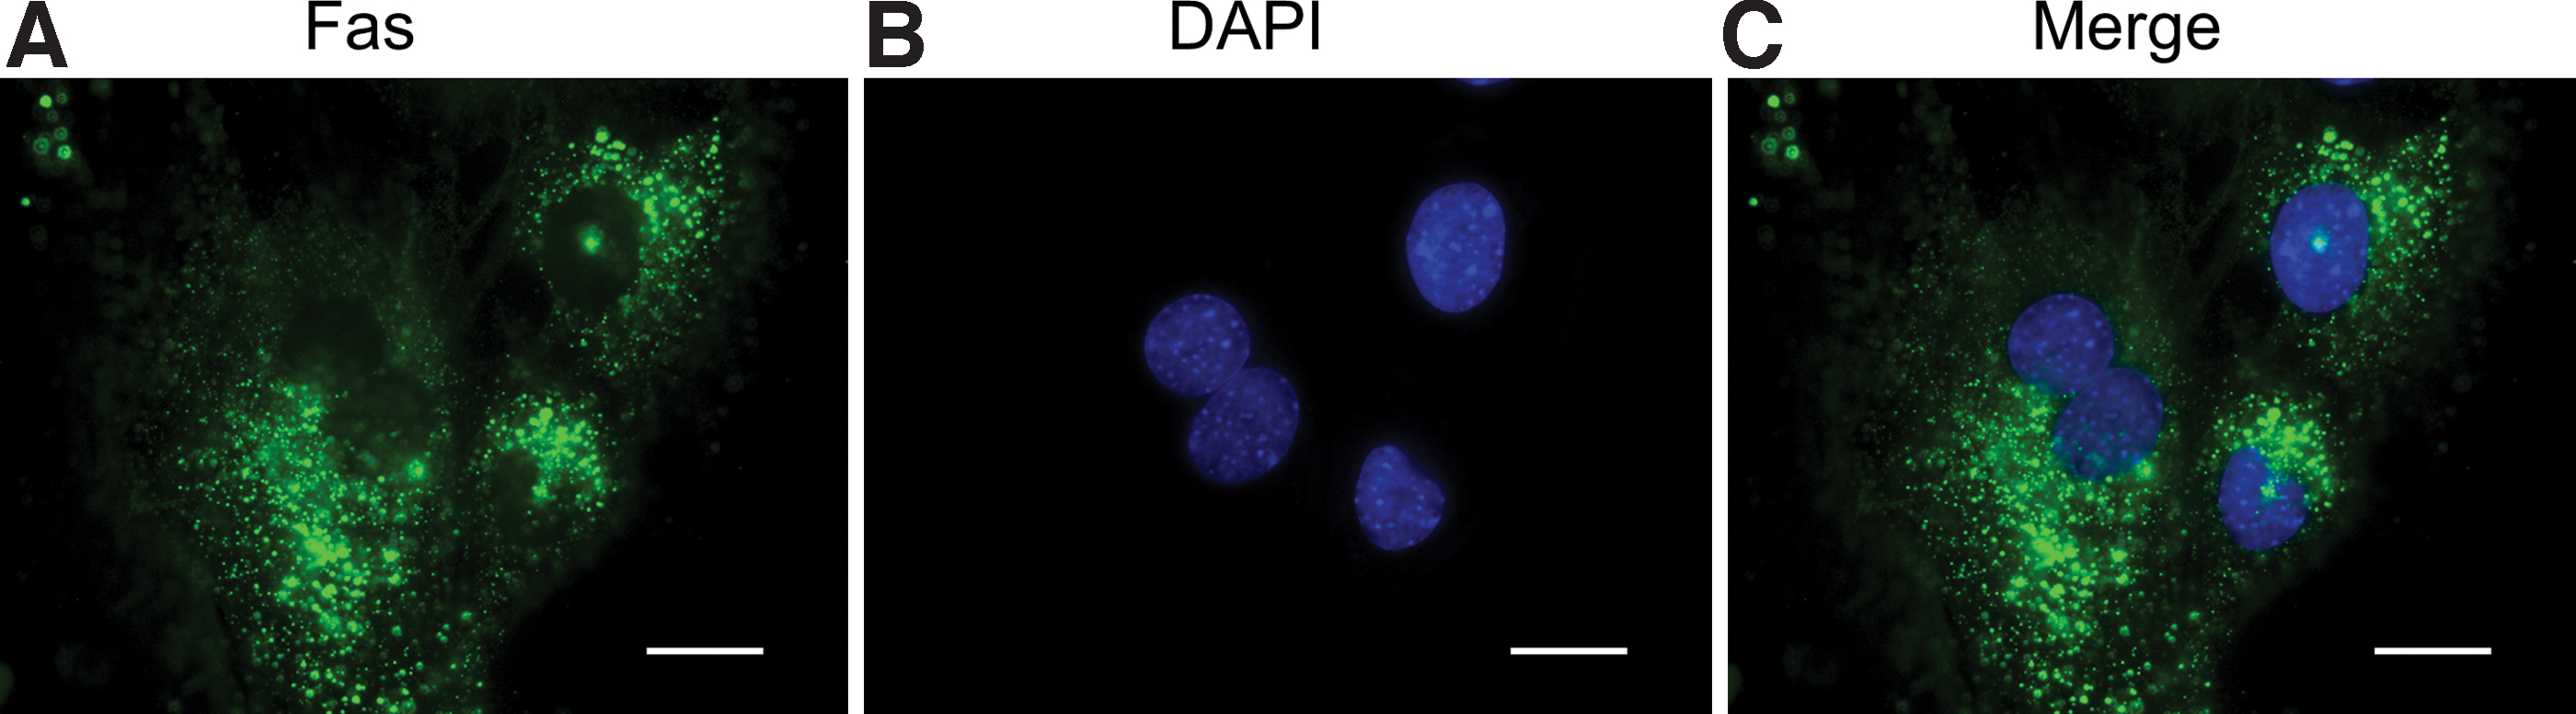
Immunofluorescent staining of Fas:
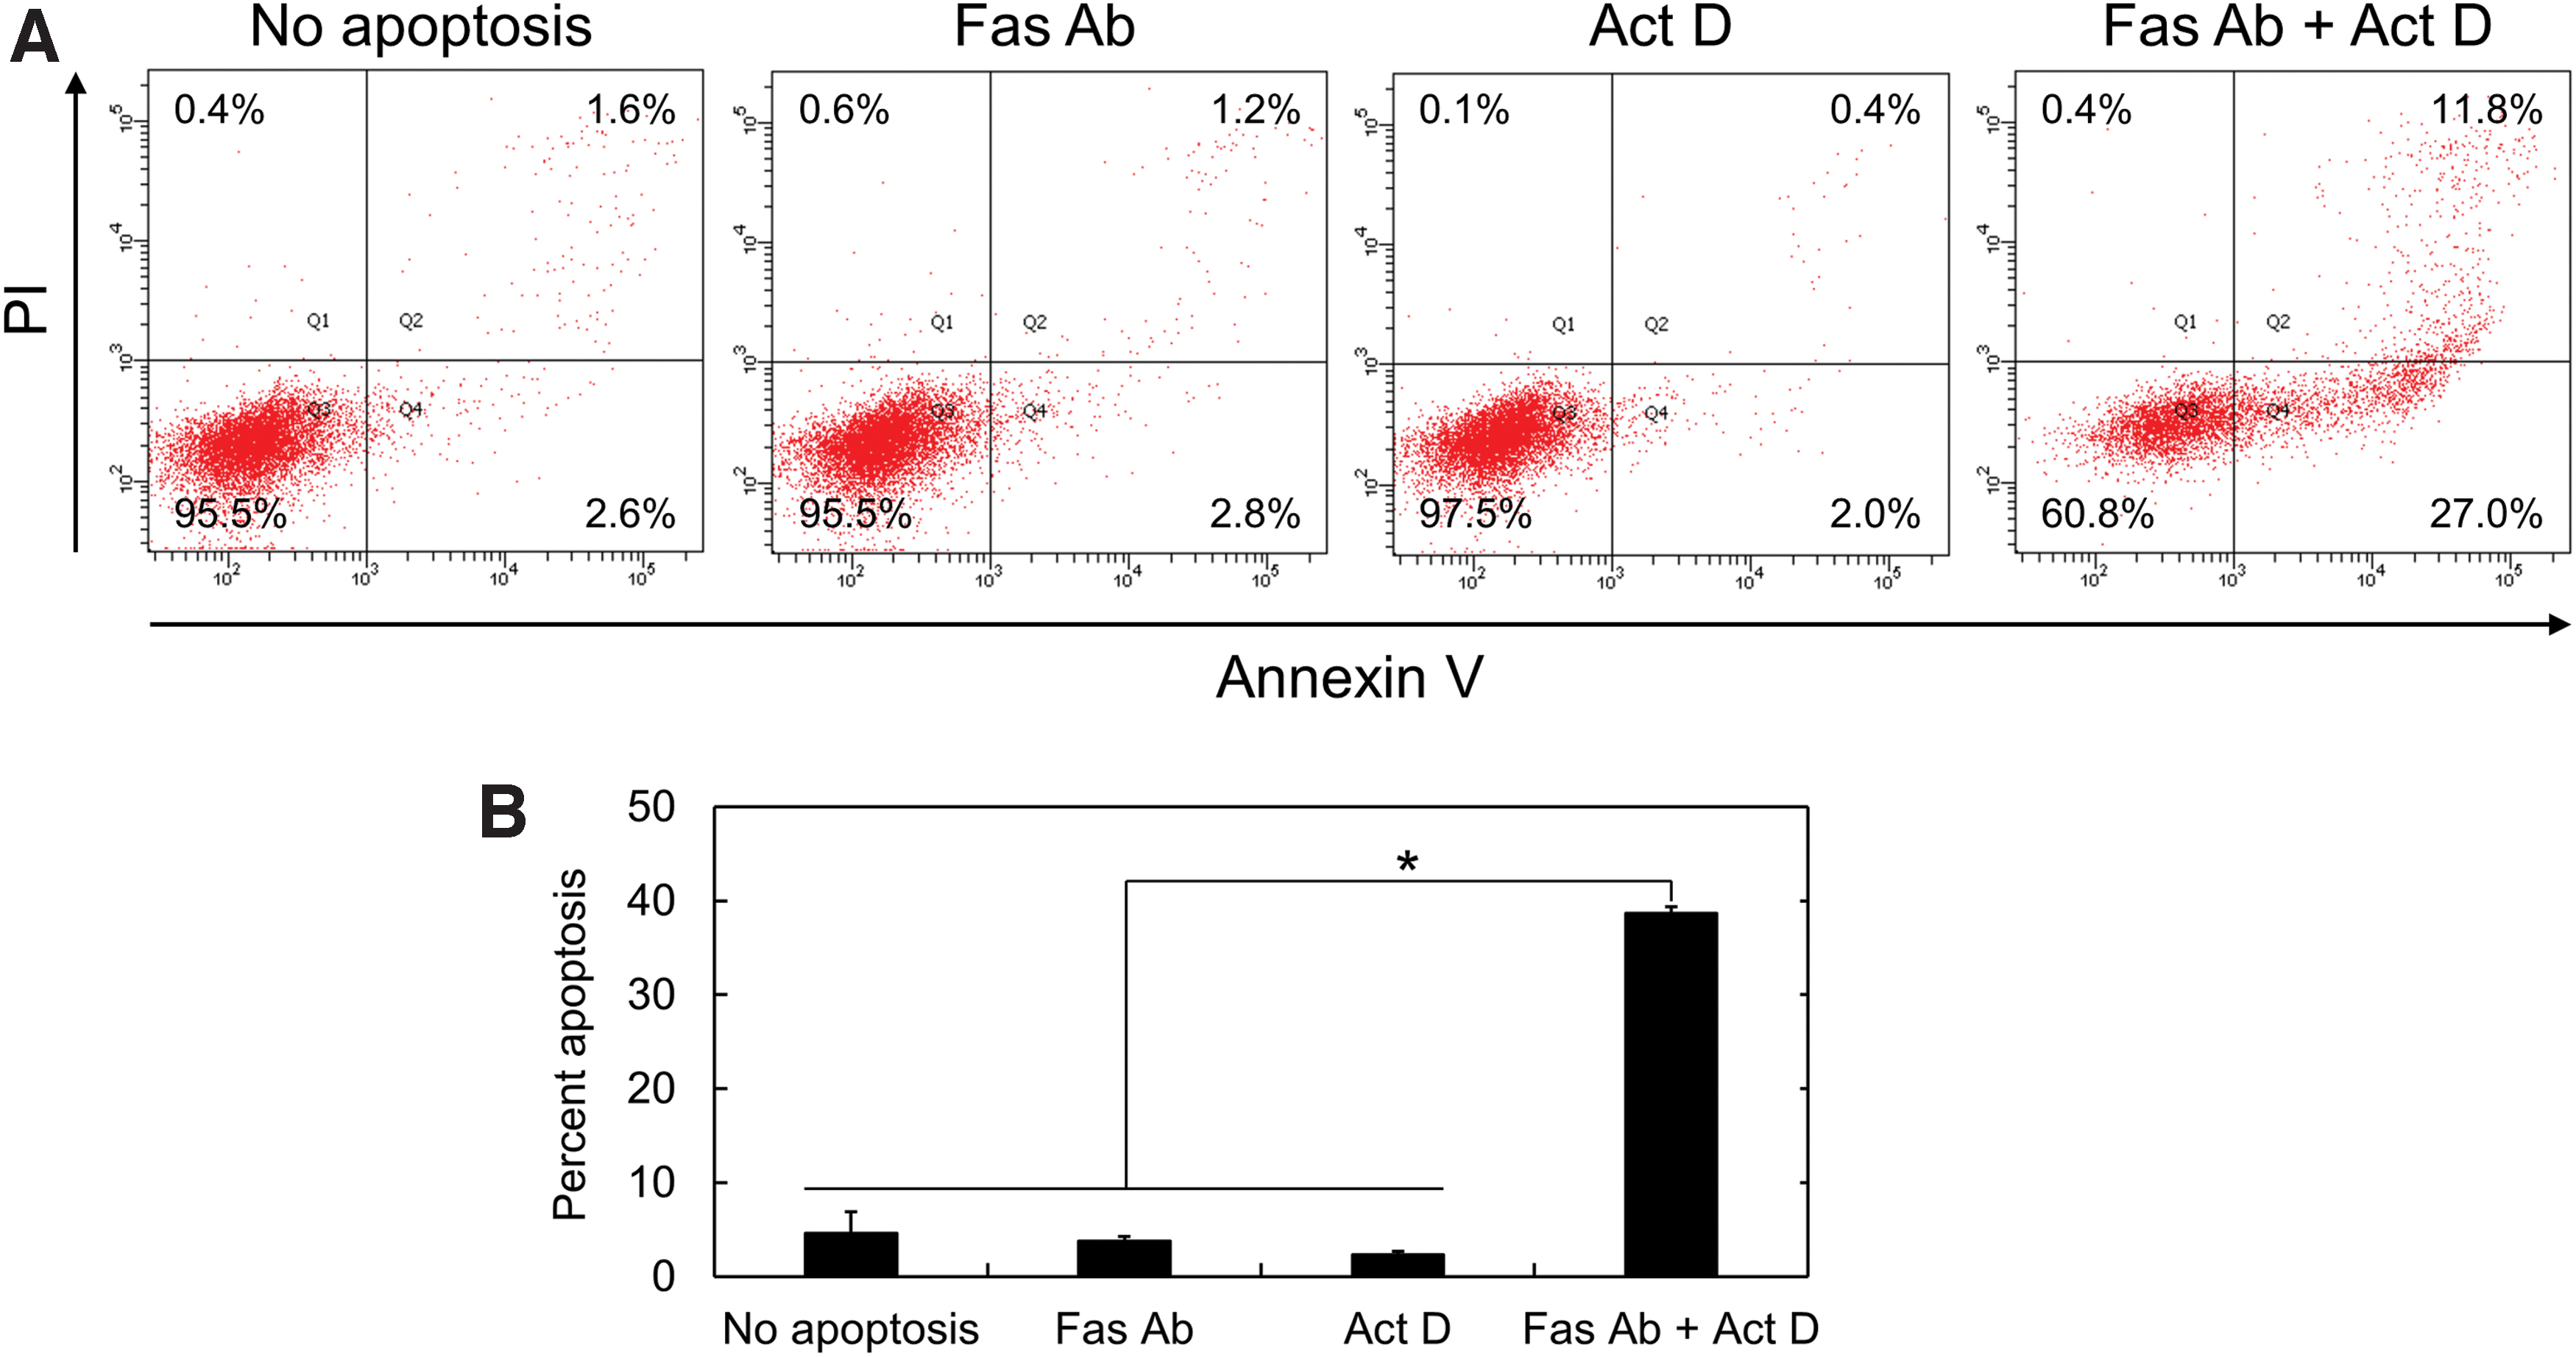
Analysis of Fas-mediated apoptosis.
Fluorescent imaging of apoptosis in the 2D culture
The cells were incubated with cGNSMB, followed by the addition of Fas Ab and Act D to induce the Fas-mediated apoptosis for 16 h, and observed by the fluorescent microscopy. Figure 3
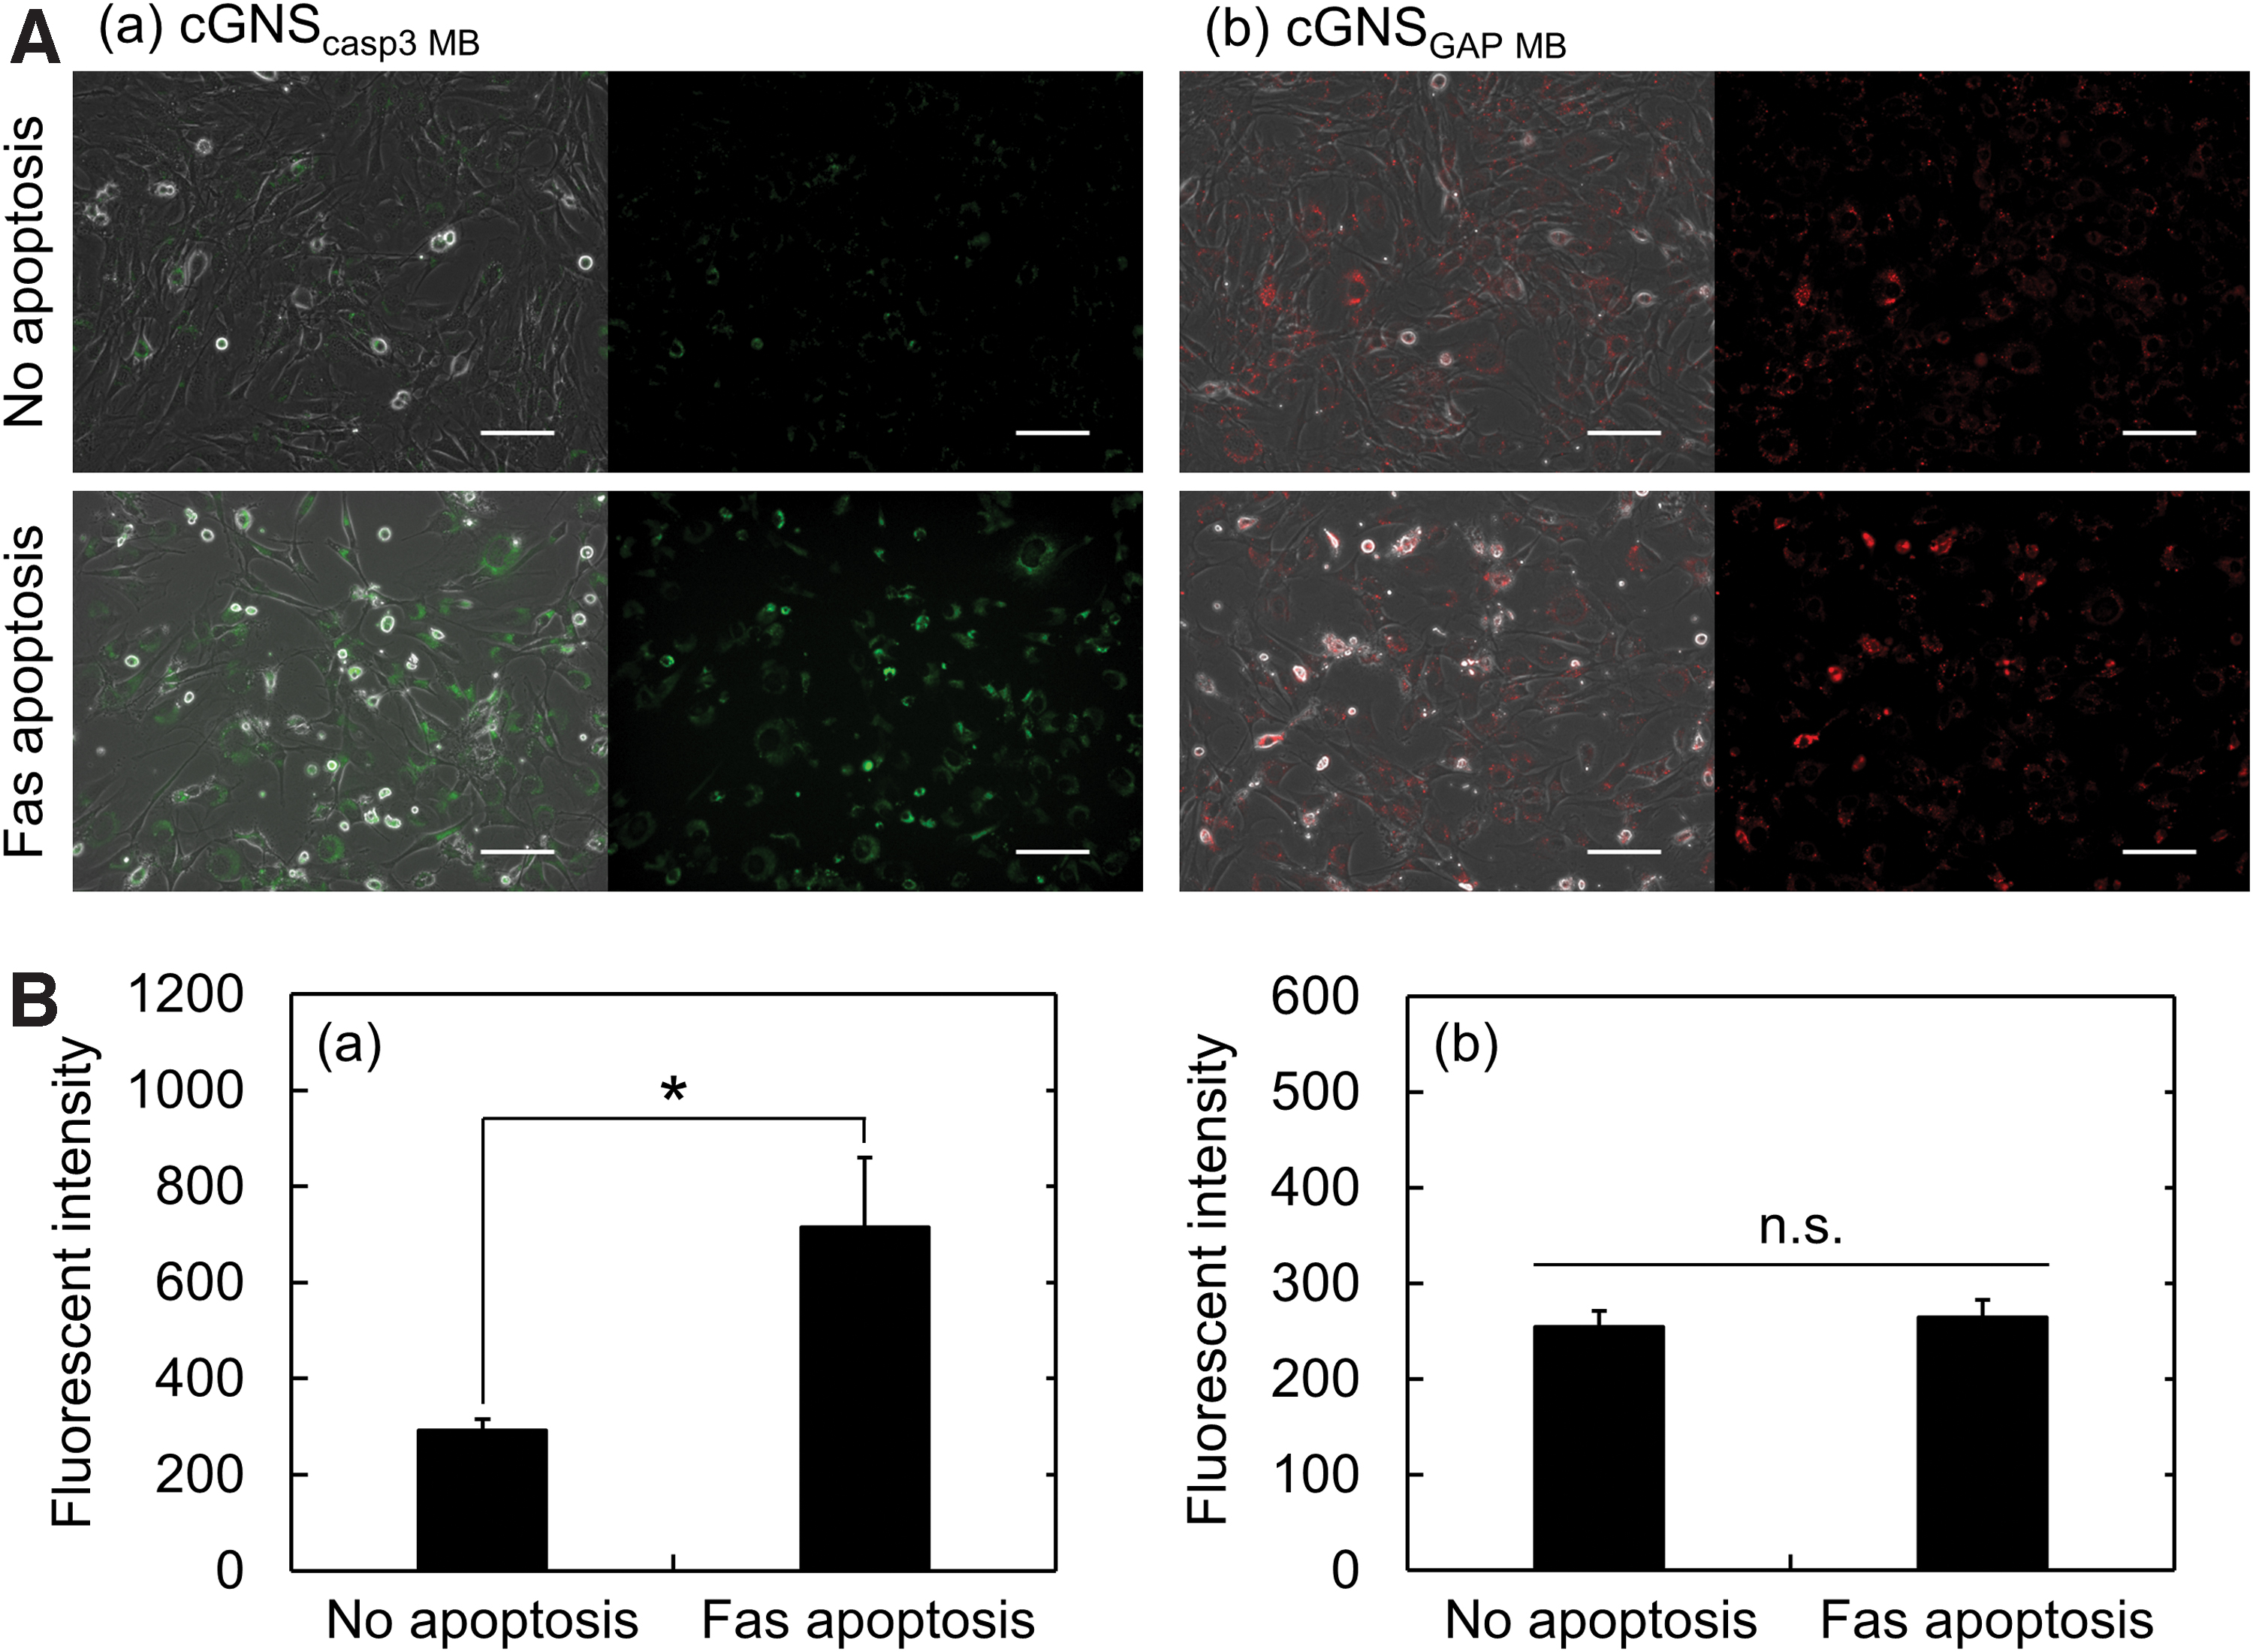
Fluorescent imaging of apoptosis in the 2D culture with single color.
Next, the cells were incubated with cGNSdual MB, and the Fas Ab and Act D were similarly added to perform the dual-color imaging of Fas-mediated apoptosis in the 2D culture condition (Fig. 4). It is apparent from Figure 4A that the fluorescence of caspase-3 MB was strongly observed for apoptotic cells. Figure 4B shows the ratiometric fluorescent intensity of cGNSdual MB (caspase-3 MB/GAPDH MB). The ratio of fluorescent intensity significantly increased with the Fas-mediated apoptosis. In addition, the increase of fluorescent ratio showed a profile similar to that of cGNScasp3 MB fluorescent intensity (Fig. 3B(a)).
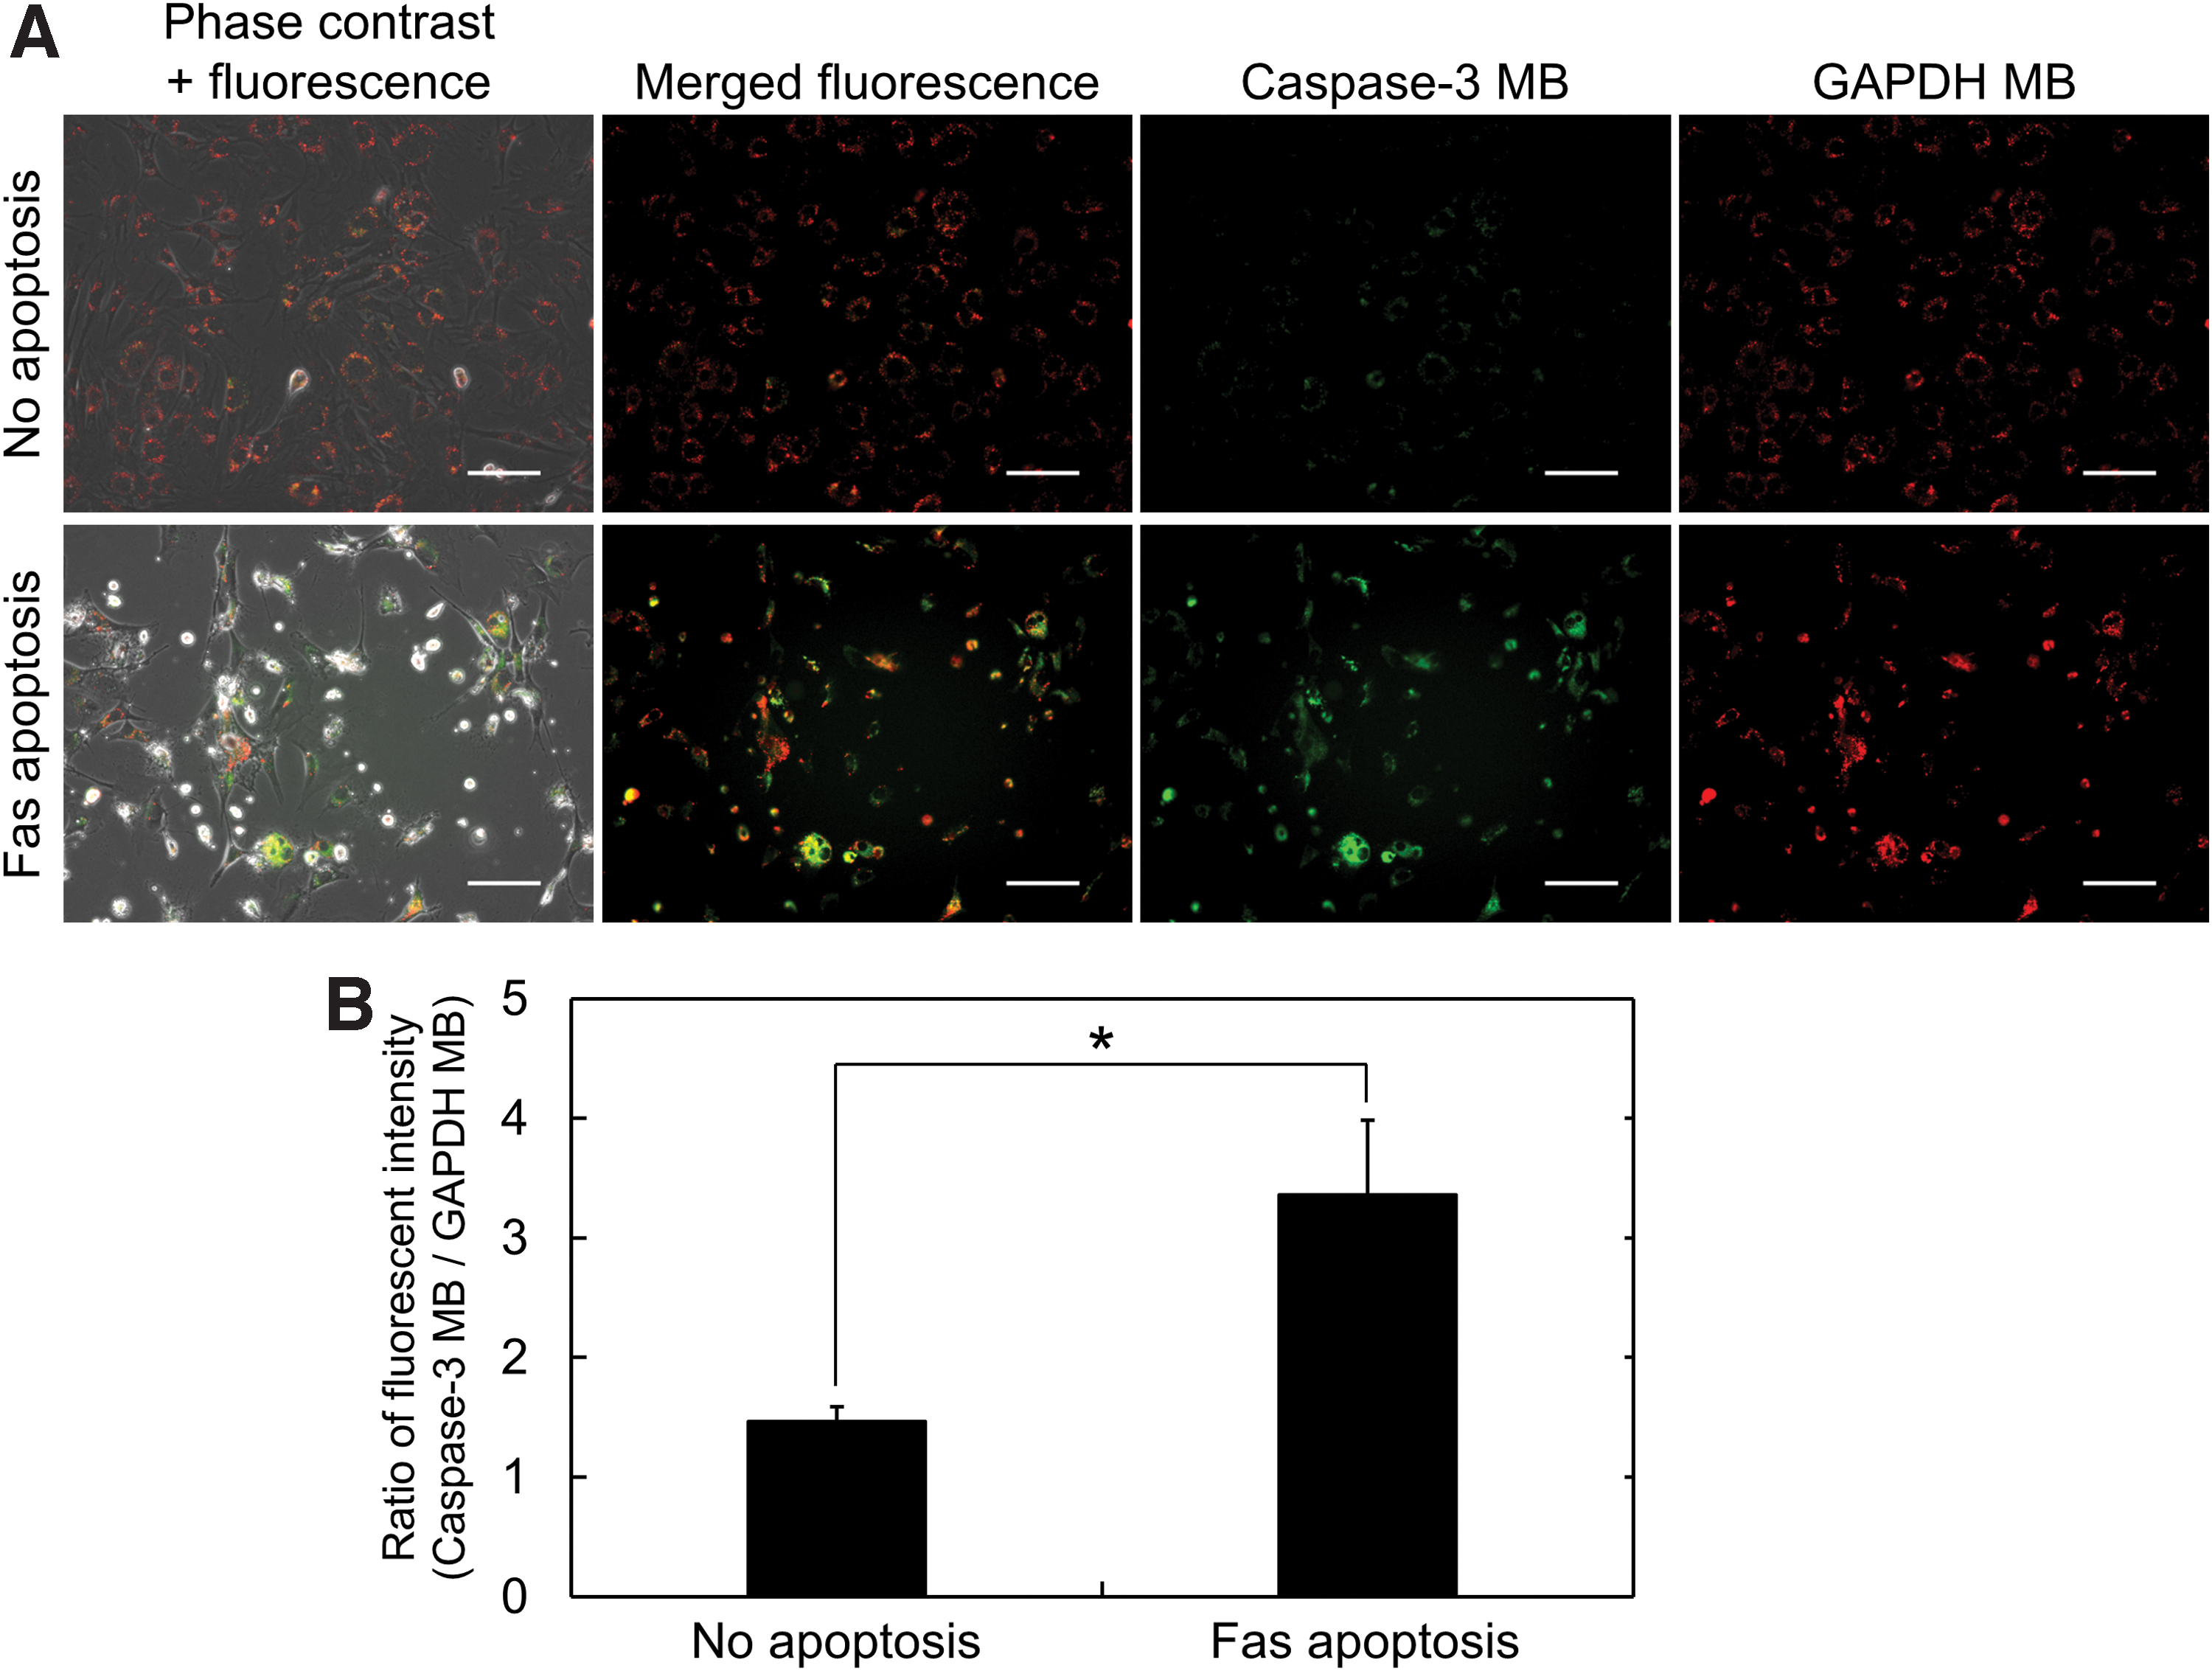
Fluorescent imaging of apoptosis in the 2D culture with dual colors.
Preparation of cell aggregate labeled with MB
The cell aggregates were prepared from the cells incubated with cGNSMB in the 2D culture (MB-labeled cells), and observed by the confocal laser microscopy. Figure 5 shows the confocal microscopic images of cell aggregates labeled with GAPDH MB. Almost all the cells emitted the fluorescence of GAPDH MB even in the 3D aggregates, displaying homogenous spatial distribution. In addition, there was no difference in the size of cell aggregates prepared form the original or MB-labeled cells (Fig. 6). The size of cell aggregates was around 100 μm.
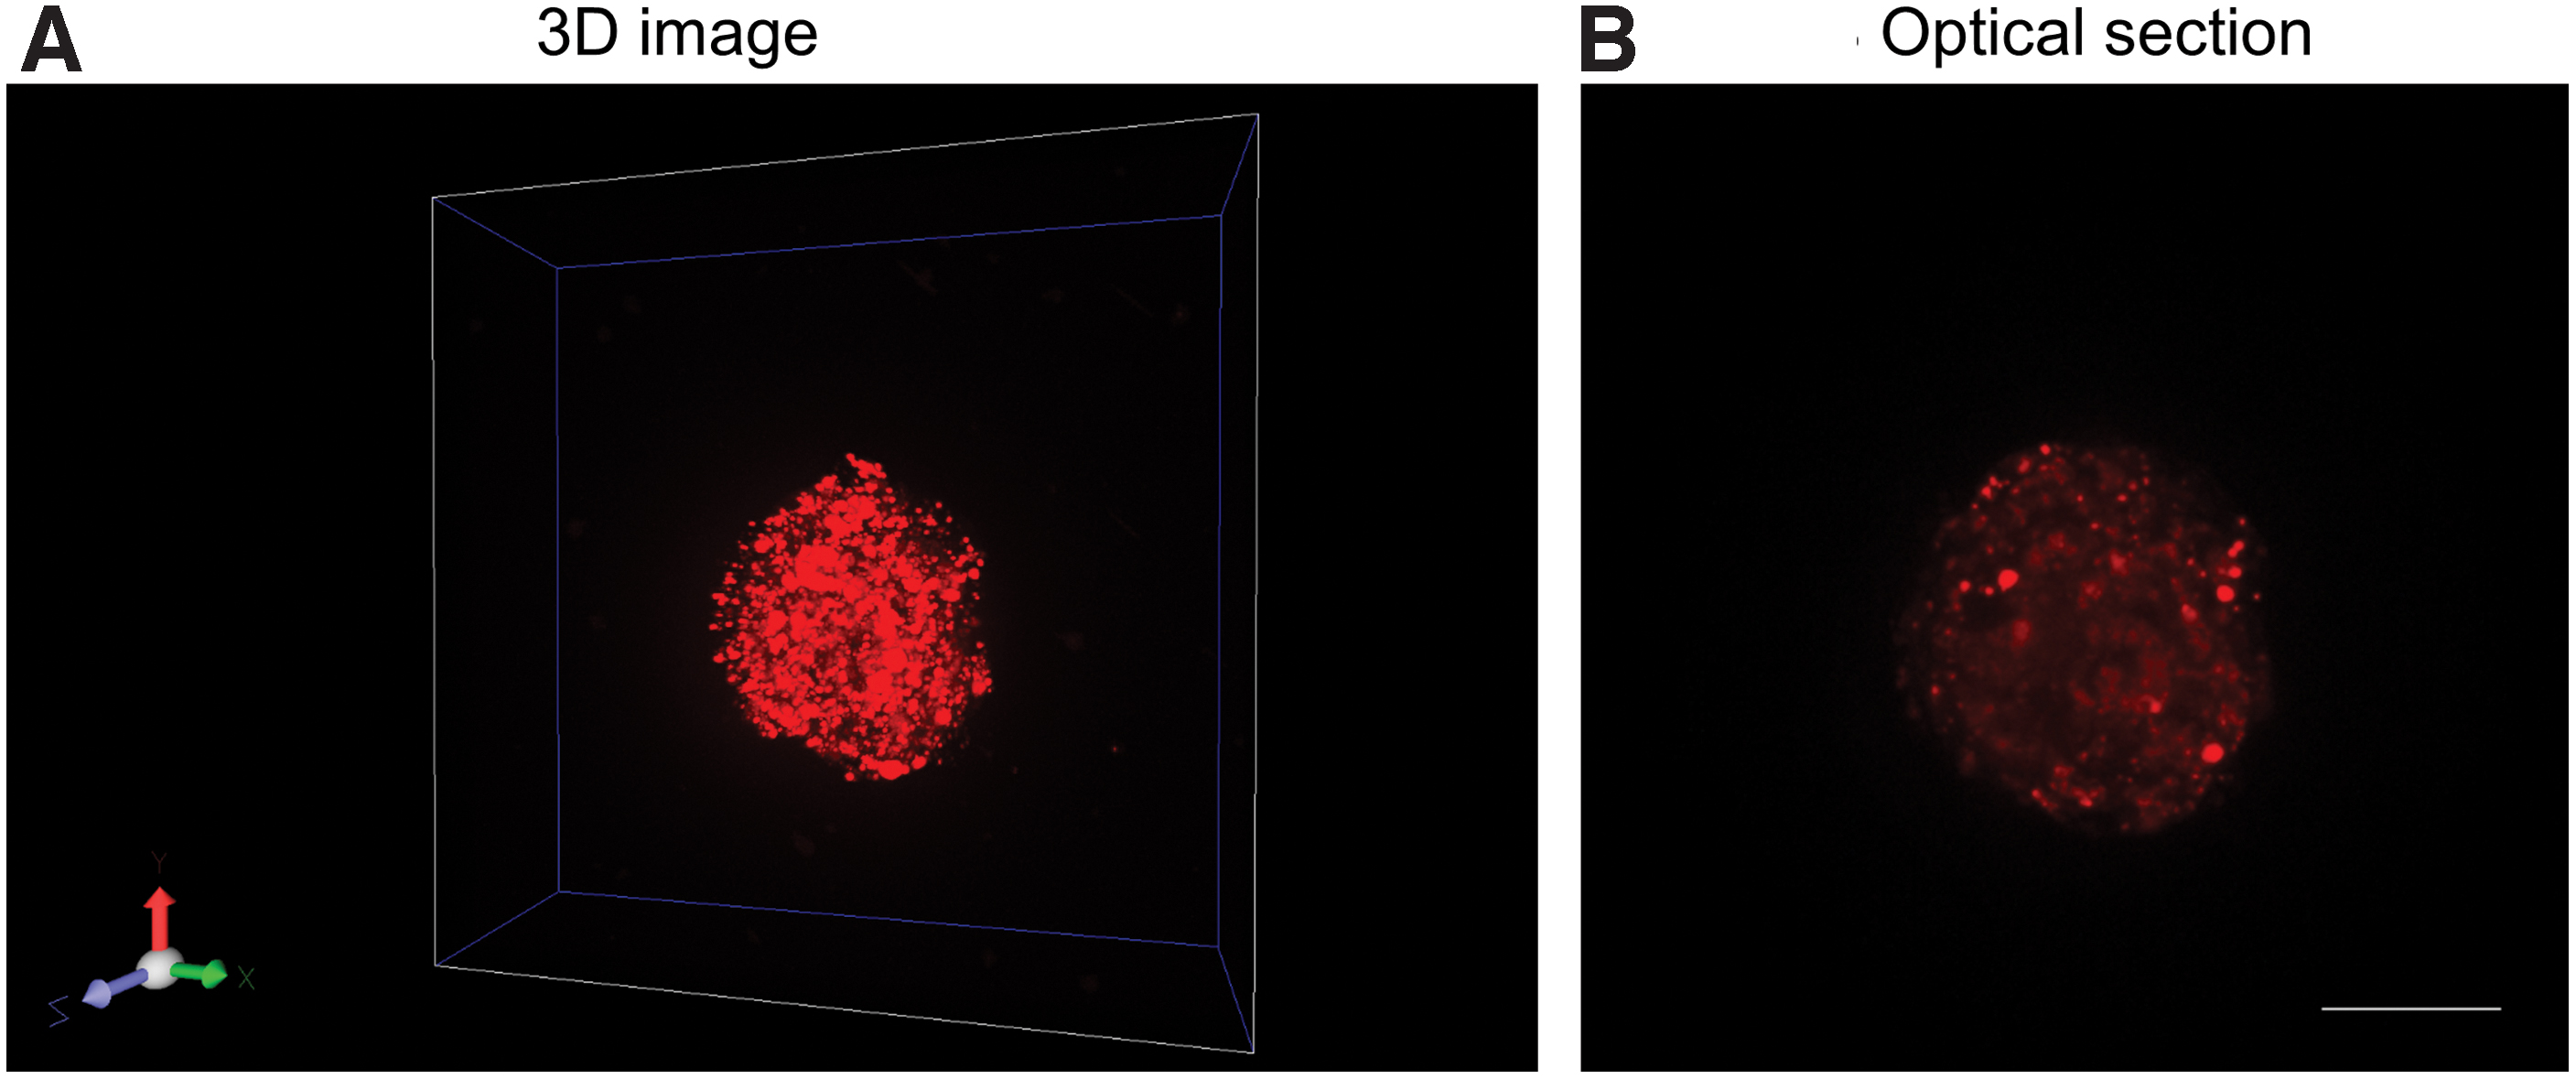
Confocal microscopic images of cell aggregates labeled with MB. The cell aggregates were prepared from the cGNSGAP MB-incubated cells, and observed by the confocal laser microscopy. TYE®563 was used as a 5′-fluorophore of GAPDH MB to adjust the optimal laser excitation and emission.
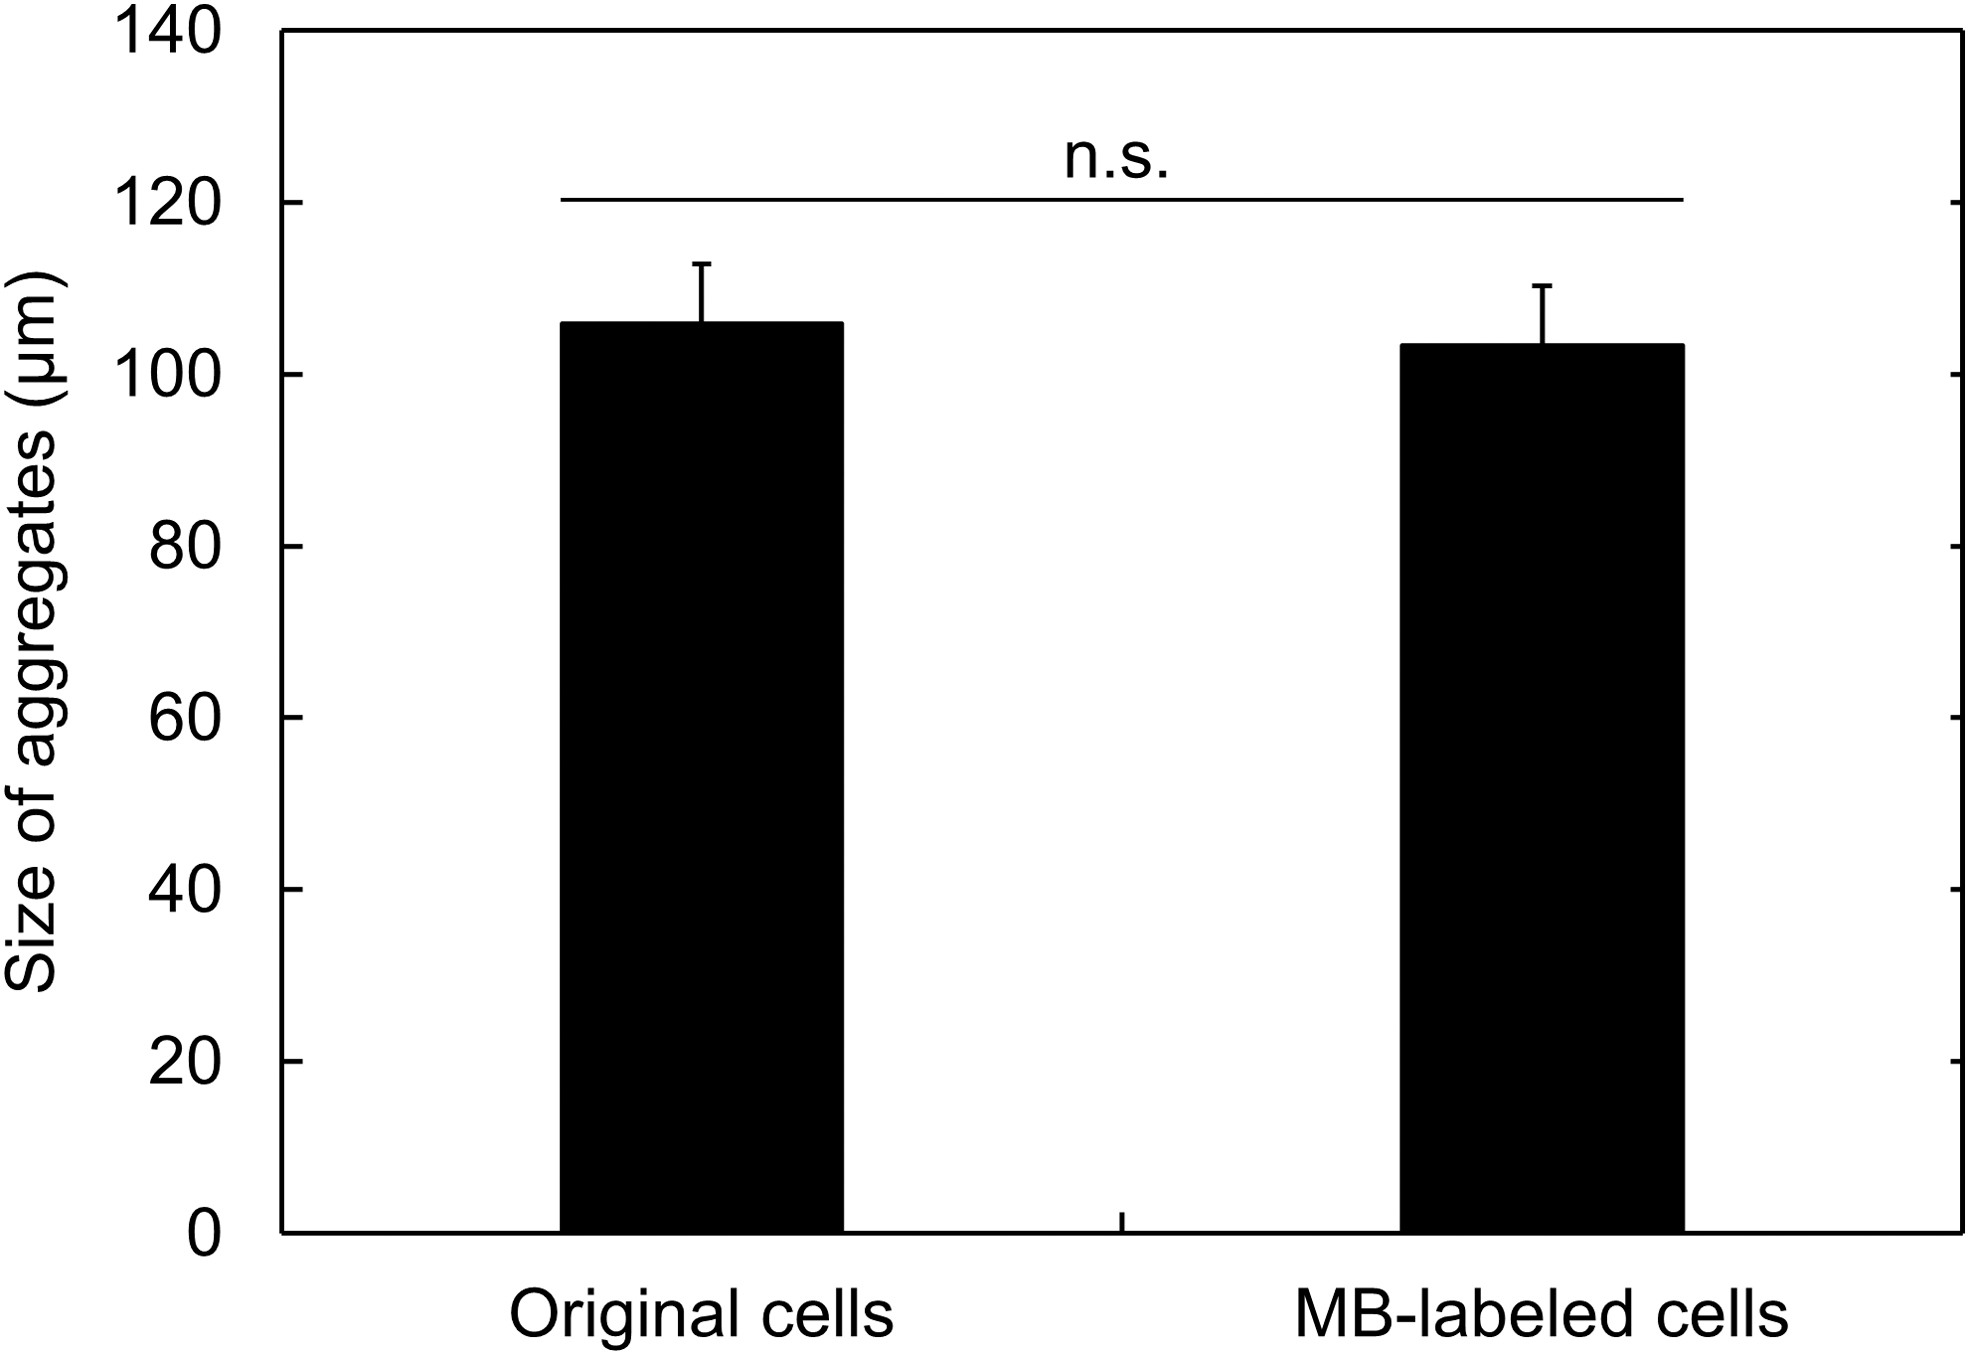
Size of cell aggregates labeled with MB. The cell aggregates were prepared from the cGNSdual MB-incubated cells (MB-labeled cells) or the original cells.
Fluorescent imaging of apoptosis in the 3D cell aggregates
The apoptosis was induced to the cell aggregates prepared from cGNSdual MB-incubated cells, and the optical sections were observed to investigate the response of MB in the 3D cell aggregates (Fig. 7). In addition to the Fas-mediated apoptosis, camptothecin of a low-molecular weight compound was used to induce the apoptosis. The fluorescence of GAPDH MB was observed for every condition (no apoptosis, Fas apoptosis, and camptothecin apoptosis), whereas that of caspase-3 MB in both the Fas- and camptothecin-induced apoptotic conditions was strongly observed compared with no apoptosis. For the fluorescence distribution of MB, the intense fluorescence of caspase-3 MB was detected in cells at the surface surrounding site of Fas-mediated apoptotic aggregates rather than the center site, while that of GAPDH MB was detected even in the interior site of aggregates. On the other hand, in the camptothecin-induced apoptotic aggregates, both caspae-3 and GAPDH MB fluorescence were detected from the interior site of aggregates as well as the surrounding site. Figure 8 shows the line profiles of fluorescent intensity in the cell aggregates. In the aggregate of Fas apoptosis, the peaks of caspase-3 MB fluorescence were mainly distributed at the edge sites, although the GAPDH MB showed the fluorescent peaks even in the interior site. On the contrary, the fluorescent peaks of caspase-3 MB in the camptothecin-treated aggregates were distributed at both the edge and interior sites. Then, the distribution of Fas Ab in the cell aggregates was investigated (Fig. 9). As the similar result of caspase-3 MB, the fluorescence of Fas Ab was strongly observed in the periphery of aggregates compared with the center site. The fluorescent peaks of Fas Ab at the edge sites were higher than those in the interior sites.

Fluorescent imaging of apoptosis in the 3D cell aggregates with dual colors. The cell aggregates were prepared from the cGNSdual MB-incubated cells, and the apoptosis was induced by the addition of 1 μg/mL Fas Ab and 0.1 μg/mL Act D (Fas apoptosis), as well as 5 μM camptothecin for further 16 h. Green: caspase-3 MB. Red: GAPDH MB. The arrows indicate the cells that emit the strong fluorescence of caspase-3 MB at the surrounding site of aggregates. Scale bar is 50 μm. Color images are available online.

Evaluation of apoptosis in the 3D cell aggregates. Left images are the merged fluorescence of caspase-3 MB (green) and GAPDH MB (red) in Figure 7, and the fluorescent intensity as a line profile (cyan lines) was evaluated (right graphs). Green line: fluorescent intensity of caspase-3 MB. Red line: fluorescent intensity of GAPDH MB. Color images are available online.

Evaluation of Fas Ab distribution in the 3D cell aggregates. The Fas Ab labeled with HiLyte Fluor™ 555 (1 μg/mL) and Act D (0.1 μg/mL) were added to the cell aggregates for 16 h, and the optical section was taken by the fluorescent microscopy to evaluate the fluorescent intensity as a line profile (cyan line). Magenta: Fas Ab. Scale bar is 50 μm. Color images are available online.
Discussion
This study demonstrates that cell apoptosis in 3D cell aggregates could be visualized by making use of the cGNSMB imaging system. The cGNSMB were incubated with the cells to label with MB in the 2D culture, and the Fas-mediated apoptosis was induced by the addition of Fas Ab and Act D. The fluorescence of cGNScasp3 MB significantly enhanced with the apoptosis induction, whereas that of cGNSGAP MB was constant, irrespective of the cell apoptosis. In addition, the apoptosis was ratiometrically detected by the cGNSdual MB to the same extent as single MB. The cell aggregates were prepared from MB-labeled cells, and the MB fluorescence was detected from almost all of the cells even in the 3D aggregates to show the homogenous distribution. In addition to the Fas-mediated apoptosis, the aggregates were treated with camptothecin of a low-molecular weight apoptosis inducer. The fluorescence of caspase-3 MB was mainly distributed at the surface surrounding site of Fas-mediated apoptotic aggregates rather than the center site, while that of GAPDH MB was detected even in the interior site. The distribution of caspase-3 MB fluorescence showed a profile similar to that of Fas Ab in the aggregates. On the other hand, in the camptothecin-induced apoptotic aggregates, both caspae-3 and GAPDH MB fluorescence emission were detected from the interior site of aggregates as well as the surrounding site.
There was no difference in the apparent size and zeta potential among cGNScasp3 MB, cGNSGAP MB, and cGNSdual MB prepared (Table 2). The apparent size was around 220 nm, and the zeta potential was of a positive value. The result indicates that the physicochemical properties of cGNSMB did not depend on the type of MB, as well as the co-incorporation of different MB types. In the previous studies, it has been demonstrated that the cGNSMB were internalized into the cells through an endocytotic pathway, followed by the endosomal escape into the cytosol.25,27 The intracellular release of MB according to the degradation of carrier cGNS enabled the detection of target mRNA. The specificity of caspase-3 and GAPDH MB for the target nucleotides in hybridization and the stability against nucleases were experimentally demonstrated. 27 In addition, at the cGNSMB concentration lower than 10 μg/mL, the incubation time for 1 h did not show any cytotoxicity. This is due to the high susceptibility of cGNSMB to cell internalization and the resulting mild internalization condition. Taken together, it is highly conceivable that the cGNScasp3 MB, cGNSGAP MB, and cGNSdual MB were efficiently internalized into the cells to label with MB, and the target mRNA of caspase-3 and GAPDH could be specifically detected based on the intracellular controlled release of MB.
The Fas-mediated apoptosis was induced by the agonistic stimulation of Fas receptor with Fas Ab in the presence of Act D. The immunofluorescent staining experimentally confirmed the Fas expression in KUM6 cells used in this study (Fig. 1). The flow cytometric analysis with annexin V/PI staining was performed to assess the Fas-mediated apoptosis (Fig. 2). PI only permeates the damaged cell membrane to stain the nucleus of late apoptotic and dead cells, while the annexin V specifically conjugates with the phosphatidylserine on the surface of apoptotic cell membrane. 38 The cell population treated with only Fas Ab or Act D was double negative for annexin V and PI, which indicates that the apoptosis was hardly induced. On the contrary, the apoptosis was significantly induced by the combination of Fas Ab and Act D. The finding suggests that the Fas Ab and Act D synergistically cause the Fas-mediated apoptosis, which is consistent with the previous reports. 39 Fas (also known as Apo-1/CD95) is one of death receptors widely expressed in many cell types.32,33,39–41 The stimulation of Fas with Fas ligands, including the agonistic antibody, results in the downstream cascade of signal transduction in the apoptosis pathway. It has been reported in mouse cardiomyocytes that the apoptotic signal transduction in the treatment with Fas Ab and Act D is composed of c-Jun N-terminal kinase (JNK) activation, Bcl-2-associated X protein (Bax) upregulation, and caspase-3 upregulation at both mRNA and protein levels. 39 It is important to claim here that the caspase-3, so-called “effector caspase,” is finally upregulated in almost all pathways to execute the apoptosis. 42 Therefore, it would be reasonable to select the caspase-3 mRNA as the target for MB in terms of the visualization of apoptosis as a versatile system.
After the cell incubation with cGNSMB for internalization and labeling with MB, a Fas-mediated apoptosis was induced by the addition of Fas Ab and Act D in the 2D culture condition. In agreement with the previous study, 27 the fluorescence of cGNSGAP MB was similarly observed for both nonapoptotic and Fas-apoptotic cells, and the fluorescent intensity was constant. On the other hand, the cGNScasp3 MB fluorescence was significantly enhanced in the apoptotic condition (Fig. 3). The result would be due to the increased expression of caspase-3 mRNA by the Fas-mediated apoptosis induction and the constant expression of GAPDH mRNA in cells. 39 Some cells showed the brighter fluorescence of GAPDH MB after the induction of Fas-mediated apoptosis. This might be due to the concentrated fluorescence in the round-shaped dead cells, which are in the late apoptotic stage (double positive for annexin V and PI, Fig. 2). However, the fluorescence of GAPDH MB from alive and early apoptotic cells (around 90% in the cell population) was in almost the same level as that of no apoptosis group. As the result of image analysis, it might be likely that there was no difference in the averaged fluorescent intensity of GAPDH MB between the Fas-apoptosis and no apoptosis groups. On the contrary, fluorescence of caspase-3 MB from both the dead and early apoptotic cells enhanced to a significant extent because of the early and sensitive detection of caspase-3 mRNA in apoptotic cells. Based on the finding, it is highly conceivable that the fluorescent increase could be sufficiently detected by the image analysis method, although it was measured as an averaged value. When the dual-color imaging was performed by utilizing cGNSdual MB, the fluorescence of caspase-3 MB was strongly observed in the Fas apoptosis condition (Fig. 4). The increased ratio of fluorescent intensity (caspase-3 MB/GAPDH MB) well corresponded to the increased fluorescent intensity of single caspase-3 MB (Figs. 3B and 4B). These results strongly suggest that the cell apoptosis could be successfully visualized by the dual-color imaging as well as the use of single MB.
The 3D cell aggregates were readily prepared only by using the cells labeled with MB in the 2D culture. The PVA-coated U-shaped bottom of wells gives cells an environment suitable for the efficient formation of aggregates. The cell adhesion on the well is inhibited by the PVA coating. 43 In addition, the U-shaped bottom allows cells to accumulate in the center of the wells, where the frequency of cell to cell contact is enhanced to form the aggregates. 43 The confocal microscopic images show that the cells labeled with MB were spatially distributed in a homogenous manner, and almost all cells emitted the fluorescence of MB (Fig. 5). In the preliminary study, it was confirmed that the labeling efficiency with cGNSMB was around 100% after the incubation in the 2D culture (data not shown). In addition, it has been demonstrated that the intracellular fluorescence of MB maintained over 2 weeks. 25 Taken together, nearly 100% of cells were labeled with MB, and the MB fluorescence was sufficiently retained even in the 3D cell aggregates. In some cases, it is difficult to label the 3D constructs of cells due to the poor penetration of imaging probes into the interior of constructs.44,45 Therefore, some researches on the construction of 3D structures following the cell labeling in a 2D culture have been reported.46–48 This labeling strategy is advantageous for the homogenous labeling of cells in the 3D constructs with varied shapes. 28 The homogenous labeling with MB makes it possible to visualize the change of cell functions in the 3D environments. The size of cell aggregates prepared was around 100 μm, which was not affected by the labeling with MB (Fig. 6). In general, it is well recognized that the excess size of aggregates results in cell death in the core of aggregates due to the insufficient supply of nutrients and oxygen.49,50 On the other hand, it has been reported that hepatocyte spheroids under the size of 100–150 μm in diameter showed no significant cell death.51,52 It is, thus, highly possible that the cell death hardly occurred in the aggregates prepared in this study without the induction of apoptosis.
It is apparent form Figure 7 that the fluorescence of caspase-3 MB was strongly observed for the Fas-mediated and camptothecin-treated apoptotic aggregates compared with nonapoptotic aggregates, while that of GAPDH MB was detected in every condition. The result suggests that the apoptosis of cell aggregates was detected by the fluorescence of caspase-3 MB, and the GAPDH MB worked well as an internal reference. The availability of internal reference in the same cell aggregate is one of advantages in the dual-color imaging. In the previous study, the addition of 5 μM camptothecin caused significant cell apoptosis (around 40% in cell population), 27 which is a similar extent to the Fas-mediated apoptosis in this study (Fig. 2). In the Fas-mediated apoptotic aggregates, the fluorescent peaks of caspase-3 MB were mainly distributed at the surface site of aggregates, while that of GAPDH MB was detected even in the interior site (Fig. 8). On the other hand, in the case of camptothecin-treated aggregates, the fluorescent peaks of caspase-3 and GAPDH MB were distributed at both the surface and interior sites. The difference in the fluorescent distribution between the Fas-mediated and camptothecin-induced apoptosis would be due to the molecular size of apoptosis inducers and their penetration into the aggregates. The Fas Ab (IgG) is a macromolecule with a Y-shaped structure. The typical dimensions of IgG are ∼14.5 × 8.5 × 4.0 nm. 53 The large molecular size of Fas Ab might prevent the penetration into the interior site of cell aggregates. It has been reported that the penetration of cetuximab (monoclonal antibody for epidermal growth factor receptor) into tumor spheroids (around 400 μm in diameter) was limited in the periphery after 16 h of addition although the penetration was observed in time- and dose-dependent manners. 54 When the penetration and distribution of Fas Ab in the aggregates were investigated (Fig. 9), the fluorescent peaks of Fas Ab showed a similar pattern to those of caspase-3 MB (Fig. 8). These findings experimentally support that the poor penetration of Fas Ab into the interior of cell aggregates, and the resulting cell apoptosis, was significantly enhanced at the surface site compared with the interior site. On the other hand, camptothecin has a low-molecular weight of 348.4 (the apparent molecular size is around 2 nm), and induces cell apoptosis by conjugating with DNA-topoisomerase I to inhibit the activity.34–36 As another type of low-molecular weight drug, doxorubicin (molecular weight of 543.5), showed the rapid penetration into the interior site of tumor spheroid (around 300 μm in diameter) within 8 h. 55 Considering the findings, it is highly possible that the camptothecin sufficiently penetrated into the interior site of aggregates due to the small molecular size, and caused the cell apoptosis over the entire aggregates. Taken together, it is likely that the MB fluorescence reflected the localization of apoptotic position as well as the expression level of target caspase-3 mRNA in the 3D cell aggregates, which is caused by the different penetration patterns of apoptosis inducers into the aggregates.
The visualization of apoptosis without the destruction of cell aggregates was achieved by the cGNSMB imaging system, which facilitated the discrimination of apoptotic position in the 3D structure. This is one of advantages over the conventional biochemical techniques like Western blotting and polymerase chain reaction (PCR). As the histological analysis, terminal deoxynucleotidyl transferase (TdT)-mediated deoxyuridine triphosphate (dUTP) nick-end labeling (TUNEL) assay has been applied to evaluate the apoptotic position in the 3D cell constructs, as well as the tissue samples. The TUNEL assay can reveal the localization of late apoptotic cells by staining the DNA fragments. However, it is necessary to prepare the histological section for the reaction with TdT and the following labeling procedures. Therefore, it would be difficult to analyze the entire 3D structures of construct. In addition, it is theoretically impossible to apply the TUNEL assay to the living samples. A fluorescent staining by the LIVE/DEAD™ assay (calcein-AM for live cells and ethidium homodimer-1 for dead cells) has been widely utilized as well. The advantage of LIVE/DEAD assay is to stain both live and dead cells by simply incubating with the fluorescent dyes. However, in the case of 3D constructs, the incubation condition often requires the optimization to confirm the complete penetration of fluorescent dyes into the interior site of constructs. On the other hand, the labeling strategy of 3D cell aggregates with cGNSMB (construction of 3D aggregates following the MB-labeling in a 2D culture) can validate the homogenous labeling even in the interior site of constructs. This is another advantage of cGNSMB imaging system.
Since the MB can be designed against theoretically every mRNA and miRNA, it is possible to visualize various cell functions in a versatile imaging system. This study demonstrates the feasibility of cGNSMB imaging system to visualize the apoptosis in 3D cell aggregates, especially the localization of apoptotic position without the destruction of aggregates. As the limitation of this study, the apoptosis in cell aggregates was visualized as the end-point assay. Further study should be performed to trace the time course of Fas Ab penetration and the consequent apoptosis in the cell aggregates. On the other hand, the intracellular controlled release of MB from the cGNS 25 and biodegradable poly(lactic-co-glycolic acid) (PLGA) nanoparticles 56 achieved the continuous and long-term detection of target mRNA. The time-course tracing of cell functions in the same cell and aggregate is quite important in the biological and biomedical research fields. In the near future, in addition to the apoptosis, various cell functions in the 3D environments will be continuously visualized for a long time period based on the intracellular controlled release of MB.
Conclusions
The cell aggregates were readily prepared from MB-labeled cells, and the MB fluorescence was detected from almost all the cells even in the 3D aggregates to show the homogenous distribution. When the apoptosis was induced to the aggregates by the addition of Fas Ab and camptothecin, the fluorescence of caspase-3 MB significantly enhanced, while the localization of MB fluorescence in the aggregates showed different distributions between the apoptosis inducers. It is likely that the MB fluorescence reflected the localization of apoptotic position caused by the different molecular sizes of apoptosis inducer and the consequent penetration into the aggregates. It is concluded that the cGMSMB are a promising system to visualize the apoptosis in 3D cell aggregates without the destruction of aggregates.
Footnotes
Disclosure Statement
No competing financial interests exist.
Funding Information
This work was partly supported by Japan Society for the Promotion of Science (JSPS) Grant-in-Aid for JSPS Fellows (DC1) (18J21579 to Y.M.), Young Scientists (A) (17H04736 to J.J.), Scientific Research (B) (20H04515 to J.J.), and Challenging Research (Exploratory) (20K21889 to J.J.).