
Abstract
A rupture of the anterior cruciate ligament (ACL) is one of the most common knee ligament injuries affecting the young and active population. Tissue engineering strategies to reconstruct the damaged ACL have met with significant challenges mainly associated with poor graft integration at the bone–ligament interface (i.e., enthesis). In this study, a “design–build–validate” strategy was employed by combining 3D Raman spectral mapping and 3D printing to develop a tissue engineered scaffold that is compositionally similar to the ACL bone–ligament interface and can provide the essential biochemical cues to promote interface regeneration and facilitate functional graft to bone integration. Results showed that Raman spectroscopy is a highly efficient nondestructive technique to determine the biochemical composition of native ACL enthesis. 3D printing using combinatory inks consisting of different compositions of methacrylated collagen (CMA) and Bioglass (BG) allowed for the fabrication of BG gradient-incorporated collagen matrices (BioGIMs) with a transition region confirmed by Alizarin red S staining. Furthermore, Raman spectroscopy validated replication of ACL enthesis composition in BioGIMs. In addition, human mesenchymal stem cells (hMSCs) cultured on BioGIMs showed morphological differences along the length of the BioGIMs as evidenced by confocal microscopy of cell cytoskeleton-stained images indicating that the cells can sense the underlying differences in matrix composition. Overall, the “design–build–validate” strategy developed in this study has significant potential to generate biomimetic tissue constructs for use at the interface regions of synthetic grafts to promote better host integration and achieve full reconstruction of the ACL.
Impact statement
Poor graft integration at the bone–ligament interface (i.e., enthesis) is a significant clinical problem in anterior cruciate ligament (ACL) repair and reconstruction. In this study, Raman spectroscopy and 3D printing technologies were used in combination for the first time in a design–build–validate strategy to develop a continuous biomimetic Bioglass gradient-incorporated collagen matrix (BioGIM) that compositionally emulates the native ACL enthesis. These BioGIMs can be fused onto the ends of synthetic ACL grafts and have significant potential to provide the essential biochemical cues to guide tissue-specific cell differentiation, augment functional matrix reorganization, promote better graft integration, and achieve full reconstruction of damaged ACL.
Introduction
Anterior cruciate ligament (ACL) tears and ruptures are the most common knee ligament injuries, with >400,000 ACL reconstruction surgeries taking place each year in the United States alone, resulting in an estimated cost of >1.5 billion dollars.1,2 Autografts and allografts are currently used in the clinic for ACL reconstruction; however, limitations such as donor site morbidity and immune rejection are major concerns. 3 To overcome these limitations and improve patient outcomes, synthetic grafts (e.g., Gore-Tex, Dacron) present a viable alternative option for ACL reconstruction.4,5 Although preliminary results are encouraging, widespread clinical use of synthetic grafts is marred due to significant concerns with stress shielding, fiber “fraying,” unwanted wear, and poor graft integration at the bone–ligament interface (i.e., enthesis).6–8 Over the past two decades, interface tissue engineering (ITE) using bioactive materials has been touted as a promising approach to regenerate the bone–ligament interface and thereby enable better stress dissipation and load transfer, augment cell response, and improve graft–host integration.2,9
The ACL enthesis exhibits a gradient in composition, structure, and mechanics along the bone–ligament interface with spatial variation in tissue-specific cell types.10,11 Initial ITE studies mainly focused on bone tissue growth by fusing an osteostimulative material with a surgical graft to improve ligament graft to bone insertion.12,13 For example, Tien et al. showed that the addition of calcium phosphate cement to the bone–ligament interface in a rabbit ACL model resulted in early bone ingrowth. 12 In a separate study, application of injectable tricalcium phosphate to the interface region in a dog model was shown to expedite the tendon–bone healing process. 13 Although these studies have shown promising results in terms of bone tunnel osteointegration, use of single phase grafts may not be an optimal solution for the regeneration of multiphasic interface tissues such as the ACL enthesis. 14 Toward reconstruction of the ACL enthesis, recent studies have focused on developing multiphasic scaffolds for the regeneration of soft-to-hard tissue interface. Jiang et al. exhibited directed differentiation of mesenchymal stem cells (MSCs) on electrospun gradient scaffolds made of poly(lactic-co-glycolic acid) (PLGA), nanohydroxyapatite, and bone morphogenetic protein 2 (BMP-2) for ligament–bone osteointegration. 15 In a similar vein, implantation of a triphasic silk-based scaffold coated with hydroxyapatite showed augmentation of ligament-to-bone interface. 16 Despite these promising outcomes, few studies have attempted to develop a continuous mineral gradient with physicochemical properties akin to the native ACL enthesis, which may be critical to achieve full functionality of the ACL tissue post-reconstruction. Therefore, there is a need for the development of novel biofabrication methodologies to generate biomimetic gradient materials that recapitulate the compositional properties of the heterogeneous enthesis region and hence provide the essential biochemical cues to promote cell migration and recruitment, direct tissue-specific cell differentiation, and stimulate de novo tissue remodeling toward seamless graft–host integration and full ACL reconstruction.
The goal of this study was to develop a “design–build–validate” strategy for the biomimetic design of continuous Bioglass (BG) gradient integrated collagen matrices (BioGIMs) that are compositionally similar to the native enthesis for use at the ends of synthetic grafts in ACL reconstruction applications. Raman spectral mapping and 3D printing methodologies were used in combination for the first time to identify the compositional information along the native ACL enthesis, print a continuous biomimetic BioGIM, and validate the compositional replication fidelity of the 3D printed BioGIMs with the mineral and collagen distribution of native ACL enthesis. Raman spectroscopy was used because of its ability to provide rapid and accurate information about the biochemical and structural composition of living tissue samples with submicron spatial resolution.17,18 In addition, Raman spectroscopy offers an objective approach to tissue analysis, yielding quantitative information and reproducibility with reduced interobserver variance. 19 For the cell studies, human MSCs (hMSCs) were cultured on the BioGIMs and the effect of change in composition on cell morphology along the length of the BioGIMs was assessed.
Materials and Methods
Materials
Acid-soluble collagen (Purecol) and methacrylated collagen (CMA; PhotoCol) were purchased from Advanced Biomatrix (San Diego, CA, USA). Bioglass (BG; 45S5 - 46.1 mol % SiO2, 26.9 mol % CaO, 24.4 mol % Na2O, 2.5 mol % P2O5; ∼1 μm particle size) was purchased from MO-SCI Corporation (Rolla, MO, USA). Hydroxyapatite was obtained from Sigma-Aldrich (MO, USA). 2,2-Azobis (2-methyl-N-(2-hydroxyethyl) propionamide) photoinitiator (VA-086) was purchased from Wako (Japan). All other chemicals and reagents were purchased from Fisher Scientific (Watham, CA, USA) unless stated otherwise.
Scanning electron microscopy
Scanning electron microscopy (SEM) was used to assess the morphology of pure collagen hydrogels, collagen–BG (Col–BG) hydrogels, as well as pure BG and hydroxyapatite powders. Col–BG hydrogels were synthesized by adding a mixture of acid-soluble collagen (3.1 mg/mL), BG (50% w/w), 0.1 N NaOH, and 10 × phosphate-buffered saline (PBS) into rubber washers (7.5 mm diameter, 2.5 mm height) and incubating the mixture at 37°C for 30 min to induce gelation. Collagen-only hydrogels were synthesized in a similar manner without the addition of BG.
For SEM analyses, hydrogels were fixed in 2.5% glutaraldehyde solution (in PBS) and subjected to dehydration in a series of different ethanol solutions (20%, 50%, 75%, 90%) for 15 min each, followed by 100% ethanol for 1 h. The hydrogels were then dried in a Leica Critical Point Drying System (Leica EM CPD3000, Germany) and mounted on stubs. Pure BG and hydroxyapatite samples were mounted directly on stubs. All samples were sputter coated with gold and observed at 3000 × magnification under SEM (JEOL JSM-6380LV).
Construction of the Raman spectral library for collagen and Bioglass
Raman spectral library was constructed to demonstrate and validate the use of Raman spectroscopy to map the spatial distribution of BG within the collagen matrix. This was performed for each of the six different conditions: pure collagen, Col–BG (75:25; w/w), Col–BG (50:50; w/w), Col–BG (25:75; w/w), pure BG, and hydroxyapatite. Raman spectral data were collected with a Renishaw (Wotton-under-Edge, United Kingdom) InVia Raman Spectrometer with a coupled Leica (Wetzlar, Germany) DM2500 microscope and an automated XYZ stage. The Raman spectrometer consists of a 785 nm near infrared (NIR) diode laser (excitation source) and a 1200/mm grating together with a 1″ Deep Depletion CCD camera that was utilized in conjunction for spectral imaging.
The objective lens primarily used was a 0.9 NA, 63 × water immersion objective (Leica). The base of the measurement sample consisted of either roughed aluminum or MgF2 slides to avoid interference from glass or other materials with the spectra. Steel washers were used to weigh down the hydrogels submerged in ultrapure water. The “Map Image Acquisition” function included in the Renishaw WiRE 4.4 software was used for acquisition of all spectra. Each map consisted of a 10 × 10 matrix of collections, with each collection lasting 3 s with three acquisitions and a 5 μm step size. Approximately three maps were taken at random nonoverlapping locations on three different samples for each condition, totaling 900 spectra.
Design, build, and validate approach for fabrication of continuous biomimetic BioGIMs for ACL enthesis reconstruction
In this study, a novel “design–build–validate” methodology was developed by integrating Raman spectral mapping and 3D printing technologies for the biomimetic design of a continuous BioGIM that emulates the compositional gradient along the native bone–ligament interface in the ACL (full details are given in the Experiment section). In the design phase, a nondestructive Raman spectroscopy technique was employed to generate high-resolution 3D compositional maps and delineate the transition in the compositional information from the hard tissue, along the enthesis region, to the soft tissue of the rabbit ACL. In addition, traditional histological analysis of ACL enthesis was carried out using hematoxylin and eosin (H&E) staining of the tissue sections for comparison with Raman spectral mapping. The build phase entailed extrusion-based 3D printing of a continuous biomimetic BioGIM using the freeform reversible embedding of suspended hydrogels (FRESHs) printing approach to attain a BG gradient construct that mimics the native ACL enthesis mineral–collagen composition. In the validate phase, the 3D printed BioGIMs were stained with Alizarin red S (ARS) to visually confirm the presence of BG gradient along the BioGIMs. In addition, Raman spectral mapping was performed on the BioGIMs to noninvasively confirm the compositional replication fidelity of the 3D printed BioGIMs with the mineral–collagen distribution of the native ACL enthesis.
Preparation of FRESH support bath
The FRESH support bath was prepared by following a protocol from previously published literature. 20 In brief, 250 mL of 1 × PBS was added to a Mason jar and heated to 55°C. To this, 10 g of gelatin type A (Thermo Fisher Scientific, Waltham, MA, USA) was added, and the jar was then autoclaved and placed at 4°C overnight. Next, chilled 1 × PBS was added and filled to the brim of the gelatin-containing jar and left to freeze at −20°C for ∼1 h. The frozen mixture was then blended in the same container for 60 s using a household blender and transferred to 50 mL tubes and centrifuged at 3000 g for 5 min at 4°C. The supernatant was discarded, and the tubes were filled up to 45 mL with chilled 1 × PBS and vortexed to resuspend the gelatin. The centrifugation step was repeated twice to ensure the complete removal of soluble gelatin. The gelatin was then distributed evenly by mixing the individual tubes and stored at 4°C until use. For 3D printing, the FRESH medium was prepared by transferring two tubes of gelatin mixture into two 60 mL capped syringes and centrifuging at 300 g for 5 min 4°C. The supernatant was discarded, and the mixture was transferred from one syringe to another using a plunger. Air bubbles were removed from the syringe by centrifuging at 300 g for 5 min. The ready-to-use FRESH was extruded into Petri dishes, gently tapped with Kim wipe to remove the excess water, and placed on the stage of the 3D printer.
Cell culture
hMSCs (Lonza; PT-2501) were cultured in 75 cm2 tissue culture flasks and expanded in low glucose Dulbecco's modified Eagle medium (DMEM) growth medium supplemented with 10% fetal bovine serum (FBS), and 1% penicillin/streptomycin (pen/strep). 3D printed BioGIMs were sterilized with 70% ethanol for 30 min, transferred to an ultralow attachment six-well plate (Corning), and washed three times with sterile 1 × PBS. hMSCs (P5) were seeded on top of the BioGIMs at a density of 5000 cells/cm2 and cultured for 7 days for cell morphology assessment. Cells were maintained in the culture medium composed of minimum essential medium Eagle—alpha modification containing 10% FBS, 10 mM beta-glycerophosphate, and 1% pen/strep. The culture medium was replaced after 6 h postseeding to remove unattached cells and then every 3 days periodically.
Assessment of hMSC morphology on 3D printed BioGIMs
Cell morphology was assessed on days 1 and 7 (N = 3 per group per time point) by washing the BioGIMs with 1 × PBS and fixing them with 3.7% formaldehyde solution for 15 min at room temperature. Then, BioGIMs were washed twice with 1 × PBS and incubated in permeabilization buffer (0.1% Triton X-100 in 1 × PBS) at room temperature for 15 min. BioGIMs were then washed with 1 × PBS and incubated in a blocking buffer (1% bovine serum albumin and 0.05% Triton X-100 in 1 × PBS) at room temperature for 30 min. After this, BioGIMs were washed with 1 × PBS and the cells were stained with a solution of AlexaFluor 488 phalloidin (1:25 dilution in 1 × PBS) (Invitrogen, CA, USA) for 30 min. The stain was then removed, washed with 1 × PBS, and the cells were imaged under fluorescence microscope (Zeiss).
Experiment
Rabbit ACL dissection and Raman spectroscopy (design)
Rabbit legs were obtained from a local supplier and the ACL was dissected from the joint, retaining the distal femoral head and proximal tibial condyle. Raman spectral mapping, as outlined previously, was used to capture the hard tissue, soft tissue, and enthesis regions of the ligament. The 785 nm NIR laser diode was used for collection of spectra along the length of the enthesis, totaling 2220 nm in 30 nm increments. The multivariate empty modeling function was performed to create a heatmap of the components within a condition, allowing for visualization of spectra based on the hard tissue, the soft tissue, and the transition region in between.
Using this heatmap, an intensity value for the percentage match to the composite spectra was ascertained from the image. Individual pixel width lines were sectioned from the heatmap to determine the component transition using the representative spectra within each line. The 940 and 960 peaks were isolated from the spectra and the individual peak values were normalized between 0 and 1 by using the minimum-maximum normalization method. Change in normalized 940 and 960 peak data correlated with the transition from collagen to hydroxyapatite that displayed a characteristic trend of increasing mineral component from one region to the next. The length of the gradient was determined from the point where the normalized values for the 960 peak begin to increase to the point at which the values plateau.
Histological analysis (design)
Conventional histological analysis of ACL enthesis was performed by H&E staining of the tissue sections for comparison with Raman spectral mapping. In brief, dissected rabbit ACL knees (N = 4) were fixed in 10% formalin for 48 h, decalcified in 9% formic acid for 24 h, and shipped to Saffron scientific histology services (Carbondale, IL, USA) in cold 1 × PBS overnight. Knees were embedded in paraffin and sectioned using a microtome. Five micrometer thickness sections were transferred to glass slides, stained with H&E, and imaged under a fluorescence microscope (Zeiss). The line measurement tool on ImageJ software was used to quantify the length of the ACL enthesis region from four different tissue sections (N = 4).
3D printing of BioGIMs (build)
Extrusion-based 3D printing approach was utilized to build a continuous biomimetic BioGIM that compositionally emulates the mineral–collagen distribution of the native ACL enthesis through the FRESH method (Fig. 1). In brief, four different inks composed of varying concentrations of BG, 1% w/v VA-086 photoinitiator, and CMA (8 mg/mL) were prepared in separate syringes and the syringes were loaded serially onto a 3D REGEMAT bioprinter (Granada, Spain). The bone side of the BioGIMs was printed using BG-incorporated CMA (BG–CMA) ink (70% w/w BG–CMA) and the ligament side was printed adjacent to the bone side using pure CMA ink (i.e., no BG). The interfacial region using 40% w/w and 10% w/w BG–CMA inks was crafted by overlapping the bone and ligament prints, respectively. Next, the 3D printed BioGIM was stabilized through photochemical crosslinking by exposing it to UV light for 1 min. Post-UV crosslinking, BioGIM printed in FRESH medium was incubated at 37°C for 45 min to melt the gelatin support medium, allow for collagen fibrillogenesis, and recover an intact BioGIM. After this, BioGIM was washed with copious amounts of ultrapure water to remove excess gelatin. SEM imaging was performed to assess the surface microstructure along the BioGIMs by following a rigorous sample preparation procedure as described in the Scanning Electron Microscopy section.

Schematic illustration of 3D printing of biomimetic BioGIMs using the FRESH technique and its application for bone–ACL interface reconstruction. ACL, anterior cruciate ligament; BioGIM, biomimetic Bioglass gradient-incorporated collagen matrix; FRESHs, freeform reversible embedding of suspended hydrogels.
Confirmation of compositional gradient through ARS staining (validate)
ARS is commonly used to stain calcium ions. BG is rich in calcium ions and, therefore, ARS can be used to visually confirm the fabrication of the continuous gradient from mineral phase (70% BG–CMA) to a pure collagen (ligament) phase. BioGIMs were stained with 40 mM ARS (pH 4.1) for 20 min at room temperature with gentle shaking and washed with ultrapure water to remove the excess stain. After this, high-magnification images of the stained BioGIMs were captured using a DSLR camera (Canon) equipped with a macro lens.
Validation of compositional fidelity using Raman spectroscopy (validate)
Raman spectroscopy was used to validate the compositional gradient in the 3D printed BioGIMs. In brief, BioGIM was transferred onto a rough aluminum slide, submerged in ultrapure water, and weighed down using steel washers. A 785 nm NIR diode laser and 63 × water immersion objective lens were used for all spectral acquisitions from 700 to 1800/cm wavenumber range. Three different regions (BG–CMA, interface, CMA) of BioGIMs were mapped separately at four different points—BG–CMA, two points along the interface region, and CMA. Each map consisted of a 12 × 10 matrix of collections, with 5 acquisitions for 5 s and a 10 μm step size. The collected Raman spectra were processed using cosmic ray removal, signal smoothing, and baseline subtraction for background removal using WiRE 4.4 software.
Results and Discussion
Creation of Raman library
SEM analyses revealed a distinct morphology for all the samples. A typical characteristic fibrous morphology was exhibited by pure collagen hydrogels (Fig. 2A). Col–BG (50:50; w/w) hydrogels displayed BG particles embedded around the collagen fibers (Fig. 2B). BG and hydroxyapatite powder exhibited an irregular shape and were largely agglomerated (Fig. 2C, D). Raman spectroscopy was performed to characterize and explore changes in spectral information for pure collagen, BG incorporation within collagen (25:75, 50:50, 75:25; w/w), pure BG, and pure hydroxyapatite, and the results are depicted in Figure 2E.
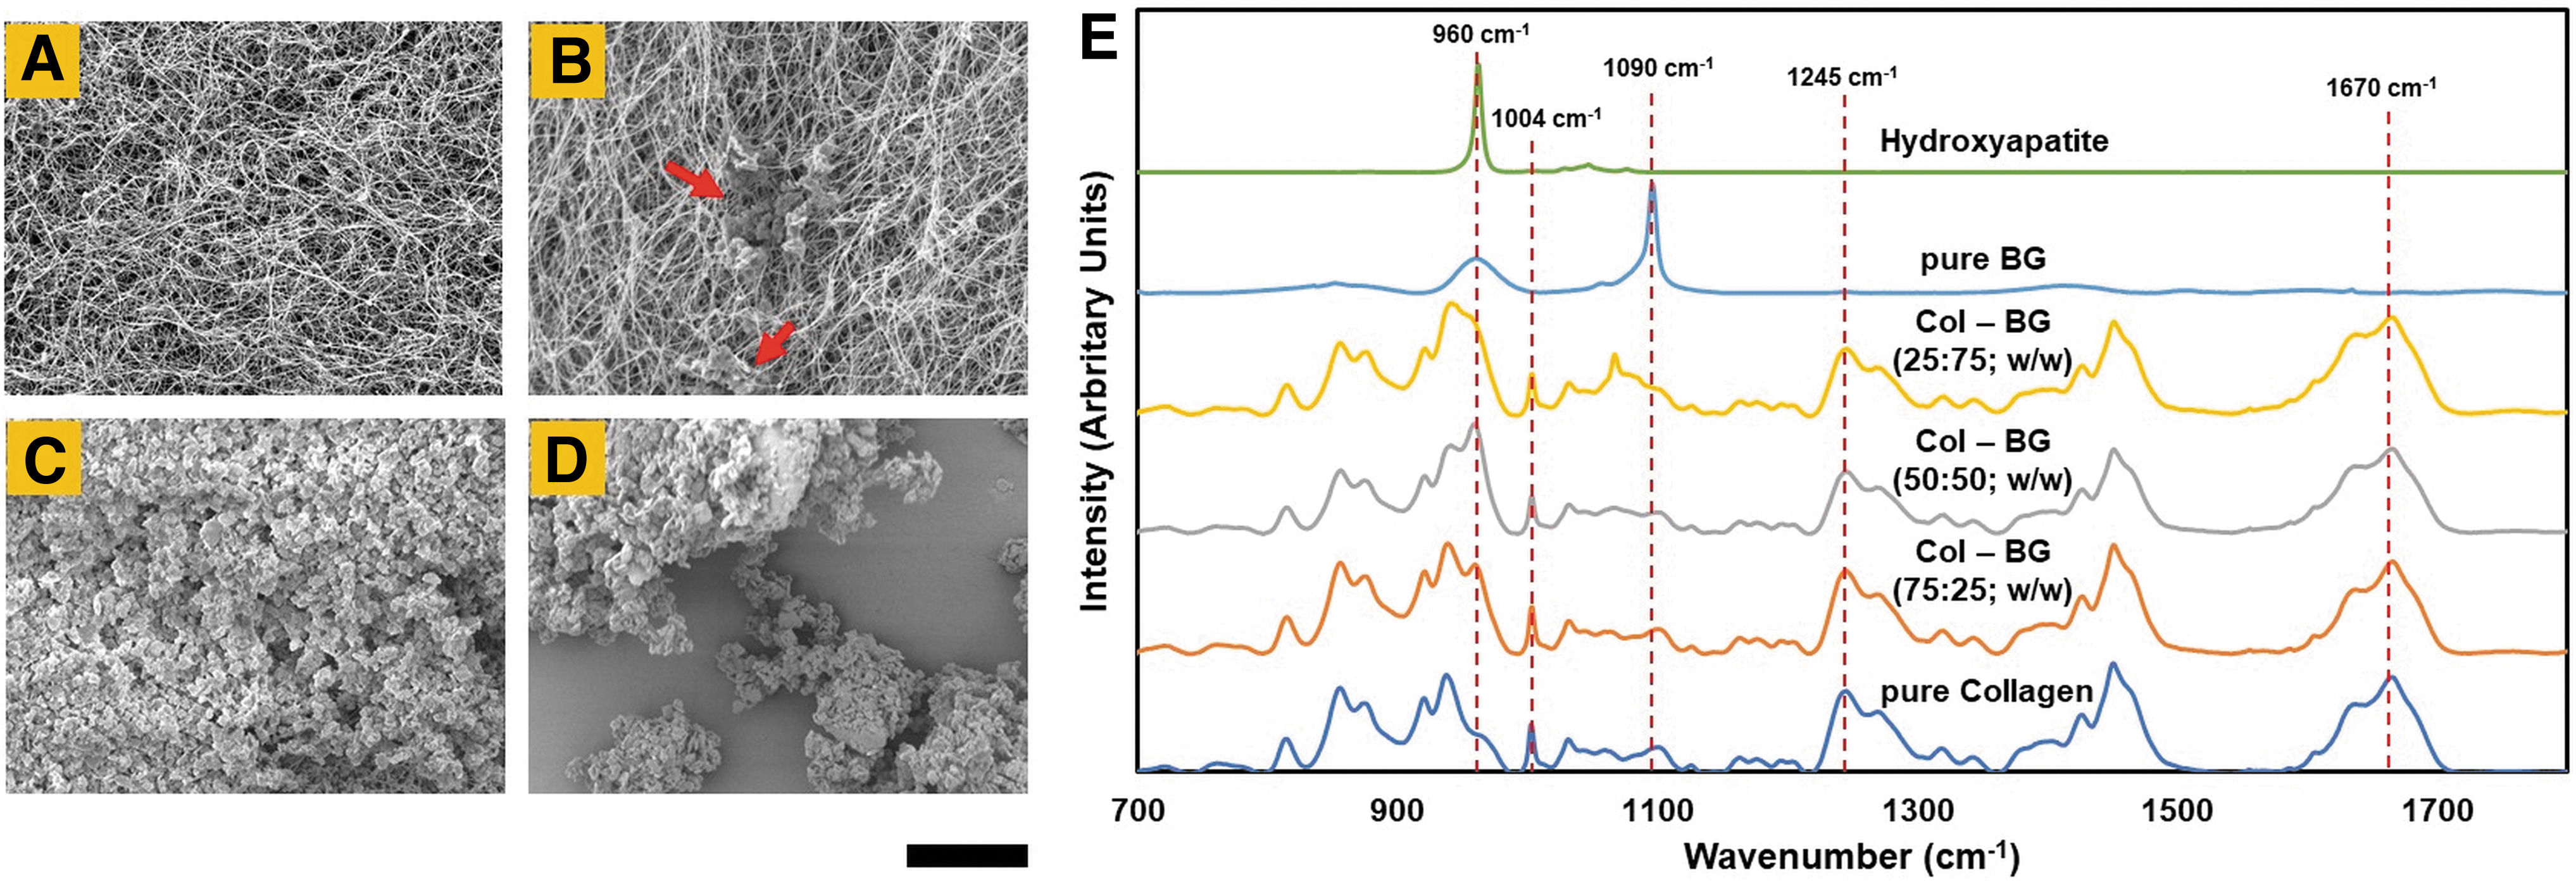
SEM images show morphology of
Results from the pure collagen spectra showed four common peaks centered at 855, 938, 1245, and 1670/cm. The 855/cm peak is assigned to proline ring, 938/cm (C–C stretching vibration) peak is associated with the α-helical structure of collagen, 1245/cm peak with amide III band, and 1670/cm (C = O stretching region; amide I band) peak correlates with the interaction between collagen fibers. These results are in agreement with prior studies that have depicted similar Raman spectra for collagen type I.21,22 A very sharp peak was observed at 960/cm for pure hydroxyapatite that is a typical Raman spectra of hydroxyapatite powder. 23 The 960/cm peak was also observed for BG-incorporated collagen hydrogels and pure BG powder.
In addition, a significant increase in the 960/cm peak was observed as the concentration of BG increased, reflecting the uniform distribution of BG within the collagen matrix. The increase in the 960/cm peak is indicative of phosphate stretching mode and is associated with the mineral component.24,25 Together, these results indicate that Raman spectroscopy can detect changes in the composition of Col–BG matrices.
Raman spectroscopy of rabbit ACL
Raman spectroscopy is a nondestructive technique that can be used to map the spatial compositional makeup of native hydrated tissue without disrupting intricate tissue structure. 26 In this study, rabbit ACL tissue was dissected together with the adjoining femoral and tibial ends, inclusive of the ACL enthesis (Fig. 3A, B). Raman spectra were acquired from the “fingerprint” region (∼700–1800/cm) 27 and processed using Wire 4.4 software. Spatially colocalized spectra were created by overlaying a false color image of the compositional gradient and the colors were assigned to match the spectra with the library data (Fig. 3C). 28
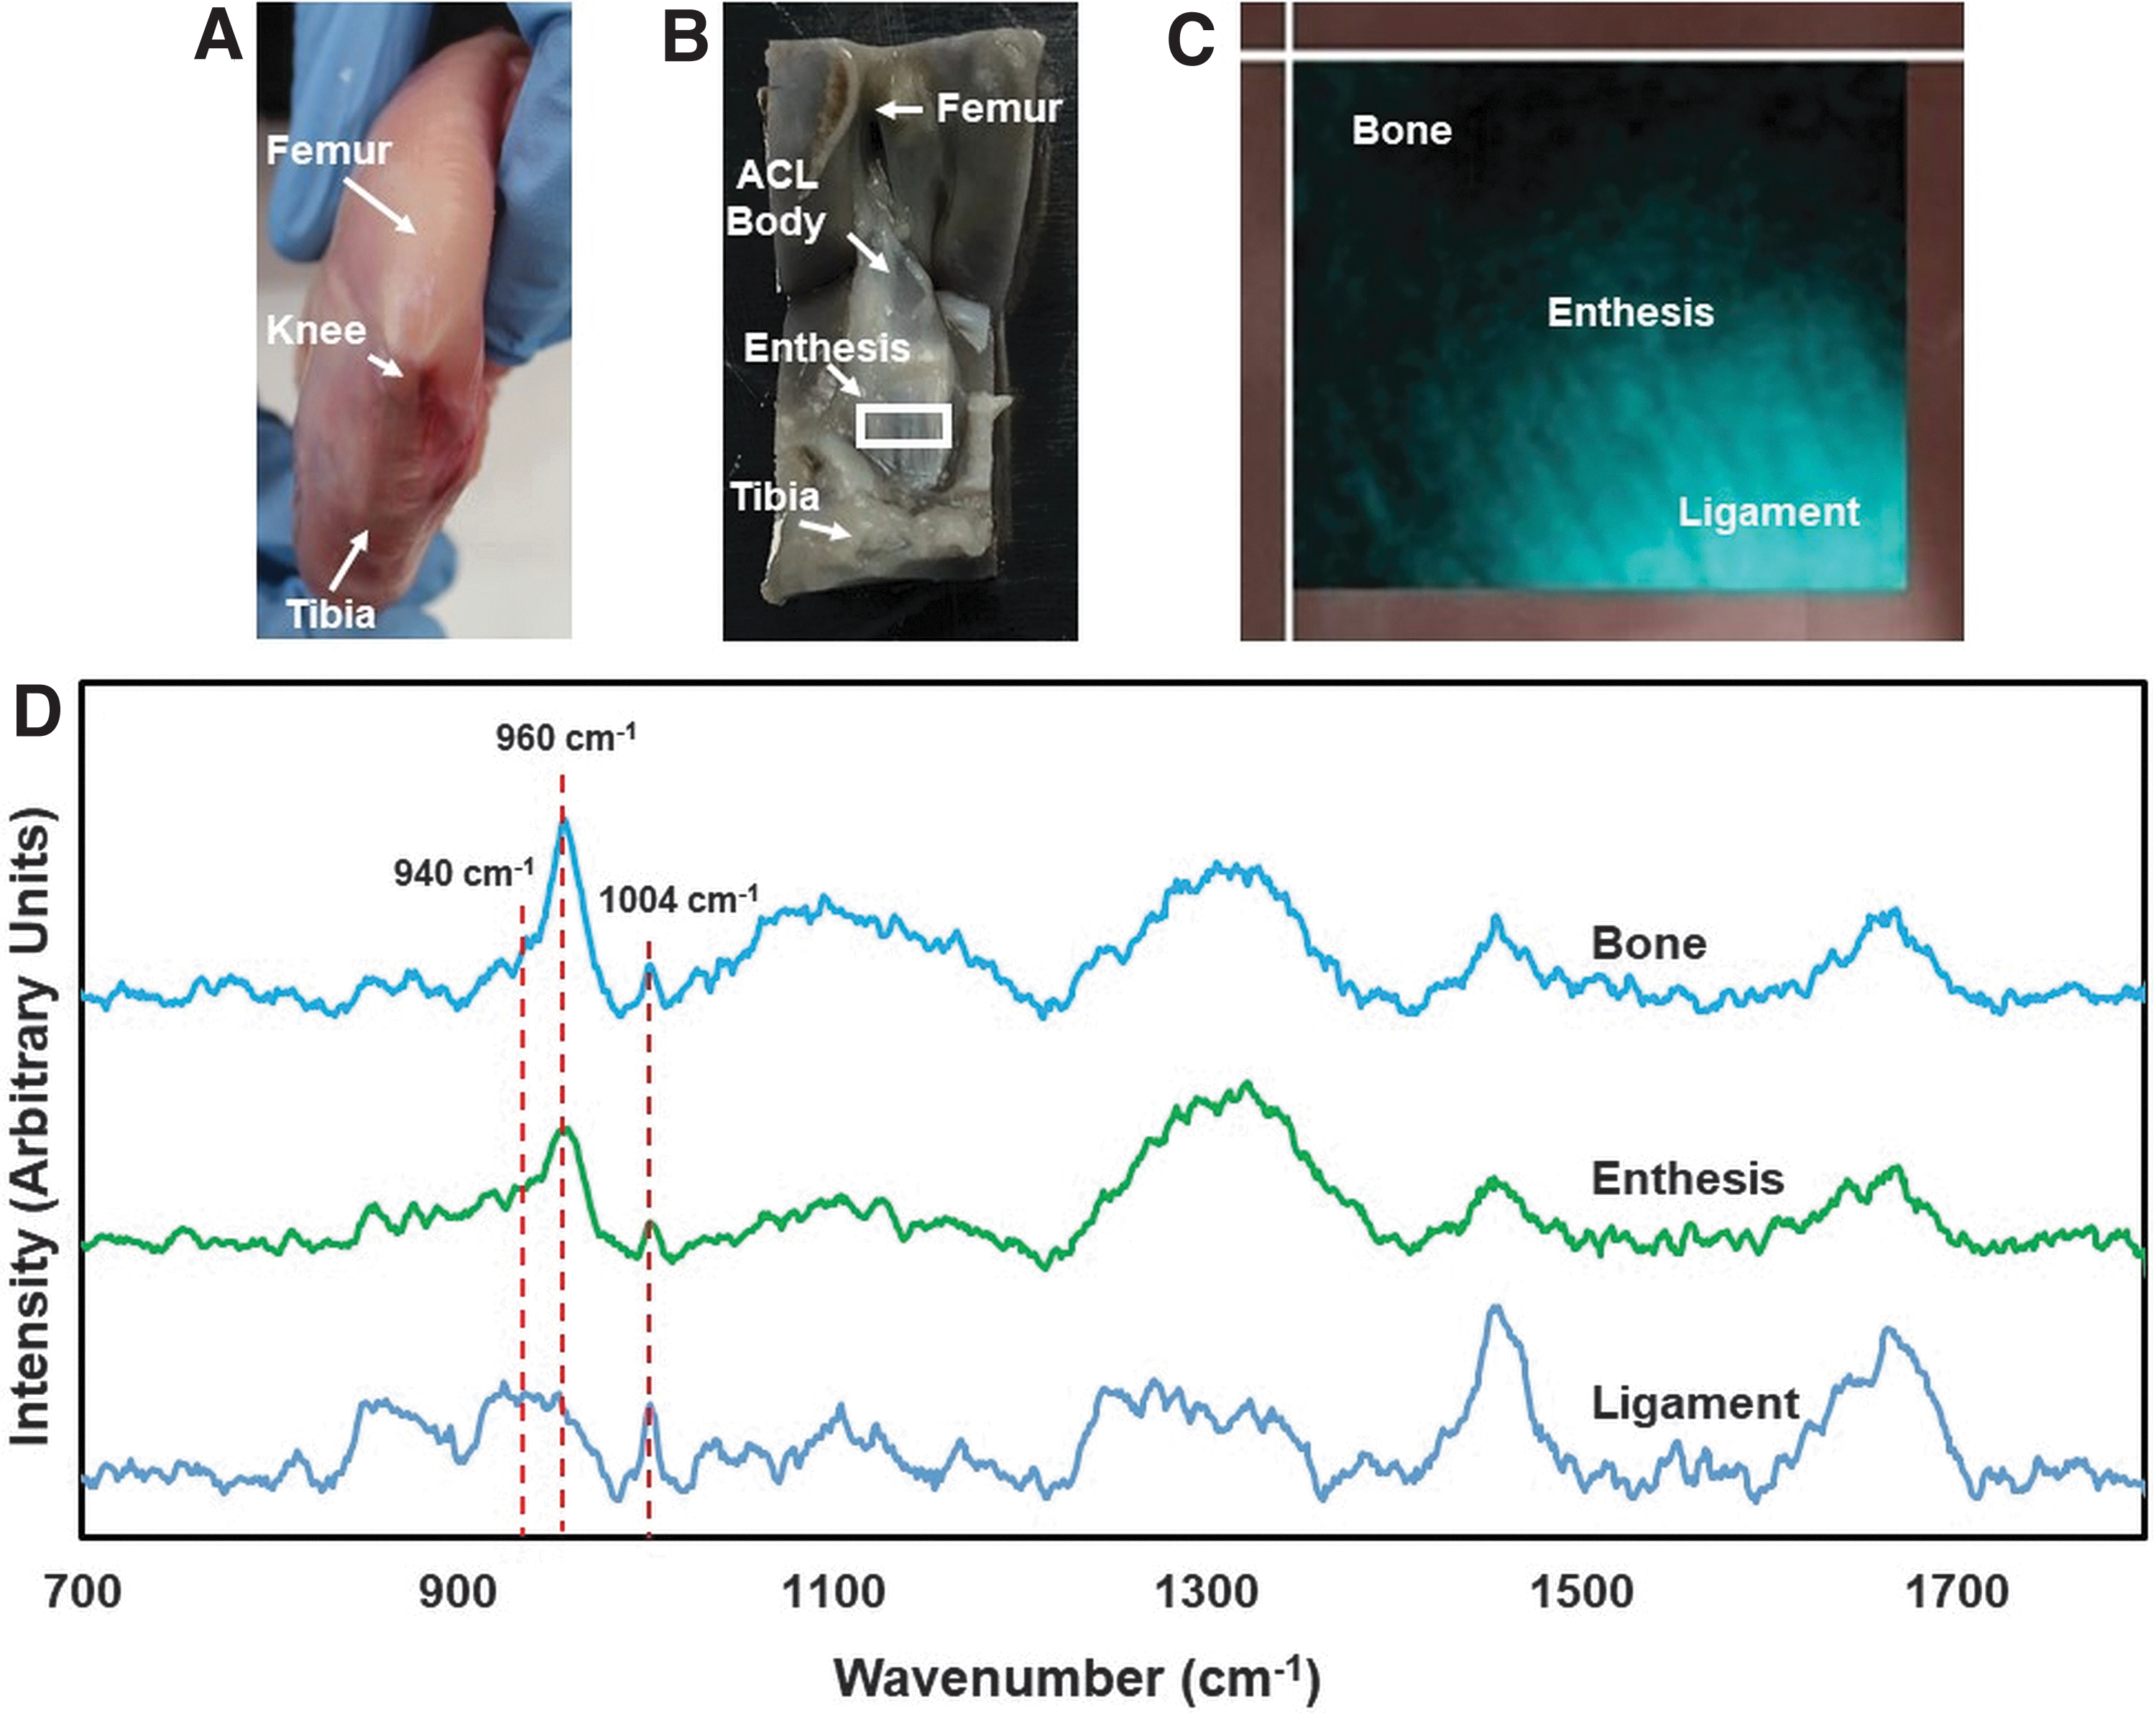
The dense fibers within the ligamentous region (blue) of the ACL can be observed as opposed to the bone side (black). A proprietary unsupervised learning algorithm was used for the automated extraction of characteristic Raman spectra at three different regions (ligament, enthesis, and bone) of rabbit ACL (Fig. 3D). Results displayed common collagen bands for all spectra, and their Raman spectrum was used for further analysis. The peaks observed at 1245 and 1670/cm for the ligament side are mainly due to the presence of collagen. 29 The phosphate vibrations at 960/cm are the strongest bone mineral markers, but the bands at 960/cm are characteristic of hydroxyapatite. 30
For the enthesis spectrum, collagen and hydroxyapatite can be clearly seen since these are the principal components of the enthesis region. Furthermore, these peaks change in intensity with different areas of the ACL interface. A rise in the 960/cm peak was observed for the enthesis region compared with the ligament region that signifies an increase in the mineral component and was finally dominated by the bone spectra. Kazanci et al. and Tarnowski et al. utilized a similar technique to determine the spatial composition of mineral environments within human cortical bone and mouse calvaria, respectively.31,32 Together, these results depict that Raman spectroscopy can delineate compositional differences along length of the ACL enthesis.
Comparison of enthesis region through Raman spectroscopy and histology
Raman spectra were utilized to determine the composition of organic and inorganic components in the ACL tissue. 33 The compositional gradient was delineated by isolating the 940/cm (collagen) and 960/cm (mineral) peaks. Increase in normalized 960 peak data and decrease in normalized 940 peak data signified a smooth transition from collagen to the mineral along the length of the enthesis region (Fig. 4A). Calculation of the collagen and mineral peak intensities yielded a quantitative indicator of the graded composition, and the average thickness of the enthesis region from the Raman mapping was found to be ∼330 μm.

Sections of rabbit ACL were stained with H&E and correlated with Raman maps (Fig. 4B). H&E-stained histological analyses of the ACL revealed a gradual transition from bone to mineralized fibrocartilage (MFC) region to nonmineralized fibrocartilage (NFC) region to the ligament (Fig. 4C). The ligament region of the ACL was composed of thick wavy bundles of collagen fibers and was stained light orange, whereas the bony region was stained dark orange. The ligament's collagen fibers coursed through NFC to MFC and the junction between the two was clearly visible. This gradual change in the stiffness reduces stress at any single point along the ACL, allowing for complex mechanical loads to be transmitted from soft tissue to bone.
Quantitative line measurements for histological analyses depicted a thickness of enthesis region up to 230 μm. The difference of 100 μm in thickness of the enthesis region between Raman spectroscopy and histology may be attributed to possible drying of the tissue during harsh histological processing steps (e.g., fixation, sectioning, and staining) and age-related tissue heterogeneity in rabbits.10,34 Together, these results suggest that Raman spectroscopy offers an advantage over conventional histology as it is nondestructive and allows for rapid and accurate determination of ACL enthesis composition with much less labor intensiveness, requiring no sample preparation.
Validation of compositional gradient through ARS staining and Raman spectroscopy
ARS has been widely used as a reagent for calcium staining of tissue sections. 35 CMA side of the BioGIM revealed a lighter red upon ARS staining, possibly due to the dense collagen layers (Fig. 5A). On the contrary, BG side of the BioGIM stained dark red due to presence of calcium-rich ions in BG particles (Fig. 5A). Based on our results, ARS staining visually confirmed the presence of a continuous BG gradient within the 3D printed BioGIMs by the transition of dark red (BG–CMA) to a lighter red (CMA) through the interface. This method has been employed in previous studies to confirm the uniform distribution of BG within the matrices.36,37

SEM imaging showed a porous surface microstructure on the BG-rich side and the interface region of the BioGIMs possibly due to agglomeration and surface release of BG particles (Fig. 5B). Higher magnification SEM images showed differences in surface microstructure along the length of the gradient with the presence of BG particles on the BG–CMA side and the interface regions, and a typical collagen fibrous morphology on the CMA side (Fig. 5C). In addition to visual confirmation of the gradient with ARS staining, Raman spectral maps were collected along the length of the BioGIMs to validate the compositional replication fidelity between the BioGIMs and the native ACL.
The multivariate empty modeling function was performed to create a heatmap of the components within a condition, allowing for visualization of Raman spectra. Results from the Raman spectroscopy showed strong similarity to that of Raman map data obtained from the native rabbit ACL enthesis. The peak at 960/cm that is indicative of phosphate stretching mode increased in intensity on the interface region and became narrower on the BG side of the BioGIMs (Fig. 5D). In contrast, no 960/cm peak was observed on the collagen side, as would be expected.
Unlike the bone–ligament interface of the native rabbit ACL joint, Raman spectral mapping to generate change in BG concentration curves for BioGIMs was challenging due to subtle variations in the thickness of the 3D printed BioGIM, resulting in differences in the z-height between the Raman objective and the BioGIM. Nevertheless, evidence of a progressive change in the 960/cm peak along the length of the BioGIMs is clearly indicative of a continuous BG gradient within the 3D printed scaffold (Fig. 5D). One approach to overcome this challenge and generate BG concentration curves along the gradient can be to use collagen inks with higher concentrations (e.g., >10 mg/mL) that can enable printing of BioGIMs with more uniform thickness comparable with the native ACL tissue. Together, these results confirm and validate the replication of the compositional gradient akin to the rabbit enthesis.
Assessment of cell morphology on 3D printed BioGIMs
hMSCs were cultured on 3D printed BioGIMs to assess changes in cell morphology along the length of the BioGIMs as preliminary evidence that changes in matrix composition can influence cell response. Cell morphology on the 3D printed BioGIMs was assessed through cell cytoskeleton staining and fluorescence microscopy. Microscopy images showed even distribution of cells with little to no cell spreading on day 1 along the length of BioGIMs (Fig. 6A–C). On day 7, a typical spindle-shaped hMSC morphology was observed on the collagen side (Fig. 6D), whereas greater cell spreading with cuboidal-like morphology was noticed on the interface and BG side (Fig. 6E, F). In addition, a visible increase in the number of cells was observed from days 1 to 7 along the length of BioGIMs. Furthermore, higher number of cells was seen on the CMA side compared with the BG-incorporated side of the gradient on day 7 (Fig. 6G). Slower proliferation on the BG side many be indicative of hMSC differentiation toward osteoblast-like cells on the BG-incorporated side of the BioGIMs. These results are in agreement with previous studies wherein greater cell spreading has been observed in cells during osteogenic differentiation of MSCs.38,39 These initial results suggest that cells can sense and respond to changes in the underlying matrix composition. In future study, BioGIM functionality must be assessed by evaluating material-directed tissue-specific cell differentiation along the gradient and performing animal experiments in an in vivo rabbit ACL model for the regeneration of soft-to-hard tissue enthesis.
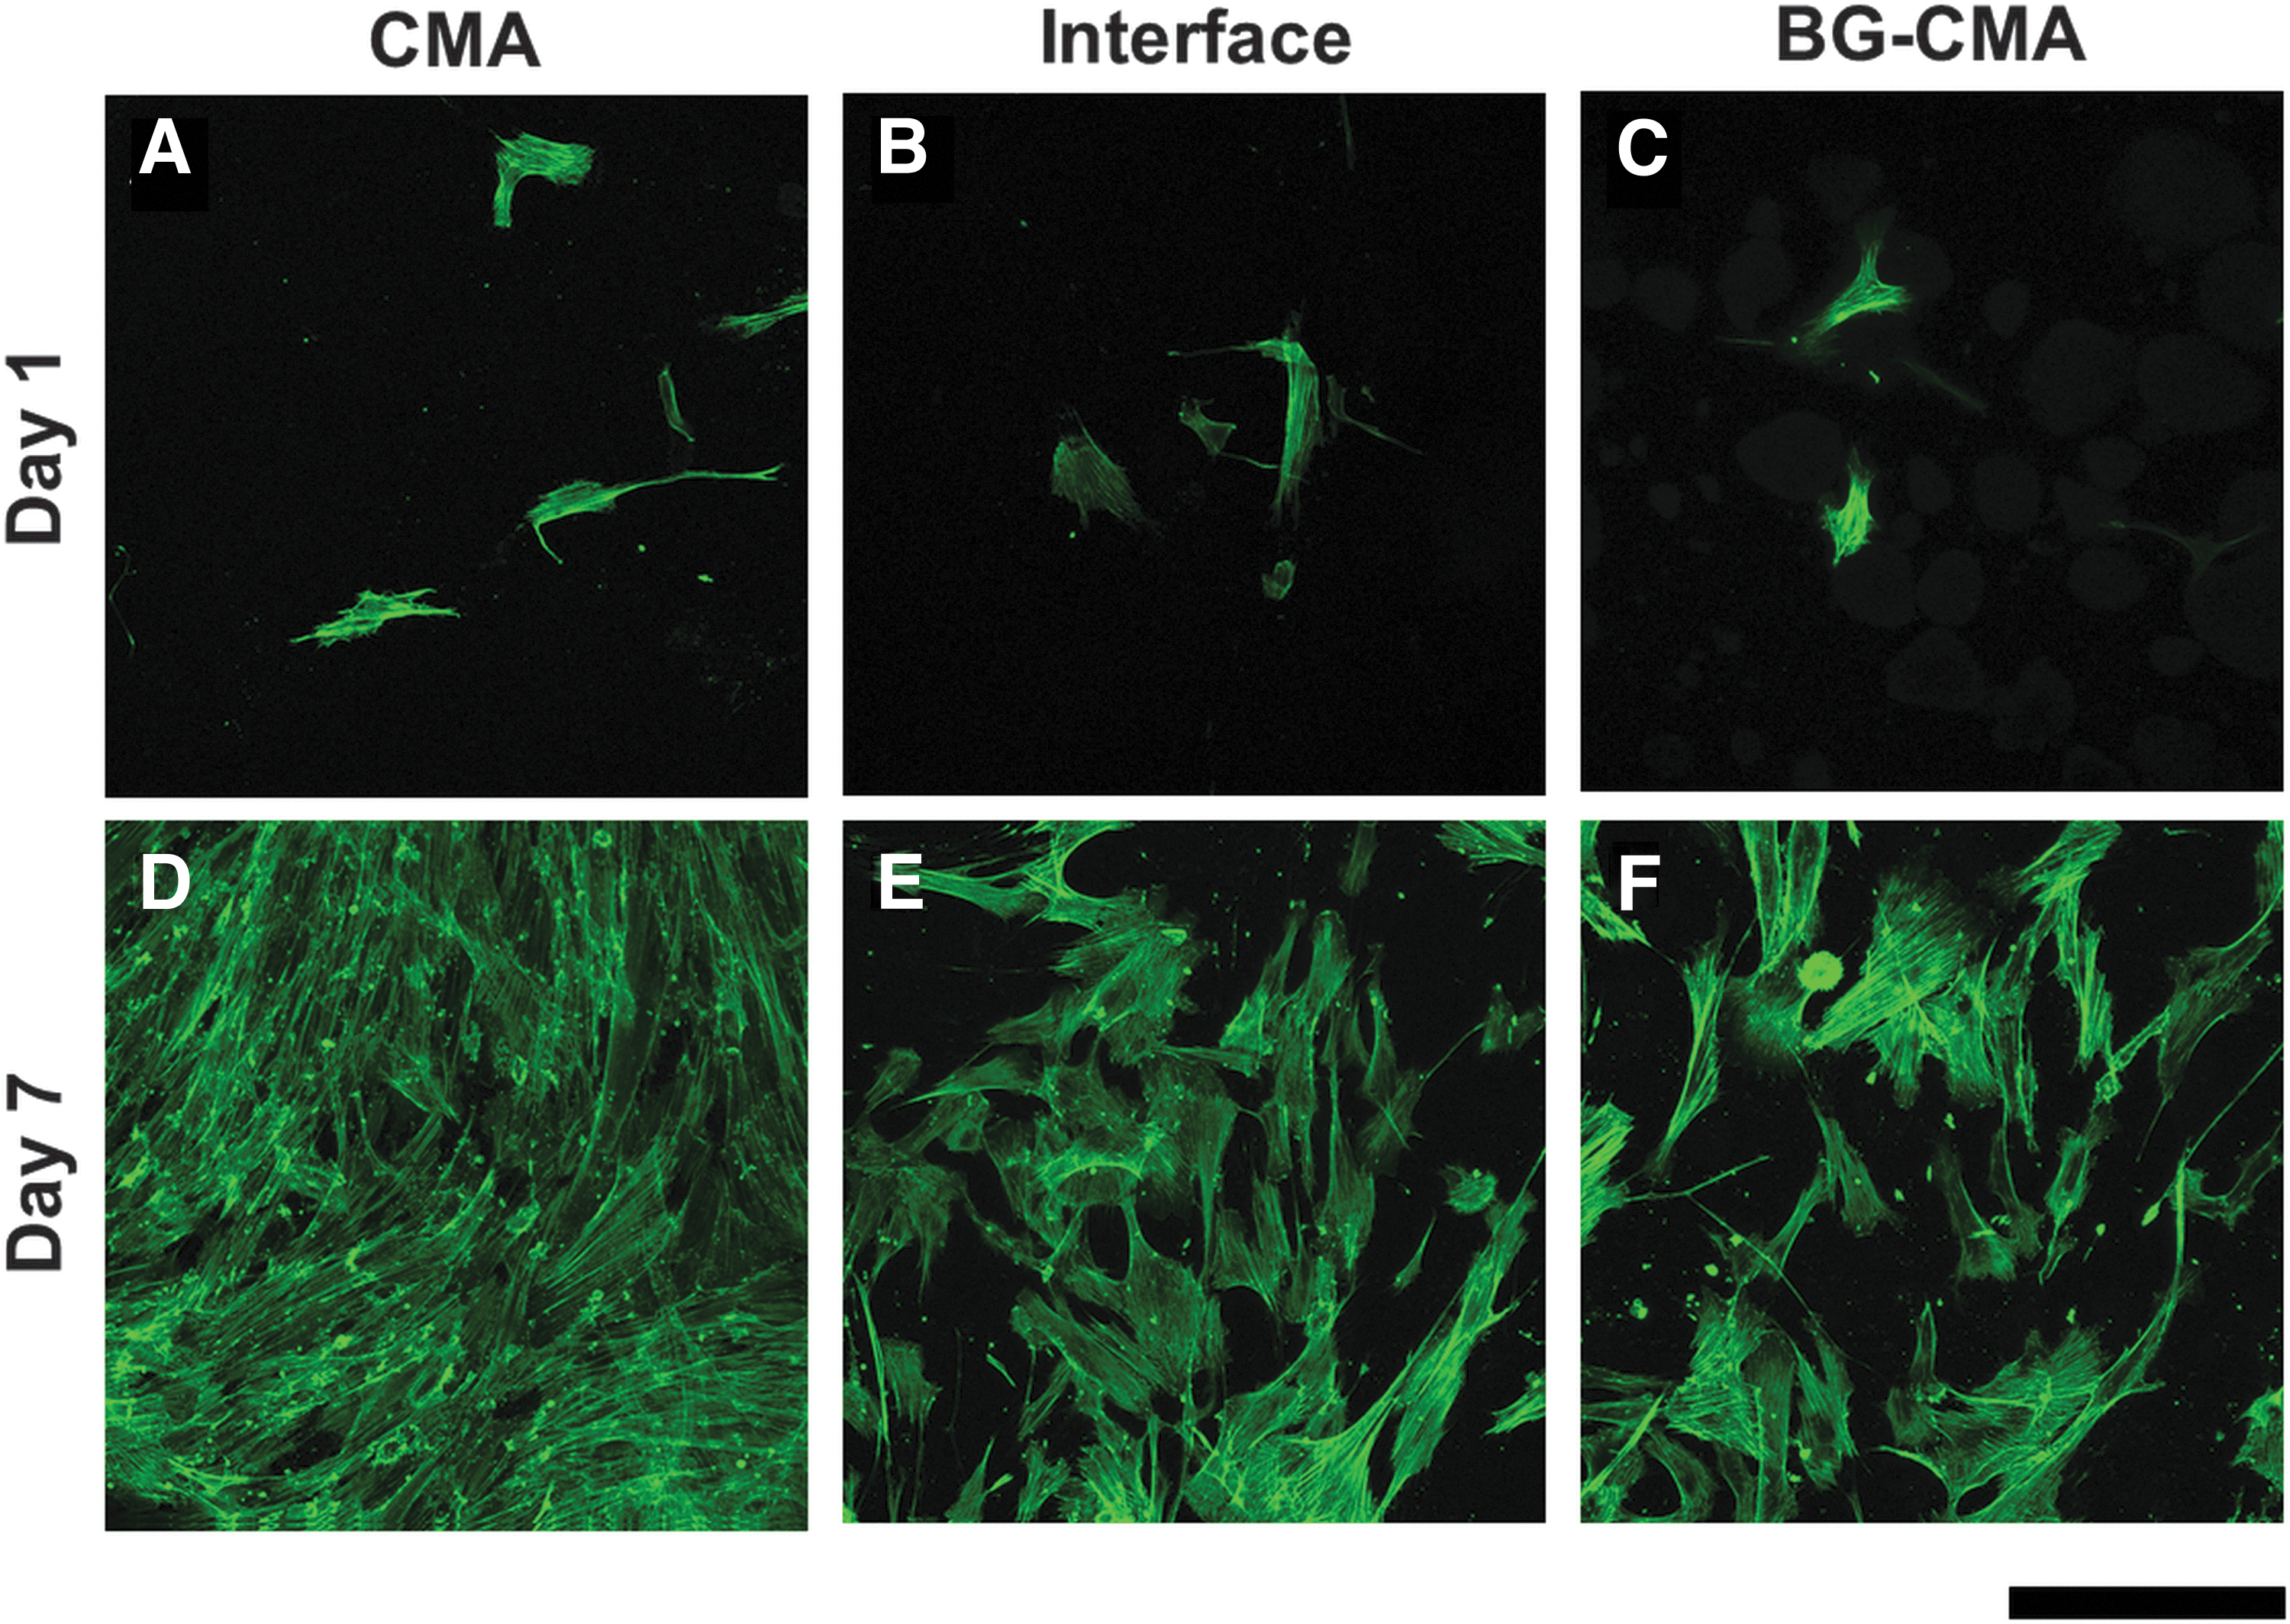
Assessment of cell morphology via cytoskeleton staining using Alexa Fluor 488 phalloidin. Confocal microscopy images of changes in cell morphology along the length of BioGIMs—
Conclusions
In conclusion, results from this study demonstrate that Raman spectroscopy is a highly efficient nondestructive technique to determine the biochemical composition of native ACL enthesis. 3D printing using combinatory inks (i.e., collagen and BG) can enable fabrication of continuous mineral gradient constructs with composition akin to the native enthesis as confirmed qualitatively using ARS staining and validated semi-quantitatively using Raman spectroscopy. Preliminary results using hMSCs suggests possible material-directed effects on cell response as indicated by differences in cell morphology along the length of the gradient.
Overall, the “design–build–validate” strategy developed in this study can be leveraged to generate biomimetic tissue constructs for use at the interface regions of synthetic grafts to promote better host integration and achieve full reconstruction of the ACL. In addition, application of this strategy is not limited to ACL enthesis but can be easily applied to other interfacial joints such as the rotator cuff and articular cartilage.
Footnotes
Acknowledgments
The authors acknowledge the participation of Dr. Pengfei Dong and Ms. Ana Delgado in the study.
Ethics Statement
Live vertebrate animals were not used in this study. Therefore, ethical review and approval by the institutional animal care and use committee (IACUC) was not required.
Disclaimer
The content reported here is solely the responsibility of the authors and does not necessarily represent the official views of the NIH.
Disclosure Statement
No competing financial interests exist.
Funding Information
This study was supported by a grant from National Institute of Health (NIH 1R15AR071102).