




Abstract
Isolated individual myofibers are valuable experimental models that can be used in various conditions to understand skeletal muscle physiology and pathophysiology at the tissue and cellular level. This report details a time- and cost-effective method for isolation of single myofibers from the flexor digitorum brevis (FDB) muscle in both young and aged mice. The FDB muscle was chosen for its documented history in single myofiber experiments. By modifying published methods for FDB myofiber isolation, we have optimized the protocol by first separating FDB muscle into individual bundles before the digestion, followed by optimizing the subsequent digestion medium conditions to ensure reproducibility. Morphological and functional assessments demonstrate a high yield of isolated FDB myofibers with sarcolemma integrity achieved in a shorter time frame than previous published procedures. This method could be also adapted to other types of skeletal muscle. Additionally, this highly reproducible method can greatly reduce the number of animals needed to yield adequate numbers of myofibers for experiments. Thus, this advanced method for myofiber isolation has the potential to accelerate research in skeletal muscle physiology and screening potential therapeutics “ex vivo” for muscle diseases and regeneration.
Impact statement
Single myofiber isolation can be a challenging step for researchers conducting muscle electrophysiology, live cell imaging studies, and so on. We have developed a modified method to produce consistently higher yield of healthy and functional isolated myofibers with a time and cost saving procedure. The implementation of this method could significantly increase the capacities of ex vivo studies in the skeletal muscle research field.

(Color images are available online)
.
Introduction
Skeletal muscle constitutes 40–60% of the total human body weight and is responsible for the body's mobility, posture, and stability. 1 Myofibers or muscle fibers are the building blocks of skeletal muscle spanning the entire muscle length with a normal diameter of about 100 μm. 2 Myofibers result from the fusion of myoblasts “single-nucleated cell” into myotubes “multi-nucleated cell” during embryogenesis and are considered as functional contractile units of skeletal muscle.1,3 Isolation of single myofibers has been a critical step in studying muscle physiology, leading to major breakthroughs in understanding cellular mechanisms of skeletal muscle.4–8
It has provided unique experimental tools in understanding the excitation–contraction coupling (ECC) mechanisms, calcium (Ca2+) transients, mitochondrial function, and much more.4–6 In some experimental conditions, the use of single isolated myofibers has additional advantages by overcoming the limitations of using an isolated whole muscle bundle. For example, in a whole isolated muscle, myofibers in the deeper parts of the muscle experience hypoxia due to the limited diffusion of oxygen from the muscle surface into the inner parts.9,10 This hypoxia can be controlled by using single isolated myofibers especially in muscle fatigue experiments that require high levels of oxygen.
The isolation of single myofibers from flexor digitorum brevis (FDB) muscle has been a well-established model in skeletal muscle physiology dating as far back as 1976. 11 Furthermore, several methods have been reported to isolate single muscle fibers using both enzymatic dissociation 7 and mechanical dissection. 9 The success of functional experiments relies on the quality of the dissociated myofibers and their attachment ability to the imaging dish, which can be difficult and exhaustive for researchers. For example, enzymatic dissociation is a delicate process as extensive incubation with enzyme could result damaged fibers.
In that aspect, several modifications have been proposed to improve the yield and integrity of single isolated myofibers. However, most of these protocols failed to achieve high yield of healthy isolated myofibers due to the variations in digestion time, collagenase concentration, digestion medium, culturing, and handling techniques.8,12,13 Thus, the purpose of this study was to build upon previously established methodologies7,8 to develop and improve the yield of intact and healthy myofibers in a time efficient manner using a modified enzymatic dissociation technique. This modified protocol is easy to follow to achieve a fast, reproducible, and successful isolation of functional myofibers.
Materials and Methods
Materials
Sodium chloride (NaCl2), potassium chloride (KCl), magnesium chloride (MgCl2), HEPES buffer 1 M solution with pH 7.3, dextrose (D-glucose) anhydrous, phosphate buffered saline (PBS), Live/Dead Cell Viability/Cytotoxicity Assay Kit, and Nunc™ 15 mL Conical Sterile Polypropylene Centrifuge Tubes were purchased from Fisher Scientific (Waltham, MA). Dulbecco's modified Eagle's medium (DMEM; sterile with 4.5 g/L glucose, L-glutamine, sodium pyruvate, and pH 7.0–7.4) was bought from Corning (Corning, NY). Fetal bovine serum (FBS) and myosin heavy chain (MHC) antibody were bought from R&D systems (Minneapolis, MN). Gentamicin solution, collagenase A, Entactin-Collagen IV-Laminin (ECL) Cell attachment Matrix, 10% formalin neutral buffer, Triton, and Tween were bought from Sigma–Aldrich (St. Louis, MO).
Fura-2 AM, Fluo-4 AM, FM 1–43 Dye, DAPI (4′,6-diamidino-2-phenylindole dihydrochloride) and Prolong® Gold antifade reagent with DAPI were bought from Thermo Fisher Scientific (Waltham, MA). Desmin (D93F5) XP® Rabbit mAb was obtained from Cell Signaling Technology (Danvers, MA). 35-mm Dish, No. 1.5 uncoated coverslip, and 20 mm glass diameter (Catalog No. P35G-1.5-20-C) were bought from MatTek Corporation (Ashland, MA). Tissue culture plates and 60 × 15 mm Petri Dish w/Grip Ring-Sterile were obtained from CellTreat Scientific (Massachusetts).
Methods
Solutions for the experiment (time of completion: 20–40 min)
Prepare the skeletal Ringer's HEPES solution by mixing 142 nM of NaCl2, 5 mM KCl, 1.8 mM MgCl2, 10 mM HEPES, 2.5 mM calcium chloride, and 10 mM glucose in deionized water. Adjust the solution at pH between 7.35 and 7.4 by adding sodium hydroxide to raise the pH or hydrochloric acid to lower the pH. Critical step: The solution can be made before the experiment and stored at 4°C for up to 1 month, but unlike previous protocols, do not add glucose or balance the pH until the day of the experiment.
Prepare the digestion media by combining DMEM with 2% sterile filtered FBS, 0.1% gentamicin supplemented with 4 mg/mL collagenase A. Critical step: The solution can be made before the experiment and stored at 4°C but do not add the collagenase until the day of the experiment.
Dissection, dissociation, and plating of myofibers
A stereomicroscope system (Olympus, Tokyo, Japan) and dissection kit are used for FDB dissection and myofiber isolation. The isolation step must be performed under a laminar flow hood and 37°C incubator with 5% carbon dioxide (CO2) during digestion. After plating the myofibers, a DMi8 Inverted Microscope (Leica Microsystems, Deerfield, IL) and all-in-One Fluorescence Microscope (Keyence, Osaka, Japan) are used for imaging. The Photon Technology International (PTI) imaging system (Horriba Instruments, Sandy Springs) is used for Ca2+ transient experiments.
Experiments
Experimental design
The experimental method consists of three stages: (1) dissection, (2) dissociation, and (3) experimentation, as shown in Figure 1. C57BL/6J female mice (Young: 6 months, and Aged: 22 months, n = 6 for each age and total = 12 mice) were used in the development and optimization of this protocol. Thus, this protocol can be adapted and used for any age of mice and genetic background. In genetic strains featuring weaker skeletal muscle, the digestion time must be optimized to yield a consistent result of high yield and viable myofibers. In this method, we have adjusted and optimized the protocol for young and aged mice. To ensure efficiency all solutions should be prepared before the start of the experiment.

Experimental design shows the stages of FDB myofibers isolation. FDB, flexor digitorum brevis.
Dissection (time to completion: 20–40 min)
Extraction of FDB muscle by following these precise steps: sanitize the dissection area by carefully spraying 70% ethanol on surfaces. Cover the dissection foam board in paper towels and place under the dissection microscope. Following the Institutional Animal Care and Use Committee, euthanize the animal by cervical dislocation. Place the animal in the prone position on the dissection board and cut and separate the hind paw completely right after the distal tibia bone. Position the paw in the center of focus under the microscope. Secure the paw to the dissection board by placing one 21-gauge needle at the distal end of the tibia. Spread the digits out and place one needle in the web space between the fifth and the fourth digit and the second needle between the first and the second digit, as shown in Figure 2. Using the forceps carefully lift the skin at the proximal end of ankle and make a surface level incision.
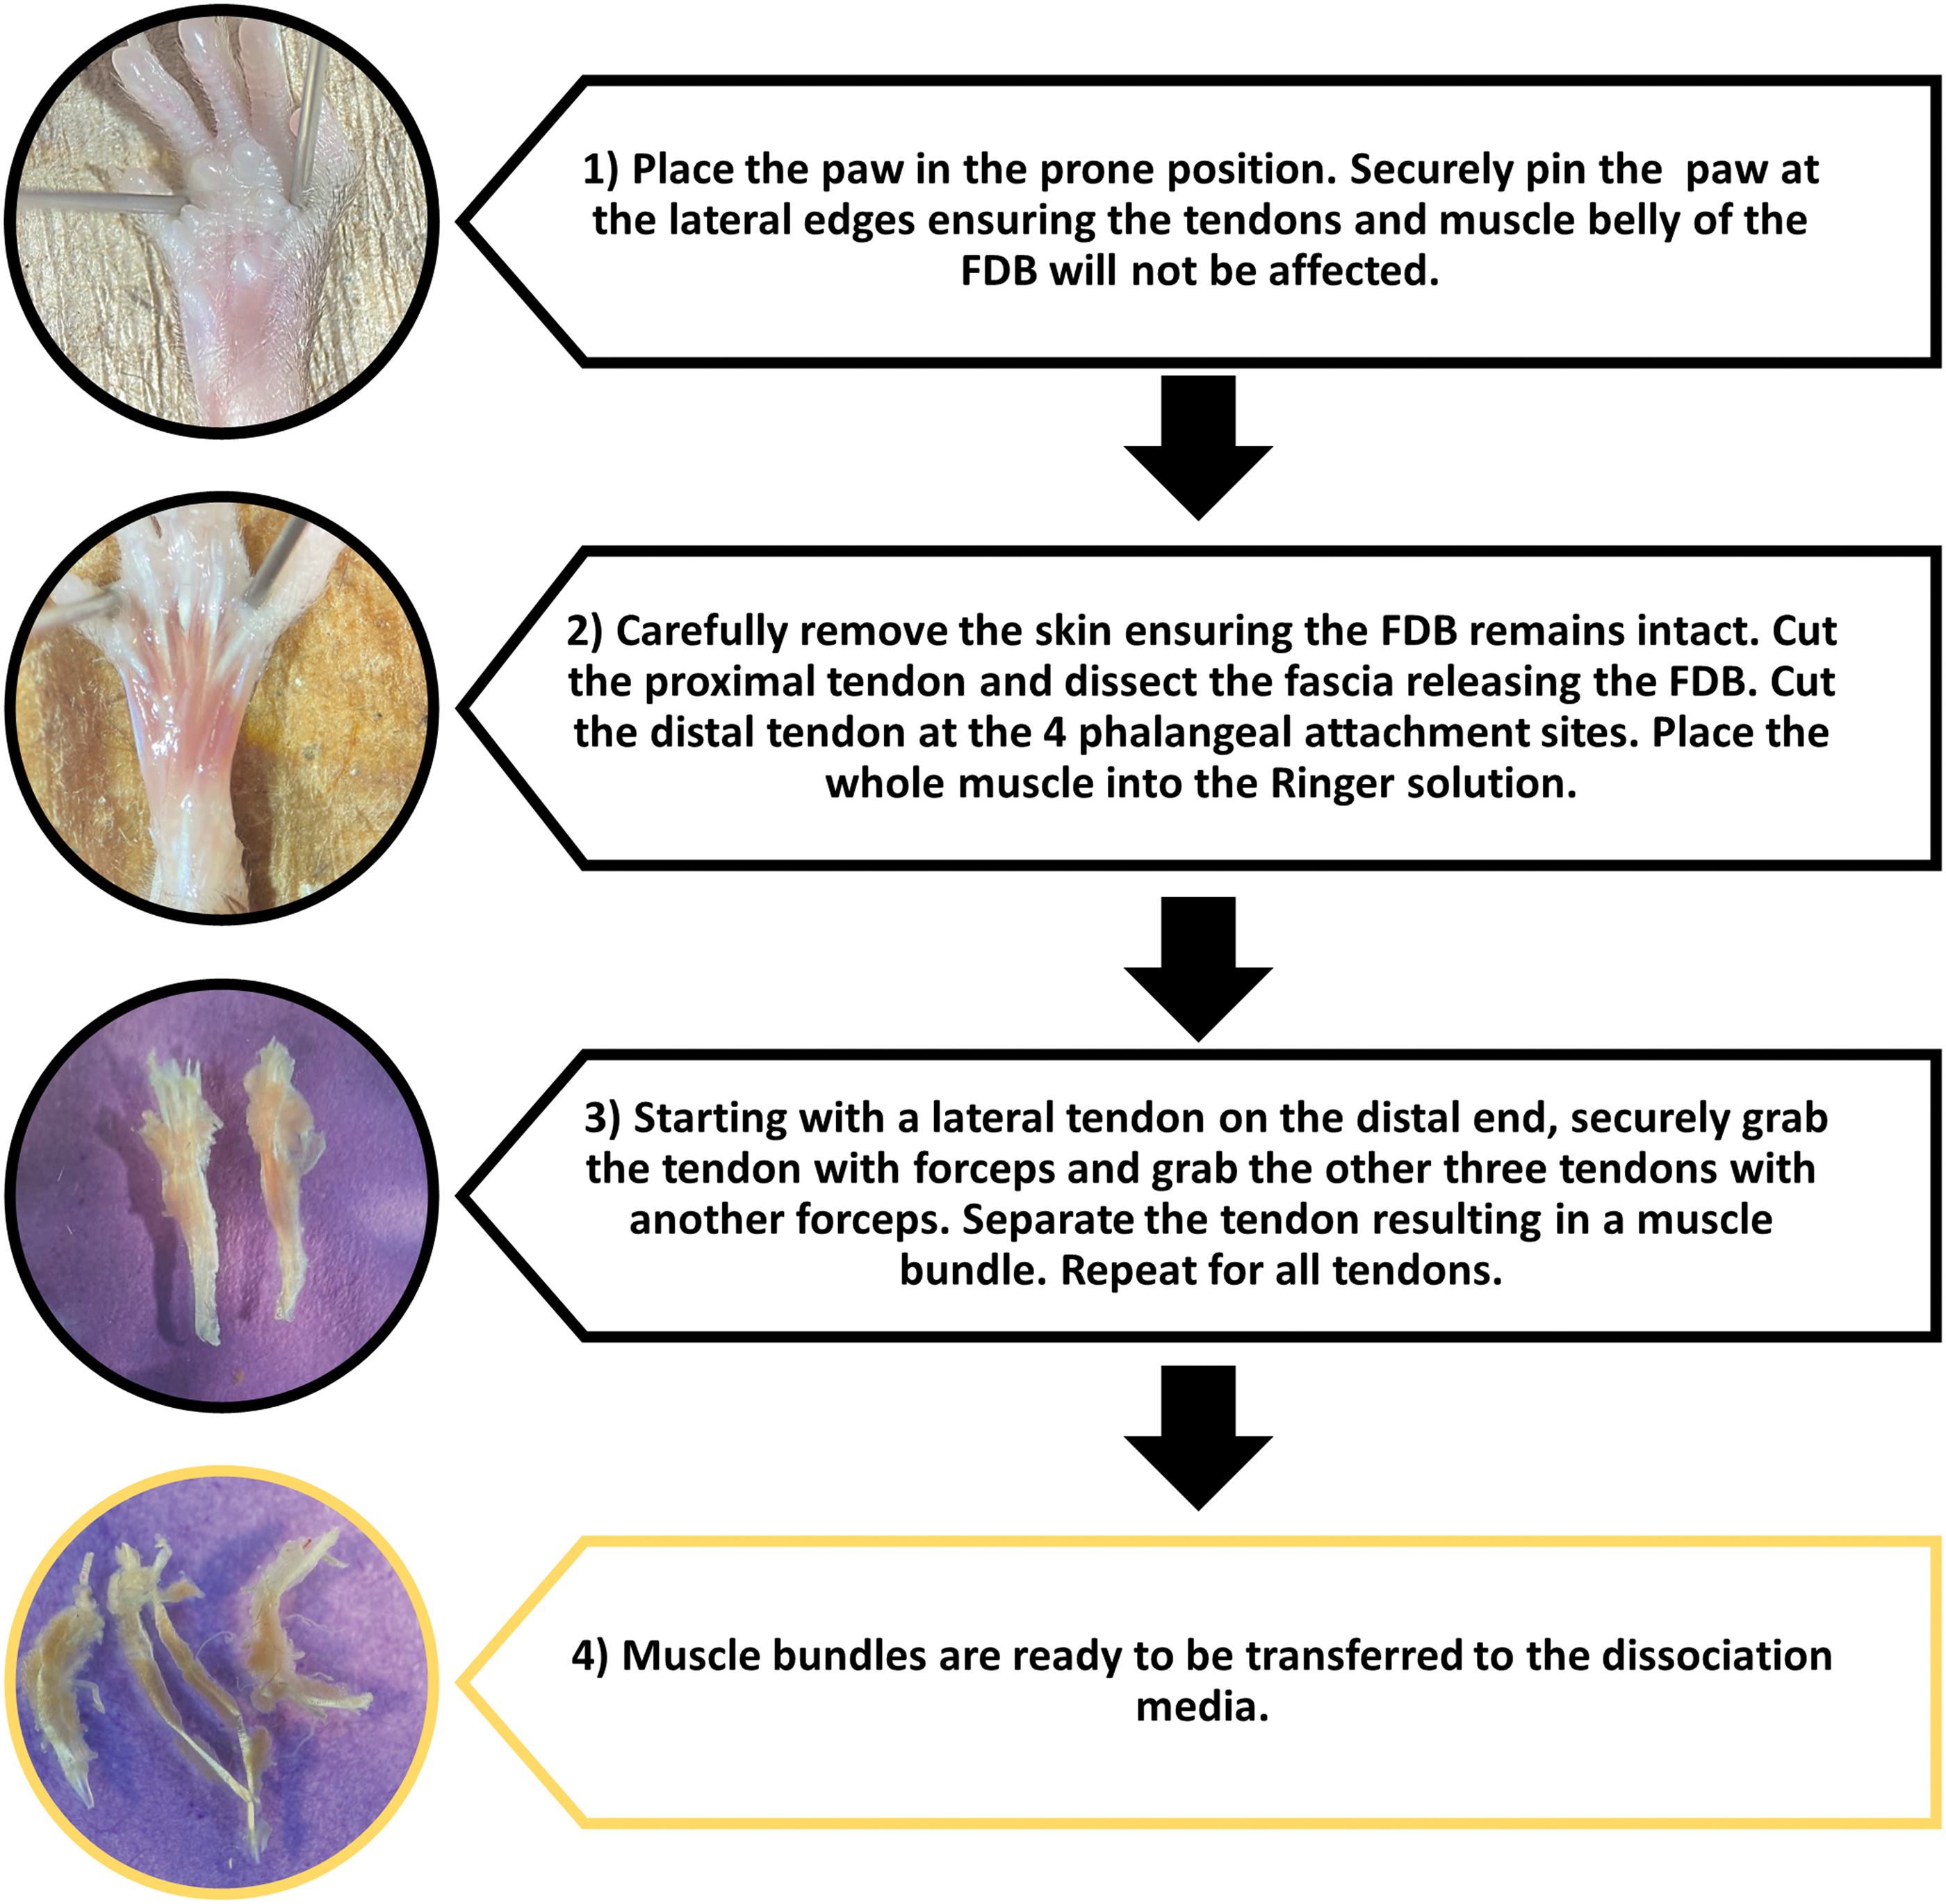
Example of securing the hind paw, extracting FDB, and separation of muscle bundles. Color images are available online.
Critical step: do not cut too deep and ensure only the skin is incised. At the lateral edges of the incision, make an incision that spans the entire width of the foot. With a skin flap created, proceed by cutting the connective tissue and skin and peel the skin flap to the toes (Fig. 3B). Remove the skin flap or with another needle pin the skin if necessary. Critical step: the FBD should be clearly visualized (Fig. 3C). Visualize the proximal tendon of the FDB and carefully work the forceps underneath the tendon. Secure the tendon with the forceps and cut the proximal end of the tendon (Fig. 3E). Lift the tendon and muscle. Cut the connective tissue with the scissors parallel to the muscle to ensure no muscle loss or damage as this will free the FDB. Continue to dissect all the way to the digits. Cut the four distal tendons at their most distal point. Place the muscle in the collecting dish (60 mm Petri Dish) with skeletal Ringer's HEPES solution (Fig. 3F).

Detailed visualization of the FDB muscle dissection and myofibers isolation.
Separate muscle into muscle bundles
Place the collecting dish under the dissecting microscope. Note: place a contrasting piece of paper under the dish to help visualize the muscles and distal tendons. With one pair of forceps secure three of the tendons (Step 1). With another pair of forceps gently pull the fourth tendon down to the proximal tendon separating the muscle and creating a muscle bundle (Step 2). Repeat steps 1 and 2 to separate into four muscle bundles (Fig. 3G).
Digestion and isolation of fibers
The next steps are conducted in a sterile laminar fume hood. Place the four muscle bundles from each FDB muscle in 500 μL of digestion media in a single well of a 12 well-plate, as shown in Figure 3H. Incubate the muscle bundles for 35–45 min (for young mice) and 80–90 min (for aged mice) in 37° with 5% CO2. Once the muscle bundles are placed in the digestion media, it will look like intact muscle, as shown in Figure 3I. With increasing digestion time, the muscle will start to dissociate and can be visualized under the microscope, as shown in Figure 3J. After 35 min and on the same plate, fill three wells with 500 μL per well of skeletal Ringer's HEPES solution. Using sterilized forceps, remove the muscle bundles from the digestion media. Gently dip and rinse the bundles in one well of the Ringer's solution. Repeat in the second well and place the rinsed bundles in the third well.
Critical step: the muscle bundles will have started to breakdown to myofibers. Careful removal and rinse will ensue maximal yield of myofibers. Ensuring all digestion media is removed prevents the myofibers from damage and further degradation. In the third well, using a P1000 Pipette tip, gently titrate the solution containing the muscle bundles for 15–20 times. This will release myofibers. Transfer the 500 μL myofiber solution to a 15 mL conical tube with desired amount of Skeletal Ringer's HEPES solution for dilution. Note: for 10 dishes of the 35 mm dish, the final volume should be 5 mL (500 μL per dish).
This concentration can be modified to the number of myofibers needed for each specific experiment. Plate 500 μL of diluted myofiber solution on a 35 mm glass bottom dish (Fig. 3K) that has been coated in ECL cell matrix (freshly coated 30 min before the seeding of myofibers). Incubate dishes loaded with myofibers for 20–30 min to allow for cell attachment. Pause step: at this point, the fibers can be incubated at 37°C with 5% CO2 for 48 h with decreasing viability. Transfer myofibers to growth media for longer viability and satellite cell activation.
Myofibers viability using Live–Dead kit
Follow the manufacturer's protocol and as previously reported. 14 Remove the LIVE/DEAD® assay reagents from the freezer and allow them to warm to room temperature (RT). Add 20 μL of the supplied 2 mM ethidium homodimer-1 (EthD-1) stock solution (Component B) to 10 mL of sterile, 1 × PBS, vortexing to ensure thorough mixing. This gives an ∼4 μM EthD-1 solution. Combine the reagents by transferring 5 μL of the supplied 4 mM Calcein AM stock solution (Component A) to the 10 mL EthD-1 solution. Vortex the resulting solution to ensure thorough mixing. Remove medium from myofibers seeded in 12-well plate. Note: Do not wash the cells. Add 100–200 μL of the staining solution directly to each well. Use appropriate amount to cover all surface where cells can be attached. Remember to protect from light. Cover with foil and incubate at RT for 30 min.
Image cells after 30 min under fluorescence microscopy for green (excitation/emission: 497/517 nm) and red (excitation/emission: 528/617 nm) wavelengths. Fluorescent images were taken using a DMi8 inverted Leica microscope (Leica Microsystems Inc.), with green staining for live myofibers and red staining for dead myofibers. Use the fast live tool to navigate to the center of each well in the 12-well plate; use the spiral imaging tool to scan the entire area of each well using the 10 × objective lens. The spiral mode allows capture of a single image with high resolution for each well that is composed of ∼100 small fluorescent images. This technique will allow screening of the entire surface area of the 12-well plate. Fluorescent images are used to count the total number of live myofibers using the ImageJ software (NIH).
MHC staining
Follow the manufacturer's protocol. Discard media from dish. Wash the dish with 1 mL of 1 × PBS, add slowly at the side of the dish. Discard PBS after 5 min. Fix cells with 1 mL per dish of neutral buffered formalin (NBF) for 7–8 min. Note: Do not exceed 10 min. Discard NBF and wash cells again with 1 mL of 1 × PBS, three times, 5 min each wash. Make sure all NBF is removed. Pause step: if not staining immediately, store the cells in 1 mL per dish 70% EtOH; cover the dish and store at RT. Exchange media with 1 mL of 0.1% Triton™ X-100 in PBS and permeabilize on a shaker for 10 min. Repeat wash steps in Step 2. In the dark, stain cells with 20 μL/mL of conjugated MHC antibody in 1 × TBST (0.1% Triton X-100, 0.1% Tween, and 1 × PBS) for 30 min at RT on shaker. At 25 min in Step 7, add 1 μL DAPI 1 μg/mL (1:1000). Keep at RT in the dark for 5 min. Wash cells three times with 1 × PBS in the dark. Image cells under fluorescence microscopy for green MHC (excitation/emission: 488/515 nm) and blue DAPI (excitation/emission: 359/457 nm) wavelengths.
Desmin staining
Follow the manufacturer's protocol. Discard media from dish. Wash the dish with 1 mL of 1 × PBS, add slowly at the side of the dish. Discard PBS after 5 min. Fix cells with 1 mL per dish of NBF for 7–8 min. Note: Do not exceed 10 min. Discard NBF and wash cells again with 1 ml of 1 × PBS, three times, 5 min each wash. To make sure all NBF is removed. Pause step: if you are not staining immediately, store the cells in 1 mL per dish 70% EtOH; cover the dish and store at RT. Block specimen in blocking buffer (1 × PBS/5% equine serum/0.3% Triton X-100) for 60 min. While blocking, prepare primary antibody by diluting 1:100 in antibody dilution buffer (1 × PBS/1% bovine serum albumin/0.3% Triton X-100).
Aspirate blocking solution, apply diluted primary antibody. Incubate overnight at 4°C. Rinse three times in 1 × PBS for 5 min each. Incubate specimen in fluorochrome-conjugated secondary antibody diluted in antibody dilution buffer for 1–2 h at RT in the dark. Rinse three times in 1 × PBS for 5 min each. Add one drop of Prolong Gold Antifade Reagent with DAPI and add glass cover slip. For best results, incubate overnight at RT. Pause step: for long-term storage, store slides flat at 4°C protected from light.
Membrane integrity assessment using live cell imaging
Seed single isolated myofibers isolated from two FDB muscles in ECL-coated 12-well plate and incubate with 5% CO2 at 37°C for 30 min. Follow the manufacturer's protocol, prepare stock Fluo-4 AM by adding 50 μL of dimethyl sulfoxide (DMSO). Dilute the stock Fluo-4 AM in Ringer's HEPES solution for a final concentration of 2 μM Fluo-4 AM. After 30 min, discard media from the 12-well plate and load myofibers by adding 500 μL of Fluo-4 AM Ringer's HEPES solution. Incubate at 37°C for 40 min. Prepare stock FM 1–43 by adding 100 μL of DSMO to vial.
Dilute the stock FM 1–43 dye to a working concentration of 5 μg/mL in Ringer's HEPES solution. Place the Fluo-4 AM loaded 12-well plate inside the sterile chamber of a Keyence BZX-710 fluorescence live imaging microscope (Keyence Corporation of America, IL) and provide with 5% CO2 at 37°C. Using PlanFluor 20 × 0.50/2.10 mm objective lens, identify the myofibers loaded with Fluo-4 AM and setup the x-y position with full z-stack and time-lapse to capture live images every 2 min. Then, add 100 μL of working FM 1–43 to each well along with 0.005% saponin to induce membrane damage. In the live imaging all-in-one fluorescent microscope, image myofibers for 2 h. This dynamic live microscope allows for high throughput, fully automated cell imaging at the exact x-y-z position on each well. 14
Ca2+ transients measurement using Fura-2 dye
Follow the manufacturer's protocol. Prepare stock Fura-2 AM by adding 50 μL of DMSO. Dilute the stock Fura-2 AM in Ringer's HEPES solution for a final concentration of 5 μM Fura-2. Discard media from dish. Load the cells by adding 500 μL of Fura-2 Ringer's HEPES solution. Incubate at 37°C for 35 min. Wash the dish with 1 mL of Ringer's HEPES solution, add slowly at the side of the dish. Incubate at ambient temperature for 15 min. Visualize the loaded myofibers using a PTI imaging system with a Fura filter. Attach the perfusion system to the dish and start perfusion of Ringer's HEPES solution at 1.5 mL/min. Record baseline intracellular Ca2+ levels of the myofibers by measuring the excitation ratio of 340/380 nm (bonded and unbonded Fura) for 60 s. Switch perfusion system to 200 mM KCl in Ringer's HEPES solution to stimulate the myofibers. At first indication of rise in intracellular Ca2+ levels, switch the perfusion back to the Ringer's HEPES solution. Record the intracellular Ca2+ levels until levels return to baseline.
Data and statistical analysis
All experiments were carried out in triplicate with at least n = 3 for each experiment. All fluorescent images were captured as high resolution, and at least nine images per sample were used. The ImageJ software was used to analyze the data. For Ca2+ transients, each myofiber imaged was loaded with Fura-2, a ratio metric Ca2+ dye and imaged in real time with the 14-BIT Cool SNAP CCD camera. All Ca2+ imaging were analyzed with PTI Easy RatioPro fluorescence imaging software.
Experimental results
Quantification of viability of the isolated myofibers
The successful dissociation and isolation of single FDB myofibers from two FDB muscles (From Young mice) will yield between 2300 and 3100 fibers, as shown in Figure 4. The fibers can then be separated and diluted to the desired concentration for the experiment. As shown in Figure 4, the separation of fibers into three glass bottom dishes resulted in 777 myofibers per dish and total of ∼2300 myofiber in total with a high surface area coverage. However, this results in overlapping or stacking of myofibers, which may not be ideal for certain experimental protocols.

Quantification of viable myofibers isolated from FDB of young mice. Fibers are stained with Calcein AM green stain indicating live viable fibers after 1 h of dissociation.
Therefore, the fibers can be further diluted into 10 dishes resulting in 305 fibers per dish with a total number of ∼3100 myofibers in total (Fig. 4). The dilution into 10 dishes lowers the potential of stacking of myofibers and still has a high total surface area coverage in the viewing window of the dish. Diluting the myofibers into three dishes only resulted in low yield of total myofibers. This can be explained due to the high number of myofibers per dish that resulted in stacking of myofibers on each other and preventing myofibers attachment to the glass dish bottom, thus myofibers are washed away during the washing step.
The protocol was further optimized for FDB muscle from aged mice; the isolated myofibers were seeded in 10 dishes. Dishes were incubated for 30 min and stained with live/dead stain to test and quantify the fibers viability. Live/dead images of the 10 dishes are shown in Figure 5. Each image presents the entire seeding area of each 35 mm dish using the spiral imaging tool. All images were quantified for the total number of viable myofibers per each dish, and the total number of myofibers per dish is shown in the box plot graph in Figure 5. The results indicated that two FDB muscles can yield up to 307 live viable myofibers per dish with a total number of ∼3000–3150 myofibers in total. These results are in agreement with the data from young mice with almost identical myofibers' number.

Quantification of viable myofibers isolated from FDB of aged mice. Fibers are stained with Calcein AM green stain indicating live viable fibers, and Ethidium homodimer-1 red stain indicating dead cells after 1 h of dissociation. Total number of isolated live myofibers from 2 FDB muscles seeded in 10 dishes as labeled from dish 1 to dish 10. At dish 10, zoom out image indicating green-stained fibers (Live) and red-stained fiber (Dead). Box plot presenting the total count of viable myofibers after 1 h of seeding. Color images are available online.
In this optimized protocol conditions, the number of debris and dead/non-viable fibers should be minimal. The debris and non-viable fibers have low attachment to the laminin-coated glass bottom dishes compared with viable myofibers and through gentle washing of the dish the debris is easily removed. However, in the zoomed-out image of dish 10 in Figure 5, we can visualize one dead myofiber as well as debris stained with red EthD-1. Since the Calcein AM green stain is specific for live viable cells, all myofibers counting and quantification were based on the number of live myofibers. After successful optimization of the protocol and the especially the digestion time for young and aged muscle, further experiments in this study were performed in myofibers isolated from young mice.
MHC and desmin staining
Healthy myofibers are characterized by a resealed sarcolemma. In Figure 6, as shown by the immunohistochemistry (IHC) staining of MHC, the myofiber has a smooth periphery around all edges. MHC is the backbone of the sarcomere and is the motor responsible for contractile properties of skeletal muscle. Myosin is the protein molecule in skeletal muscle thick filament that binds to actin, necessary to generate muscle contractile force. 2 Injured or non-contractile myofibers show disruptions in the MHC and breaks along the sarcolemma.

MHC and DAPI staining. Myofibers were seeded on laminin-coated glass bottom dishes. Fibers were stained using MHC antibody
The condition of the myofibers can also be demonstrated by IHC staining of desmin. Desmin is a muscle-specific protein that is integral in the structure and mechanical integrity of the contractile apparatus of skeletal muscle and is located at the periphery of the Z-disk. 15 As shown in Figure 7, the myofibers show a smooth appearance across the sarcolemma with localized desmin proteins at the periphery, and the length of each sarcomere is about 2.5 μm, which is consistent with sarcomere average length in healthy skeletal muscles. 16

Desmin staining: fibers were stained using Desmin Rabbit Monoclonal Antibody and DAPI and then fixed with Prolong® Gold Antifade Reagent according to the manufacturer's protocol. Color images are available online.
Membrane integrity of isolated myofibers
Membrane integrity can be further assessed by exposure to saponin. Myofibers were fluorescently labeled using Fluo-4 AM, an intracellular Ca2+ indicator. Myofibers are cross labeled with FM 1–43. FM 1–43 is non-fluorescent in the aqueous media and cannot permeate an intact plasma membrane. 17 The myofibers were then exposed to saponin, which causes punctures in the plasma membrane and allows FM 1–43 to influx into the cell and become fluorescent.
The green fluorescent dye (Fluo-4) can stain both intact and compromised fibers since it is an indicator of Ca2+, whereas the red dye (FM 1–43) only permeates the membrane if there is damage. Saponin punctures the membrane allowing the influx of FM 1–43. As shown in Figure 8, the healthy control fiber showed no red fluorescence at time point 0 and still no sign of damage after 1.5 h indicating intact sarcolemma compared with the saponin-treated fibers. After 10 min of saponin, the fibers brightly fluorescence (red-stained fibers), and after 1.5 h, the fiber had lysed and detached from the dish. This is evidence that the myofibers produced using this protocol have an intact sarcolemma.

Membrane integrity of isolated FDB fibers.
Contractile machinery and Ca2+ transient
It is well known that many of the skeletal muscle physiological and biochemical properties are affected by (Ca2+) signaling kinetics. The molecular machinery involved in the ECC processes can be effectively probed by measuring the intracellular Ca2+ levels. 18 Skeletal muscle contraction and relaxation mechanisms are regulated by changes in the myoplasmic free Ca2+ concentration. Thus, measuring the intracellular Ca2+ levels at rest and upon membrane depolarization is a powerful surrogate for overall muscle function.
Figure 9 shows the Ca2+ transient of isolated dissociated FDB myofibers loaded with Fura-2 AM fluorescent dye at rest and during stimulation with 200 mM KCl. The intracellular Ca2+ was calculated from the ratio unit measured from the intensity of the excitation at 340/380 nm and emission wavelength at 510 nm using our previously calculated Kd for Fura-2 in situ.19,20 At rest, the Ca2+ concentration was ∼100 nM and KCl depolarization evoked changes in intracellular Ca2+ concentration as seen from the sharp increase in Ca2+ concentration after perfusion with 200 mM KCl. These results are consistent with previous reports and indicate that isolated myofibers maintain functional ECC machinery.21–23
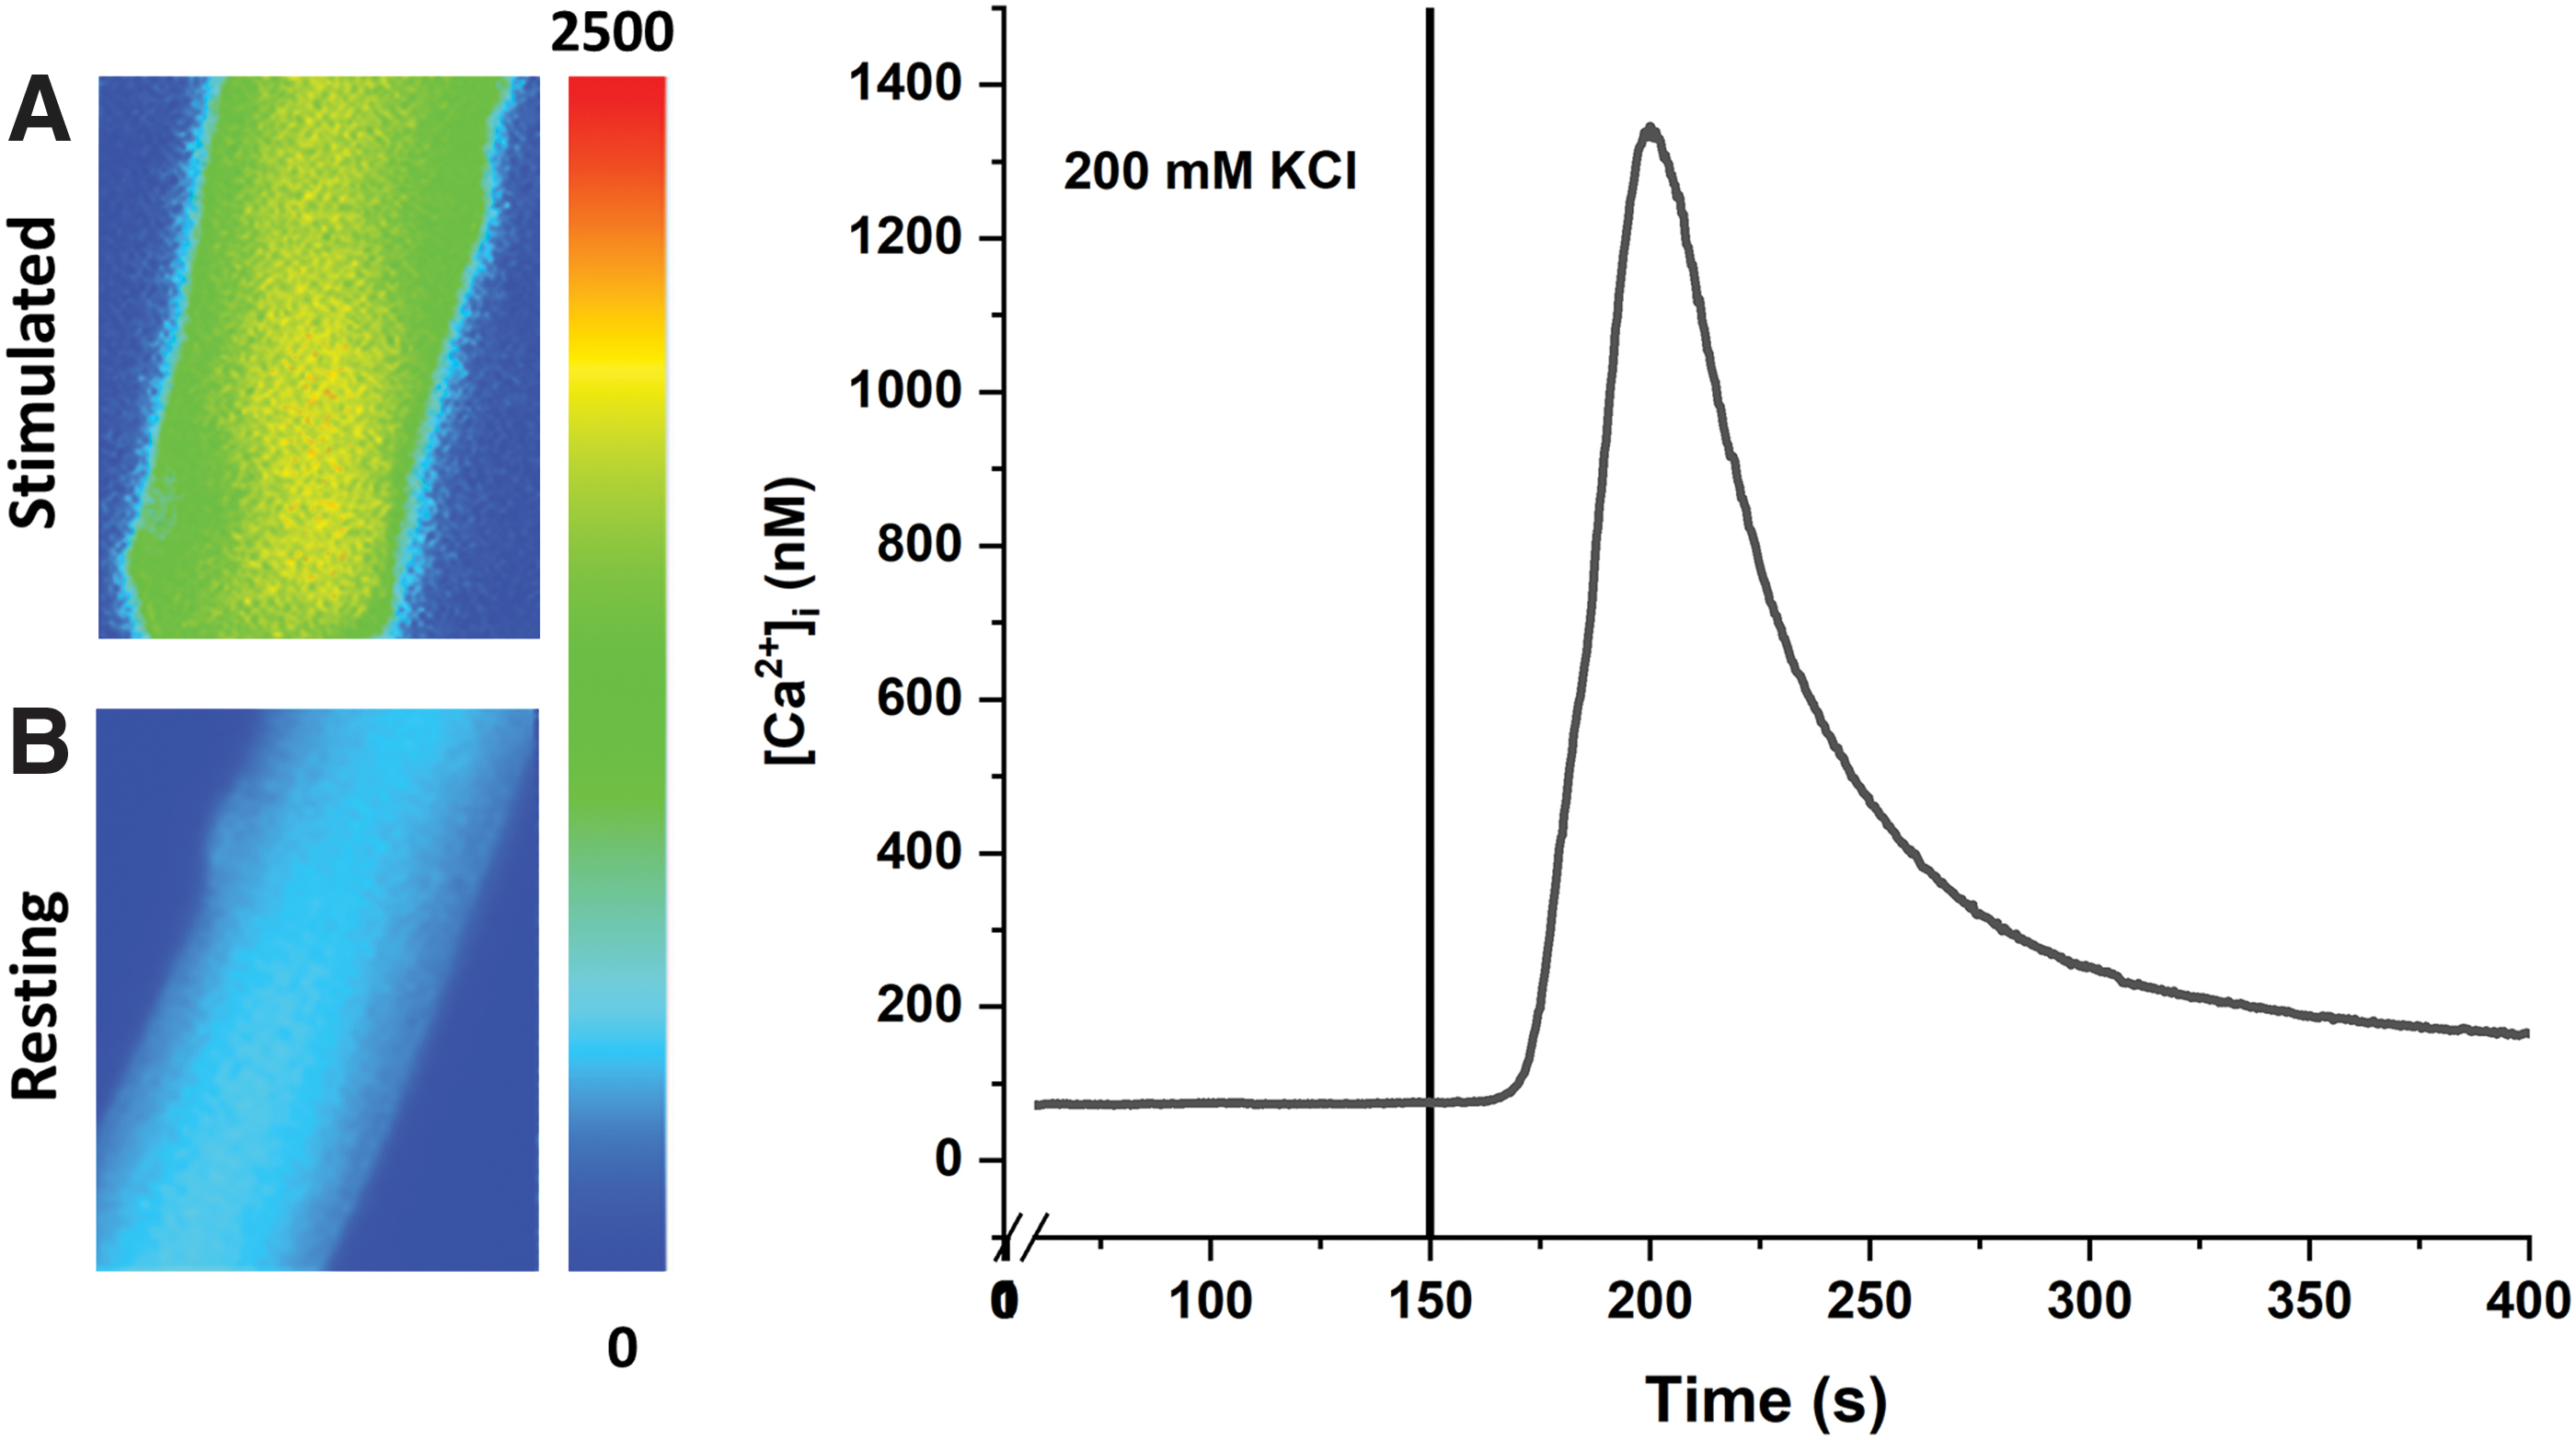
Calcium transients. The fibers were loaded with Fura-2 AM fluorescent dye.
Discussion
This goal of our study was aimed to develop and optimize the conditions for successful isolation of healthy and intact myofibers with high yield. We used C57BL/6J mice and isolated FDB myofibers for imaging and functionality analysis. The protocol was optimized and adjusted for both young and aged mice. As shown above, aged muscle needed longer digestion time compared with young muscle. This increase in digestion time can be explained based on the fact that aging leads to fibrosis. 24 Fibrosis can affect the structure and composition of the extracellular matrix (ECM) surrounding the muscle fibers,25,26 making it more resistant to enzymatic digestion. Thus, longer digestion time is needed. A significant modification that greatly enhanced the yield is separation of the single FDB muscle into four bundles by using the four distal tendons.
This step allows for maximum penetration of collagenase into the muscle due to the high surface area/mass ratio allowing greater exposure to the digestion media. Furthermore, we found that increasing collagenase concentration in the digestion media with the addition of FBS significantly decreased the time of digestion while increasing yield of isolated myofibers. Previous studies used 2 mg collagenase type I in 1 mL of DMEM media as digestion medium, 8 while we increased the collagenase concentration to 4 mg of collagenase A in DMEM containing 2% sterile filtered FBS. As predicted, increasing the collagenase concentration decreased the digestion time from 150 min, as previously reported, 8 to 30–45 min (for young) and 80–90 min (for aged). The use of cell culture media with FBS protected the sarcolemma and increased the viability of the myofibers.
FBS contains various growth factors, nutrients, and other components that can provide the myofibers with essential nutrients and support their growth and survival. 27 In particular, FBS contains a high concentration of serum albumin, which can help stabilize the membrane of the myofibers and prevent damage. Also, using glass bottom dishes (Catalog No. P35G-1.5-20-C; MatTek) coated with ECL for 30 min before the myofiber seeding significantly enhanced the myofibers attachment and viability. ECL coating contains laminin, which is a protein that is naturally found in the ECM of muscle tissue and is essential for the development and maintenance of muscle fibers. Coating the glass flasks with laminin can provide a more physiologically relevant environment for the myofibers to grow and adhere to.
Improving the integrity of the myofibers, such as by adding FBS to the culture media, and enhancing their ability to attach to surfaces, such as by using an ECM-coated surface, can lead to better isolation and a higher yield of myofibers. As a result of these critical modifications, the new method can yield ∼2300–3100 myofibers (up to 10 dishes) from two FDB muscles (one mouse). Previously published methods indicated maximum number of ∼300 isolated myofibers (only from 4 to 6 dishes) from two FDB muscles of one mouse.8,12 Thus, compared with the published methods, our advanced protocol is superior in yielding significantly higher number of healthy myofibers by a factor of 10-fold within significantly less time and greater reproducibility as confirmed by repeating this protocol several times.
The increased yield of myofibers decreases the number of animals required for experiments while still allowing consistent data for increased rigor and reproducibility. The high yield of isolated myofibers (1) allows a greater number of experiments to be performed, (2) maximizes overall outcomes using a single isolated muscle, and (3) allows for a better control of myofiber concentration for each experiment. The rapid isolation of myofibers allows for a quicker start of experiments and longer time window for variety of treatments. These advantages can be seen from the presented data in this report along with the increase in viable isolated myofibers as determined by staining with Calcein AM.
These isolated myofibers are highly homogeneous in Calcein AM fluorescence regarding length and diameter. Furthermore, the MHC and desmin staining revealed an intact and sealed sarcolemma with normal appearance of nuclei localized at the periphery, indicating healthy myofibers. Membrane integrity was further confirmed with FM 1–43 staining before and after membrane damage by saponin. The functionality of these isolated myofibers was tested using Ca2+ transient that revealed the ability of myofibers to produce an action potential when stimulated with KCl.
In conclusion, we optimized the enzymatic dissociation of FDB myofibers resulting in an increased yield and viability. This protocol will allow for improved experimental outcomes in which mature myofibers are subjected to electrical or chemical stimulations as well as screening of potential therapeutics in skeletal muscle research.
Footnotes
Acknowledgments
The authors would like to thank Dr. Chenglin Mo for his support and thoughtful discussions during the development of this protocol. The authors are thankful for the generous support from the George W. and Hazel M. Jay Research Endowments, and the UTA College of Nursing and Health Center of Research and Scholarship.
Authors' Contributions
K.A., L.M., J.H., and M.B. designed and developed the methodology. K.A. and L.M. performed and analyzed the experiments, and L.G. helped in the data analysis. M.B. supervised and funded this study. Leticia Brotto: Provided laboratory management, animal training, and technical support. K.A. and L.M. wrote the original article. V.V., Z.P., N.W., J.Z., and Lynda Bonewald edited and revised the article, and all authors read, edited, and approved the final article.
Institutional Review Board Statement
All procedures were approved by the University of Texas at Arlington Institutional Animal Care and Use Committees in accordance with the National Institutes of Health's Guide for the Use and Care of Laboratory Animals.
Data Availability Statement
All data generated or analyzed during this study are included in this published article and its supplementary information files.
Disclosure Statement
No competing financial interests exist.
Funding Information
K.A., L.M., J.H., Leticica Brotto, and M.B. were supported by the National Institutes of Health Grants: NIA 2-PO1AG039355, NIA R01AG056504; National Institute of Diabetes and Digestive and Kidney Diseases R01DK119066 to M.B.; and National Institutes of Neurological Disorders and Stroke (NINDS) 2-R01NS105621 to M.B.