
Abstract
Background:
Thyroid cancer incidence has continuously increased for decades and the causes of this increase are still controversial. The objective of this study was to examine if the increased trend is different among the different National Cancer Institute (NCI) Race/Ethnicity Groups (REGs) within the NCI surveillance epidemiology and end results database for the United States.
Methods:
Using recent 13-year surveillance epidemiology and end results data, we described the specific incidence trend of thyroid cancer for the REGs by tumor size, tested the statistical significance of the trend of incidence, and estimated the annual percentage change (APC) and 95% confidence interval. In addition, we compared the difference of 5-year survival rate among the REGs.
Results:
Papillary thyroid cancer incidence significantly increased over 13 years from 1992 to 2004 among the five major REGs. The estimated APC was 5.6% (95% confidence interval = 5.1%–6.1%, p < 0.01) for the non-Hispanic whites group, 4.3% (3.0–5.5, p < 0.01) for the Blacks group, 2.8% (1.5–4.2, p < 0.01) for the Hispanic whites group, 1.5% (0.5–2.5, p < 0.01) for the Asians group, and 1.1% (−2.2–4.6, p = 0.477) for the American Indians/Alaska Natives group, respectively. The APCs among the REGs were significantly different (Z = 7.89, p < 0.001). The upward incidence trend could be seen in all small or large tumors as well as in women or in men. The proportion of local staged thyroid cancer increased by 24% in the Blacks group, 14.4% in the Hispanic whites group, 14.3% in the non-Hispanic whites group, and only 4.0% in the Asians group between two periods of 1992–1996 and 2000–2004. Five-year survival rates of patients with papillary tumor were about 95%, but that of anaplastic tumor ranged from 5.6% to 11.4% among REGs.
Conclusion:
The time trend of incidence of thyroid cancer is different among the different NCI REGs. Differences in diagnostic scrutiny may explain the differences in the REG-related trend, but this cannot easily explain the relatively small degree of increase in the trend in the Asian and the Indians/Alaska Natives groups nor can it explain the increase in the trend of large tumors that are likely to be discovered by self-palpation by patients.
Introduction
The National Cancer Institute (NCI) has examined for the time period of 1988–1992 in a specific Surveillance, Epidemiology and End Results report the incidence of thyroid cancer in groups referred to as Race/Ethnicity Groups (REGs) (17). It was reported that the highest incidence rates for thyroid cancer occurred in women (14.6 per 100,000 population) and men (4.1) of Filipino origin and the lowest rate in Black women (3.3) and men (1.4), whereas incidence rates were moderate in white women (6.5) and men (2.6) and in Chinese women (6.5) and men (2.1). In addition, incidence rates were quite similar between the Hispanic whites group and the non-Hispanic whites group. However, the report did not analyze the trend of incidence in the surveillance epidemiology and end results (SEER) REGs.
Because the incidence of thyroid cancer in the REGs may be associated with a variety of factors, including biology, heredity, and perhaps individual behavior such as the use of health care system and health professional practices, an update study of these REGs, particularly a study involving incidence trend, is necessary. The purposes of our study were to analyze the NCI's REG-specific thyroid cancer incidences and time trends by tumor size and to compare the difference of thyroid tumor stage and survival rate among the REGs.
Methods
The data used in this analysis were obtained from the SEER Program of the NCI, which was released in April 2007 and was based on the November 2006 submission. The NCI's REGs reported in this study are “American Indian native,” “non-Hispanic White,” “Hispanic White,” “Black (Blacks),” “Asian/Pacific Islander.” There is also the “Major Asian Group” and subgroups within this group. The use of these terms in the Results refers to the NCI REGs.
The SEER database contains three kinds of data of 9, 13, and 17 registry regions. These data had been established, respectively, since 1973, 1992, and 2000, representing 10%, 13.8%, and 25% of the U.S. population. In the study, we mainly used 13 registry region data because these data contain information on the Hispanic and the Asian groups. The 13 registries, all but the last based on region, are San Francisco-Oakland, San Jose-Monterey, Los Angeles, Connecticut, Atlanta-Metropolitan, Rural Georgia, Hawaii, Iowa, Detroit-Metropolitan, New Mexico, Utah, Seattle-Puget Sound, and Alaska Natives. To present the long-term change of thyroid cancer incidence numbers, however, we also used 9 registry region data that included 30-year data from 1973 to 2004.
During analysis, we identified patients with thyroid cancer by both site and histological codes of the International Classification of Diseases for Oncology (ICD-O-3). The site code of thyroid cancer was C73.9. The associated histological codes of papillary tumor were 8050, 8052, 8130, 8260, 8340–8344, 8450, and 8452; follicular tumor 8290, 8330–8332, and 8335; medullary tumor 8345, 8346, 8510, and 8520; and anaplastic tumor 8021. Subsequently, we classified patients by specific SEER tumor size codes. In SEER data, the information on thyroid cancer size was collected since 1988, and new coding rules were applied since 2004. Thyroid cancer size was measured in terms of the cancers' greatest dimension or diameter of the primary tumor as recorded on surgical pathology reports (
To describe incidence trends, we first calculated annual age-standardized incidence rates by the U.S. 2000 population as both REGs and thyroid cancer size, and then used joinpoint regression to test the statistical significance of trends and to obtain estimated annual percent change and 95% confidence interval. The joinpoint regression is a statistical method that describes changing trends over successive segments of time and the rate of increase or decrease within each segment. All joinpoint regression analyses were conducted by the NCI's Joinpoint Regression Program version 3.0, April 2005 (
To understand potential diagnostic influence among different REGs, we also examined the change of percentage of thyroid tumor stage in time, in which thyroid tumor stage–related data were divided into the two periods of 1992–1996 and 2000–2004 for comparison.
In addition, we calculated age-adjusted incidence rate ratio (RR) by 2000–2004 data to determine most recent REG-specific difference in the magnitude of incidence of thyroid cancer. Because SEER data contain only the information on specific cancer cases for persons of Asian origin (numerator) and do not have the numbers of the total population size for persons of Asian origin (denominator) or for subpopulations such as those of Chinese, Filipino, Japanese, Korean, or Vietnamese origin, we used the 5-year-age-grouped numbers of specific Asian populations from the 2000 U.S. Census data (Summary File 4, SF4) to estimate the numbers of specific Asian populations, and then calculated corresponding REG-specific age-adjusted incidence rates and RRs. The RR CI was calculated using the formula:
Results
Figure 1 lists the long-term change of incident number of thyroid cancer for helping to understand the increasing clinical burden in thyroid cancer. As noted, the registered numbers of thyroid cancer significantly increased among all REGs, and the largest increase occurred among the Black group and the smallest increase among the Asian group. Within the two periods of 1973–1974 and 2003–2004, total registered cases increased 409%, of which the cases in Blacks increased 709%, Hispanic whites 470%, non-Hispanic whites 395%, and Asians 377%. The number of cases of thyroid cancer increased faster since the early 1990s among non-Hispanic whites and Blacks.
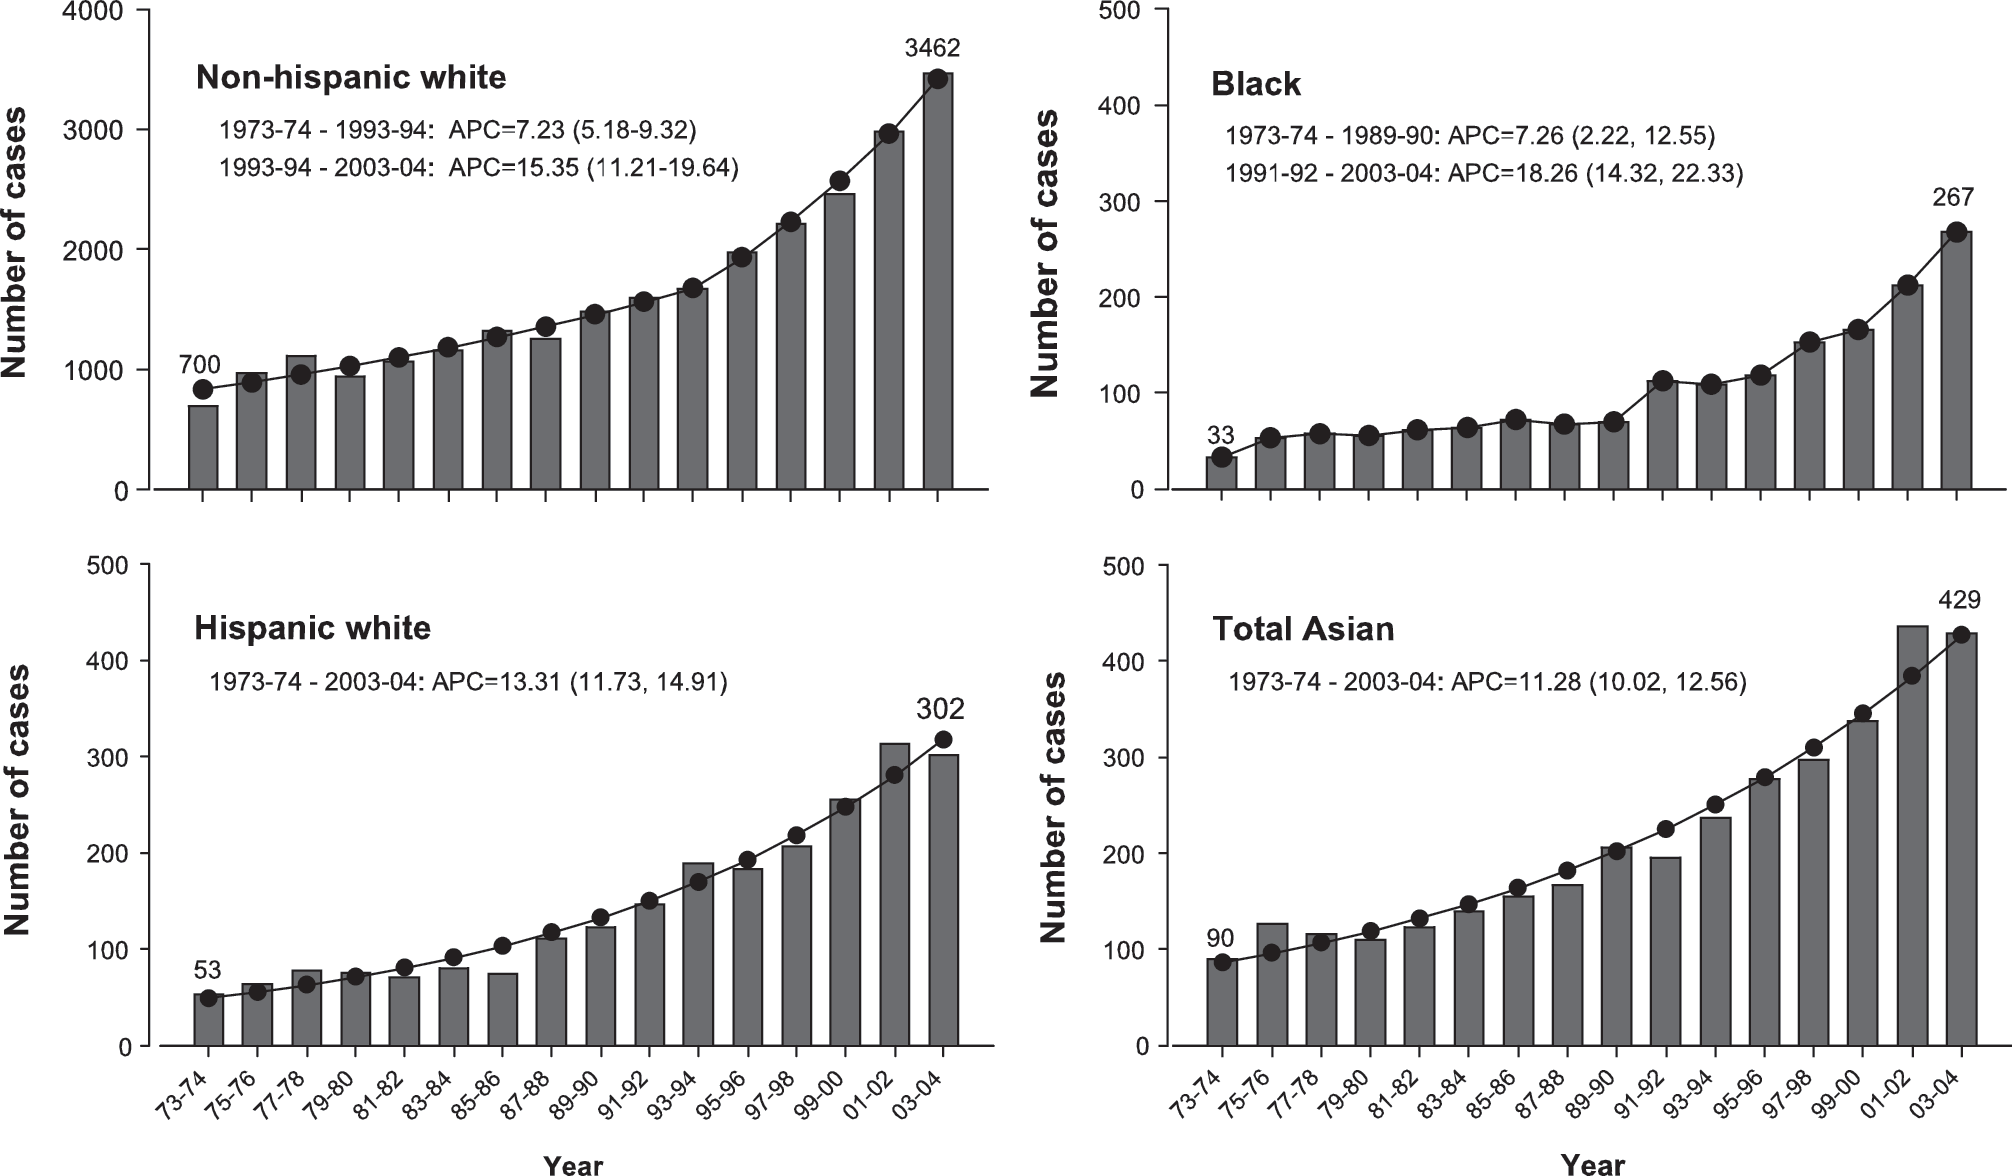
The number of cases with thyroid cancer by surveillance epidemiology and end results (SEER) Race/Ethnicity Groups (REGs), 9 registry regions, from 1973 to 2004. The annual percentage change (APC) is the estimated 2-year average APC, and the number in parentheses is the 95% confidence interval (CI) of the APC. Both APC and 95% CI were estimated by joinpoint regression. The SEER 9 regions data represent for 10% of the U.S. population.
Figure 2 shows the REG-specific time trend of age-adjusted incidence of thyroid cancer from 1992 to 2004. Within the 13-year period, the incidence of thyroid cancer significantly increased among all REGs except for American Indians/Alaska Natives. The APC of incidence was 5.6% (95% confidence interval = 5.1%–6.1%, p < 0.01) among non-Hispanic whites, 4.3% (3.0–5.5, p < 0.01) among Blacks, 2.8% (1.5–4.2, p < 0.01) among Hispanic whites, and 1.5% (0.5–2.5, p < 0.01) among Asians. The incidence of non-Hispanic whites surpassed that of Asians since 2000. The APCs among REGs were significantly different (Z = 7.89, p < 0.001).
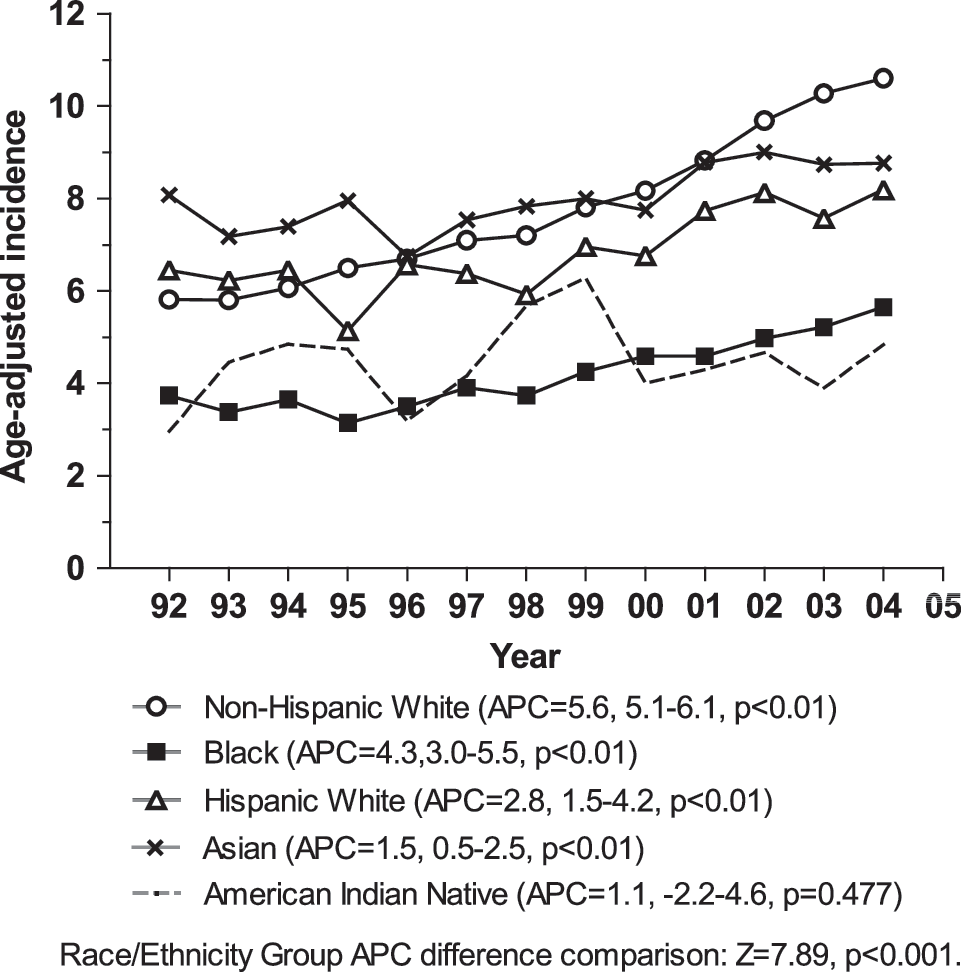
Age-adjusted incidence of thyroid cancer (1/100,000, 2000 U.S. standard) by SEER REG, 13 registry regions, from 1992 to 2004. The APC is the estimated APC, and the number next to APC is the 95% confidence of the APC. Both APC and 95% CI were estimated by joinpoint regression.
Since papillary tumors accounted for more than 95% of all thyroid cancers and tumor size was an important factor for explaining the impact of diagnostic effect, we specifically examined REG-related papillary tumor trend by tumor size. To accumulate more cases for an overall impression, we first compared 5-year average incidences according to the two periods of 1992–1996 and 2000–2004. As shown in Figure 3, all papillary thyroid cancers, including those microscopic tumors and tumors ≥5 cm, presented increases in incidence during the two periods of time among all REGs but American Indians/Alaska Natives.

Incidence of papillary thyroid cancer by SEER REGs and the two periods of 1992–1996 and 2000–2004, 13 registry regions. A, non-Hispanic white; B, Hispanic white; C, Black; D, Asian; E, American Indian/Alaska Natives.
We subsequently analyzed APCs in incidence among REGs by tumor size. Owing to small incident number, the analysis excluded data on microscopic tumor and American Indians/Alaska Natives, and grouped data of tumors 2.1–5.0 cm and ≥5 cm as that of ≥2.1 cm. As shown in Figure 4, except for tumor 1.1–2.0 cm among Asians, papillary thyroid cancers significantly increased with time regardless of tumor size in each REG. The magnitude of the increase in trend was related with tumor size: the smaller tumor size, the greater increase of the trend. In addition, the incidence of large tumors tended to be higher than that of small tumors among Hispanic whites, Blacks, and Asians. The incidence trends among REGs were significantly different (p < 0.001) in each tumor size group.
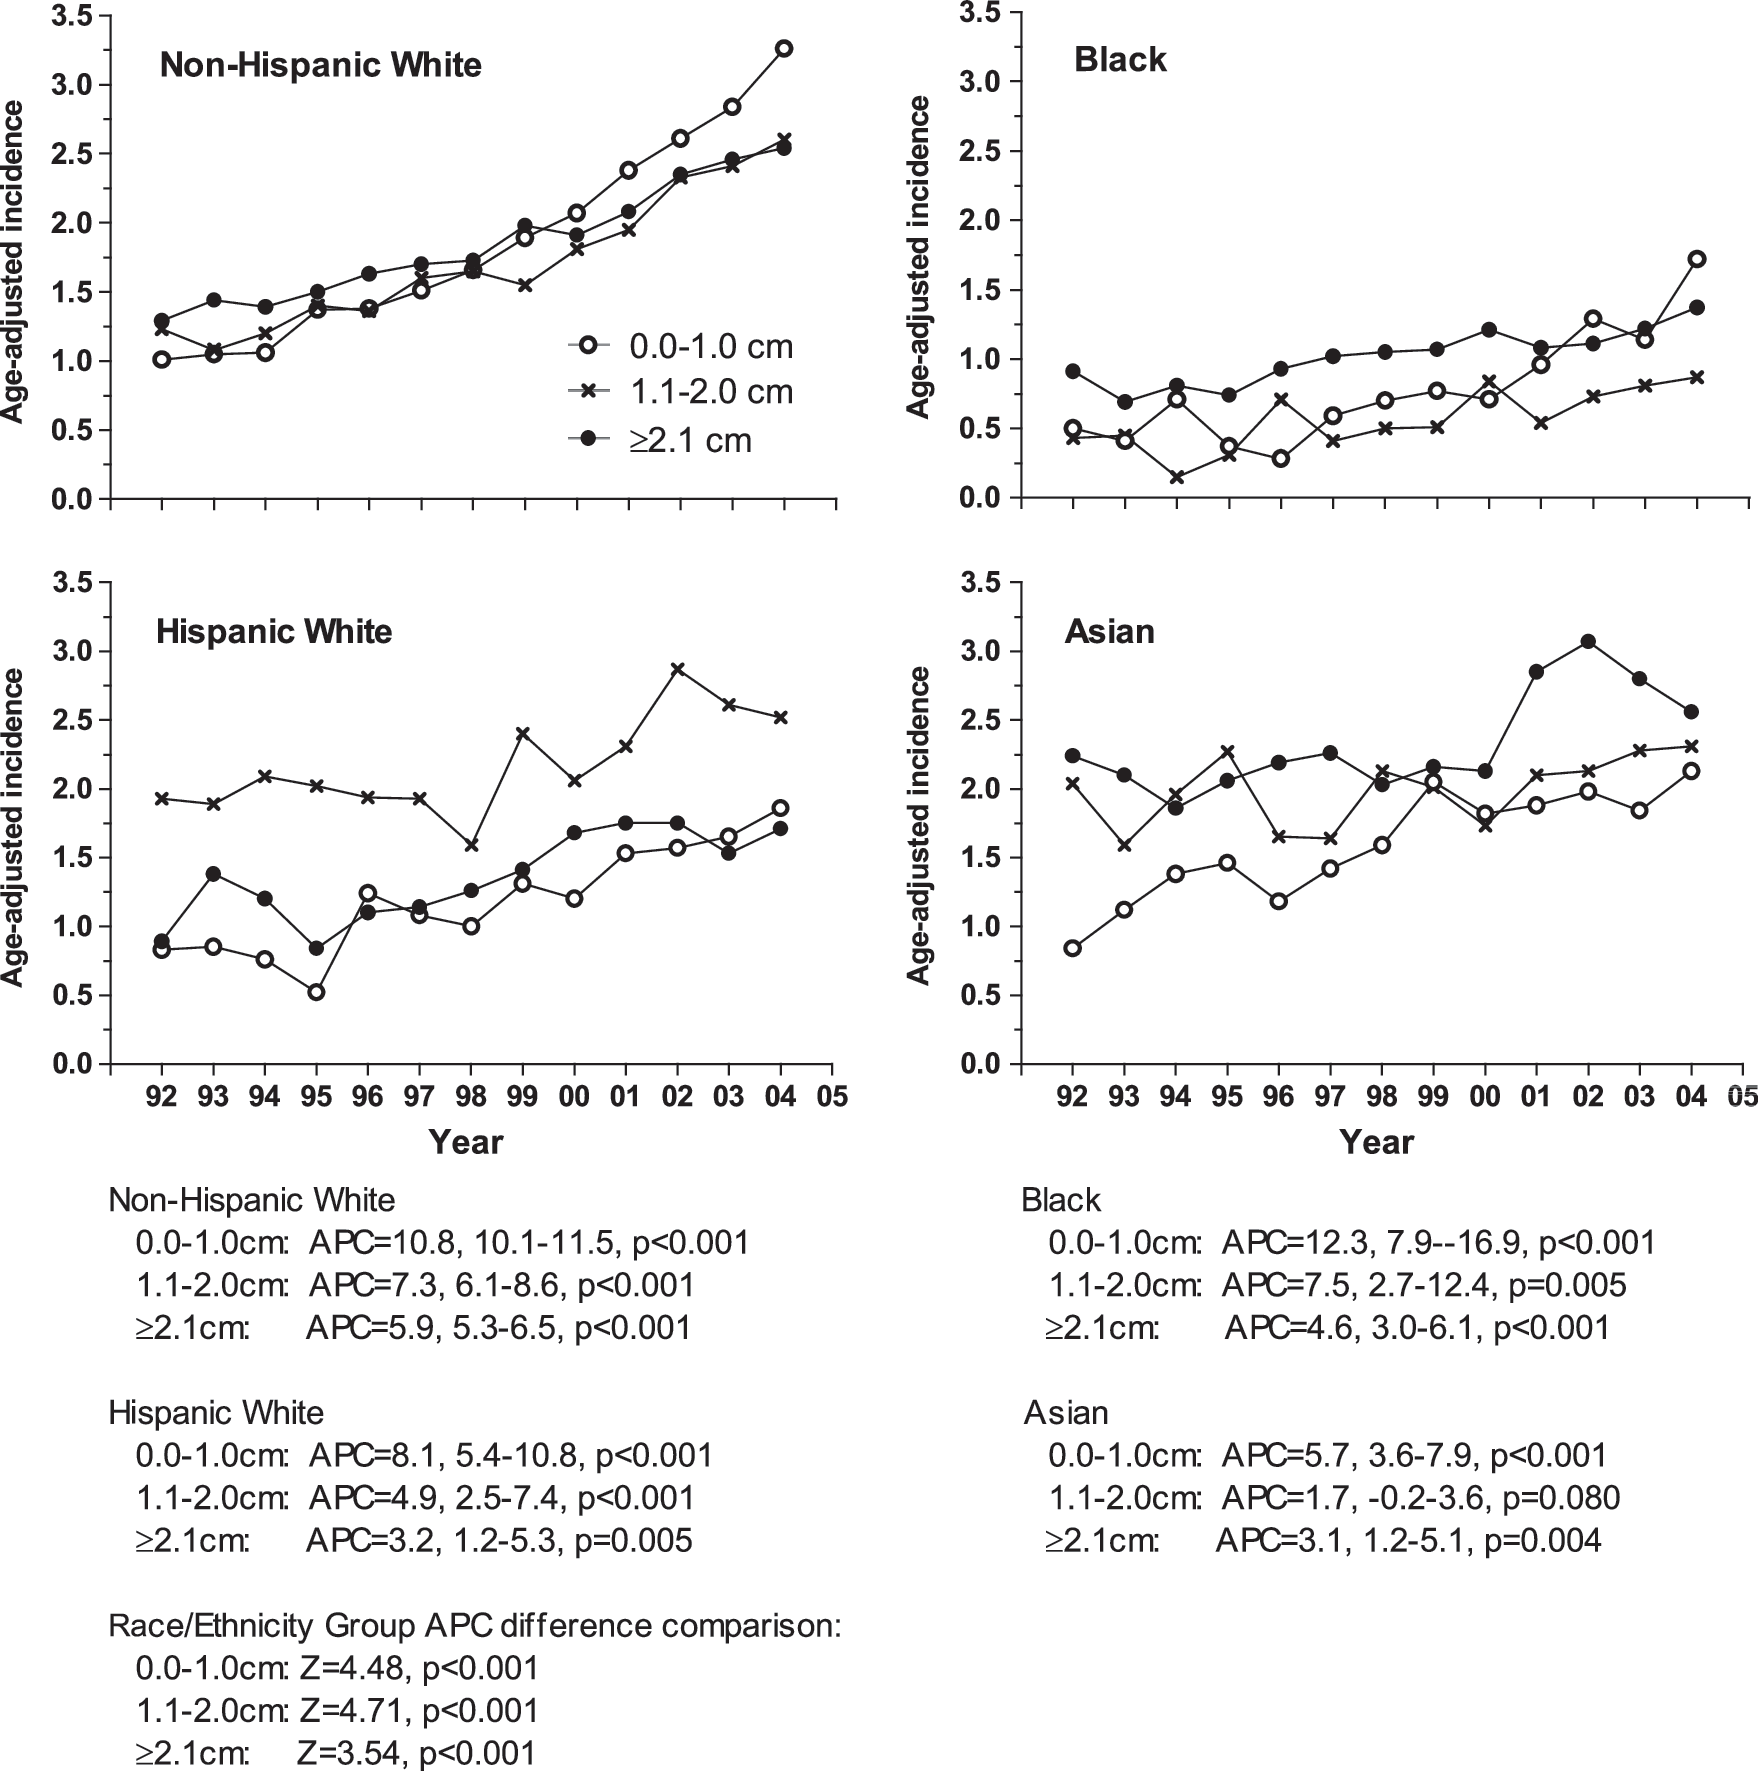
Age-adjusted incidences of papillary thyroid cancer (1/100,000, 2000 U.S. standard) by tumor size and SEER REGs, 13 registry regions, from 1992 to 2004. The APC is the estimated annual APC, and the number next to APC is the 95% confidence of the APC. Both APC and 95% CI were estimated by joinpoint regression.
Next, we examined papillary tumor-size-specific incidence by sex. To control fluctuation in the incidence trend due to a small number of cases in the REGs other than non-Hispanic whites, we combined all REGs but non-Hispanic whites and compared them with non-Hispanic whites. We found that the change of incidence trend was larger in non-Hispanic whites than in all other REGs, in women than in men, and in small tumors than in large tumors (Fig. 5). In addition, except for non-Hispanic white women, whose incidence of small tumor was higher than that of large tumors since 1998, all other REGs displayed higher incidence in large tumors than in small tumors.

Age-adjusted incidences of papillary thyroid cancer (1/100,000, 2000 U.S. standard) by tumor size, SEER REG, and sex, 13 registry regions, from 1992 to 2004. The APC is the estimated APC, and the number next to APC is the 95% confidence of the APC. Both APC and 95% CI were estimated by joinpoint regression. Please note that the scale of y-axis in the figure is different between women and men.
Table 1 shows the distribution of the proportion of tumor stages among REGs between 1992–1996 and 2000–2004. The proportion of tumor stage was quite different between these two periods among all REGs except for American Indians/Alaska Natives. Comparing results between the 2000s and 1990s, the percentage of local stage increased from the lowest 4% in Asians to the highest 24% in Blacks. As noted, the proportion of unstaged tumors decreased on the average about 50% in each of four major REGs. During 2000–2004, the percentage of local stage of thyroid cancer was 63% in non-Hispanic whites, 52% in Hispanic whites, 66% in Blacks, and 53% in Asians.
The surveillance epidemiology and end results 13 region data represent 13.8% of the U.S. population.
Table 2 shows a comparison of REG-specific thyroid cancer incidence based on the most recent data of 2000–2004. The table lists results for five populations originating from different Asian countries. As compared with American Indians/Alaska Natives, the incidence of thyroid cancer was significantly higher among non-Hispanic whites, Hispanic whites, and Asians (p < 0.001), but the incidence was not significantly higher among Blacks. Non-Hispanic whites and Asians had about onefold higher incidence than American Indians/Alaska Natives. Of Asians, persons of Filipino origin had the highest incidence, and those of Chinese origin the second highest. The incidences in both groups were significantly higher than that of American Indians/Alaska Natives, but the incidence of thyroid cancer was similar in American Indians/Alaska Natives and groups of Vietnamese, Korean, or Japanese origin.
Incidence rates (1/100,000) were not adjusted by age.
Rate ratios were calculated by age-adjusted incidence rate.
SE, standard error.
Table 3 shows 5-year observed survival rates of thyroid cancer by REG. Five-year survival rate of papillary thyroid cancer was relatively lower in Blacks (91.6%) than in the other four REGs (range, 94%–95%), whereas the 5-year survival rate of follicular thyroid cancer was similar (nearly 90%) among all REGs. As compared with Blacks or Asians, the survival rate of medullary tumors was slightly lower among both Hispanic and non-Hispanic whites, and that of anaplastic tumor was lowest among non-Hispanic whites.
Discussion
We used recent 13-year SEER cancer registry data to examine the trends of incidence of thyroid cancer among the NCI's REGs. Although observational time was not very long, papillary thyroid tumor, small and large tumors, presented significantly increased trend among all REGs except American Indians/Alaska Natives. The difference of increased trend was highly significant among the groups; the largest increase was seen in the Black and non-Hispanic white groups and the smallest in Asian Group.
The so-called overdiagnosis due to increased use of fine-needle aspiration biopsies has been the factor most suspected for the increased trend of thyroid cancer (14,15). Although this might explain such a trend among non-Hispanic whites, it seems less likely to explain the trend among other REGs. For instance, it cannot explain why the incidence trends of early stage tumors increase were small among Asians and did not increase among American Indians/Alaska Natives. The patterns of trend in Asians and American Indians/Alaska Natives suggest that the overdiagnosis of thyroid cancer does not play a significant part.
It seems less likely that the increased trends for the NCI's REGs with regard to thyroid cancer are related to changes relating to ethnicity in utilization of health care services. This is because there were no thyroid cancer screening programs during the period that the SEER data analyzed here were collected. In addition, the cancer screening practices that existed during this period (21), such as Pap tests, mammography, prostate-specific antigen screening, and colorectal screening, would not likely promote screening for thyroid cancer. However, some studies noted a lower rate of cancer screening test among non-white REGs (21 –24). For instance, a study based on 2000 National Health Interview Survey data reported lower mammography screening rates in Black and Hispanic women than in white women, by 4.2% and 11.3%, respectively, in women aged 40 years or older (21). Another study of using SEER-Medicare claims data also found that the rate of use of colorectal cancer test among fee-for-service Medicare enrollees was 47.3% in non-Hispanic whites, 41.8% in Asians and Pacific Islanders, 38.1% in Blacks, and 33.2% in Hispanics (22). However, the relationship between screening rate and cancer incidence trend is difficult to determine since the latter would be affected by physician's diagnostic behavior. Because the Asian REG had the second highest incidence of thyroid cancer, we assume that their slower rise in trend may not be associated with less utilization of health care services.
We noted that the relatively high incidence of thyroid cancer among the Asian group was mainly due to the high incidence in persons of Filipino origin, a component of the Asian group. Their incidence was 9.3 per 100,000, whereas the incidences among other components of the Asian group, those of Vietnamese, Korean, Japanese, and Chinese origin, were much lower, ranging from 3.5 to 5.5. Persons of Filipino origin are now the second largest component of those of Asian origin in the United States, just behind those of Chinese origin, with a population of almost 1.9 million concentrated in California (49.6%) and Hawaii (9.2%). The high incidence of thyroid cancer among persons of Filipino origin has been a concern for many years, but the reasons for this are still not clear. Some previous studies found that Filipinos with thyroid nodules had significantly increased risk of thyroid cancer as compared with other groups of other origins (25). This could be due to genetic influence or environmental factors.
In our result, 5-year survival rates of papillary tumors were found to be near 95% among all REGs except the Black's REG. Because papillary thyroid cancer is usually not lethal, the magnitude of survival rate of the patients would not be felt to change very much even though the earlier detection of small tumors should improve survival. This fact raises the question of the inadequacy of using survival rate to explain the effect of early diagnosis (14).
The feature of increasing trends of papillary thyroid cancer is very particular, and has not been seen in other cancers. Although our results of a relatively stronger increased trend in small tumors among four major REGs provide evidence to support the possibility of more intense diagnostic scrutiny, sometimes referred to as “overdiagnosis,” the support for this is fragile and seems at variance with the fact that papillary thyroid carcinoma continues to increase at a rate faster than diagnostic scrutiny seems to be increasing.
The inference of overdiagnosis, made by Davies and Welch (14), was mainly based on their observation that small rather than large papillary tumors increased, but this observation was probably inaccurate. In our data, larger tumors increased as well in each REG, ranging from 3.1% to 5.9% each year from 1992 to 2004. The difference between our data and Davies and Welch's study in tumor size is the extremely low incidence of large tumors in the latter study. To get more cases of study and enhance statistical efficiency, we used a larger data set from 13 registry regions, compared two-period incidences by accumulating 5-year data, as five tumor size groups (Fig. 3), and described annual incidences as three tumor size groups (Fig. 4), whereas Davis and Welch's study used a smaller data set from 9 registry regions and described annual incidence as five tumor size groups. Obviously, the number of large thyroid cancers was quite small in the Davis and Welch's study (14), particularly for tumors ≥5.1 cm, thus reducing statistical power. It seems that larger tumors, such as those greater than 1 cm, are frequently first noted by the patient rather than being detected by scrutiny using modern diagnostic techniques (24). Therefore, overdiagnosis would not likely explain why their incidence is increasing.
As we know, thyroid cancer is a cancer with little morbidity compared with other cancers. Many individuals harbor in situ subclinical tumors that do not progress to symptomatic diseases (26). New diagnostic techniques should increase the detection of these subclinical tumors. However, an increase in the reported incidence of thyroid cancer may be due to (a) the true incidence of subclinical tumors not increasing, but diagnostic scrutiny increasing, (b) the true incidence of subclinical tumors increasing, but diagnostic scrutiny not increasing, or (c) both the true incidence of subclinical tumors and diagnostic scrutiny increasing. It is not clear at present if any studies of a population identify all subjects with nonlethal subclinical tumors nor is it easy to measure diagnostic scrutiny. Therefore, whether a true increase in the incidence of thyroid cancer has been occurring or not remains unresolved. We note, however, that many risk factors for thyroid cancer, such as exposure to nuclear radiation, diagnostic radiation, and wireless telecommunications, have been on the rise.
Many studies have shown a strong association between thyroid cancer and nuclear radiation exposure, but it is notable that the incidence of thyroid cancer was already increasing before nuclear fallouts from Chernobyl. In regions without a clear history of nuclear radiation fallout, there is a lack of evidence for a relation between periods of low level nuclear radiation fallout and thyroid cancer (27,28).
Diagnostic X-rays are the largest human-made source of radiation exposure to the general populations, contributing about 14% of total worldwide radiation exposure from human-made and natural sources (29). Of the many types of diagnostic X-rays, computed tomography (CT) scan–induced radiations have been implicated with increased risk of cancer, because of its rapid increase in their use for adult screening and management and pediatric diagnosis since the 1970s (30). It is estimated that there are currently more than 62 million CT scans each year in the United States, as compared with about 3 million in 1980 (30). CT scans deliver larger radiation doses than conventional X-ray imaging procedures.
There has been a marked increase in the use of wireless phones over the past 15–20 years. There are many studies of the possibility that wireless phone use is associated with cancer. Most focused on brain cancer and most reported no association (31). A recent study that analyzed long-term users of more than 10 years, however, noted an increased risk of brain cancer with the use of cellular phones (32). There are few if any studies of an association between thyroid cancer and use of cellular phones. Since the thyroid lies just under the surface of the neck close to a cell phone during its use with the emission of a pulsed radiofrequency of electromagnetic field, it is rational to consider wireless phone use as a risk factor for thyroid carcinoma. In this regard, some of the basic studies in the literature are of possible interest (33,34).
In conclusion, the increase in the trend for thyroid cancer is significantly different among the SEER's non-Hispanic whites, Hispanic whites, Blacks, Asians, and American Indians/Alaska Natives REGs. Lack of easily extracted data regarding diagnostic scrutiny in the SEER REGs makes it difficult to determine whether this is an important factor accounting for the differences. Diagnostic scrutiny, however, does not appear to be a logical explanation for the increased incidence in large tumors. Studies of small, subclinical tumors are limited because true incidences of these tumors in populations are lacking. Further studies are needed to quantify the true incidence of thyroid cancers within populations and to probe for associations with factors that are potentially carcinogenic.
Contributors
Schantz, Li, Yu, Branovan, and McCormick developed study concept and designed the study. Yu collected and analyzed data. Yu, Schantz, and Li interpreted the results of analysis, reviewed published studies, and wrote the article. All authors made the critical revision of the article.
Footnotes
Disclosure Statement
The authors declare no conflicts of interest.