
Abstract
Background:
The use of age- and ethnicity-specific thyrotropin (TSH) reference limits decreases misclassification of patients with thyroid dysfunction. Developing such limits requires TSH measurements in different subpopulations.
Methods:
We determined, in the National Health and Nutrition Examination Survey III, the TSH median, 2.5th and 97.5th centiles as a function of age, and anti-thyroid antibodies (ABs) in specific racial/ethnic groups (REGs) designated as non-Hispanic Whites, non-Hispanic Blacks, and Mexican Americans, as classified by the U.S. Office of Management and Budget (OMB) Directive 15. We compared TSH limits of a thyroid disease-free population (n = 15,277) to a reference population (n = 13,344) formed by exclusion of AB+ subjects and TSH >10 mIU/L or <0.1 mIU/L. With quantile regression, we examined the effect of age, REG, gender, body weight, and urinary iodine concentration on TSH reference limits in the AB− population.
Results:
AB status did not affect the 2.5th centile and median TSH in any REG or the 97.5th centile in Blacks. The average 97.5th centile of the disease-free Whites and Mexican Americans was 1.0 mIU/L higher than the reference population group. The TSH 2.5th, 50th, and 97.5th centiles increased with age and were lower in Blacks than in Whites or Mexican Americans. Women had lower 2.5th and 50th centiles than males. From these data, we developed equations to predict subpopulation-specific TSH reference limits.
Conclusions:
Our study provides a method to determine TSH limits in individual patients of different ages, gender, and REG criteria whose AB status is uncertain and it will enable clinicians to better classify patients within their subpopulation-specific TSH reference range.
Introduction
Three recent studies of subjects free of clinical thyroid disease demonstrated that exclusion of people who had anti-thyroid ABs and thyroid ultrasound abnormalities did not influence median TSH or TSH reference limits (9 –11). The reasons for these surprising results are not intuitively obvious since it is well known that the presence of anti-thyroid ABs and certain thyroid ultrasound abnormalities do occur in patients with thyroid disease and thyroid dysfunction. Moreover, these results are not consistent with findings reported for the National Health and Nutrition Examination Survey III (NHANES III), in which the 97.5th centile for TSH was significantly higher in the thyroid disease-free population, when anti-thyroid ABs were not excluded, compared to people who had anti-thyroid ABs excluded (12).
An approach for developing population-specific TSH reference limits that does not require measurement of anti-thyroid ABs would facilitate determination of appropriate TSH reference limits for specific populations. Using the NHANES III database, we have determined whether methodological differences accounted for the significant effect of anti-thyroid ABs on TSH reference limits compared to subsequent publications that did not show such an effect (9 –11). We then quantitatively assessed the contribution of age, REG, and gender on TSH reference limits, classically defined as the 2.5th and 97.5th percentiles of the TSH distribution. Our analyses enabled development of equations that predict the 2.5th and 97.5th centiles for each combination of these demographic factors, and can be programmed into appropriate laboratory hardware. We provide a practical approach for determination of population-specific TSH reference limits that does not require determination of anti-thyroid ABs. Our results will help clinicians reduce misclassification of patients with TSH below the 2.5th centile or above the 97.5th centile of their subpopulation-specific TSH reference range, and thereby improve quality of care in individuals evaluated for thyroid disease.
Methods
The NHANES are designed to give national normative estimates of the health and nutritional status of the noninstitutionalized U.S. population. NHANES III was conducted from 1988 through 1994 using a stratified, multistage probability design (12). Young children, older people, Blacks, and Mexican Americans were oversampled to provide sufficient numbers of people for studies of those groups (13,14). Among 17,353 subjects older than 12 years who had TSH, total thyroxine (T4), and thyroid ABs measured in NHANES III, we studied a disease-free population, which consisted of 15,277 healthy individuals that excluded those subjects with self-reported thyroid disease, goiter, or taking thyroid medications; pregnant subjects; individuals taking estrogens, androgens, or lithium; or subjects with laboratory evidence of hyperthyroidism (T4 >169.9 nM [13.2 μg/100 mL] and TSH <0.1 mIU/L) or hypothyroidism (T4 <57.9 nM [4.5 μg/100 mL] and TSH >4.5 mIU/L). We defined a reference population (n = 13,344) by further excluding from the disease-free population subjects who had detectable anti-thyroglobulin ABS or anti-thyroperoxidase ABs. In addition, because the aim of our study was to detect a group of individuals that would serve to define the TSH reference range, we excluded subjects with treatable thyroid dysfunction; that is, those with serum T4 within the reference range, but TSH either <0.1 or >10 mIU/L (n = 144) who had escaped the filter of exclusion when hyper- and hypothyroidism were considered. Among these 144 subjects, 93 had a TSH >10 mIU/L (median, 14 mIU/L; range, 10.4–83 mIU/L), 55% were Whites, 26% Mexican Americans, and 15% Blacks. The remaining 51 individuals with TSH <0.1 mIU/L (median, 0.02 mIU/L; range, 0–0.09) were 35% Blacks, 35% Whites, and 27% Mexican Americans.
The methods for determination of TSH and anti-thyroid ABs have been reported previously (15).
All statistical analyses were performed using STATA/IC (version 10 for Windows; College Station, TX;
Results
We determined the TSH median, and 2.5th and 97.5th centiles as a function of age, sex, REG, and AB status in all patients, as well as in subpopulations of Whites, Blacks, and Mexican Americans. We then compared TSH median and reference limits by decades of age in the disease-free and reference populations (Table 1 and Fig. 1). We found that the presence of anti-thyroid ABs did not affect the 2.5th centile and median TSH values in any age or REG. Their presence did shift the 97.5th centile to higher values: at most, 1.5 mIU/L in the thyroid disease-free group compared to the reference population. In Blacks, the effect of ABs on the 97.5th centile was negligible, whereas in Mexican Americans and Whites, the average increment in the 97.5th centile was 1.0 mIU/L (Table 1 and Fig. 1). The TSH distribution curve for thyroid disease-free persons in the Whites REG (dashed triangles in Fig. 1) illustrates this point by showing a slight decrease in TSH at peak frequency and a shift in the down slope of the curve to minimally higher serum TSH concentrations than those for the Whites reference group (solid triangles).

Thyrotropin (TSH) distribution curves for disease-free and reference White population and disease-free and reference Black population.
We then established a rigorous reference population by excluding patients from the disease-free group who had anti-thyroid ABs, as well as people found to have either raised (>10 mIU/L) or decreased (<0.1 mIU/L) TSH. This reference group served to establish the TSH reference range that characterizes the U.S. population that does not have thyroid disease. Since prior studies have demonstrated the impact of age and REG on TSH reference limits (2 –5), we quantified the effect of these factors as well as that of gender on these limits. We built quantile regression models that estimated the influence of each predictor on the chosen quantile. Urine iodine concentration did not significantly affect any quantile of TSH and therefore was not included as a covariate in the final models. Body weight (kg) and body mass index were tested as predictors of the 2.5th, median, and 97.5th centiles of TSH. They did not prove to be independent predictors of the 2.5th centile and median TSH, and the effect on the 97.5th centile was so small (for every kilogram increase in body weight, the TSH 97.5th centile would increase 3 × 10⁻⁶ mIU/L), that they were excluded from the models.
Table 2 shows the final quantile regression models for the TSH 2.5th, 50th, and 97.5th centiles. Age significantly increases the 2.5th, 50th, and 97.5th centiles of TSH. The main effect of age is seen at the 97.5th centile of TSH. For every 10 years increase in the subjects' age, the 97.5th centile of TSH increases by 0.3 mIU/L. Female subjects were found to have significantly lower 2.5th centile and median TSH than males, but gender did not significantly affect the 97.5th centile. Blacks had significantly lower 2.5th, 50th, and 97.5th centiles than Whites, suggesting that the TSH frequency distribution curve of Blacks is shifted to lower TSH concentrations after adjusting for age, sex, and other REGs (OREGs). Mexican Americans did not significantly differ from Whites in any TSH quantile. Figure 2 shows that the TSH distribution curves for Whites and Mexican Americans are superimposable and shifted to higher TSH concentrations compared to the TSH distribution of Blacks.
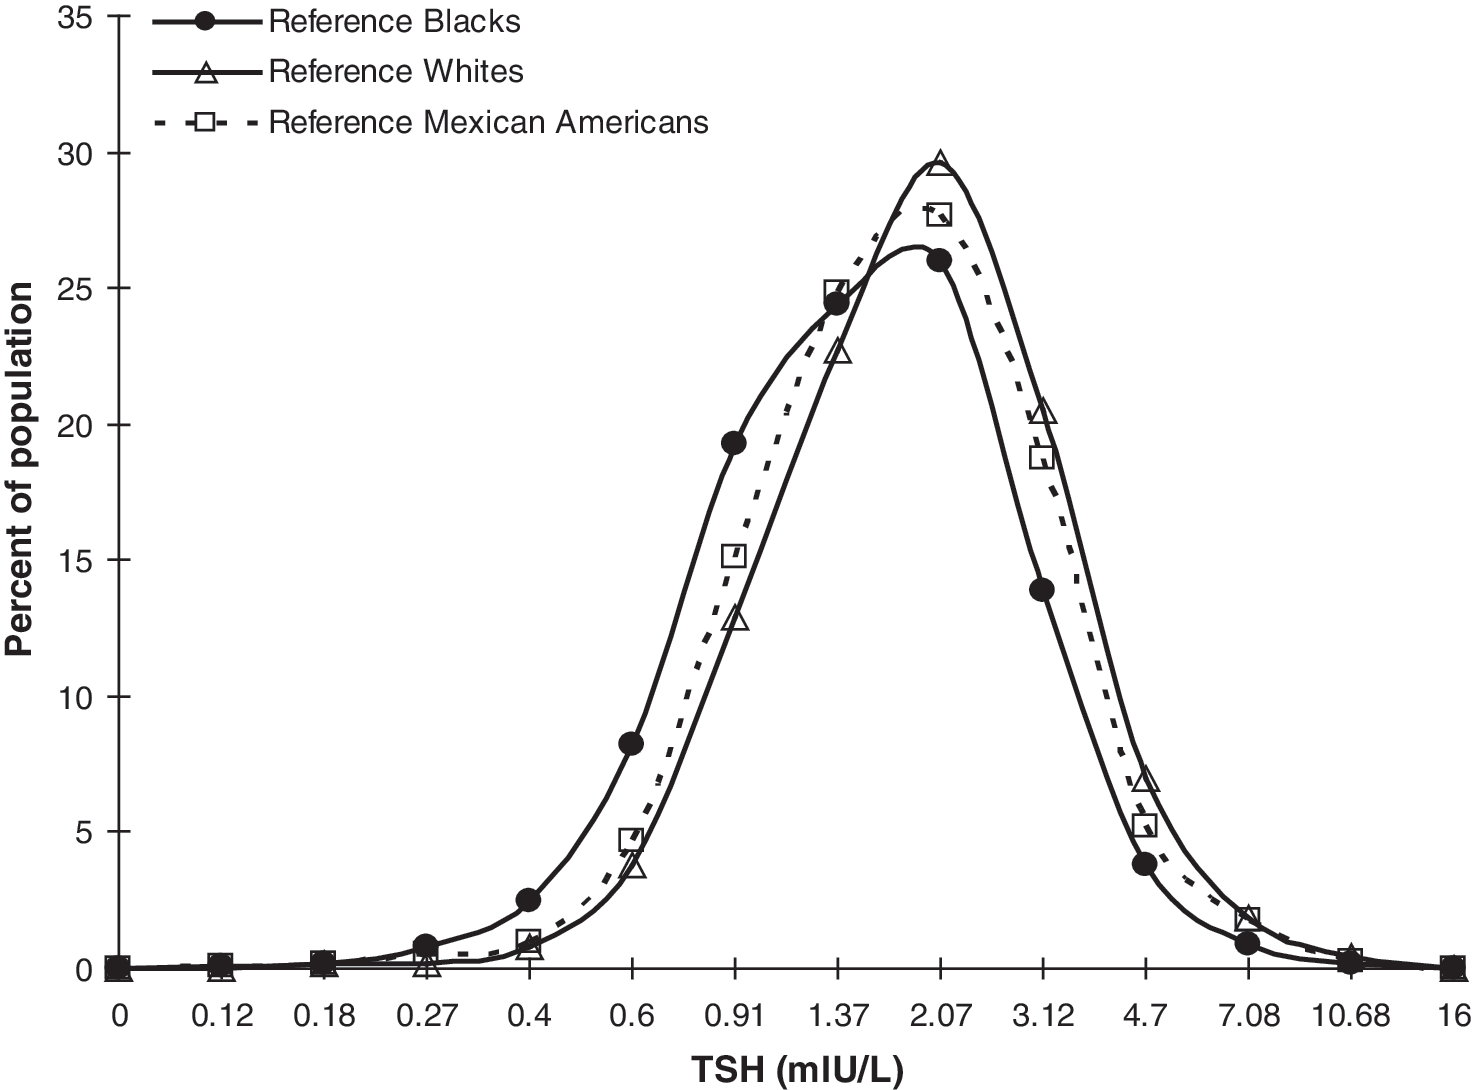
Frequency distribution curves for Whites and Mexican Americans racial/ethnic groups are superimposable and shifted to higher TSH concentrations compared to that of Blacks racial/ethnic group.
Number of observations = 13,296.
Coefficients less than zero indicate an inverse association between the characteristic (age, gender, etc.) and TSH.
For every year increase in age, there is a 0.031 mIU/L increase in the 97.5th centile of TSH.
REG, racial/ethnic group; TSH, thyrotropin.
To provide laboratories with a practical method of establishing TSH reference ranges for specific subpopulations, we developed equations that contain these relevant demographic factors that can be entered into laboratory computer systems; they incorporate age, gender, and REG to predict population-specific 2.5th and 97.5th centiles for TSH.
where age is in years, sex = 0 for males and 1 for females, and Whites = 0.
The practical utility of these equations is outlined in the following example: the TSH reference limits for a 75-year-old woman who fits criteria for the Whites REG using these equations are 0.512–5.22 mIU/L, whereas a 22-year-old man who fits criteria for the Blacks REG would have TSH limits of 0.37–3.46 mIU/L. In the event that REG of the patient is unknown, the program could be defaulted to assume the most prevalent REG in the area served by the institution or adopt TSH reference limits from NHANES III.
Discussion
This study uses data from NHANES III to provide a practical approach for establishing TSH reference limits for specific subpopulations in the United States. We found that age, sex, and REG were independent predictors of TSH median and reference limits. The presence of anti-thyroid ABs increased the TSH 97.5th centile of Whites and Mexican Americans by, on average, 1 mIU/L, but they did not substantially affect any TSH quantile in Blacks, or the TSH median or 2.5th centiles of any age, gender, or REG group. Since anti-thyroid ABs were measured in all participants, we were able to exclude those with auto-ABs and then, with quantile regression methodology, derive equations that take into account the effect of age, gender, and REG when predicting TSH reference limits in specific subpopulations. Thus, our study presents a novel paradigm for development of age-, sex-, and REG-specific TSH reference limits for use in clinical laboratories without the need for measurement of anti-thyroid ABs.
Three studies have shown that there is minimal influence of anti-thyroid ABs on the TSH reference range (9 –11). We found that there was no impact of anti-thyroid ABs on TSH reference limits of Blacks and that their presence increased the TSH 97.5th centile of Whites and Mexican Americans by an average 1.0 mIU/L. The presence or absence of anti-thyroid ABs did not affect the median TSH or the 2.5th centile in any group. Our results therefore indicate that there is no reason to measure anti-thyroid ABs in patients meeting criteria for Blacks REG. However, in patients meeting the criteria for Whites or Mexican Americans, 1.0 mIU/L could be added to the 97.5th centile predicted from the equation we describe, especially if the patient has a family history of thyroid disease, symptoms or signs of thyroid dysfunction, or a goiter.
We have recently shown that the TSH distribution curve that has been used to determine TSH reference limits is actually an integral of distinct curves for specific subpopulations (2,5). The use of this curve for all patients results in misclassification of patients outside their population-specific reference range (2 –5). For example, increasing age shifts the TSH distribution curve and the 97.5th centile to higher TSH concentrations (2,4). Possible explanations for a shift in TSH distribution to higher values with aging include influences of medication, changes with age in negative feedback relationships between free T4 and TSH, changes in TSH bioactivity, or subtle thyroid hormone deficiency (2). Recent reports suggest that this effect may be genetically determined (16 –22). In the present study, we confirm the effect of age on TSH distribution in each subpopulation we analyzed. Further, we examine the impact of age on different quantiles of the TSH distribution of a reference population even when adjusted by other demographic variables like gender and REG. These analyses allowed us to develop the predictive equations that provide clinicians tools to account for the effect of age when interpreting TSH reference limits.
Several studies suggest that serum TSH in persons meeting the criteria for Blacks REG is lower than in persons meeting the criteria for Whites (12,23 –25); in a previous study of an urban outpatient medicine practice, we found that the TSH distribution curve for subjects meeting the criteria for Blacks was shifted to lower concentrations than the curve for persons meeting the criteria for Whites, including TSH concentration at peak frequency (3). In addition, the curves for persons meeting the OMB criteria for Blacks and Hispanics who were mostly from Puerto Rico and Dominican Republic were superimposable. Our present study shows that Blacks have significantly lower TSH 2.5th, median, and 97.5th centiles than Whites REG even when adjusted by age, sex, and other ethnicities. Mexican American Hispanics in NHANES III had a TSH distribution superimposable to Whites (evidenced by nonsignificant coefficients in regression models and overlapping distribution curves). Genetic differences between persons in the Mexican Americans REG and the Hispanics REG from Puerto Rico and the Dominican Republic may be responsible for the shifts in TSH distribution we observed.
The strength of our report is that we studied a large population that is considered representative of the United States, in which patients with thyroid disease and/or anti-thyroid ABs could be excluded. We could then calculate TSH distribution and reference limits for a defined thyroid disease-free population as well as various subpopulations. For the first time, we have provided laboratories with useful equations that define population-specific TSH reference limits. The equations that do not require measurement of anti-thyroid ABs can be programmed into laboratory computer systems. A limitation of our study is the need to validate our models and extend these analyses to subpopulations not studied in NHANES III or populations other than those in the United States.
Accumulating evidence shows that the traditional method for determining TSH reference limits does not reflect the TSH distribution of groups that may differ in environmental influences or in their age, ethnic, or genetic composition (2,3). This and can lead to misclassification of millions of people with either raised or decreased TSH. It is important therefore, to provide clinicians with population-specific reference limits whenever possible. Since linear regression approaches perform poorly when studying the extremes of a distribution, we used quantile regression methodology, which is a more robust and flexible approach to identify factors that could have an impact on these limits. With this statistical tool we present equations that incorporate the effect of age, gender, and REG to predict TSH reference limits. Our results provide a practical tool that can be incorporated into laboratory computer systems. The laboratory can then provide clinicians with more accurate population-specific TSH reference limits, which should improve patient care.
Footnotes
Acknowledgments
The authors thank Dr. Charles Hall for his statistical help and Drs. Tylis Chang and Herbert Rose for critically reading the article and providing helpful suggestions. This publication was made possible by the CTSA Grant UL1 RR025750 and KL2 RR025749 and TL1 RR025748 from the National Center for Research Resources (NCRR), a component of the National Institutes of Health (NIH), and NIH roadmap for Medical Research. Its contents are solely the responsibility of the authors and do not necessary represent the official view of the NCRR or NIH.
Disclosure Statement
The authors declare that no competing financial interests exist.