
Abstract
Background:
Thyroid hormones (THs) act genomically to stimulate glucose transport by elevating glucose transporter (Slc2a) expression and glucose utilization by cells. However, nongenomic effects of THs are now emerging. Here, we assess how triiodothyronine (T3) acutely affects glucose transport and the content of GLUT4, GLUT1, and GLUT3 at the surface of muscle cells, and possible interactions between T3 and insulin action.
Methods:
Differentiated L6 myotubes transfected with myc-tagged Slc2a4 (L6-GLUT4myc) or Slc2a1 (L6-GLUT1myc) and wild-type L6 myotubes were studied in the following conditions: control, hypothyroid (Tx), Tx plus T3, Tx plus insulin, and Tx plus insulin and T3.
Results:
Glucose uptake and GLUT4 content at the cell surface decreased in the Tx group relative to controls. T3 treatment for 30 minutes increased glucose transport into L6-GLUT4myc cells without altering surface GLUT4 content, which increased only thereafter. The total amount of GLUT4 protein remained unchanged among the groups studied. The surface GLUT1 content of L6-GLUT1myc cells also remained unaltered after T3 treatment; however, in these cells glucose transport was not stimulated by T3. In wild-type L6 cells, although T3 treatment increased the total amount of GLUT3, it did not change the surface GLUT3 content. Moreover, within 30 minutes, T3 stimulation of glucose uptake was additive to that of insulin in L6-GLUT4myc cells. As expected, insulin elevated surface GLUT4 content and glucose uptake. However, interestingly, surface GLUT4 content remained unchanged or even dropped with T3 plus insulin.
Conclusions:
These data reveal that T3 rapidly increases glucose uptake in L6-GLUT4myc cells, which, at least for 30 minutes, did not depend on an increment in GLUT4 at the cell surface yet potentiates insulin action. We propose that this rapid T3 effect involves activation of GLUT4 transporters at the cell surface, but cannot discount the involvement of an unknown GLUT.
Introduction
Besides GLUT4, which accounts for the majority of postprandial glucose uptake, playing a key role in whole-body glucose homeostasis, the expression of other GLUTs is also increased by THs, specifically GLUT1 and GLUT3 (7,8). These are low-Km transporters expressed in many tissues; they are responsible for the glucose uptake in the unfed state.
Intriguingly, both hypothyroidism and hyperthyroidism are accompanied by glucose intolerance, and the underlying basis of these phenomena is not well understood (9,10). In fact, in hyperthyroid states, in parallel to the increased glucose consumption (11,12), there is enhanced lipolysis, glycogenolysis, and gluconeogenesis, which by elevating plasma fatty acids and glucose levels might contribute for the decrease in insulin sensitivity (13,14). Whether these processes are the underlying cause or only a consequence of the insulin resistance found in hyperthyroidism is unknown, but they certainly contribute to an impairment of insulin sensitivity. These effects occur under chronically high levels of THs, which contrasts with data obtained in our laboratory, which show that the acute triiodothyronine (T3) administration, in rats, increases GLUT4 expression and content in isolated PM from muscle tissue, as well as the glucose decay rate (15). This event was established in a short period of time (30 minutes), and was ascribed to nongenomic action of THs. These data also support in vitro studies showing that TH rapidly increases glucose uptake by myocytes (16). However, it is still to be determined if this effect of T3 is entirely dependent on GLUT4, or is resultant of alterations in insulin sensitivity.
The present study attempted to investigate these possibilities, by evaluating the effects of acute T3 administration on glucose uptake in L6 cells transfected with myc-tagged Slc2a4 or myc-tagged Slc2a1, in the presence or absence of insulin.
Materials and Methods
Materials
T3, 2-deoxy-
Cell culture
L6-GLUT4myc, L6-GLUT1myc, and wild-type L6 cells were used in the experiments. The L6 cells transfected with c-myc-tagged Slc2a4 (L6-GLUT4myc) and c-myc-tagged Slc2a1 (L6-GLUT1myc) were used as previously described (17 –19). These myoblasts, upon reaching confluence in low serum, differentiate into myotubes. The cells were cultured in α-MEM supplemented with 10% FBS, 100 units/mL penicillin, and 100 μg/mL streptomycin and were grown at 37°C in 95% humidified air with 5% CO2. Cells at 80% confluence were resuspended and plated until reaching 80% confluence; after that, they were cultured for 6 days in α-MEM and 2% FBS to induce the L6 differentiation. For experiments, cells were maintained in (a) normal FBS (control group), (b) FBS depleted of THs for 24 hours (hypothyroid [Tx] group), (c) FBS depleted of THs for 24 hours and then incubated with T3 (10−6 to 10−9 M) for 10–40 minutes and, (d) FBS depleted of THs for 24 hours and then incubated with insulin (10, 20, and 100 nM) alone or with T3 (10−8 M) for 30 minutes. TH depletion from FBS was carried out according to Samuels et al. (20).
2-DG uptake
After T3 treatment, glucose uptake into L6-GLUT4myc and L6-GLUT1myc myotubes was assessed for 5 minutes in HEPES-buffered saline (140 mM NaCl, 20 mM HEPES, 5 mM KCl, 2.5 mM MgSO4, and 1 mM CaCl2 [pH 7.4]) containing 10 μM 2-DG (0.5 μCi/mL 2-[3H]DG) at room temperature as described by Huang et al. (21). Nonspecific uptake was determined in the presence of cytochalasin B (10 μM). 2-DG uptake was also determined in GLUT4myc and GLUT1myc L6 cells treated with insulin (100 nM), and used as a positive assay control.
Optical detection of GLUT4myc and GLUT1myc at the cell surface
Following the T3 treatment, surface GLUT4myc or GLUT1myc levels were determined in nonpermeabilized L6-GLUT4myc or GLUT1myc myotubes. Briefly, cells were washed in ice-cold phosphate-buffered saline (PBS) supplemented with 1 mM CaCl2 and 1 mM MgCl2 (pH 7.4), fixed in 3% paraformaldehyde for 30 minutes, quenched with 100 mM glycine for 10 minutes, blocked with 5% goat serum for 15 minutes, and incubated with anti-myc antibody solution (1.0 μg/mL in PBS with 3% goat serum) for one hour at 4°C. After labeling, excess antibody was removed by extensive washing in ice-cold PBS. Cell-surface-bound antibodies were detected by horseradish-peroxidase-conjugated secondary antibodies followed by peroxide detection with O-phenylenediamine, as described by Wang et al. (22). GLUT4myc and GLUT1myc at the cell surface were also evaluated in L6 cells treated with insulin (100 nM), and used as a positive assay control.
Detection of GLUT4 and GLUT3 at the cell surface by biotinylation
Cell surface biotinylation was performed in wild-type L6 cells as a modification of a method described previously (23). Following the T3 treatment, surface GLUT4 and GLUT3 contents were determined in wild-type L6 myotubes. Cells were grown in six-well plates to 80% confluence, washed with PBS/CM (PBS with 0.1 mM CaCl2 and 1 mM MgCl2), and incubated twice for 20 minutes at 4°C with 1.0 mg/mL sulfosuccinimidyl-2-(biotinamido)ethyl-1,3-dithiopropionate (Sulfo-NHS-SS-biotin) in 20 mM HEPES (pH 8.5), 2 mM CaCl2, and 150 mM NaCl. Cells were washed twice for 20 minutes with PBS/CM-containing 100 mM glycine at 4°C and lysed with 1% sodium dodecyl sulfate (SDS) in 150 mM NaCl, 5 mM EDTA, 1% of Triton X-100, and 50 mM Tris (pH 7.5) containing protease inhibitors, and referred to as buffer A. Samples were diluted 10× with buffer A without SDS. Streptavidin agarose beads were added to the lysate and incubated overnight at 4°C. The next day the lysate was centrifuged at 14,000 g for 5 minutes to separate beads from the supernatant. Beads were washed 3× with buffer A without SDS and 2× with high-ionic-strength buffer (500 mM NaCl, 0.1% Triton X-100, 5 mM EDTA, and 50 mM Tris-HCl [pH 7.5]). The final wash was done with 50 mM Tris-HCl (pH 7.5). Beads were resuspended in sample buffer, heated for 5 minutes at 75°C, and analyzed by SDS-polyacrylamide gel electrophoresis (PAGE) and immunoblotting with anti-GLUT4 (1:4000) and anti-GLUT3 (1:4000) expression. Glyceraldehyde 3-phosphate dehydrogenase and insulin receptor were used as loading control of total and PM expression of GLUT4 and GLUT3, respectively. The band detection was performed using the Enhanced Chemiluminescence (ECL) kit (Amersham Biosciences, Buckinghamshire, United Kingdom). Blots were analyzed with Scion Image software (Scion Corp., Frederick, MD). Results were expressed as arbitrary units.
Evaluation of total and phosphorylated Akt content
After indicated treatments, L6-GLUT4myc myotubes were washed with ice-cold PBS; lysed in 1% Triton X-100 in PBS supplemented with NaOV3 (1 mM), NaF (1 mM), and protease inhibitor cocktail (1:1000); and further analyzed by SDS-PAGE and immunoblotting with anti-p-Akt Ser 473 (1:1000). The band detection was performed as previously described.
Statistical analysis
Results are expressed as mean±standard error of the mean and subjected to analysis of variance, followed by the Student-Newman-Keuls. Differences were considered significant at p<0.05.
Results
T3 action on 2-DG transport
Glucose uptake in L6-GLUT4myc cells is determined by GLUT4 (18,19). Figure 1 illustrates the dose–response and time course of glucose uptake in L6-GLUT4myc myotubes. Group Tx displayed reduced glucose uptake compared with the control (C) group. T3 treatment for 30 minutes, in doses from 10−9 to 10−6 M, promoted an increase of glucose uptake in comparison to the Tx group (Fig. 1A). The 10−8 M T3 dose was used for all subsequent studies. Figure 1B shows that glucose uptake in L6-GLUT4myc cells significantly rose by 30 minutes of T3 treatment and continued to increase at 40 minutes. As expected, insulin administration also increased glucose uptake.
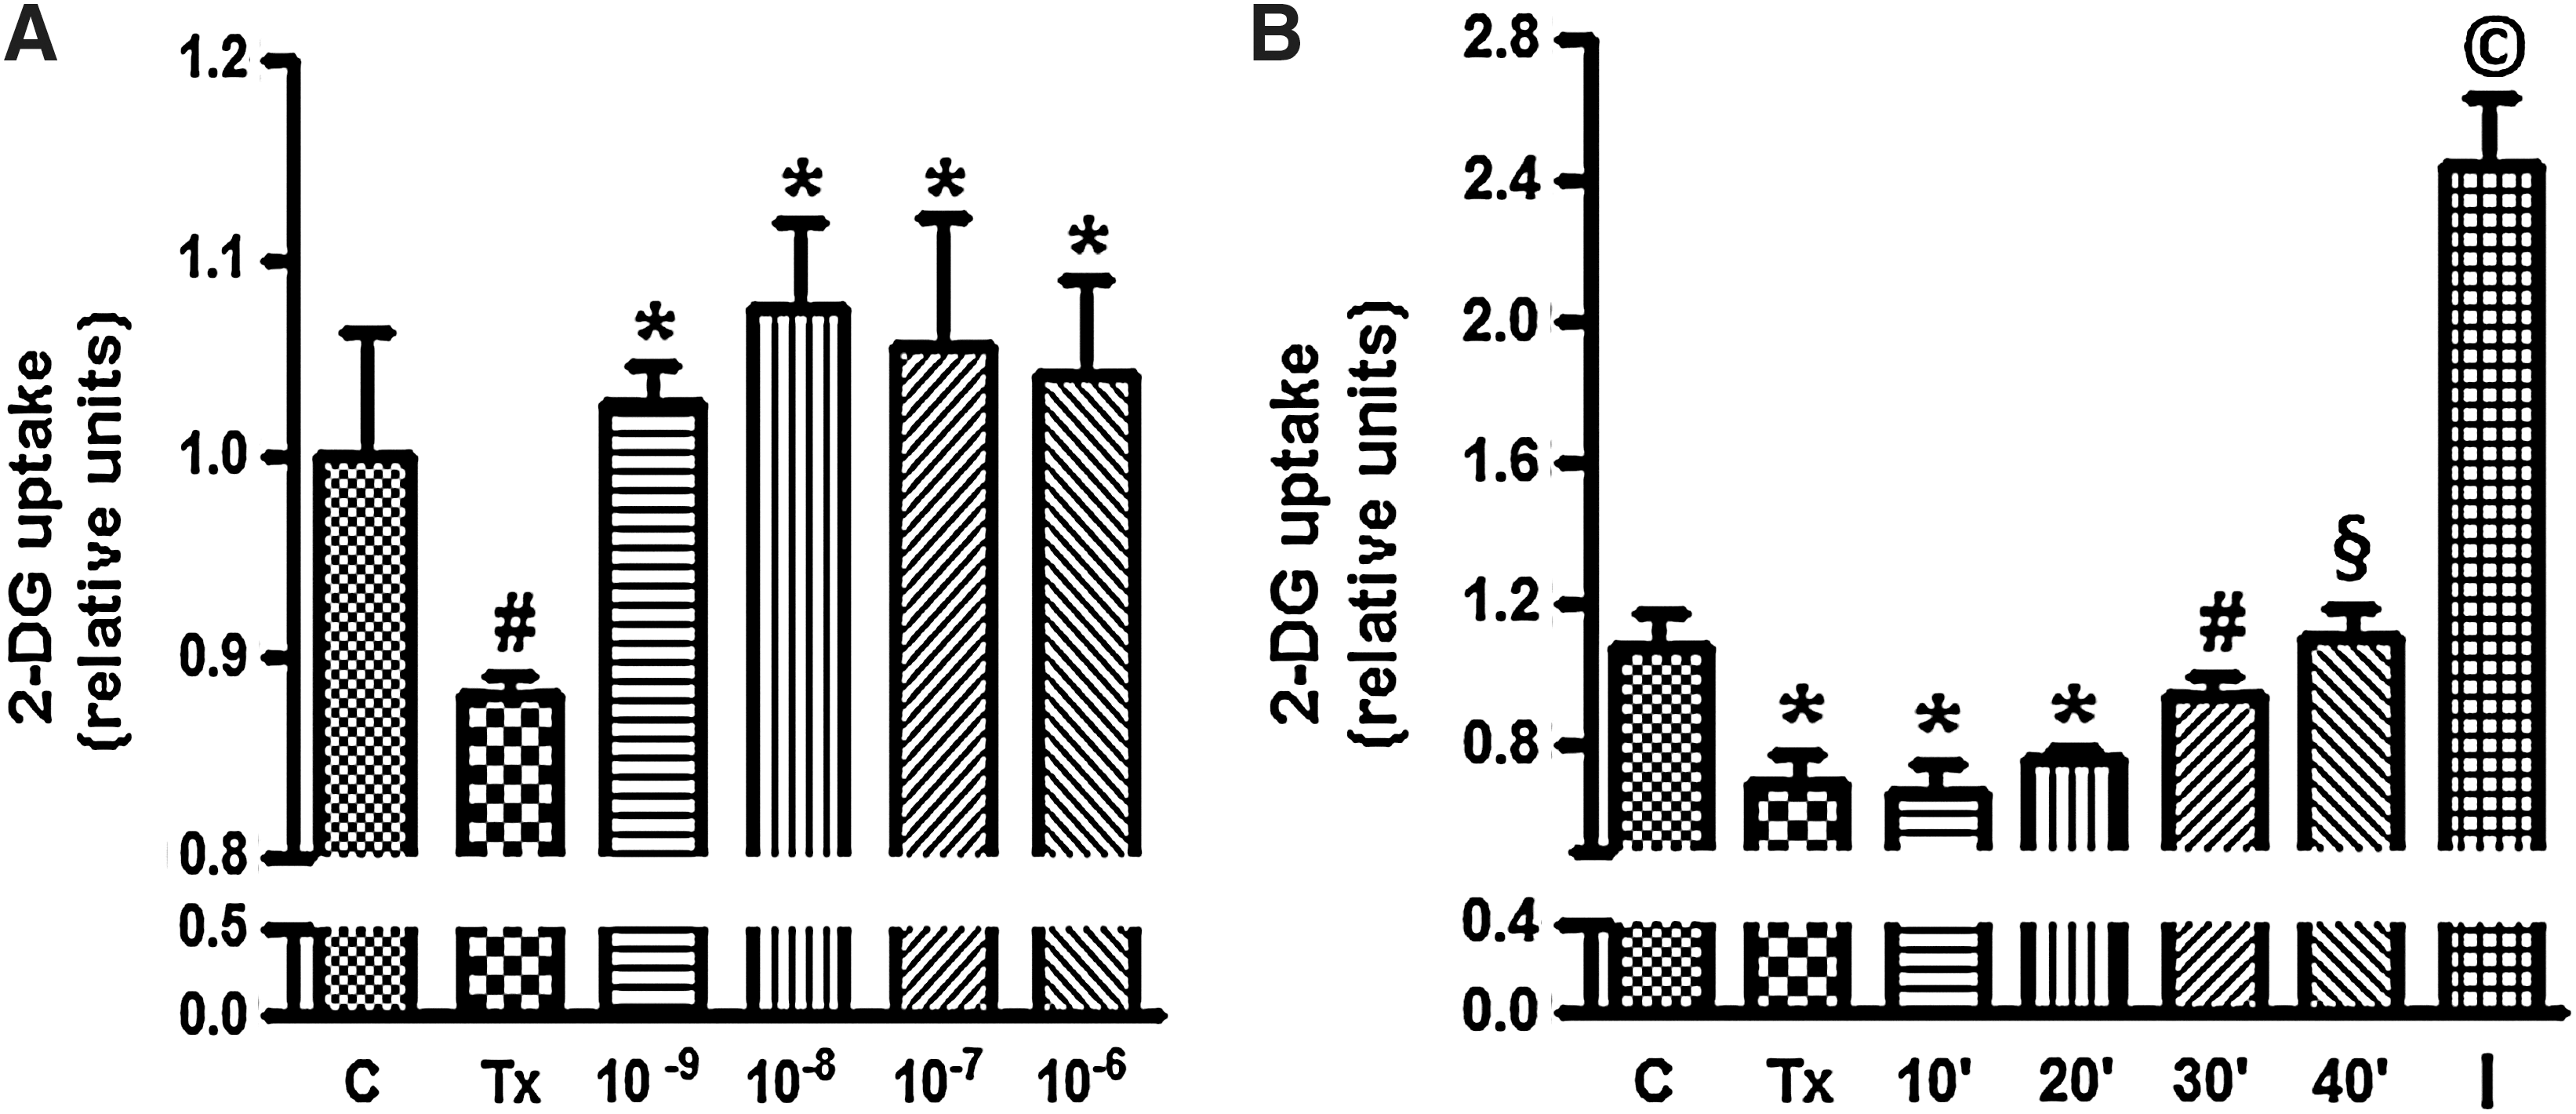
Dose–response and time course study of T3 on glucose transport. Panel
T3 effect on total and PM surface GLUT4 content in L6-GLUT4myc and wild-type cells
Figure 2A and B shows the total amount of GLUT4 on L6 wild-type and L6-GLUT4myc cells, respectively. Total GLUT4 content was not altered in Tx and T3-treated in comparison to the control group. GLUT4 and GLUT4myc present in the PM of wild-type L6 and L6-GLUT4myc myotubes were reduced in Tx in comparison to control group. T3 administration did not induce any change in this parameter for up to 30 minutes of treatment (Fig. 2C, D). However, by 40 minutes, surface GLUT4myc rose, reaching the levels observed in the control group (Fig. 2D). Figure 2D also shows an increase of the surface GLUT4myc content in response to insulin administration, as expected.
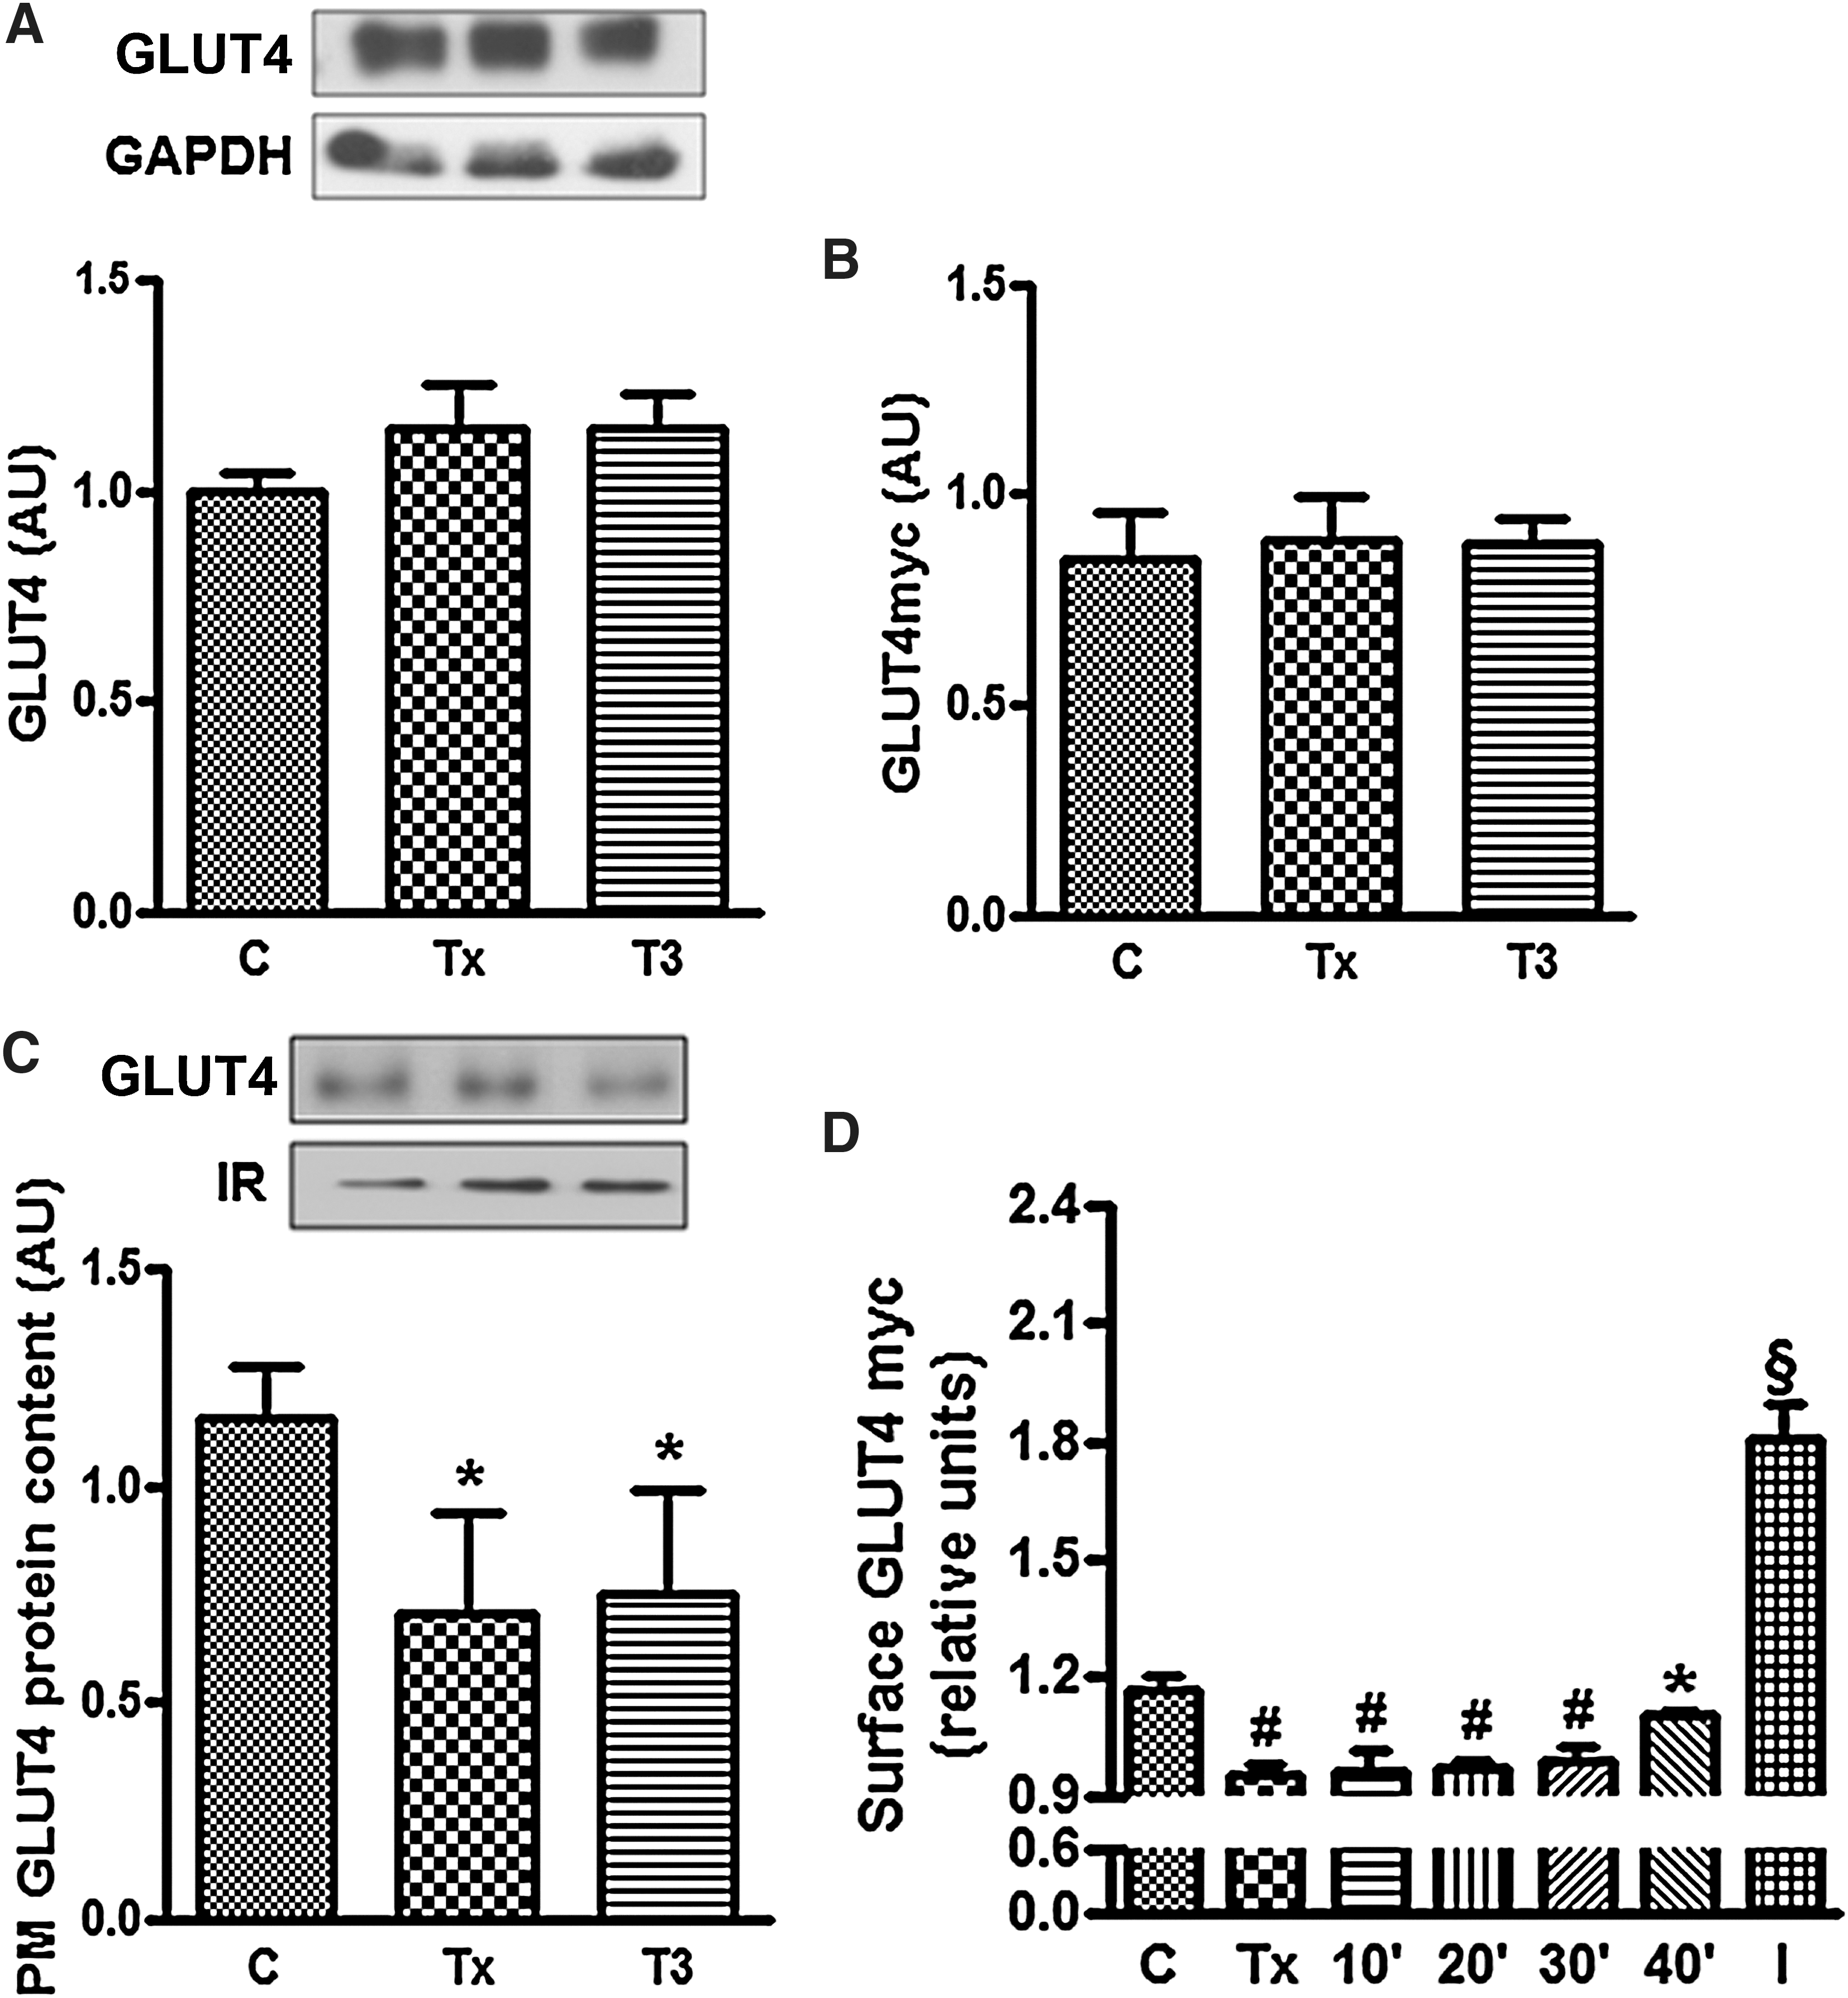
Effect of T3 treatment on total GLUT4 content and on the amount of GLUT4 present in the plasma membrane. Panels
T3 effect on phosphorylated protein kinase B content
The phosphorylation of protein kinase B (AKT/PKB) is a key step for GLUT4 translocation induced by insulin in muscle cells (24). The data presented in Figure 3 show that T3 did not change the phosphorylated AKT/PKB content in L6-GLUT4myc cells, whereas insulin increased it, as expected.
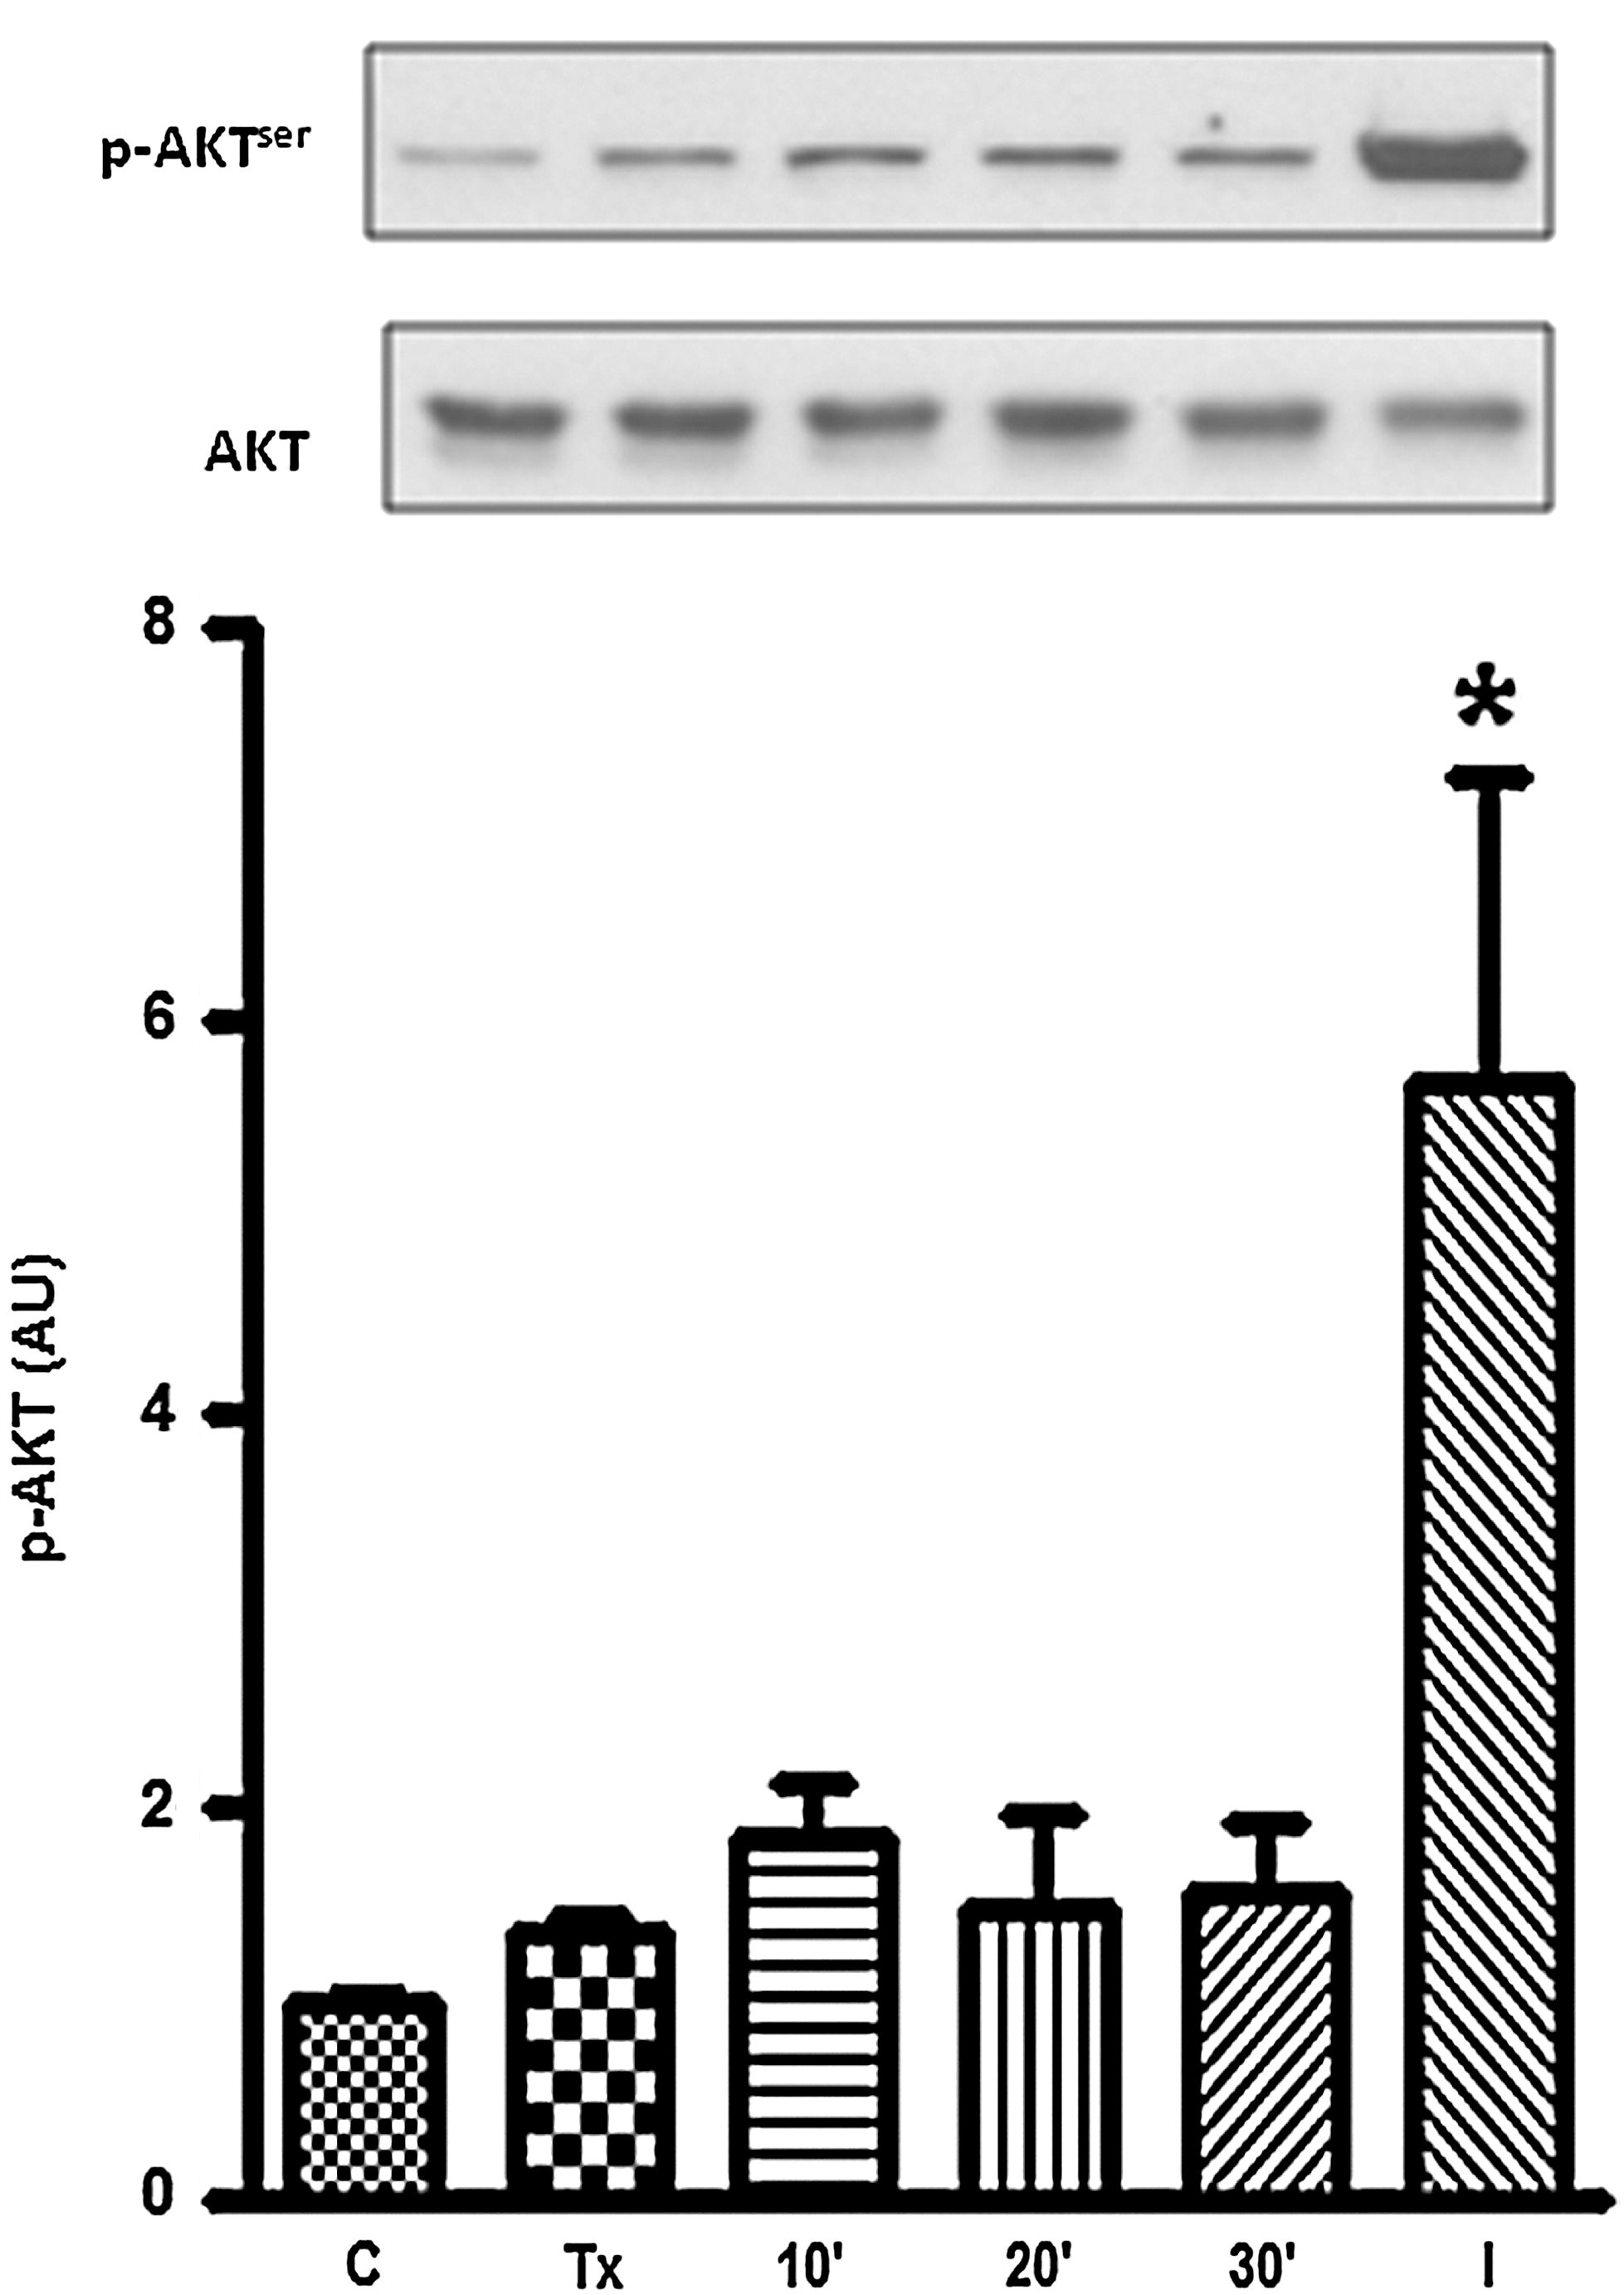
T3 effect on AKT/PKB phosphorylation. L6-GLUT4myc cells were segregated into the following groups: control; hypothyroid; Tx treated with T3 (10−8 M) for 10, 20, and 30 min; and control treated with insulin for 20 min. At the top, typical autoradiograms of one experiment in a total of three are shown. The respective graphical representation obtained in all experiments is shown at the bottom. The data show means±SEM (n=3 per experiment), expressed in AUs. *p<0.05 versus all group. AKT/PKB, protein kinase B.
T3 is additive to the stimulatory effect of insulin on 2-DG transport without altering GLUT4myc content
Insulin is a known stimulator of glucose uptake into muscle tissue and muscle cells, a task accomplished by translocation of GLUT4 from intracellular stores to the cell surface (25,26). However, the possible interaction between THs and insulin on these processes has not been examined. Here, we used L6-GLUT4myc cells to explore the effect of acute administration of these hormones on glucose uptake and surface GLUT4 content. Strikingly, Tx cells co-incubated with T3 and insulin (10, 20, and 100 nM) for 30 minutes displayed enhanced glucose uptake compared with Tx cells treated only with insulin at the same doses (Fig. 4A). The major effect of T3 was observed with the highest dose of insulin (100 nM). In stark contrast, surface GLUT4myc content remained unchanged with or without T3 administration, and even decreased when T3 was present along with the highest dose of insulin (Fig. 4B).

Effect of T3 treatment on insulin-induced glucose transport. Panel ), Tx insulin-treated (10, 20, and 100 nM) ( ), and Tx treated with the same doses of insulin plus T3 (10−8 M) for 30 min (
 ). The amount of GLUT4 present in surface of plasma membrane was determined by optical detection, as described in the Materials and Methods section. The data show means±SEM of three independent experiments (n=3 per experiment), expressed in relative units. Panel
Time course of T3 on 2-DG transport and surface GLUT1myc content in L6-GLUT1myc cells
In L6-GLUT1myc cells, glucose uptake is vastly governed by GLUT1, whereas in L6-GLUT4myc, GLUT4 is the defining route of glucose entry (19). Hence, these cells offer the opportunity to compare the effects of Tx on the two transporters. As observed with L6-GLUT4myc cells, L6-GLUT1myc cells cultured in Tx showed reduced glucose uptake (Fig. 5A), and reduced surface GLUT1myc content (Fig. 5B) compared with control (C) cells. However, in these cells, T3 treatment from 10 to 40 minutes did not alter either parameter. These results highlight that the effect of T3 is specific for the GLUT4 transporter.

Effect of T3 treatment on glucose transport and surface GLUT1. Panel
T3 effect on total and PM GLUT3 content
Although GLUT4 is the most important GLUT protein in muscle cells, myocytes also express GLUT1 and GLUT3 (27). Considering that T3 increased glucose uptake without altering GLUT4 and GLUT1 content at PM, we used L6 wild-type cells to explore whether acute administration of T3 affects PM GLUT3 content. Figure 6 shows that although T3 rapidly increased the total GLUT3 content, it did not change the amount of GLUT3 present at the PM.
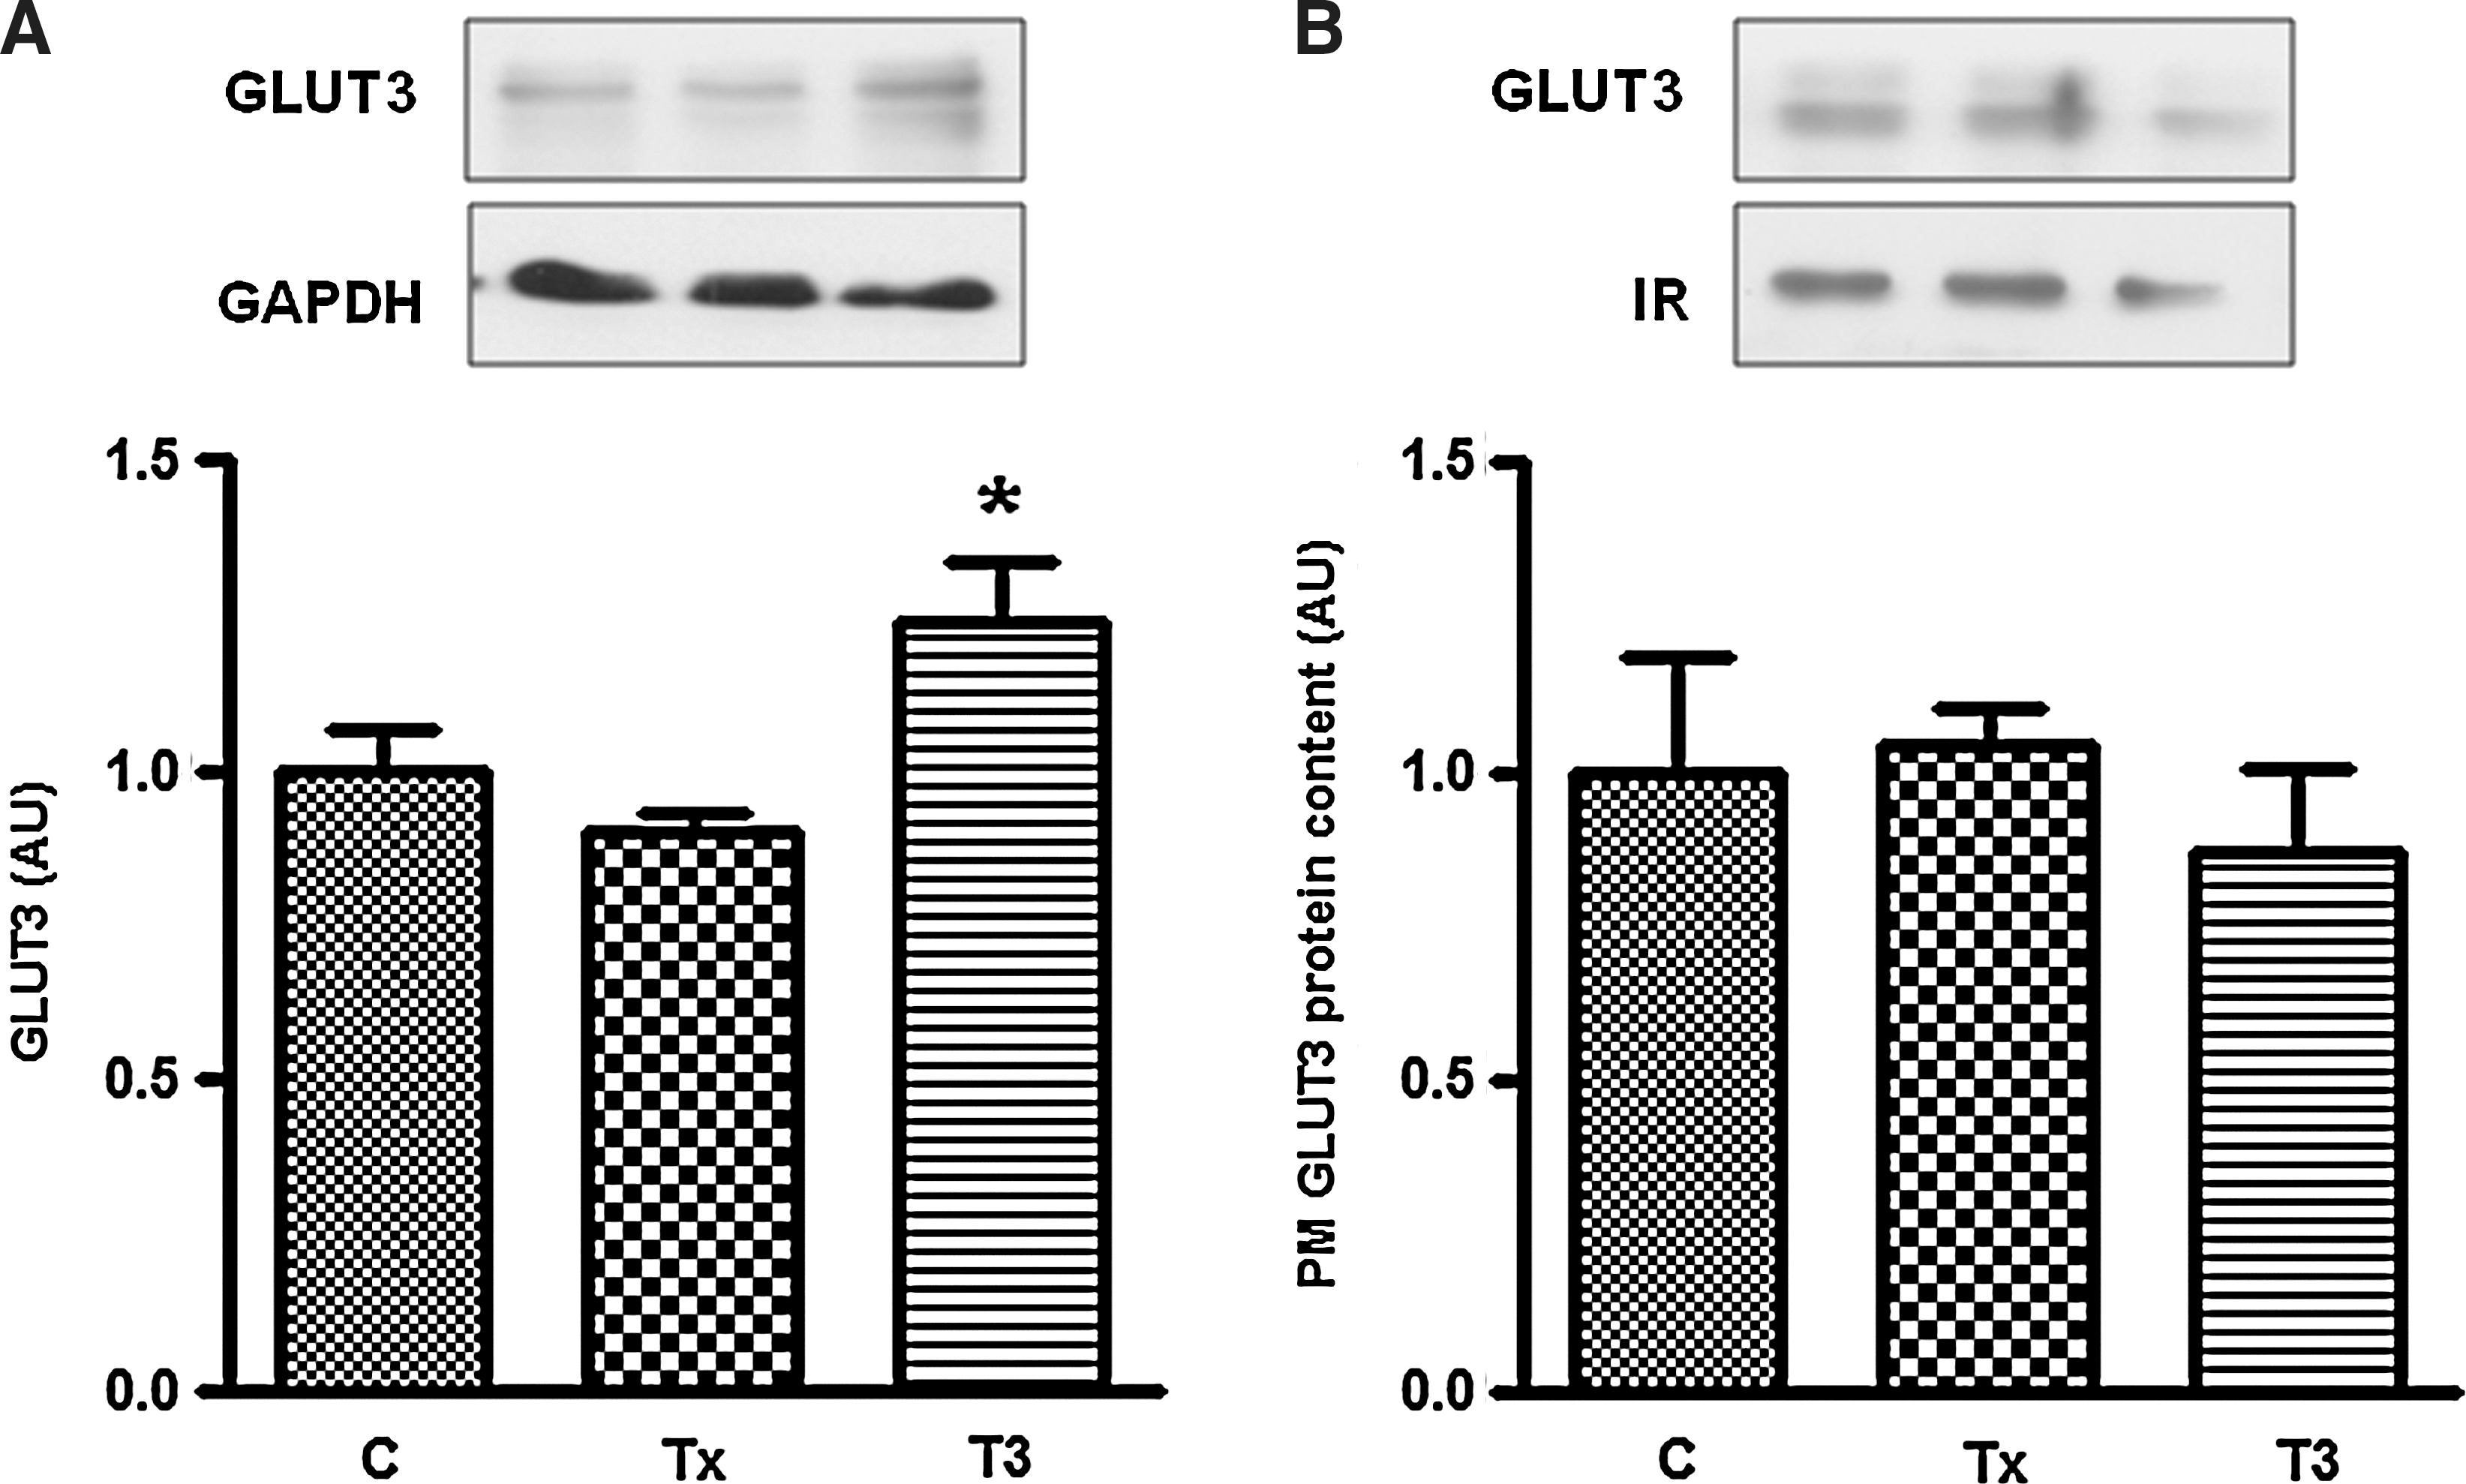
T3 effect on total GLUT3 content and on the amount of GLUT3 present in the plasma membrane. Panel
Discussion
THs play an important role in the control of glucose homeostasis; however, the mechanisms involved in these actions have not been thoroughly explored. T3 upregulates the transcription of some GLUTs, notably GLUT4, leading to an increase in glucose uptake by muscle and adipose cells (28,29). However, in hyperthyroid states, in parallel to the high glucose peripheral utilization, hepatic glucose output is increased, as a result of the high glucose hepatic production and GLUT2 expression (30,31); this leads to glucose intolerance (14). In fact, insulin resistance is well established in hyperthyroidism (14). Glucose intolerance is also observed in hypothyroidism, as a result of the decreased energy expenditure and GLUT4 expression, among other factors (9,11,32). All these events were shown to be dependent on TH action at the level of gene transcription.
On the other hand, THs can also act nongenomically to increase glucose uptake into heart slices (16). Glucose uptake in heart, skeletal muscle, and adipose tissue is carried out mainly by GLUT4, the major GLUT present in these tissues. In response to insulin or muscle contraction, GLUT4 is rapidly translocated and inserted into the PM. However, it was not known whether THs can also regulate this mechanism. Here, we tested the hypothesis that THs may exert an acute, nongenomic action regulating GLUT4 translocation in skeletal muscle cells. To this end we used L6-GLUT4myc cells and wild-type L6 cells that allowed us to evaluate the amount of GLUT4 inserted into the PM by different methodological approaches (22,23).
As expected, L6-GLUT4myc cells kept in culture medium in the absence of T3 displayed lower glucose uptake and lower GLUT4myc protein content at the cell surface compared with control cells. Moreover, T3 treatment itself stimulated glucose transport into L6-GLUT4myc cells within 30 minutes, even though an increase of GLUT4myc protein content at PM was observed only when T3 treatment was performed for longer period of time (40 minutes). Moreover, the absence of T3 as well as T3 treatment did not alter the total amount of GLUT4 protein. The same pattern was observed in wild-type L6 cells concerning the amount of total GLUT4 and GLUT4 content at PM 30 minutes after T3 treatment.
Because glucose uptake in L6-GLUT4myc cells is vastly dependent on GLUT4, these results lead us to speculate that the increased glucose uptake in response to T3 treatment within 30 minutes may be due to the activation of GLUT4 already present in the PM, a step that is also regulated under diverse conditions (33,34). However, we cannot formally exclude that an unrelated GLUT is recruited by T3 treatment. Beyond this initial (30 minutes) action of T3, the subsequent rise in surface GLUT4 content detected by 40 minutes suggests that T3 can also increase glucose uptake by promoting GLUT4 translocation.
In this sense the second salient finding of this study is that the stimulation of glucose uptake by T3 was additive to that of insulin when both hormones were present for 30 minutes, and this increase occurred without a further gain in surface GLUT4myc levels beyond those increased by insulin. In fact, the major additive action of insulin-stimulated glucose uptake by T3 occurred with the highest dose of insulin tested (100 nM), even though under these conditions surface GLUT4myc even dropped. These findings reinforce the concept that T3 increases glucose uptake independently of GLUT4 translocation and that T3 might improve insulin action in these cells by mechanisms that do not depend on GLUT4 translocation.
GLUT4 insertion at the surface of insulin-responsive cells involves the activation of intracellular signaling pathways initiated by insulin interaction with its receptors at the PM, and further activation of phosphoinositide kinase-3 and AKT/PKB, which, in turn, leads to GLUT4 translocation and insertion in the PM (26). Our results, demonstrating that the absence or presence of T3 did not change the phosphorylation of AKT/PKB, reinforces that T3 improved glucose uptake independently of insulin action.
Indeed, in vivo studies from our laboratory have shown that T3 rapidly increases GLUT4 translocation and glucose decay rate in the Tx rat (15). Further, T3 decreased the phosphorylation of AKT/PKB in skeletal muscles, and did not change the serum insulin concentration that was reduced in Tx rats (Supplementary Data; available online at
Although GLUT4 is the major GLUT of skeletal muscle, myocytes also express GLUT1 and GLUT3 that could potentially be involved in the increased glucose uptake induced by T3 (27). In fact, Slc2a1 and Slc2a3 gene expression is upregulated by THs (7,35,36). We tested T3 action in L6-GLUT1myc cells, in which glucose uptake is mainly dependent on GLUT1. Although L6-GLUT1myc cells cultured in a T3-free medium exhibited lower glucose uptake in comparison to control cells, T3 addition for 30 minutes did not alter this parameter. Similarly, surface GLUT1myc levels were unchanged upon T3 treatment. These findings indicate that GLUT1 protein is not involved in the stimulatory effect of T3 on glucose uptake into L6 cells and that within this time there is no change in the net levels of the endogenous GLUT1 protein that might contribute to glucose uptake.
Even though little is known about the relationship between T3 and GLUT3, and that most of the studies were performed in brain of neonates, it is worth to comment that increased GLUT3 content in the PM was shown to occur in monocytes of hyperthyroid patients (7). Therefore, to assess the involvement of GLUT3 in the T3 effects just described, we have used wild-type L6 cells. Our data showed that T3 increased total GLUT3 content; however, it did not alter the amount of GLUT3 at the PM; this supports the hypothesis that T3 increased glucose uptake independently of GLUT translocation.
In summary, T3 stimulates glucose uptake into muscle cells within 30 minutes via nongenomic mechanisms and without any gain in surface GLUT4, GLUT1, or GLUT3. Moreover, T3 itself enhances, as well as has an additive effect, on insulin action on glucose transport into cells, reinforcing data from the literature (37,38). Beyond 30 minutes, the stimulation of glucose uptake by T3 may also result from GLUT4 translocation to the cell membrane. The fact that glucose uptake induced by T3 was only observed in L6-GLUT4myc, but not in L6-GLUT1myc cells, strongly indicates that GLUT4 is involved in this effect. We hypothesize that T3-induced glucose transport might depend on conformational changes that could lead to enhancement of GLUT4 activity.
Footnotes
Acknowledgments
F.G.S. and S.S.T. are the recipients of the Fundação de Amparo à Pesquisa do Estado de São Paulo (FAPESP: 08/56446-9 and 2006/52830-3, respectively) fellowships. M.T.N. is the recipient of Conselho Nacional de Pesquisa e Desenvolvimento (CNPq) fellowship, Brazil. This work was supported in part by grant MT 12601 from the Canadian Institutes of Health to A.K.
Disclosure Statement
The authors declare that no competing financial interests exist.