
Abstract
Background:
Two recent genome-wide association studies (GWASs) identified five single nucleotide polymorphisms (SNPs; rs965513, rs944289, rs966423, rs2439302, and rs116909374) associated with papillary thyroid carcinoma (PTC). Each variant showed highly significant but moderate to low disease risk. Here we assessed the cumulative risk and predictive value of the five SNPs.
Methods:
We genotyped two cohorts of individuals, 747 PTC cases and 1047 controls from Ohio and 1795 PTC cases and 2090 controls from Poland. Cumulative genetic risk scores were calculated using unweighted and weighted approaches.
Results:
All five SNPs showed significant association with PTC. The average cumulative risk score in cases was significantly higher than in controls (p<2.2×10⁻¹⁶). Each additional risk allele increased the risk of having PTC by 1.51 [95% confidence interval (CI) 1.4, 1.64] in Ohio and by 1.35 [95% CI 1.27, 1.44] in Poland. An analysis was performed weighing risk alleles by effect size and assigning individuals to three weighted risk score groups, low (≤2), medium (2–5), and high (>5). Individuals in the high group were significantly more susceptible to PTC compared with individuals in the low group with an odds ratio of 8.7 [95% CI 5.8, 13.3] in Ohio and 4.24 [95% CI 3.10, 5.84] in Poland. Almost identical results were obtained when follicular variant PTCs and microPTCs were omitted. These five SNPs explained 11% of the familial risk of thyroid cancer in the Ohio cohort and 6% in the Polish cohort.
Conclusion:
As the genetic risk score increases, the risk of having PTC increases. However, the predictive power of the cumulative effect of these five variants is only moderately high and clinical use may not be feasible until more variants are detected.
Introduction
I
The most common form of thyroid cancer, papillary thyroid carcinoma (PTC) accounts for 80%–85% of all thyroid cancers. Several large case–control studies unequivocally suggest that familial occurrence of PTC is common, in fact, one of the highest of all cancers (1 –4). Remarkably, in spite of this, only a few predisposing mutations have been convincingly demonstrated (5 –9). This suggests that easy-to-find high-penetrance mutations probably do not exist or are rare. In contrast, accumulating evidence from other malignancies (10 –12) and multifactorial diseases and traits (13 –16) suggests that the genetic predisposition often consists of a multitude of low-penetrance alleles (16,17). The first few years of GWASs appear to have amply confirmed this assumption. However, interestingly, clinical and predictive use of these findings has been slow to occur (18 –21).
In this study we asked what predictive powers might already be available as a result of two GWASs in PTC. We studied the predictive value of the five markers detected in two recently published GWASs (22,23). We found that the combined use of the genotypes of these markers shows definite promise as a predictive tool, but that more markers are probably needed before genotyping of markers for PTC can become a routinely applied method in clinical practice.
Materials and Methods
Subjects
All studies were approved by the Institutional Review Boards at The Ohio State University Medical Center (OSUMC), Maria Sklodowska-Curie Memorial Cancer Center and Institute of Oncology, and Medical University of Warsaw, Poland. All subjects gave written informed consent before participation.
Ohio cases (n=747) involved individuals with thyroid cancer enrolled in the Ohio State University Wexner Medical Center's (OSUWMC) endocrine neoplasia repository, a large data and bio-repository of individuals with thyroid neoplasia. Individuals were recruited from a multidisciplinary thyroid tumor clinic at OSUWMC, and all cases were histologically confirmed as PTC (including traditional PTC, follicular variant PTC [FVPTC], and microPTC). Ohio control samples (n=1047) were provided by the OSUWMC's Human Genetics Sample Bank. The Columbus Area Controls Sample Bank is a collection of control samples for use in human genetics research that includes anonymized biological specimens and linked phenotypic data. Recruitment takes place in OSUWMC primary care and internal medicine clinics. All patients representing cases and controls provide written informed consent; complete a questionnaire that includes demographic, medical, and family history information; and donate a blood sample. Relevant clinicopathological data for cases were extracted from the electronic medical record. Polish case patients (n=1795) were recruited from thyroid cancer patients from all over Poland and treated at the Medical University of Warsaw and Maria Sklodowska-Curie Memorial Cancer Center and Institute of Oncology in Warsaw, Poland. All cases were histologically confirmed as PTC (including traditional PTC and rare variants). Polish control samples (n=2090) were provided by the Department of Medical Genetics, Medical University of Warsaw and consisted of consenting volunteers. The controls chosen for this study in both cohorts reported no thyroid disease. Demographic information for all cases and controls can be found in Table 1.
The p-values were obtained by applying permutation tests to compare age and chi-square tests to compare sex.
PTC, papillary thyroid carcinoma; SD, standard deviation.
DNA extraction and SNP genotyping
For both cases and controls, germline DNA from blood samples was extracted by a standard phenol–chloroform procedure. To genotype the five selected SNPs, SNaPshot assay (ABI) was used in the Ohio samples as described (24).
The Sequenom genotyping technology (Sequenom) was used for the Polish samples. For each sample, 20 ng of genomic DNA was genotyped using iPLEX Gold system. Primers and probes for the analysis were designed using MassARRAY® Assay Design v3.1. Data were visualized and analyzed in MassARRAY Typer Viewer v4.0.24. All oligonucleotides used in the study were ordered and purchased from Integrated DNA Technologies Inc.
Cumulative genetic risk score
For each SNP, the genotypes were coded as 0, 1, or 2 indicating the number of PTC risk alleles in the genotype. Cumulative genetic risk scores were calculated in two ways, using unweighted and weighted approaches. For the unweighted method, the cumulative genetic risk score (CGRS) of an individual is simply the total count of disease alleles from five SNPs obtained by adding coded genotypes (possible score range of 0–10). Weighted CGRS (wCGRS) denotes the sum of the weighted disease allele counts weighted by logarithm odds ratio, log(OR), of each SNP and scaled by a scaling factor of 5/(w 1+w 2+w 3+w 4+w 5) to make the range of CGRS and wCGRS comparable (25), where wi =log(OR) for the ith SNP, i=1 to 5. To avoid any bias due to missing data, samples with one or more missing genotypes were not included in the genetic risk score calculations. For the unweighted and weighted genetic score analysis, genotypes from 605 cases and 916 controls from Ohio and 1633 cases and 1663 controls from Poland were available.
Statistical analysis
Statistical analyses were performed using the R software package (
Effect sizes and the strength of association of each disease allele adjusting for the age and sex differences were obtained by applying multivariate logistic regression analysis, assuming a multiplicative allelic model. Pair-wise SNP interaction analysis was performed under a multiplicative model using logistic regression and likelihood ratio tests.
Distributions of genetic risk scores between PTC cases and controls were compared by applying nonparametric Mann–Whitney test. Moreover, a permutation test was applied to compare average genetic scores between cases and controls. The effect of genetic risk scores on PTC was tested by using multivariate logistic regression analysis adjusting for age and sex. Statistical analysis of genetic scores was performed using both unweighted and weighted cumulative genetic scores separately.
The familial relative risk of PTC attributable to a given SNP is calculated by the formula (26
–28)
where P is the population frequency of the disease allele, Q=1−P, and r 1 and r 2 are the relative risks (estimated by odds ratios) for heterozygotes and rare homozygotes, relative to common homozygotes. Assuming a multiplicative interaction, the proportion of the familial risk attributable to the SNP is calculated by log(λ*)/log(λ0), where λ0 is the overall familial relative risk (27,28), estimated to be 8.48 for thyroid cancer (1).
To evaluate and compare classifying power of the logistic regression model with unweighted or weighted cumulative genetic risk scores, receiver–operator characteristic (ROC) curves and the area under the curves (AUC) were determined. Since there was a significant difference in age and sex between cases and controls, equal numbers of age- and sex-matched random samples from available cases and controls were selected for the ROC analysis.
Results
Association of each of the five SNPs with PTC risk was confirmed in Ohio and Poland populations
Demographic characteristics of the two cohorts are shown in Table 1 (747 cases/1047 controls from Ohio; 1795 cases/2090 controls from central Poland). Ages are reported as age at diagnosis of PTC in the cases, and as age at blood draw in controls. Controls were significantly older than cases (p<2.2×10⁻¹⁶) in the Ohio cohort and younger than cases (p<2.2×10⁻¹⁶) in the Polish cohort. A statistically significant sex difference, having more females among the cases, also occurred between cases and controls in both cohorts (Ohio, p=0.0006; Poland, p<2.2×10⁻¹⁶). The frequencies of each variant did not show significant difference between males and females (Supplementary Table S1; Supplementary Data are available online at
Age- and sex-adjusted odds ratios (OR) and 95% confidence intervals (CIs) were obtained (Table 2) by assuming a multiplicative model. The SNPs, rs965513, rs944289, rs966423, rs2439302, and rs116909374 showed significant association with susceptibility to PTC in the Ohio population with effect sizes [and 95% CI] of 2.09 [1.80, 2.42], 1.25 [1.08, 1.46], 1.30 [1.12, 1.51], 1.46 [1.26, 1.70], and 2.28 [1.57, 3.36], respectively, with p-value <0.005. In the Polish data, all five SNPs showed association at the 0.05 significance level with effect sizes [and 95% CI] of 1.81 [1.59, 2.06], 1.22 [1.09, 1.38], 1.14 [1.01, 1.29], 1.23 [1.09, 1.38], and 1.66 [1.13, 2.44], respectively (Table 2). Of the Ohio samples ∼350 cases and ∼380 controls occurred both in this study and the GWASs (22,23). These cases were not used when allele frequencies and ORs were compared between the studies (Table 2).
Allelic odds ratios (ORs) with 95% confidence intervals [95% CIs] and p-values, obtained by applying multivariate logistic regression adjusting for age and sex. Derived ORs were used for the weighted risk score analysis.
Ohio cohort used for the validation.
Ohio cohort that contains Ohio samples from the validation cohort (b) and from previous genome-wide association studies (22,23).
SNP, single nucleotide polymorphism.
Cumulative effect of the 5 SNPs
The average (±SD) of cumulative risk scores (CGRS) among OSU cases (4.46±1.47) was significantly higher than controls (3.61±1.42), with a permutation p-value <2.2×10⁻¹⁶ comparing the two groups (Fig. 1A). The average weighted score (wCGRS) of cases (3.68±1.32) in the Ohio cohort was significantly higher than in controls (2.77±1.46), p-value <2.2×10⁻¹⁶. The distribution of wCGRS in cases showed a significant shift towards higher values compared to controls with Mann–Whitney test p-value <2.2×10⁻¹⁶ (Fig. 1B). The Polish data followed a similar pattern, possessing a higher average of CGRS in cases (4.24±1.44) compared to controls (3.70±1.42), p-value <2.2×10⁻¹⁶ (Fig. 1C). The average wCGRS of Polish cases (3.57±1.5) was significantly higher compared to Polish controls (3.0±1.44) p-value <2.2×10⁻¹⁶, and there was a significant shift of wCGRS distribution of the cases to the right with a Mann-Whitney p-value <2.2×10⁻¹⁶ (Fig. 1D).
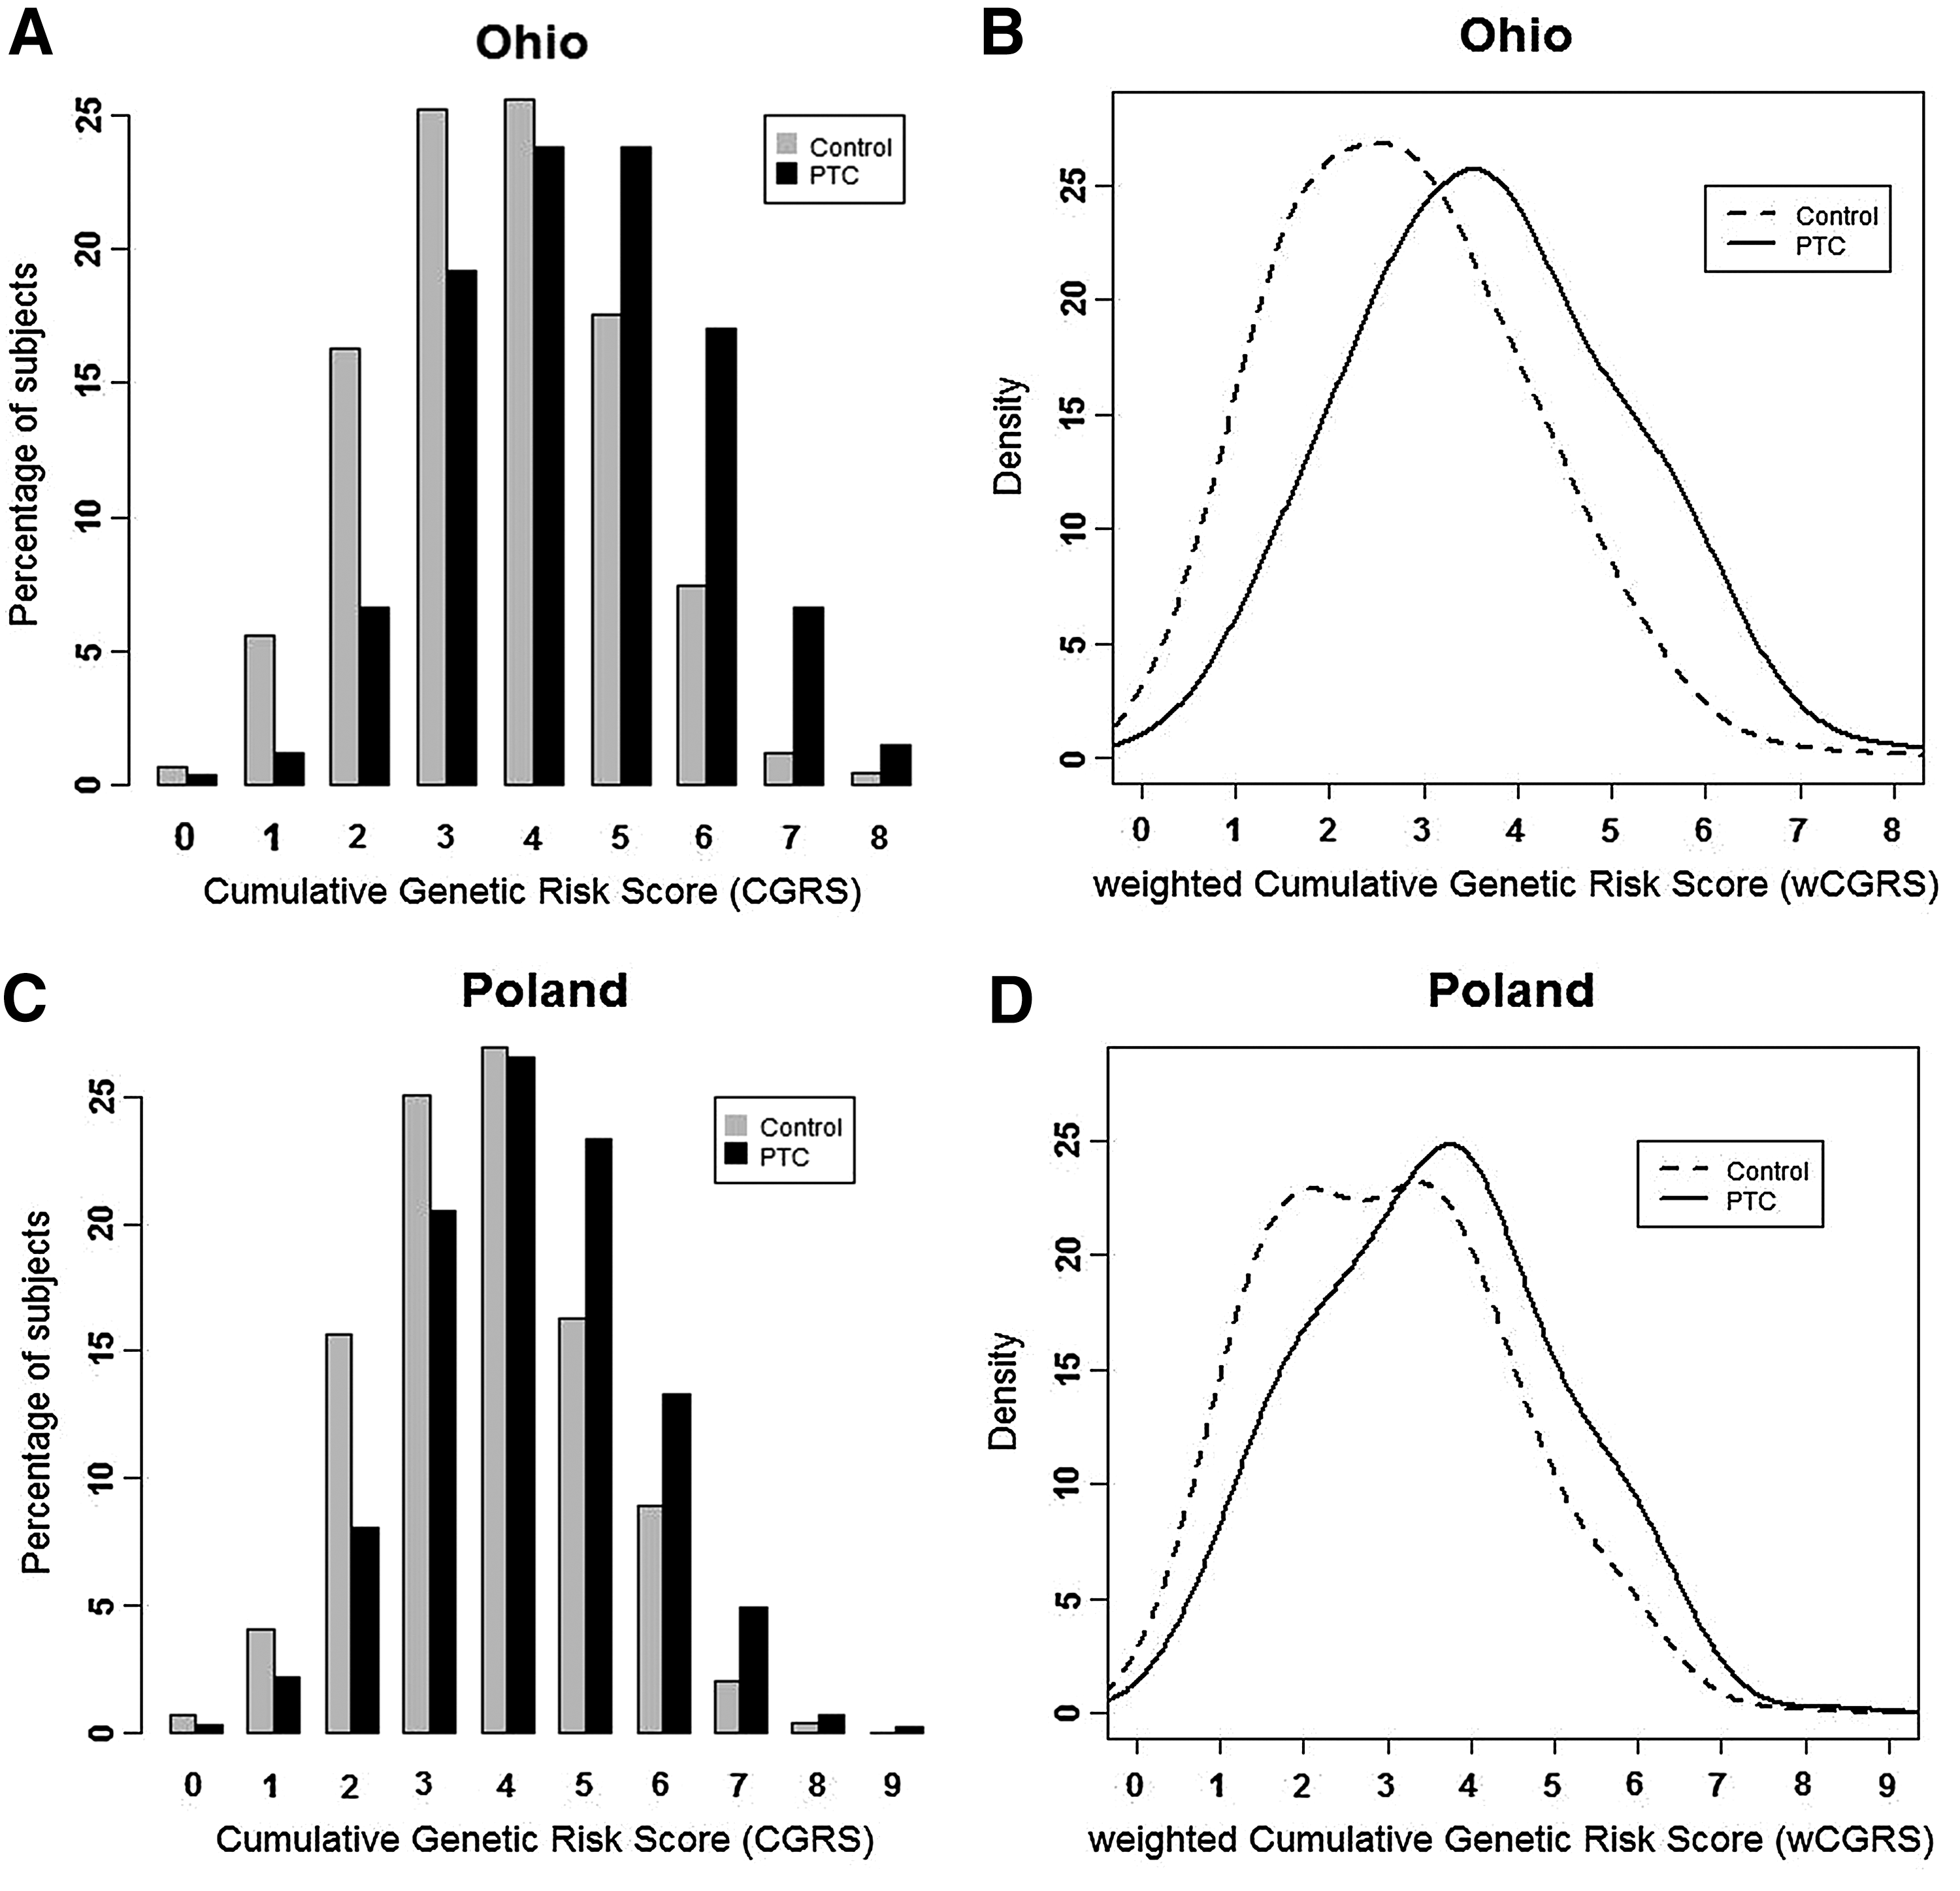
Cumulative risk scores in Ohio and Polish cohorts.
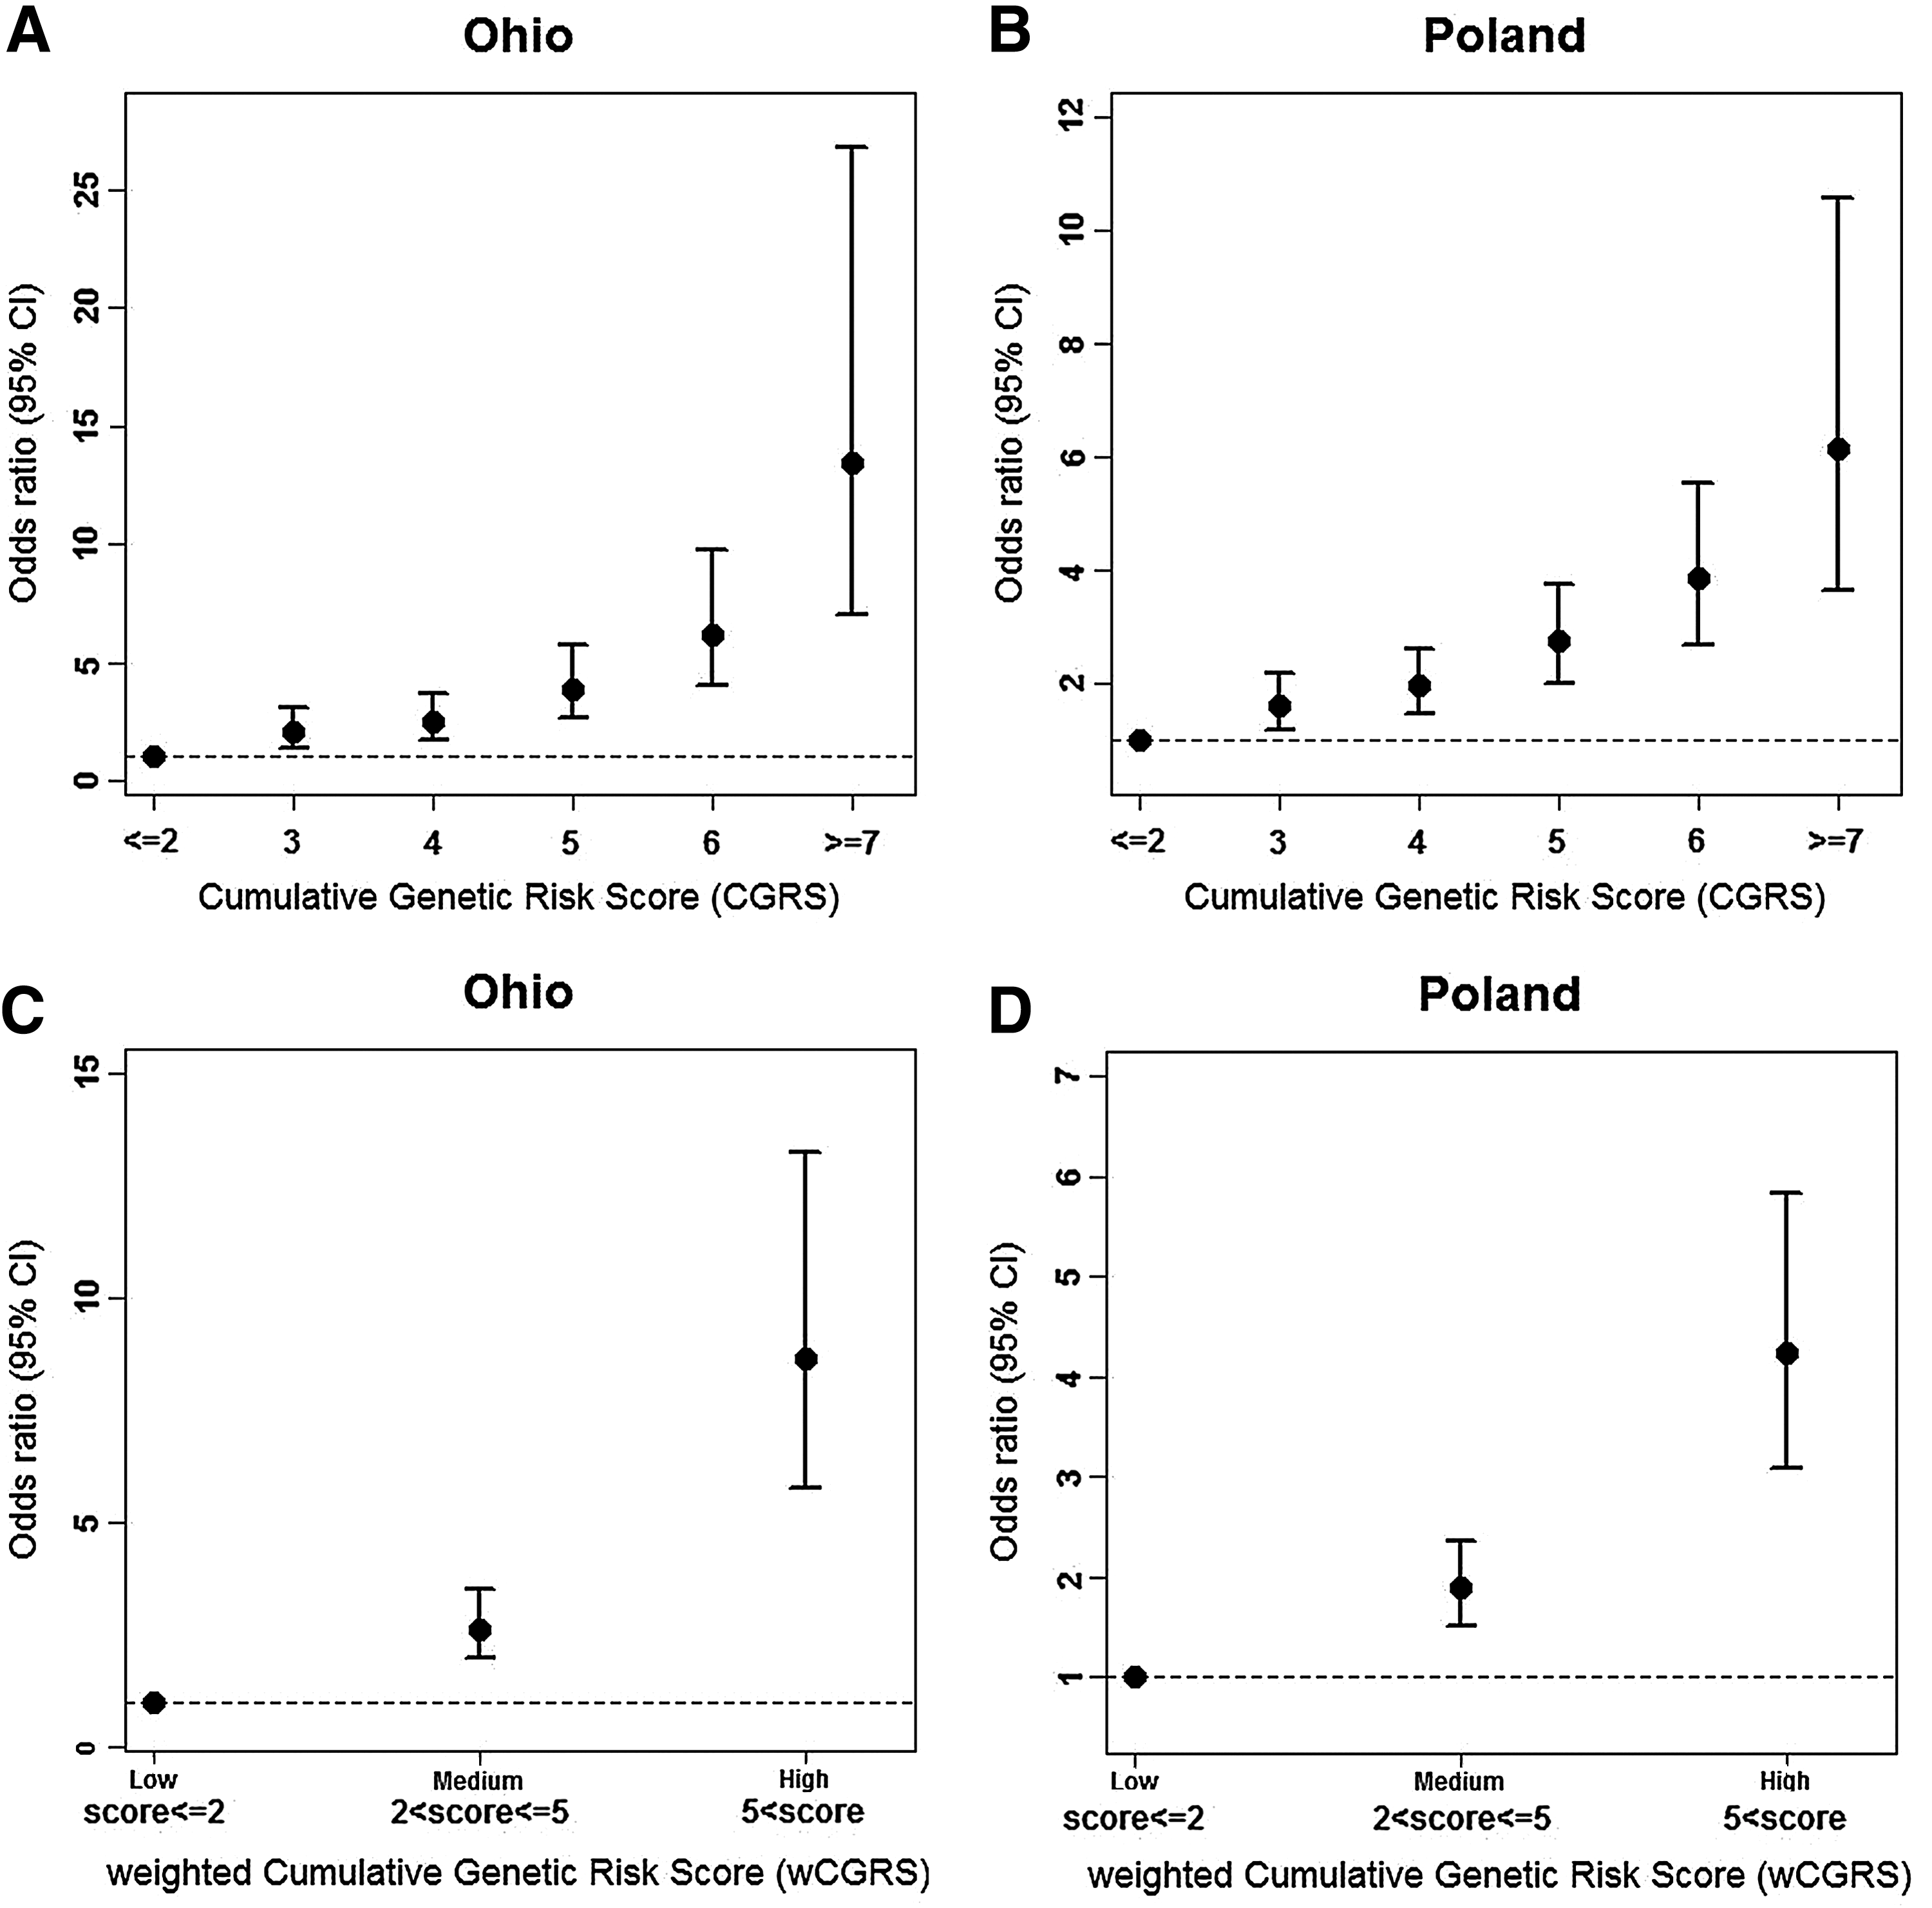
Each additional risk allele increased the odds of the disease by 1.51 [95% CI 1.40, 1.64] in Ohio and 1.35 [95% CI 1.26, 1.44] in the Polish cohort. Both cohorts provided evidence to support that having an additional disease allele increases the odds of having the disease significantly (p-value <2.2×10⁻¹⁶). As the CGRS increased, the odds ratio increased in both cohorts (Table 3). A positive trend in OR compared to the reference group and their 95% CIs is shown in Fig. 2A for Ohio and in Fig. 2B for Poland. As can be seen, in the presence of seven or more risk alleles, the ORs were as high as 13 and 6, respectively.
Age- and sex-adjusted OR and their 95% CI for the CGRSs
The OR with 95% confidence interval [95% CI] and p-values, obtained by applying multivariate logistic regression adjusting for age and sex. CGRS≤2 is used as the reference group.
Individuals were grouped into three categories according to the weighted risk scores, low (wCGRS≤2), medium (2<wCGRS≤5), and high (wCGRS>5). The effect sizes of the medium and high groups were estimated by taking the low group as reference (Figs. 2C, 2D). Individuals in the high group were significantly more susceptible to PTC compared to individuals in the low group, with an odds ratio of 8.7 [95% CI 5.8, 13.3] in the Ohio cohort and 4.24 [95% CI 3.10, 5.84] in the Polish cohort.
Moreover we estimated (see
Predictive power of the genetic risk scores
To assess the predictive power of genetic risk score models we applied ROC analysis. To eliminate the effect of the age and sex differences between cases and controls, age- and sex-matched samples were randomly selected from both cohorts. The resulting cohorts comprised a total of 1182 cases and controls from OSU and 1408 cases and controls from Poland. ROC curves and the AUC for the unweighted and weighted genetic scores are provided in Fig. 3A for the OSU samples and Fig. 3B for the Polish samples. The AUC in the models with CGRS and wCGRS are 71% and 72.4% in the OSU cohort and 60.8% and 62.1% in the Polish cohort, both cohorts providing improved models with weighted compared to unweighted scores. Family history information was included in the model for OSU cohort but not available for the Polish cohort.
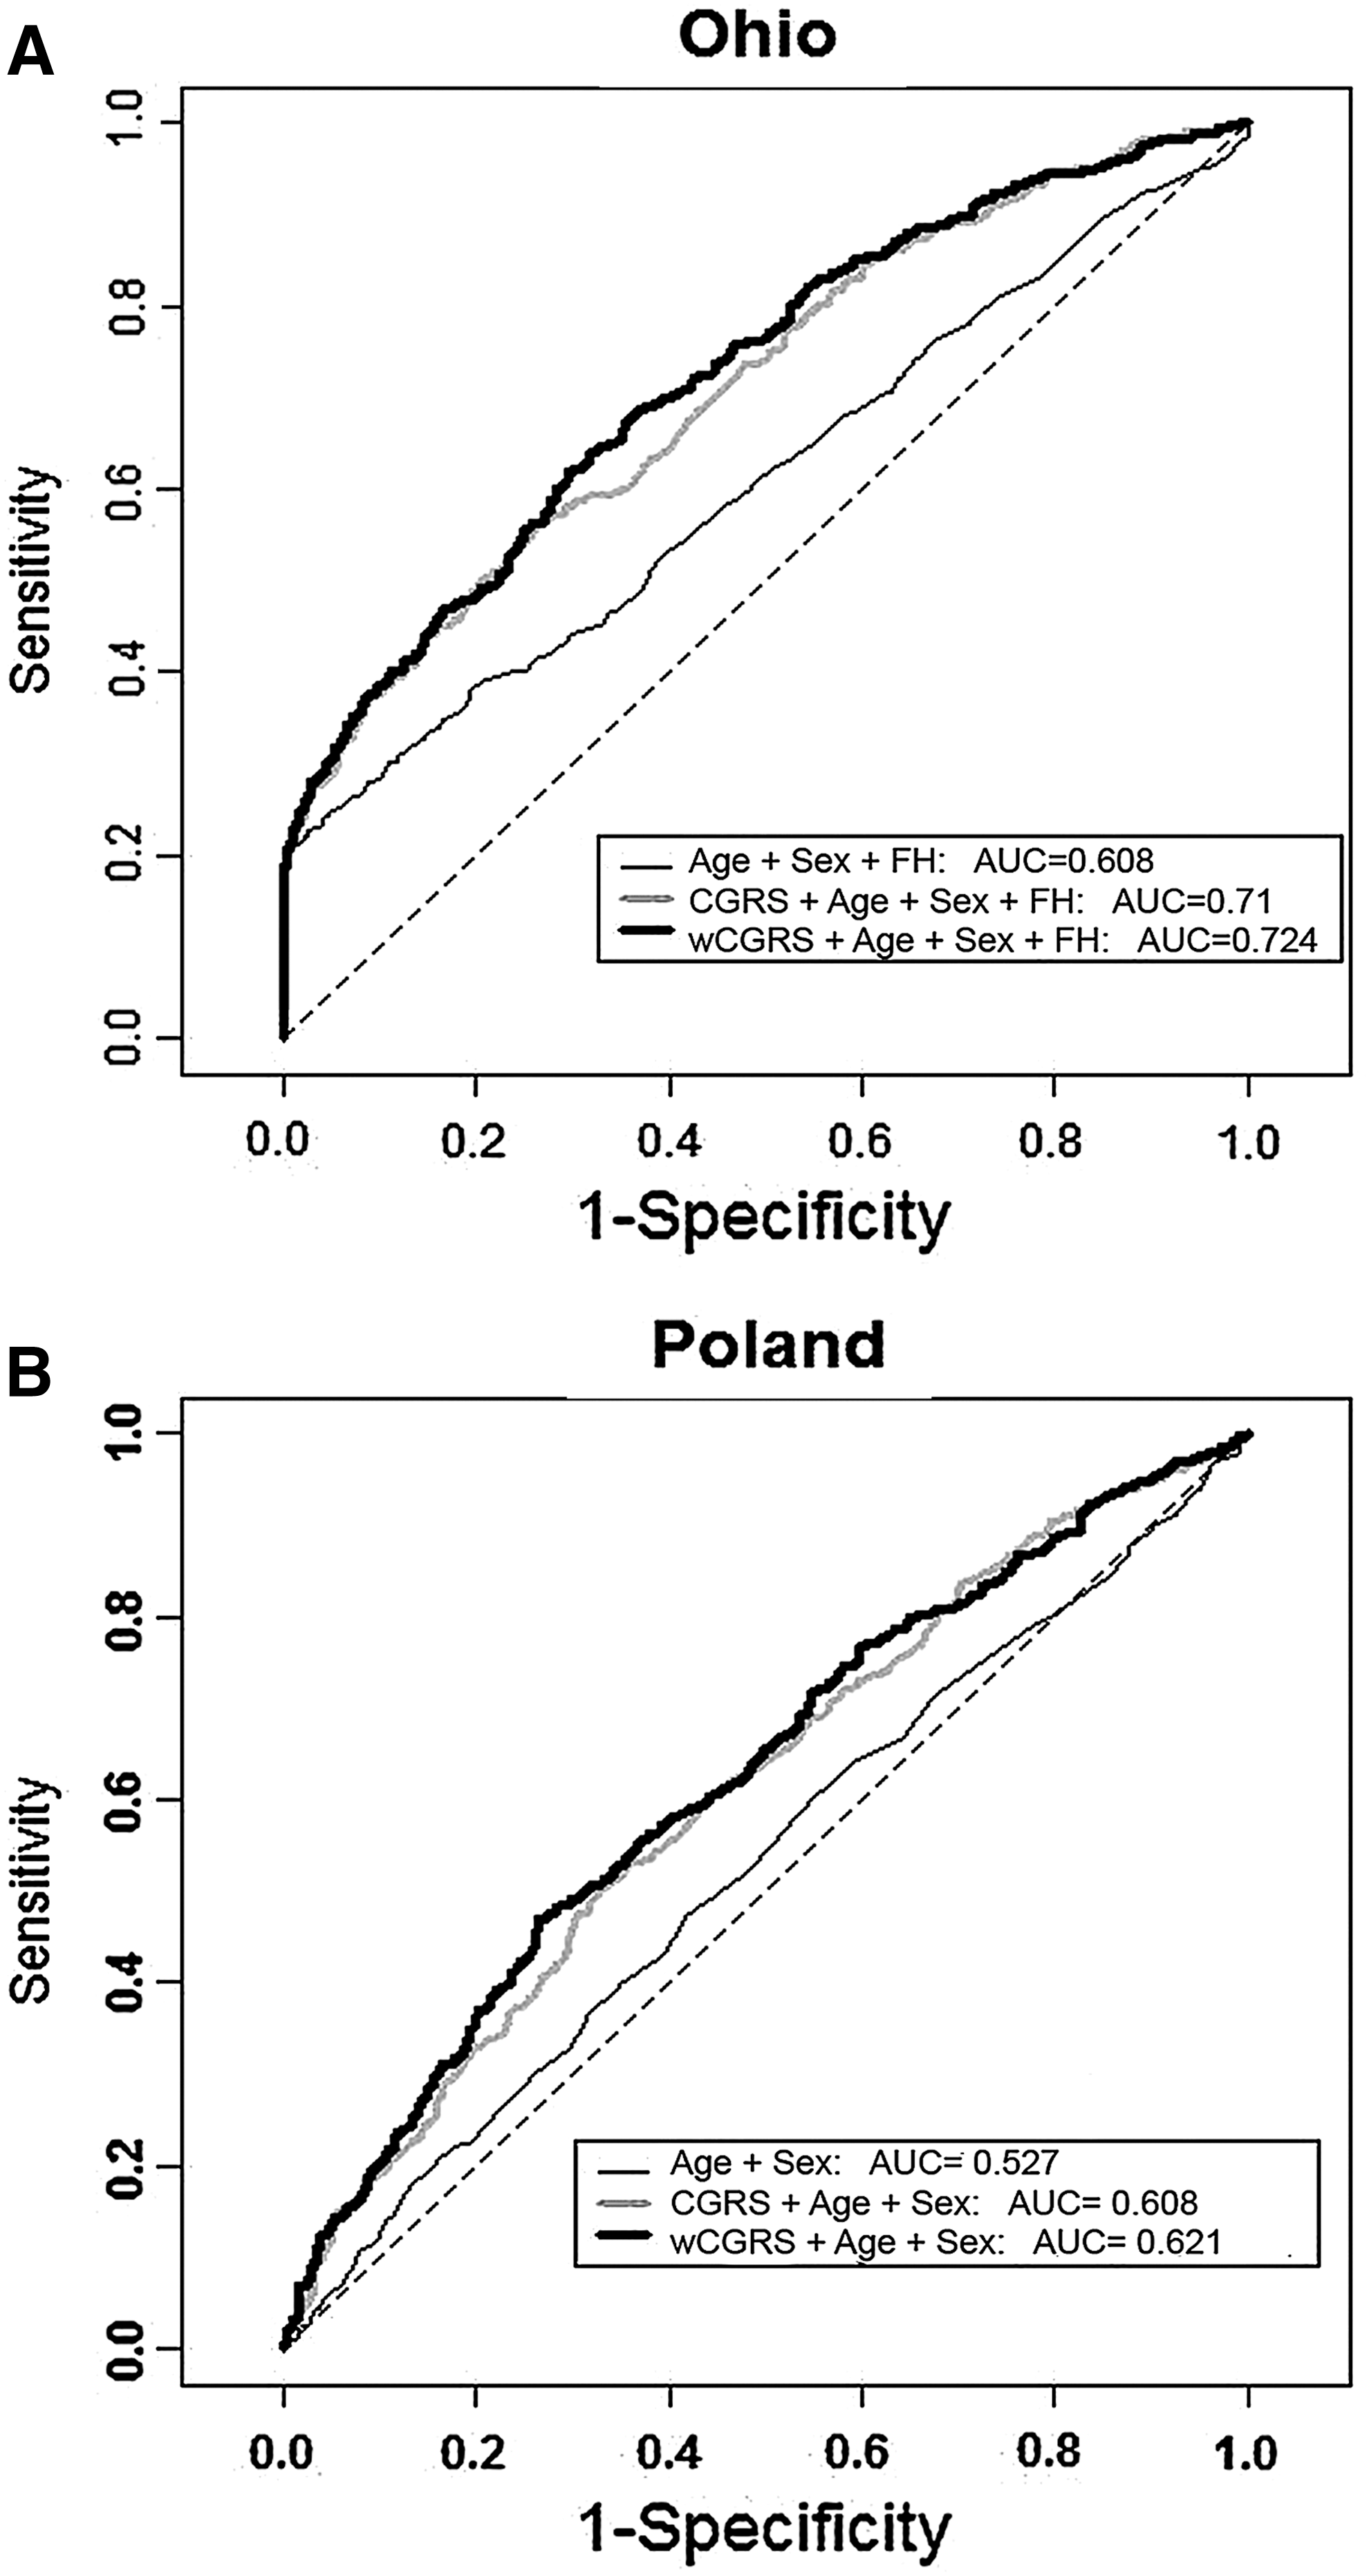
ROC curves. Receiver–operator characteristic (ROC) curves assessing the discriminative power of the unweighted and weighted cumulative genetic risk score models. A random sample of age- and sex-matched cases and controls was used for each analysis.
Inclusion of FVPTC and microPTC had no impact on the cumulative risk assessment
A portion of the cases were diagnosed as FVPTC (n=154 in Ohio and n=172 in Poland). We performed an independent association analysis and calculation of the cumulative risks by excluding these FVPTC cases and obtained very similar results (Supplementary Figs. S1–S3 and Supplementary Tables S2 and S3). A portion of the cases were classified as microPTC (n=118) in the Ohio cohort, but not in the Polish cohort. We performed a similar analysis in the Ohio cohort after exclusion of the microPTC cases. The results were essentially the same (Supplementary Figs. S4–S6 and Supplementary Tables S4 and S5). Thus, we propose that inclusion of FVPTC or microPTC cases did not have an undue influence on the results.
Discussion
It is becoming increasingly clear that the genetic predisposition to common diseases is multifactorial, often resulting from multiple low-penetrance variants. The bulk of information comes from GWASs. The effects of SNPs and other variants implicated in these studies are typically not yet biologically understood, but their predictive values are backed by highly significant statistics. This is the case in our study too. Of the five markers under study, one (rs944289) is well characterized in that it interferes with the transcription of a novel long intergenic noncoding RNA (lincRNAs) gene that appears to act as a tumor suppressor (7). Of the remaining four markers, two (rs966423 and rs2439302) are located in introns of coding genes, but mechanistic data are not yet available. The same is true of the remaining two SNPs, which are both intergenic (22,23). The object of this study was twofold; first, to validate the predictive value of five markers, and second, to assess the additive nature of the markers in prediction. Both aims were in fact amply fulfilled. It should be noted that all results pertain only to individuals of Caucasian, mostly Central European, descent.
PTC differs from many other cancers in several respects. Case–control studies suggest very strong familiality; according to some studies, familiality ratios are among the highest if not the highest of all cancers (1,3,4,29,30). However case–control studies ignore the fact that the environment is shared by most family members. The true heritability of PTC, as defined by twin studies, for example, has not been decisively determined (31). Unknown environmental factors could contribute significantly to the high familiality. The fact that the incidence of PTC is rising (32,33), certainly suggests an important role for changes in detection or environmental factors.
As stated in the Introduction, only a few genes or candidate genes have so far been detected in PTC even though several researchers have done extensive linkage analyses and analyzed functionally plausible candidate genes (34 –39). All of these facts are compatible with the genetic predisposition to PTC being multifactorial and mostly of low penetrance. Our study supports this contention in several ways. Importantly, our data confirm the published GWAS findings in that all five SNPs studied displayed odds ratios similar to those reported previously (22,23). The two cohorts we studied were concordant, even though the odds ratios were overall lower in the Polish cohort than in the Ohio cohort. This might be due to many factors, perhaps most likely genuine biological differences between the populations, unknown environmental factors, or subtle differences in the diagnostic criteria. However, the difference could theoretically be related to the age of the studied cohorts; for example, in Ohio the cases were younger (mean 39.5 years) than the controls (46.9 years). Therefore the odds ratios were calculated after proper adjustment for age.
A comparison of our results with similar data from other cancers shows a general concordance in that most published studies of other cancers have documented an additive effect of risk markers. For instance, in a study of seven low penetrance breast cancer variants, ORs in women with the highest numbers of risk alleles rose to 8.69 and the measure of discriminative ability or AUC rose from 0.665 to 0.693 when the genetic risk score information was added to the model with conventional risk factors (10). In a breast cancer study, the AUC rose from 0.63 to 0.667 when genotype data from five markers were added to conventional risk data (11). In comparison, in our study the weighted AUCs were as high as 0.724 (Ohio) and 0.621 (Poland) based on the five SNPs alone. These data suggest that PTC low-penetrance risk alleles play a significant role. This is also evident from data on colorectal cancer, a disease with several well-known high-penetrance predisposing genes. In a study of conventional risk factors and 10 low-penetrance risk loci, the AUC for both combined was 0.59 and for the low-penetrance markers alone, 0.57 (12). The practicality of identifying a subgroup of individuals with defined absolute risk was considered by the authors who nevertheless stated that genotype data in addition to conventional risk data are not currently good enough for individualized risk prediction.
The ultimate goal of our efforts is to provide predictions that are significant enough to be used in counseling or even to inform the clinical handling of PTC patients and their relatives, as well as other individuals being evaluated for thyroid cancer risk. We surmise that this point has not been reached with the available markers. At the same time, the observed rise in overall risk with each additional risk allele makes us view the future with some optimism. For instance, by simply counting the number of risk alleles at five loci we showed that in people with seven or more risk alleles, the OR was as high as 13 in the Ohio cohort, a value that is already remarkably high. We reason that more markers will be detected. Indeed we show here that the five SNPs under study accounted for just 11% of the familial risk of thyroid cancer in Ohio, emphasizing that much remains to be discovered. We tentatively predict that this will indeed allow us to handle PTC risk assessment and intervention in a more accurate and informative way than presently.
Footnotes
Acknowledgments
The authors thank the OSU Comprehensive Cancer Center (OSUCCC) Microarray Shared Resource for SNP genotyping with SNaPshot assay and the University of Chicago Comprehensive Cancer Center DNA Sequencing & Genotyping Facility for Sequenom genotyping. This work was supported by National Cancer Institute Grants P30CA16058, P01CA124570, Polish National Science Center Grant NN401584838, and Foundation for Polish Science FOCUS Grant. W.G. and K.J. are supported by the TEAM Programme, co-financed by the Foundation for Polish Science and the European Union European Regional Development Fund.
Author Disclosure Statement
M.D.R. has previously been on a clinical advisory board for Veracyte. All other authors declare no potential conflicts of interest.