
Abstract
Background:
Cell-based bioassays for functional thyroid stimulating autoantibodies (TSAb) are sensitive diagnostic tools. However, there is no bioassay available that is standardized with international reference material. We aimed to promote the standardization of the test results among laboratories that perform TSAb bioassays and calibrate TSAb levels against the second international standard (IS) 08/204 from the National Institute for Biological Standards and Control (NIBSC).
Methods:
Serum TSAb activity was measured with a FDA-cleared bioassay that utilizes CHO cells expressing a chimeric thyrotropin receptor (TSHR) and a c-AMP response-element-dependent luciferase. The IS was applied for calibration. TSAb results were reported as percentage of specimen-to-reference ratio (SRR%) and converted into mIU/L.
Results:
The IS dose–response curve was obtained using concentrations from 0.3125 to 200 mIU/L. Mean TSAb SRR%±standard deviation (SD) values for the IS concentrations 0.3125, 0.625, 1.25, 2.5, 5, 10, 20, 40, 60, 80, 100, 120, 160, and 200 mIU/L were 63±4 (CV 6.3%), 63±4 (6.3), 67±2 (3.0), 76±6 (7.9), 91±8 (8), 134±8 (5.9), 201±13 (6.5), 294±12 (4.1), 336±10 (3.0), 348±8 (2.3), 360±14 (3.8), 371±15 (4.0), 381±9 (2.4), and 389±10 (2.6), respectively. A total of 127 dilution experiments were performed using 12 high TSAb-positive sera from patients with Graves' disease. When diluting TSAb-positive sera, IS concentrations within the linear range 5, 10, 20, 40, and 80 mIU/L were used for the calibration curve. All standard curves had R 2 values >0.95. Low coefficient of variation (CV %) values for the IS calibration curve (4–6%) were obtained. Compared to bovine TSH, no significant differences were noted using either a pool of healthy donors or a normal serum as reference controls. The average IU measured value for the assay cutoff (SRR 140%) corresponded to 9.54±1.68 mIU/L, and clinical application was shown in 60 Graves' patients.
Conclusions:
The TSAb bioassay demonstrated excellent performance in terms of linear range, limit of quantitation, and imprecision. The dilution experiments showed a high correlation coefficient and excellent reproducibility. Thus, TSAb levels can be reliably converted from SRR% to IU/L. These results offer the perspective of standardizing TSAb levels among laboratories and enable more accurate comparison of TSAb studies.
Introduction
A
The calibration of a bioassay system requires calibrators that can be used to create standard curves for the determination of the TSAb concentration in patient sera. In 1995, the first international standard (IS) preparation for TSAb (preparation code 90/672, 0.1 IU per ampoule) was established by the World Health Organization (WHO) Expert Committee on Biological Standardization (ECBS), which consisted of freeze-dried plasma proteins from a single human patient with high TSAb values. The first IS has been used for the calibration of binding assays measuring anti-TSHR autoantibodies in human serum (20 –22). Due to several limitations, the first IS was replaced 2006 by a TSHR stimulating human monoclonal autoantibody (mAb), M22, which was isolated using lymphocytes from a patient with GD (23,24). To date, there is no cell-based bioassay available that has been standardized with international reference material.
The present study aimed to evaluate the feasibility of making a TSAb assay truly quantitative by calibrating it against TSAb IS material. This would promote standardization of the test results among laboratories that perform TSAb bioassays in future studies. Therefore, TSAb sera levels were calibrated against the second IS 08/204 from the National Institute for Biological Standards and Control (NIBSC) using a FDA-cleared TSAb bioassay.
Materials and Methods
Serum TSAb activity was measured with the Thyretain® bioassay (Quidel, San Diego, CA) according to the manufacturer's instructions (25). Briefly, TSAb levels were measured in triplicate with the Infinite M200 microplate reader (Tecan, Crailsheim, Germany). The results were reported as percentage of specimen-to reference ratio (SRR%) and converted into mIU/L. SRR% values were calculated according to the following formula: SRR%=average TSAb specimen relative light units (RLU)/average reference standard (bovine TSH) RLU×100. All data were analyzed using Graph Pad Prism software v5.04.
Analytical performance
Limits of blank, detection, and quantitation
The limits of blank (LoB), detection (LoD), and quantitation (LoQ) were determined according to the Clinical and Laboratory Standards Institute (CLSI) approved guideline EP-17A (26). The LoB was measured 40 times in duplicate with 1:11 diluted normal serum. The LoD was measured using IS concentrations from 0.3125 to 10 mIU/L. Each IS concentration was measured 40 times in duplicate. The LoQ was defined as the lowest IS concentration that could be reliably repeated with an imprecision of <20%. LoQ could be at the same or higher concentration than LoD in accordance with the following weighting: LoB<LoD≤LoQ.
Intra- and interassay precision
To determine the precision of the TSAb bioassay, 10 dilutions of a high TSAb positive serum sample from a patient with GD were measured according to the CLSI Precision Performance Guideline EP05-A2 (27). Each sample was measured in triplicate. A total of 40 μL of the patient serum sample (# 5517) was diluted in 400 μL of reaction buffer (RB) and was subsequently serially diluted 1:2 in normal serum that was diluted 1:11 in RB. The dilutions from 1:704 to 1:360,448 were tested in the assay. Four IS concentration points (10, 20, 40, and 80 mIU/L) in the linear range were additionally run on the same plate. The dilution series for the patient sample and the IS concentrations were prepared fresh each day. Precision was assessed by one user and two plates were repeated within the same day over 20 consecutive days. Interassay precision was defined as the CV% (CV%=standard deviation RLU specimen/mean RLU specimen) over the 20 days while intra-assay precision was defined as the CV% within the same day.
Standard curves
IS dose–response curve
The second IS for TSAb, M22 (NIBSC code 08/204, 113 mIU/Ampoule) (28), was dissolved in 2 mL phosphate buffered saline (PBS). The IS curve was generated using final concentrations of 0.3125–200 mIU/L. Each IS concentration was prepared in 1:11 diluted normal serum.
Bovine TSH dose–response curve
Bovine TSH (10 IU per vial; Sigma-Aldrich, St. Louis, MO) was dissolved in 5 mL water. The bTSH concentrations were diluted in 1:11 normal serum to yield final concentrations of 3.125–1600 mIU/L.
Patient sera
A total of 127 dilution experiments were performed with 12 high TSAb positive serum samples from patients with GD for the establishment of standard curves. In order to obtain results across the entire linear range, dilution steps were adjusted as necessary. The SRR% of the undiluted TSAb-positive serum were threefold the assay cutoff (140%) or higher.
Dose–response curves
A high TSAb positive serum sample (# 4239) was serially diluted twofold from 1:11 to 1:360,448. When diluting the patient sera, the IS concentrations 5, 10, 20, 40, and 80 mIU/L were used as a calibration curve on the same plate.
Conversion of TSAb SRR% into mIU/L
Serum TSAb SRR% levels of patients with GD were measured in triplicate by three users. Serum samples above the linear range, exhibiting TSAb levels >80 mIU/L, were further diluted using serial 1:2 dilution steps until they were in the linear range. The IS calibration standards (5, 10, 20, 40, and 80 mIU/L) and the dilutions of the GD serum were run in triplicate on the same plate. For both patient sera and for the IS, one dilution series was prepared for all users. For the conversion into mIU/L, TSAb SRR% values were added into the linear equation of the IS.
Results
Analytical performance
Limits of blank, detection, and quantitation
The TSAb results for the determination of LoB and LoD were normally distributed (Shapiro–Wilk test). Thus, LoB and LoD were calculated according to the following formulas: LoB=meanblank+1.645×standard deviation (SD) meanblank and LoD=LoB+1.645×SD low concentration sample. The LoB SRR% value is 60.9, whereby the average of all 80 blank measurements is SRR% 56 and the SD meanblank is 3%. The calculated LoD value is 80% and the SDlow concentration sample (5 mIU/L) is 11%. LoQ (CV=9.8%) is the same as LoD.
Intra- and interassay precision
The precision of the bioassay was evaluated using the IS and dilutions of a high TSAb serum as described in the Materials and Methods. Interassay precision data of the patient serum dilutions, mean TSAb SRR%±SD and CV% values, are summarized in Table 1. Mean TSAb SRR%±SD and CV% values for the interassay precision were for the IS concentrations 10 (121±16, 12.9%), 20 (203±23, 11.1%), 40 (332±34, 10.2%) and 80 mIU/L (407±41, 10.1%), respectively. Intra-assay precision test results were obtained by one user and two plates were repeated within the same day. Therefore, mean TSAb SRR%±SD and CV% values were for the dilutions 1:2816 (407±20.8, 5.1%), 1:5632 (315±9.0, 2.9%), 1:11,264 (203±10.2, 5.0%), 1:22,528 (128±11.1, 8.7%), and 1:45,056 (81±6.0, 7.4%), respectively.
SRR, specimen-to-reference ratio; SD, standard deviation; CV, coefficient of variation.
Standard curves
IS dose–response curve
Addition of the IS to the bioassay resulted in a concentration-dependent increase in the SRR% (Fig. 1). The half-maximal effective concentration (EC50) value was ∼25 mIU/L [confidence interval (CI) 23.42–25.83). Mean TSAb SRR%±SD values for the IS concentrations 0.3125, 0.625, 1.25, 2.5, 5, 10, 20, 40, 60, 80, 100, 120, 160, and 200 mIU/L were SRR% 63±4 (CV 6.3%), 63±4 (6.3), 67±2 (3.0), 76±6 (7.9), 91±8 (8), 134±8 (5.9), 201±13 (6.5), 294±12 (4.1), 336±10 (3.0), 348±8 (2.3), 360±14 (3.8), 371±15 (4.0), 381±9 (2.4), and 389±10 (2.6), respectively. The linear calibration curve for the IS was obtained between 5 and 80 mIU/L.
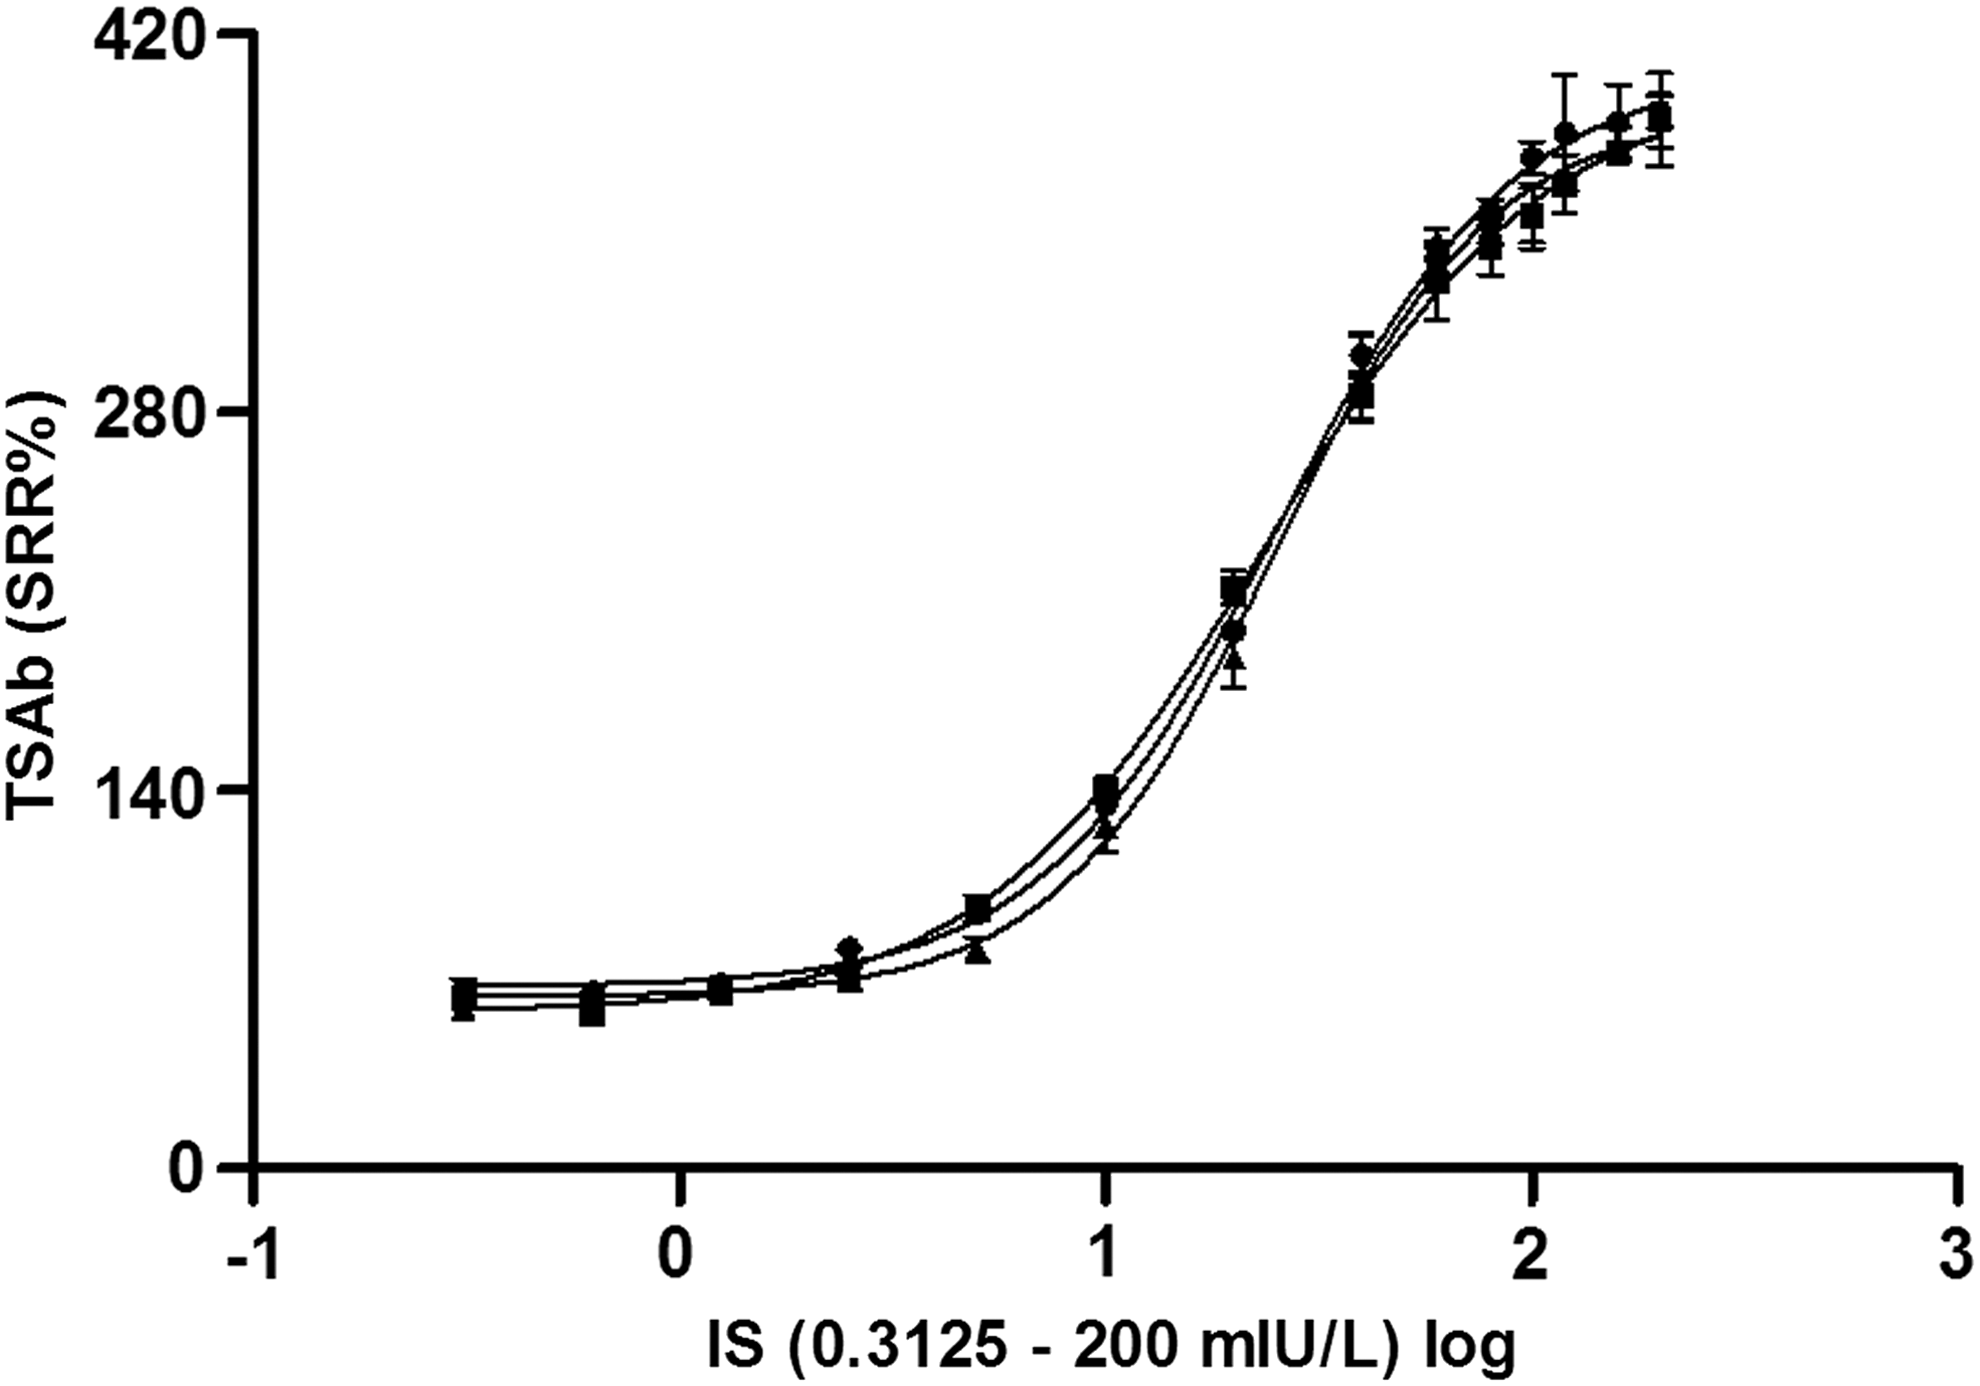
Dose–response curve of the second international standard for thyroid stimulating autoantibodies (TSAb; NIBSC code 08/204). The International Standard (IS) concentrations (mIU/L) from three runs are plotted on a logarithmic scale on the x-axis against the corresponding TSAb specimen-to-reference ratio (SRR%) values on the y-axis. The IS dose–response curves were repeated three times, and the averages of triplicate measurements±standard deviation (SD) for each standard concentration are shown.
Bovine TSH dose–response curve
Bovine TSH concentrations led to a dose-dependent increase in SRR% (Fig. 2).
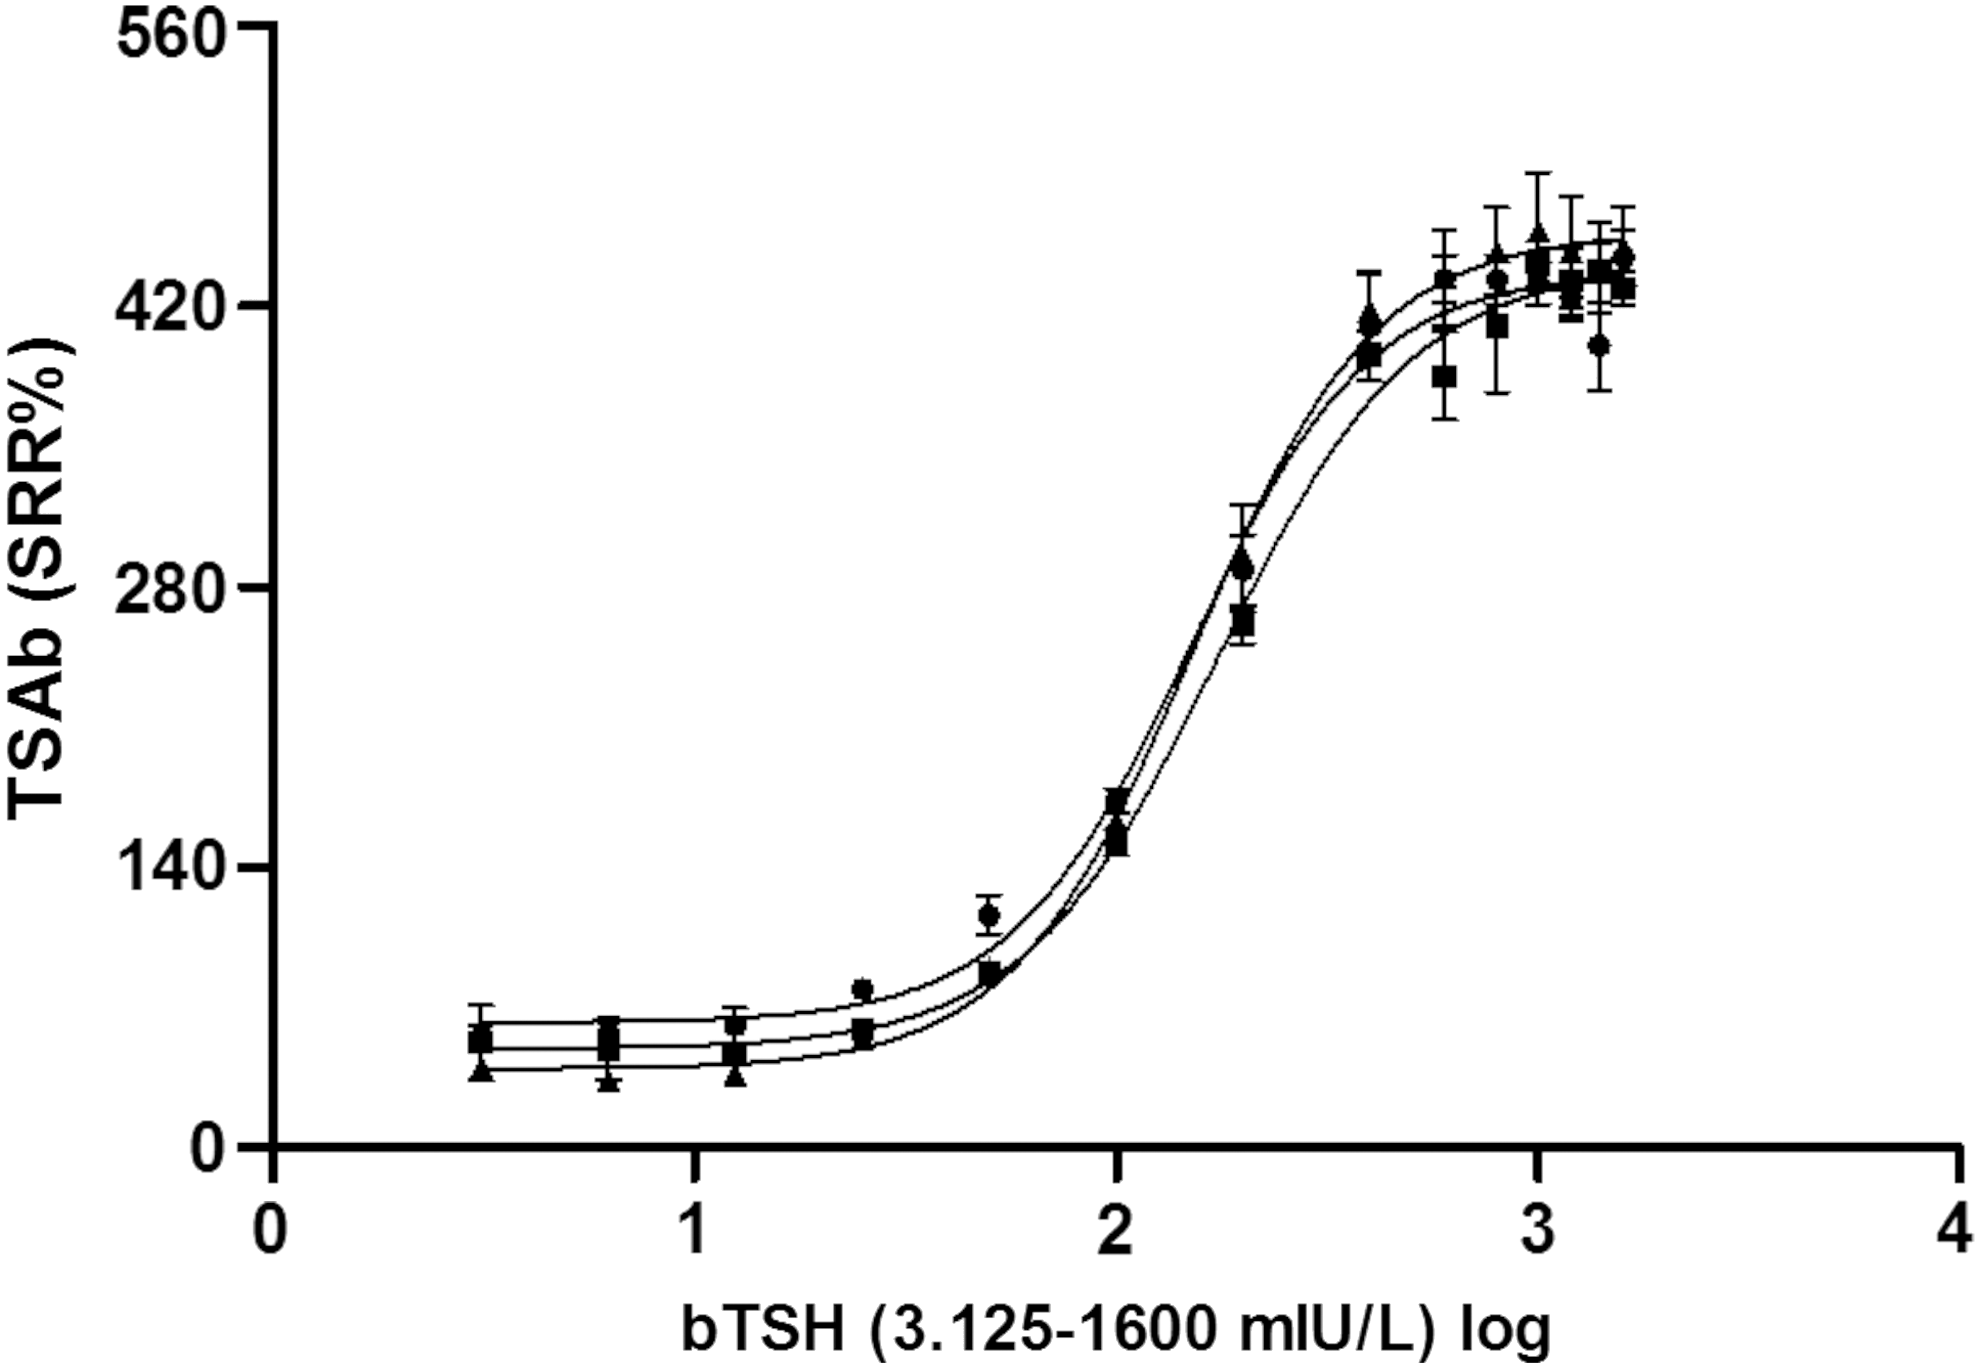
Dose–response curve of bovine thyrotropin (bTSH). The bTSH concentrations (mIU/L) from three runs are represented on a logarithmic scale on the x-axis against the TSAb SRR% values on the y-axis. The bTSH dose–response curves were repeated three times, and the mean TSAb SRR% average values of triplicate determinations for each bTSH concentration are shown.
Dose–response curve of diluted patient serum
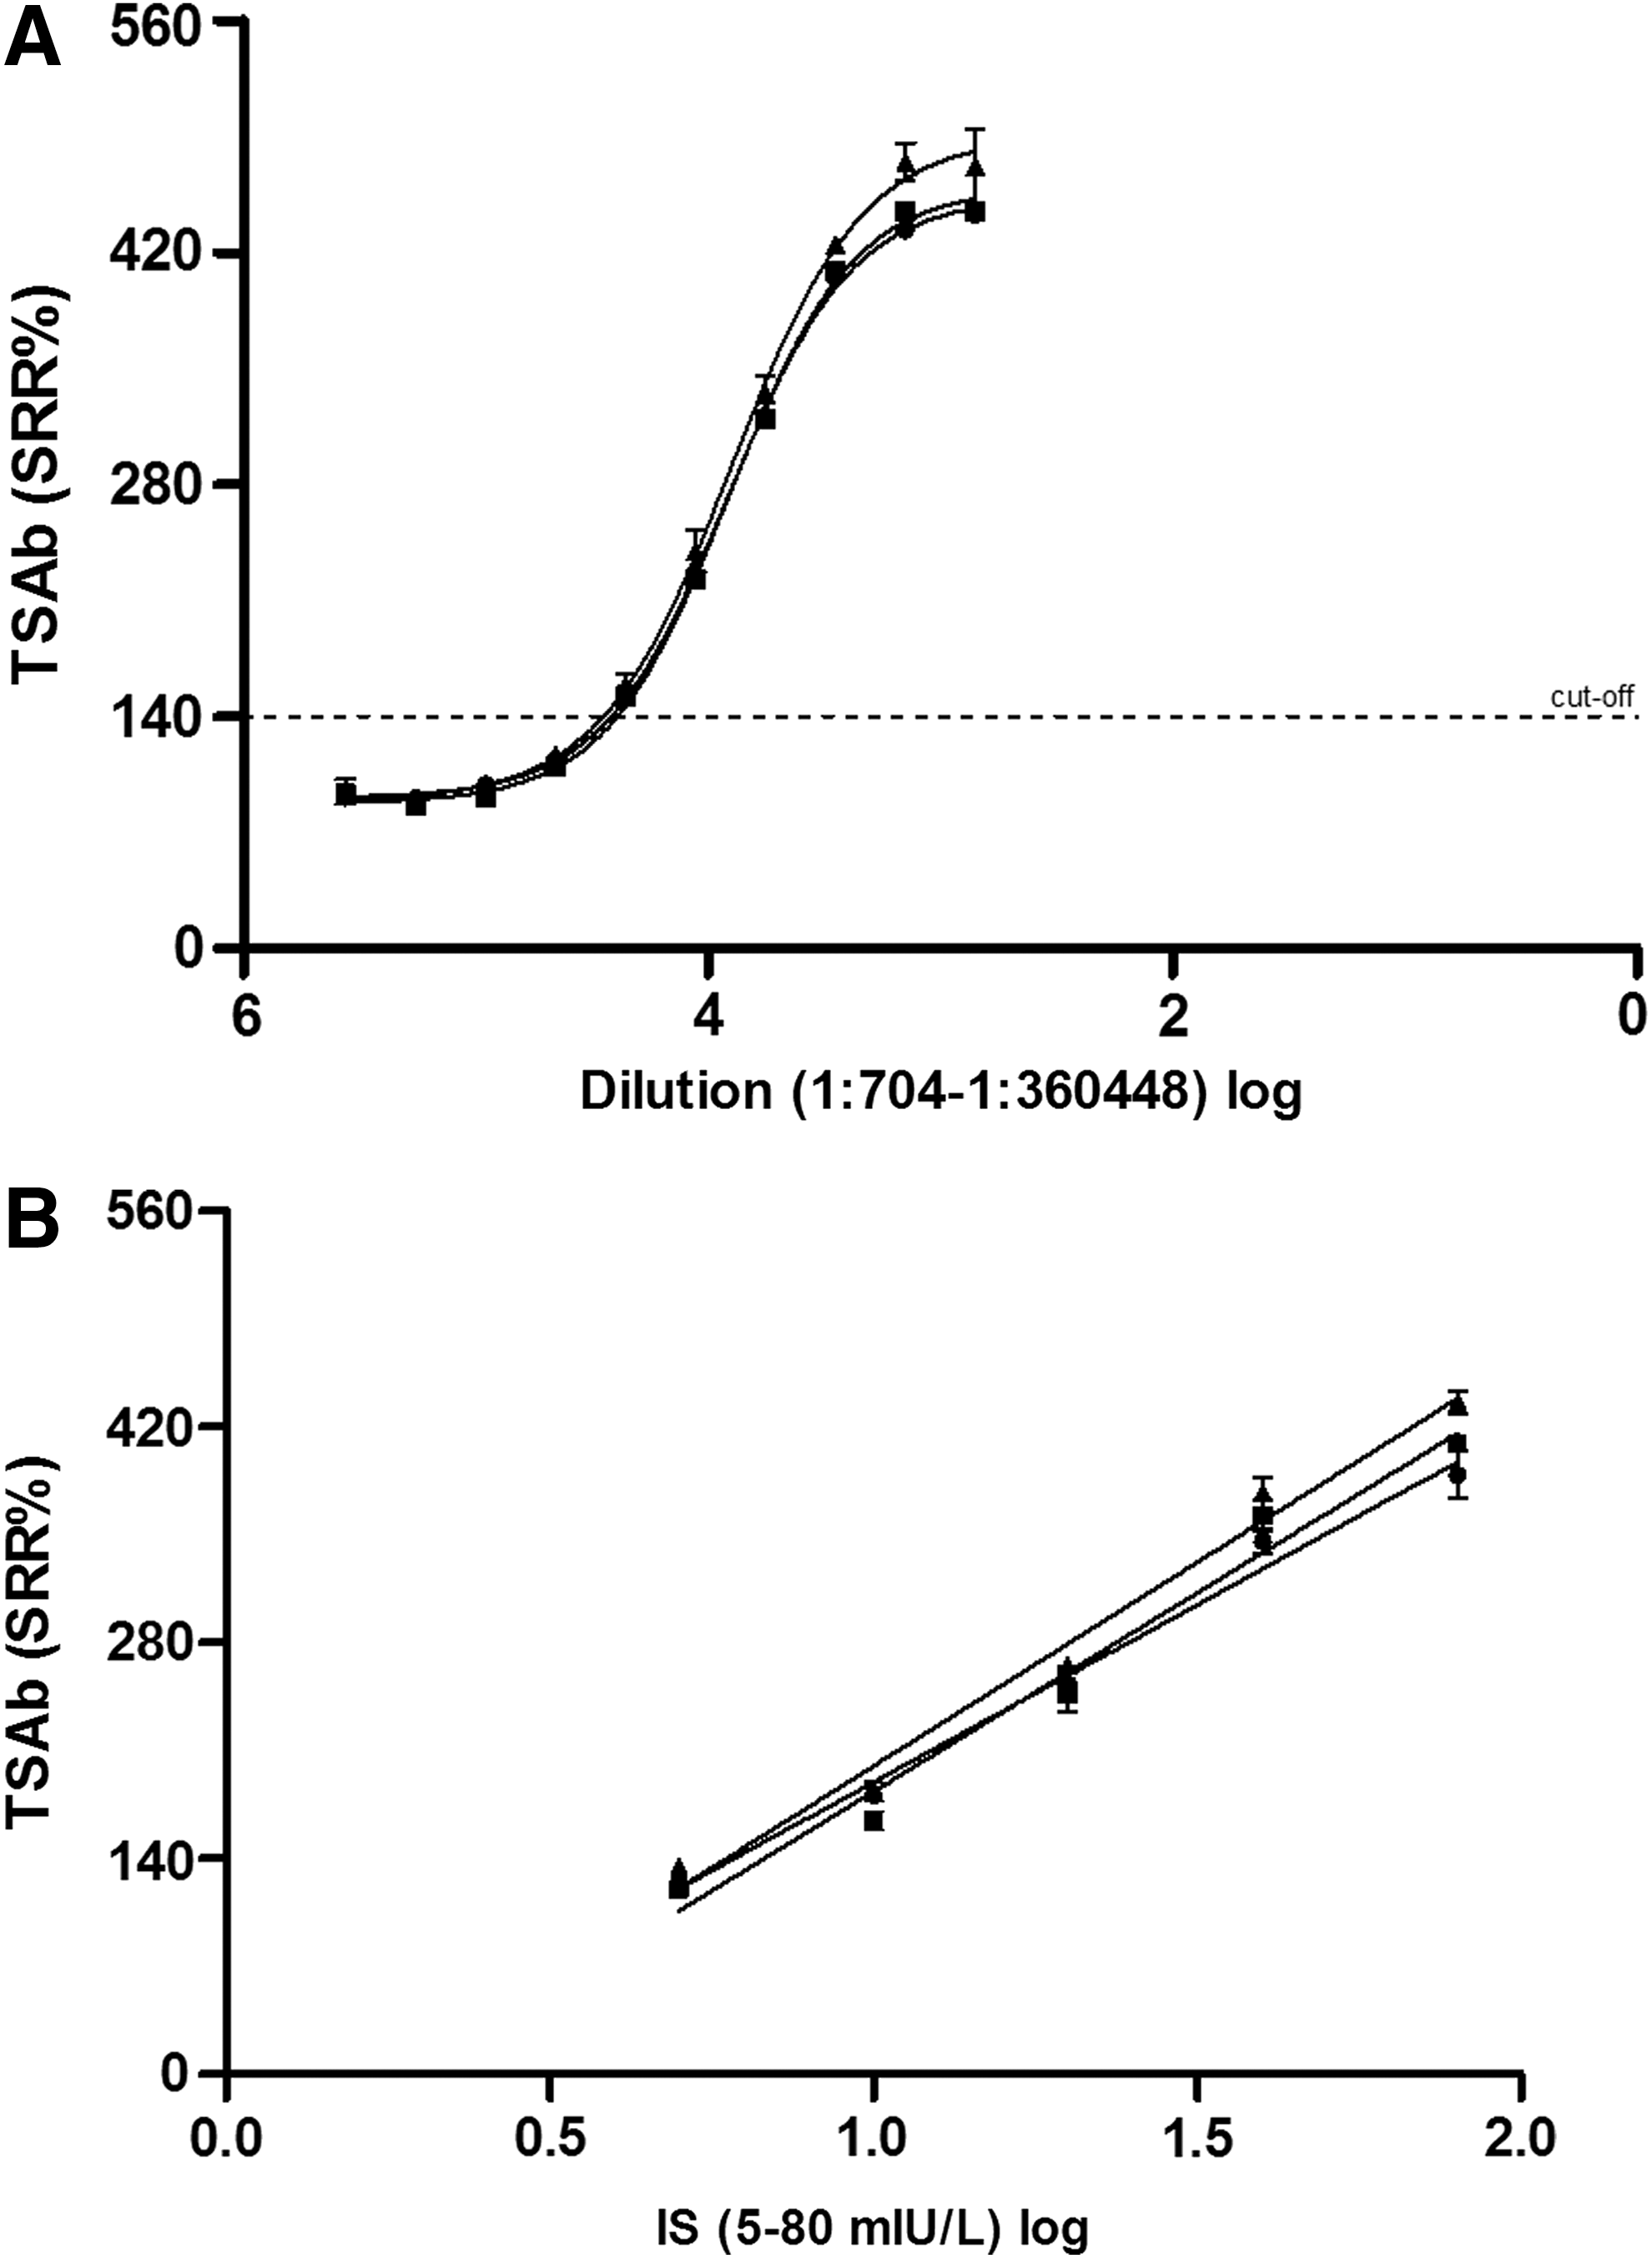
The dilution series (1:11 to 1:360,448) of a TSAb positive patient serum sample is shown in Figure 3A. Mean TSAb SRR%±SD values for the dilutions 1:704, 1:1408, 1:2816, 1:5632, 1:11,264, 1:22,528, 1:45,056, 1:90,112, 1:180,224, and 1:360,448 were 453±19 (CV 4.2%), 451±22 (4.9), 413±10 (2.4), 325±10 (3.0), 229±11 (4.8), 155±5 (3.0), 113±4 (3.9), 95±7 (7.3), 88±4 (4.4), and 93±7 (7.9), respectively. The linear range is between the dilution steps 1:2816 and 1:45,056. The IS calibration standards (5, 10, 20, 40, and 80 mIU/L) and the dilutions of the GD serum were run on the same plate. The standard curves had R 2 values≥0.95. For the IS concentrations 5, 10, 20, 40, and 80 mIU/L, mean TSAb SRR%±SD values were 127±7, 176±10, 256±12, 362±16, and 411±22, respectively (Fig. 3B). For the IS calibration curve, CV% values of 5.6, 5.8, 4.6, 4.3, and 5.4 were noted. The converted mean mIU/L±SD values for linear range were at dilutions of 1:2816 (77.6±7.8, CV 10.0%), 1:5632 (34.6±3.0, 8.7%), 1: 11,264 (14.3±1.0, 6.8%), 1:22,528 (7.2±0.3, 4.8%), and 1:45,056 (4.9±0.3, 5.1%). The converted mIU/L values for dilutions 1:704 and 1:1408 were above the linear range and exhibited values>80 mIU/L. Dilution steps 1:90,112, 1:180,224, and 1:360,448 were below the linear range (<5 mIU/L) and therefore not convertible.
(
Conversion of the assay cutoff to mIU/L
A total of 28 experiments over five days and three users showed that the assay cutoff at 140 SRR% corresponded to 9.54±1.68 (mean mIU/L±SD).
Conversion of TSAb SRR% into mIU/L using three reference controls
A total of 50 serum samples from patients with GD were measured in the bioassay using three reference controls (bTSH, normal serum, and pooled normal serum). The TSAb values from all these results were then converted into mIU/L by using the standard curve from the IS. TSAb values of six exemplary sera are listed in Table 2, and the corresponding converted mIU values are shown in Figure 4.

Conversion of patient TSAb SRR% levels into mIU/L using three reference controls. Six different patient sera samples measured in triplicate (lab sample numbers 5579, 5590, 5502, 3410, 5476, and 5366) are shown in a scatterplot for each of the three reference controls (bTSH, euthyroid healthy subject, and healthy donor pool). The values in triplicate were almost identical for the three reference controls. For the conversion of TSAb SRR% into mIU/L, the corresponding IS equation on the plate was used for calculation.
TSAb, thyroid stimulating antibodies.
Clinical application and conversion of TSAb SRR% into mIU/L using patient serum samples
Clinical application was done in a total of 60 serum samples from patients with GD. These were measured in the bioassay using bTSH as reference control. Of these, 20 exemplary samples are presented in Table 3. The range of the randomly chosen (every third) samples was from 7.8 to 72.2 mIU/L, and five measured serum samples were above the linear range.
Discussion
In this report, we show the feasibility of calibrating TSAb values against an IS using a FDA-cleared bioassay. Experiments using the IS and dilution of a high positive TSAb serum sample showed a high correlation coefficient and excellent reproducibility. These results can be used to standardize TSAb levels among laboratories in the future and enable more accurate comparison of TSAb studies. In addition, reporting TSAb in mIU/L will be clinically useful for serial TSAb measurements during patient management. Hence, standardized results may improve the diagnostic utility of TSAb levels and may as a result lead to better patient outcomes. Also, interpretation of standardized TSAb results will be easier for physicians involved in patients care.
There are pros and cons of measuring TSAb using cell-based bioassays (19). There are procedural advantages and a relative simplicity of the bioassay used in this study. For instance, the cells do not need to be passaged; there is no need for a serum starvation step, serum concentration, or IgG purification, which has markedly improved the diagnostic application of this bioassay in the clinical laboratory. However, further optimization of the bioassay for the measurement of TSHR-Ab could be achieved by: (a) standardization of the quantification of the obtained results in recognized IU instead of the current SRR%; (b) semi-automatization through repeated washing steps of the 96 multi-well plates; (c) marked reduction of the incubation time of the cells after thawing without losing diagnostic accuracy, sensitivity, and specificity of the assay; (d) further reduction of the duration of time of target cell stimulation after addition of the patient sera; and (e) maximizing the skills of the responsible laboratory technician to enable measurements to be performed in duplicate instead of in triplicate, thus leading to a relevant increase of number of sera tested on each plate and to a larger volume of daily antibody testing.
A literature search found no citations pertaining to the standardization of cell-based bioassays with reference material. Furthermore, despite the fact that there is an extensive body of literature on the use of TSAb levels to diagnose and manage patients with GD, there has been little data published on the analytical performance of the bioassays used in these studies and no data on the use of the IS. RSR Limited (Cardiff, United Kingdom) offers an assay service for research use only to measure TSAb and has applied the IS to this bioassay (29). However, no information pertaining analytical performance (e.g., linear range, imprecision, etc.) of the standard curve are on the Web site describing this bioassay.
Our studies show that both bTSH and high TSAb positive serum can be used to generate standard curves for the quantitative TSAb bioassay. The characteristics of the bTSH dose–response are very similar to that of the IS, but the high TSAb positive serum showed a wider linear range. Thus, it might be an alternative candidate for obtaining a standard curve that can cover a potentially larger SRR% range. However, there are advantages of using IS (08/204) to generate the standard curve, since it is based on M22, which is a purely stimulatory anti-TSHR human monoclonal antibody.
Since there is concern of possible variation in each measured standard curve, for these studies, the standard curve was included on each plate of the bioassay. The linear range of the assay is just below the cutoff of 140 SRR%, and therefore patient sera near the cutoff could be reported as positive or negative. Since the measured CV was approximately 10% at the limit of quantitation, a gray zone ranging from 130 to 150 SRR% may be considered when reporting results. Variation can be caused by uneven cell numbers, induction time, and/or human pipetting error. Having the standard curve from the IS on each plate to allow conversion of the TSAb SRR% values into mIU/L uses wells on the plate and thus fewer “unknown” samples can be measured on each plate. Nevertheless, the variability of the standard curves are sufficiently low in the present studies that it is possible that laboratories will be able to obtain reproducible results by running the standard curve periodically or only on each new lot of cells.
The performance of the bioassay was evaluated by using three different reference controls: bTSH, serum from a healthy euthyroid subject, or a pool of serum from five healthy donors. Significant differences were found in the magnitude of the SRR% values. Use of either a single patient serum or the pooled sera resulted in lower RLU compared to the bTSH reference control, which is used in the standard protocol. This results in higher SRR% values with the serum controls because the SRR% is calculated as the unknown RLU/the control RLU×100. However converting the SRR% into IU/L resulted in a normalization of the values, and the final mIU/L were similar for all three reference controls used. These data may be relevant for the practical choice of selecting an optimal reference control in the bioassay kit.
The linear range of the bioassay was found to be about one order of magnitude. In our experience, the TSAb levels of most of the patient samples fall within the linear range of the assay (5–80 mIU/L). Currently, serum TSAb levels below the linear range (<5 mIU/L) cannot be converted, whereas
Footnotes
Acknowledgments
The authors are grateful to Elisa Kolbe, study nurse, and to Jasmin Franken, medical associate (both JGU Thyroid Lab), for data collection. They also thank Jeffrey Houtz (Quidel, San Diego, CA) for most constructive and fruitful discussions.
Author Disclosure Statement
P.D.O. and G.J.K. consult for and Y.L. is an employee of Quidel (San Diego, CA). T.D., M.K., and M.L. have nothing to disclose.