
Abstract
Background:
Acute iodine excess in newborns can cause hypothyroidism, but there are limited data on the effects of iodine excess on thyroid function in older infants. The aim of this study was to measure the effects of chronic excess iodine intake on thyroid function in 6–24-month-old infants.
Methods:
In this cross-sectional study, infants (n=696) in eastern Nepal were studied. Spot urine samples, venous blood samples, and household salt samples were collected, and urinary iodine concentration (UIC), serum free thyroxine (fT4), thyrotropin (TSH), thyroglobulin (Tg), and titrated household salt iodine concentration (SIC) were measured. Daily iodine intake was calculated from UIC based on estimates of urine volume at this age.
Results:
Median (25th–75th percentile) household SIC was 89 (70–149) ppm, while national legislation stipulates a fortification level of 50 ppm. Median UIC was 407 (312–491) μg/L; 76% of infants had a UIC >300 μg/L, suggesting iodine excess. Calculated mean iodine intake in 12–24-month-old infants was 220 μg/day, exceeding the recommended safe upper limit for iodine at this age (200 μg/day). Among the infants, 15.8% had an elevated Tg, 7.4% had subclinical hypothyroidism, but <1% had overt hypothyroidism. UIC was not a significant predictor of thyroid function, thyroid hormones, or Tg.
Conclusion:
In 6–24-month-old infants exposed to excessive iodine intake, ∼7% have subclinical hypothyroidism but <1% have overt hypothyroidism. These findings suggest the thyroid in late infancy is already able to adapt to high iodine intakes and, in most cases, maintain euthyroidism.
Introduction
I
To monitor iodine intake from iodized salt programs, the recommended indicator is the urinary iodine concentration (UIC), which reliably reflects recent iodine intake (1). National programs monitoring the impact of salt iodization have rarely surveyed infants, in part because of the difficulty of collecting urine samples at this age. However, a validated method to collect spot urine samples from infants is available (5), and it was used in a recent national iodine survey in Switzerland to assess iodine status in infancy (6). Serum or dried blood spot thyroglobulin (Tg) has been proposed as an additional functional iodine biomarker. Tg is negatively correlated with UIC and positively correlated with thyrotropin (TSH) and thyroid volume in cross-sectional studies in adults (7 –9). Measurement of Tg on dried blood spots has been proposed as a “field-friendly” approach to monitor thyroid function in children after changes in iodine intake (10,11). Tg appears to be a more sensitive indicator of iodine deficiency than TSH or thyroid hormones in both children (11) and adults (8,12). It may also be a sensitive indicator of iodine excess in school-aged children (11). Data on the usefulness of Tg as a biomarker of iodine status in infancy are lacking.
Nepal introduced salt iodization in 1993, and the regulation for iodized salt stipulates a fortification level of 50 ppm at production, in order to achieve a level of 30 ppm at retail and 15 ppm in households. In the national iodine survey in Nepal in 2007, household coverage with adequately iodized salt was 77%. Population monitoring of the iodine status in Nepal has focused on school-aged children (13 –18). The national survey of schoolchildren in 2007 reported that the median UIC was 203 μg/L (19), suggesting iodine sufficiency (8). However, in a 2012 study of 6–12-year-olds in two districts of eastern Nepal, the median UIC was 238 and 294 μg/L, suggesting more than adequate iodine intakes, and the prevalence of subclinical hypothyroidism was ∼30% (16). This study measured UIC, salt iodine concentration (SIC), and thyroid function, including serum thyroglobulin, in 6–24-month-old infants in eastern Nepal. The hypotheses were: (a) infants in this area would have an excess iodine intake; and (b) excess iodine intake would be associated with elevations in Tg and a high prevalence of subclinical and overt hypothyroidism.
Materials and Methods
The study was conducted from April 2012 to April 2013 in five districts (Sunsari, Dhankuta, Morang, Jhapa, and Tehrathum) of eastern Nepal (Fig. 1). A convenience sample of healthy 6–24-month-old infants, who were seen for health checks and vaccinations at nine antenatal clinics and primary healthcare centers (PHCs), was invited to join the study. The positive response rate was high: 93.4% of those invited (696/745) were enrolled in the study. The numbers of infants invited at the district level were: Dandabazar and Rajarani PHCs in Dhankuta (n=97); Mangalbare and Pathari PHCs in Morang (n=61); Chatara and Itahari PHCs in Sunsari (n=403); Jhirikhimti and Basantapur PHCs in Tehrathum (n=106); and Sanischare PHC in Jhapa (n=78). For 49 infants (6.6%), no biological samples (urine or blood) were obtained, and the infants were excluded from the analysis. The final sample size was 696 infants: urine samples were obtained in 630 infants, and venous blood samples were collected in 568 infants. All participants were requested to submit household salt samples on the day of urine collection, and salt samples were collected from 156 households. Ethical clearance was obtained from the committees of the B.P. Koirala Institute of Health Sciences, Dharan, Nepal, the Nepal Health Research Council, and the ETH Zurich, Switzerland. Written oral or written consent was obtained from the mothers or legal guardians of the weaning infants.
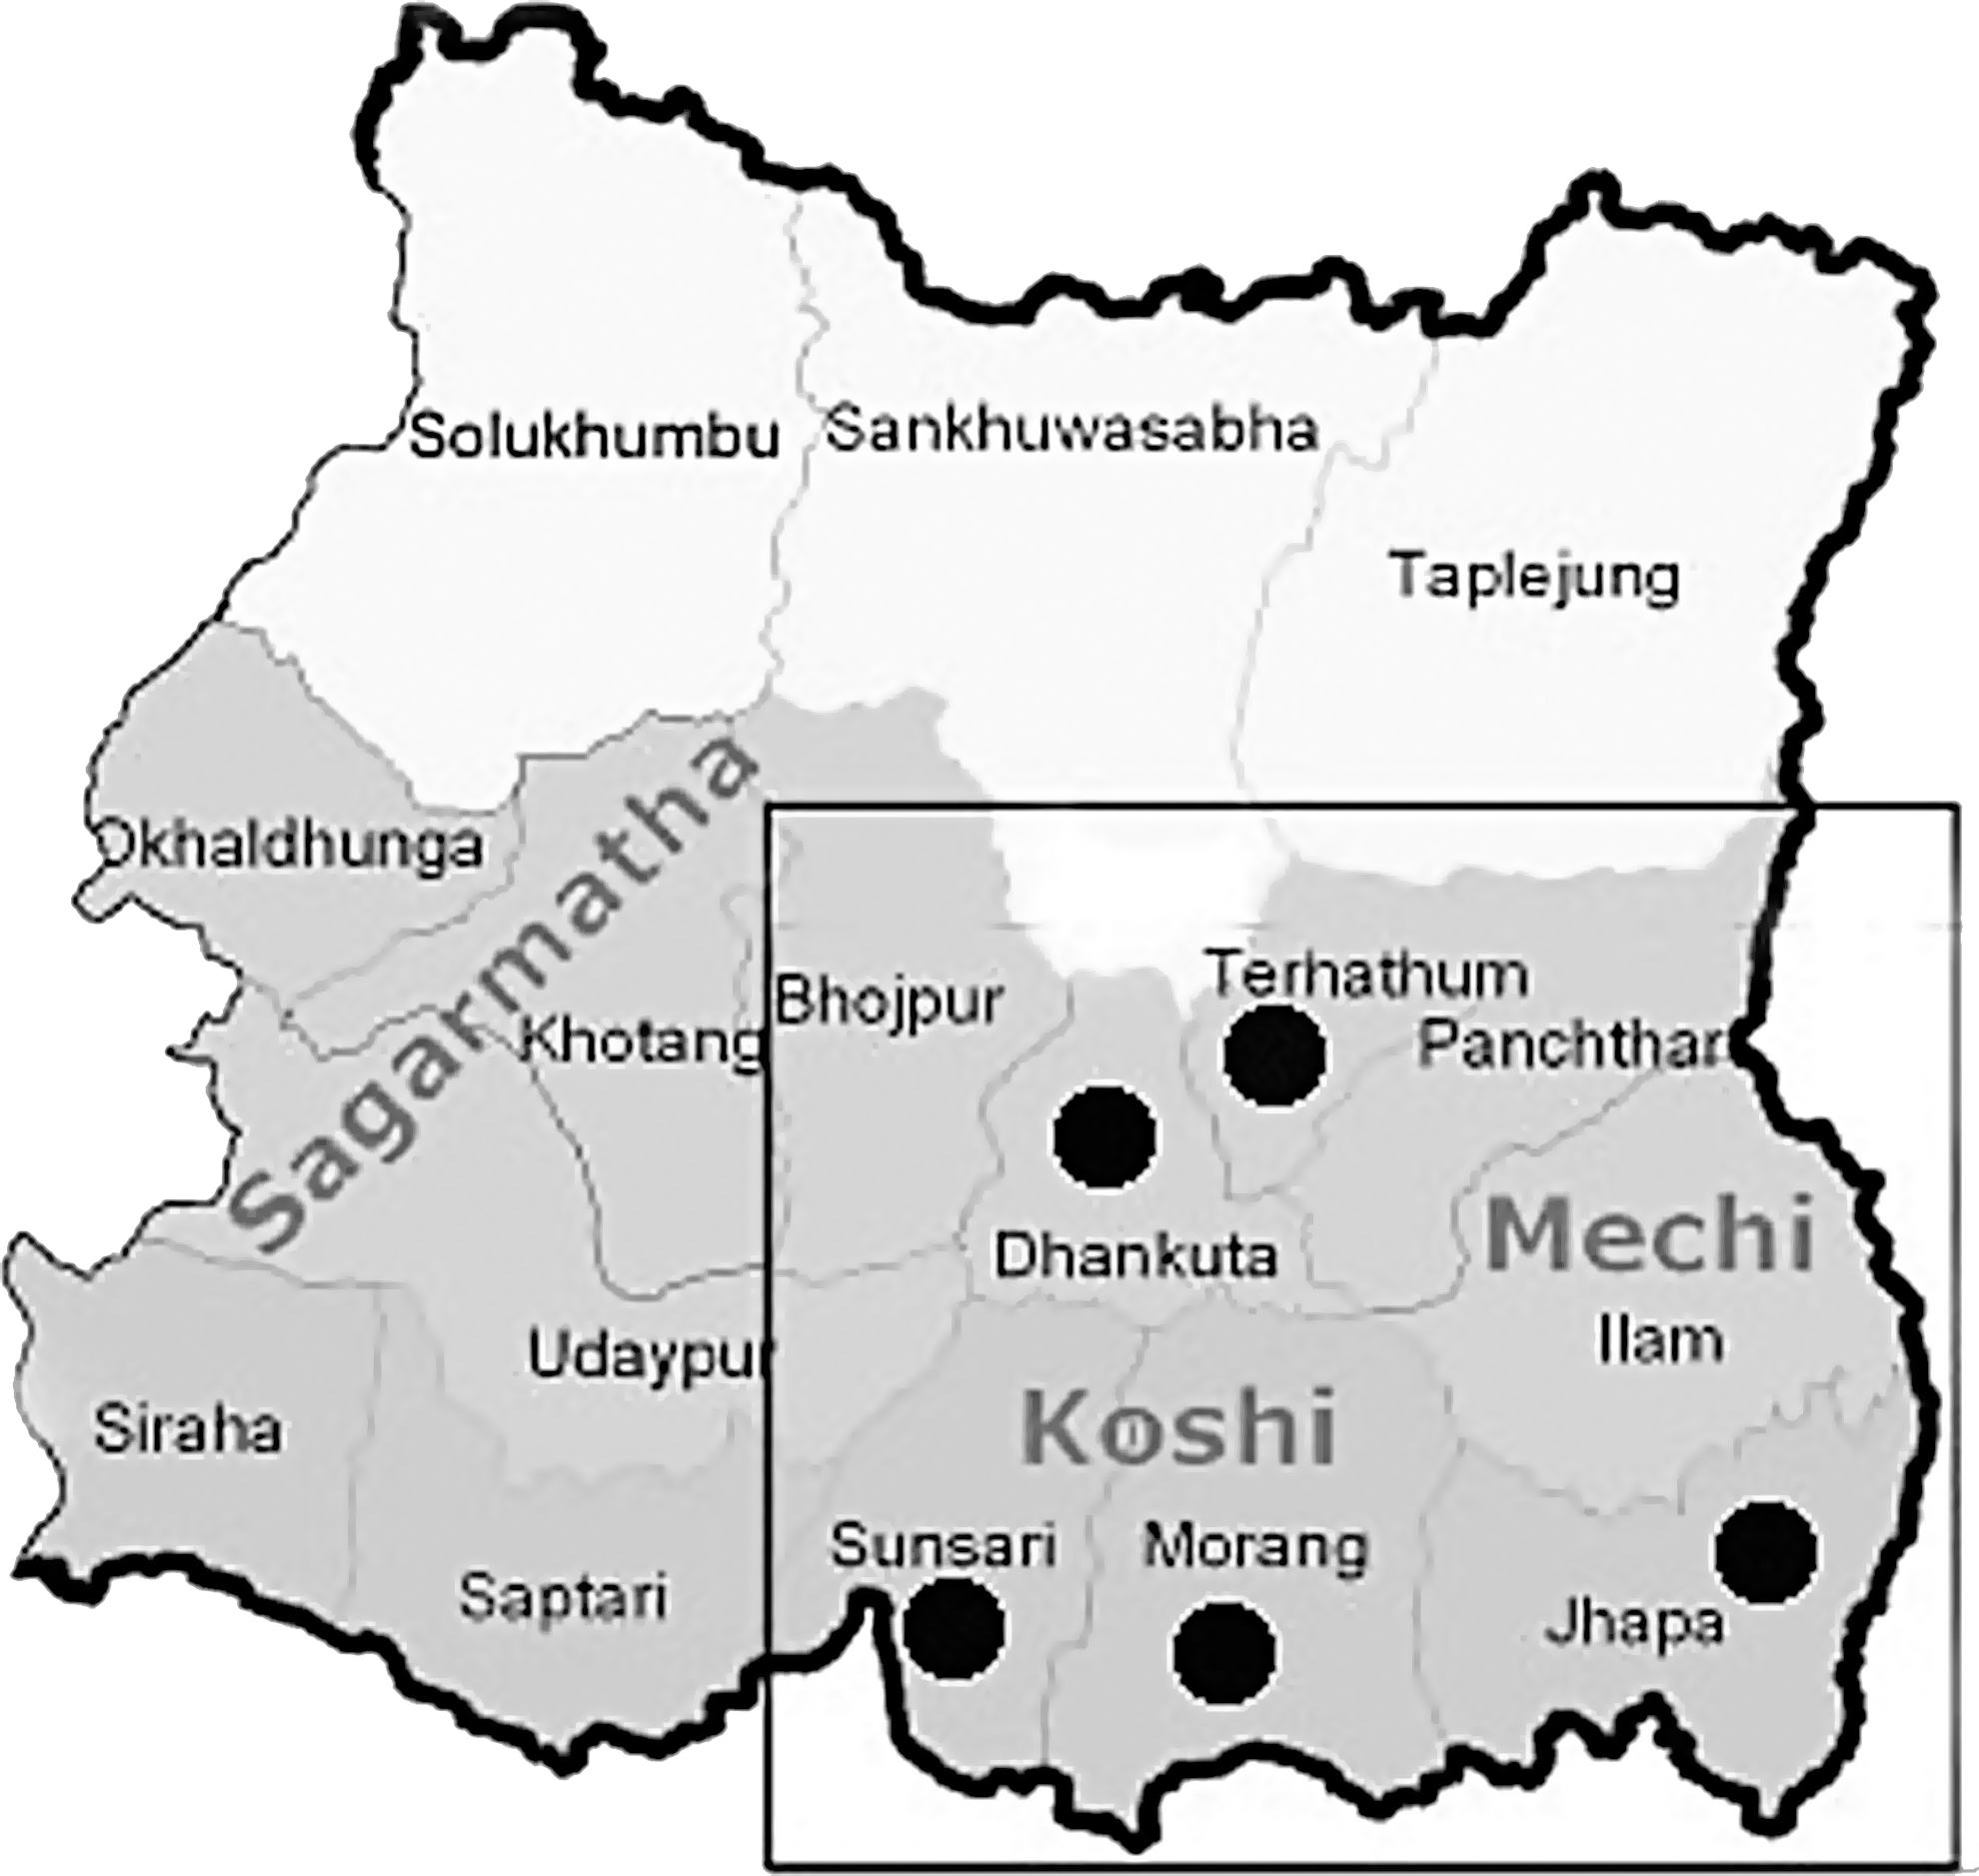
Sampling sites of the weaning infants in the eastern region of Nepal.
A questionnaire was used to record demographic variables, including, age, sex, weight, family size, water source, salt type, and ethnicity. Many of the infants were receiving both breast milk and complementary foods. The most common complementary foods available in this region were Cerelac (Nestlé), Sarbottam premium pitho (Chaudhary Group), Sarbottam pitho special (ABC), Naya Lito, and Sarbottam pitho (Chimeki) (20). These weaning foods consist of mixtures of cereals—wheat, soybean, maize, gram (lentils), or rice—and are not fortified with iodine. However, families will traditionally season these complementary foods by adding salt. Also, in Tehrathum District, there was limited distribution of a fortified flour (wheat 60%, soybean 20%, and sugar 15%) that contained 150 μg iodine per serving.
Using aseptic techniques, trained laboratory personnel and nurses collected a 1–2 mL venous blood sample from the infants into sealed vacutainer tubes (BD Vacutainer, Franklin Lakes, NJ) for measurement of free thyroxine (fT4), TSH, and Tg. Spot urine samples were collected in clean plastic vials. Blood and urine samples were transported to the laboratory in a cool box and were stored at –20°C until analysis at room temperature. The mothers of the infants were asked to bring two small portions of their usual household salt to the clinic. These were aliquotted into a tightly sealed plastic pouch for later measurement of SIC.
Laboratory analyses
UIC was measured by using the ammonium persulfate digestion method (21), based on the Sandell Kolthoff reaction in a microplate format. Digestion of urine samples was done in a specially designed sealing cassette (Hitachi, Tokyo, Japan). External controls provided by Seronorm™ trace element urine L1 (batch: 1011644) and L2 (batch: 1011645; Seronorm™, Billinstad, Norway) were used. The intra-assay (n=8) and inter-assay (n=35) coefficients of variation (CVs) for the L1 84 (72–96) μg/L and L2 304 (260–348) μg/L controls were 5.5% and 3.8%, and 17.0% and 14.1%, respectively. The urine laboratory successfully participates in the EQUIP external control program of the U.S. Centers for Disease Control (CDC), Atlanta, GA.
To classify iodine nutrition, the WHO criteria for population median UIC (1) was used: <100 μg/L, deficient; 100–299 μg/L, sufficient; and >300 μg/L, excessive. fT4, TSH, and Tg were measured by immunoassay (Diametra, Perugia, Italy). Pooled serum was used for internal control of the TSH and thyroglobulin assays; inter-assay CV was 16.0% at a mean value of 4.53 mIU/mL for TSH and 13.9% at a mean value of 16.39 ng/mL for Tg.
The manufacturer adult reference ranges for Tg, fT4, and TSH were 3.5–56 ng/dL (μg/L), 10.3–28.3 pmol/L, and 0.39–6.16 mIU/L, respectively. These adult reference ranges for TSH and fT4 were used in our analysis because no specific cutoffs were available for infancy, but in place of the reference range for Tg, the international Tg cutoff value of 40 μg/L, established for 6–12-year-old children was applied (9). Subclinical hypothyroidism was defined as a normal fT4 with an elevated TSH, overt hypothyroidism as a low fT4 and an elevated TSH, subclinical hyperthyroidism as normal fT4 with a low TSH, overt hyperthyroidism as a low TSH and an elevated fT4, and isolated hypothyroxinemia as a low fT4 and a normal TSH (22). SIC was measured by iodometric titration (17).
Statistical analyses
Data were entered in MS Excel 2011, and analyzed using IBM SPSS Statistics for Windows v21 (IBM Corp., Armonk, NY). Data were checked for normality using Kolmogorov–Smirnov and Shapiro–Wilk tests. Normally distributed data (fT4) were presented as mean±SD. Skewed data were log transformed before analysis, and presented as geometric mean and confidence interval (TSH, Tg). Non-normally distributed data were presented as median 25th–75th percentiles (UIC, SIC). Weight for age was calculated from WHO growth charts for infants 2007. Group differences were assessed by analysis of variance with Bonferroni correction on parametric data, and the Kruskal–Wallis test was applied on nonparametric data. The chi-square test was performed for categorical variables. Multiple linear regression analysis was performed for UIC, TSH, and Tg adjusted with age, sex, district, water source, ethnicity, SIC, salt type, and family size. Family size was included as a covariate because iodine intake by infants in the households might depend to some extent on the total number of people in the family who are sharing the available iodized salt. The association between UIC versus fT4, TSH, and Tg was graphically assessed with Loess smoothed curves. p-Values of <0.05 were considered statistically significant, considering confidence intervals at a two-sided level of significance.
Results
Mean±SD age of the infants was 14.0±5.6 months, with 45%, 32%, and 22% at the ages of 6–12, 13–18, and 19–24 months, respectively; the male:female ratio was 1.16 (Table 1). The household water source was mainly from the household tap (84%), but 15% of families obtained their water from village hand-pumps and <1% from wells.
Mean(±SD).
Median (25th and 75th percentiles).
Range.
UIC, urinary iodine concentrations; SIC, salt iodine concentrations.
Median (25th–75th percentiles) UIC in the infants was 407 (312–491) μg/L, and 76% of infants had a UIC >300 μg/L (Table 1), suggesting iodine excess. The median UICs (expressed in μg/L) from the study can be converted into median daily iodine intakes by estimating a mean 24 h urinary volume of 300 mL in 6–12-month-old infants and a mean 24 h urinary volume of 500 mL in 13–24-month-old infants, and estimating dietary iodine bioavailability to be 90% (23). The resulting median daily iodine intakes are ∼145 μg/day in the younger infants and ∼220 μg/day in the older infants.
Median UIC was significantly greater in the 6–12-month-old infants than in the older infants (p=0.004). In the five districts, the UIC values were: Sunsari 409 (334–488) μg/L, Dhankuta 374 (237–440) μg/L, Morang 409 (276–468) μg/L, Tehrathum 528 (296–712) μg/L, and Jhapa 378 (265–454) μg/L (p<0.001). Eighty-seven percent of families were using packed salt, and 13% were using salt purchased from open containers. The household SIC was high: the median SIC was 89 ppm and ∼25% of the samples had a SIC >150 ppm (Table 1). Median (25th–75th percentile) SIC was significantly higher in the packet salt (n=116; 95 (73–153) ppm) than in the open salt (n=32; 75 (53–113) ppm; p=0.021).
Table 2 shows the serum concentrations of fT4, TSH, and Tg, and the prevalence of overt and subclinical hypo- and hyperthyroidism and elevated Tg, by 6-month age intervals. There were no significant differences in median TSH or Tg, or mean fT4 among the age groups. Forty-one cases of subclinical hypothyroidism were found, with the highest prevalence at 6–12 months of age (8.2%). The overall prevalence of elevated Tg was 15.8%, with the highest prevalence of elevated Tg in 6–12-month-old infants (19.1%). Seventeen cases of isolated hypothyroxinemia were found, with the highest prevalence at 6–12 months of age (3.4%).
Geometric mean [CI].
Range.
Mean(±SD).
fT4, free thyroxine; TSH, thyrotropin; Tg, thyroglobulin.
Table 3 shows thyroid hormones and the prevalence of thyroid disorders by the three categories of iodine intake based on the infant UIC. TSH, fT4, and Tg did not differ significantly among the three categories. Among the infants with excess iodine, 37 showed signs of thyroid dysfunction, which was mainly subclinical hypothyroidism (28 cases). The prevalence of elevated Tg was higher in the infants with deficient (29.1%) or excess iodine intake (16.7%) compared to the infants with sufficient iodine intake (13%). However, across the three categories of iodine intake, there were no significant differences in the prevalence of thyroid disorders or elevated Tg (Table 3).
Geometric mean [CI].
Mean(±SD).
Figures 2 –4 show the scatter plots of UIC versus fT4, TSH, and Tg with Loess smoothed curves. The scatter plot of UIC with TSH (Fig. 2) shows a gradual fall in TSH values as the UIC increases to >500 μg/L. The scatter plot of UIC with fT4 (Fig. 3) shows fT4 concentrations very gradually rising over the range of UIC values. The scatter plot of UIC with Tg (Fig. 4) shows Tg concentrations nearly constant over the range of UIC values. Overall, there were no significant correlations between UIC and TSH (r=–0.02, p=0.3), Tg (r=0.05, p=0.1), or fT4 (r=0.06, p=0.08), after adjusting for age.
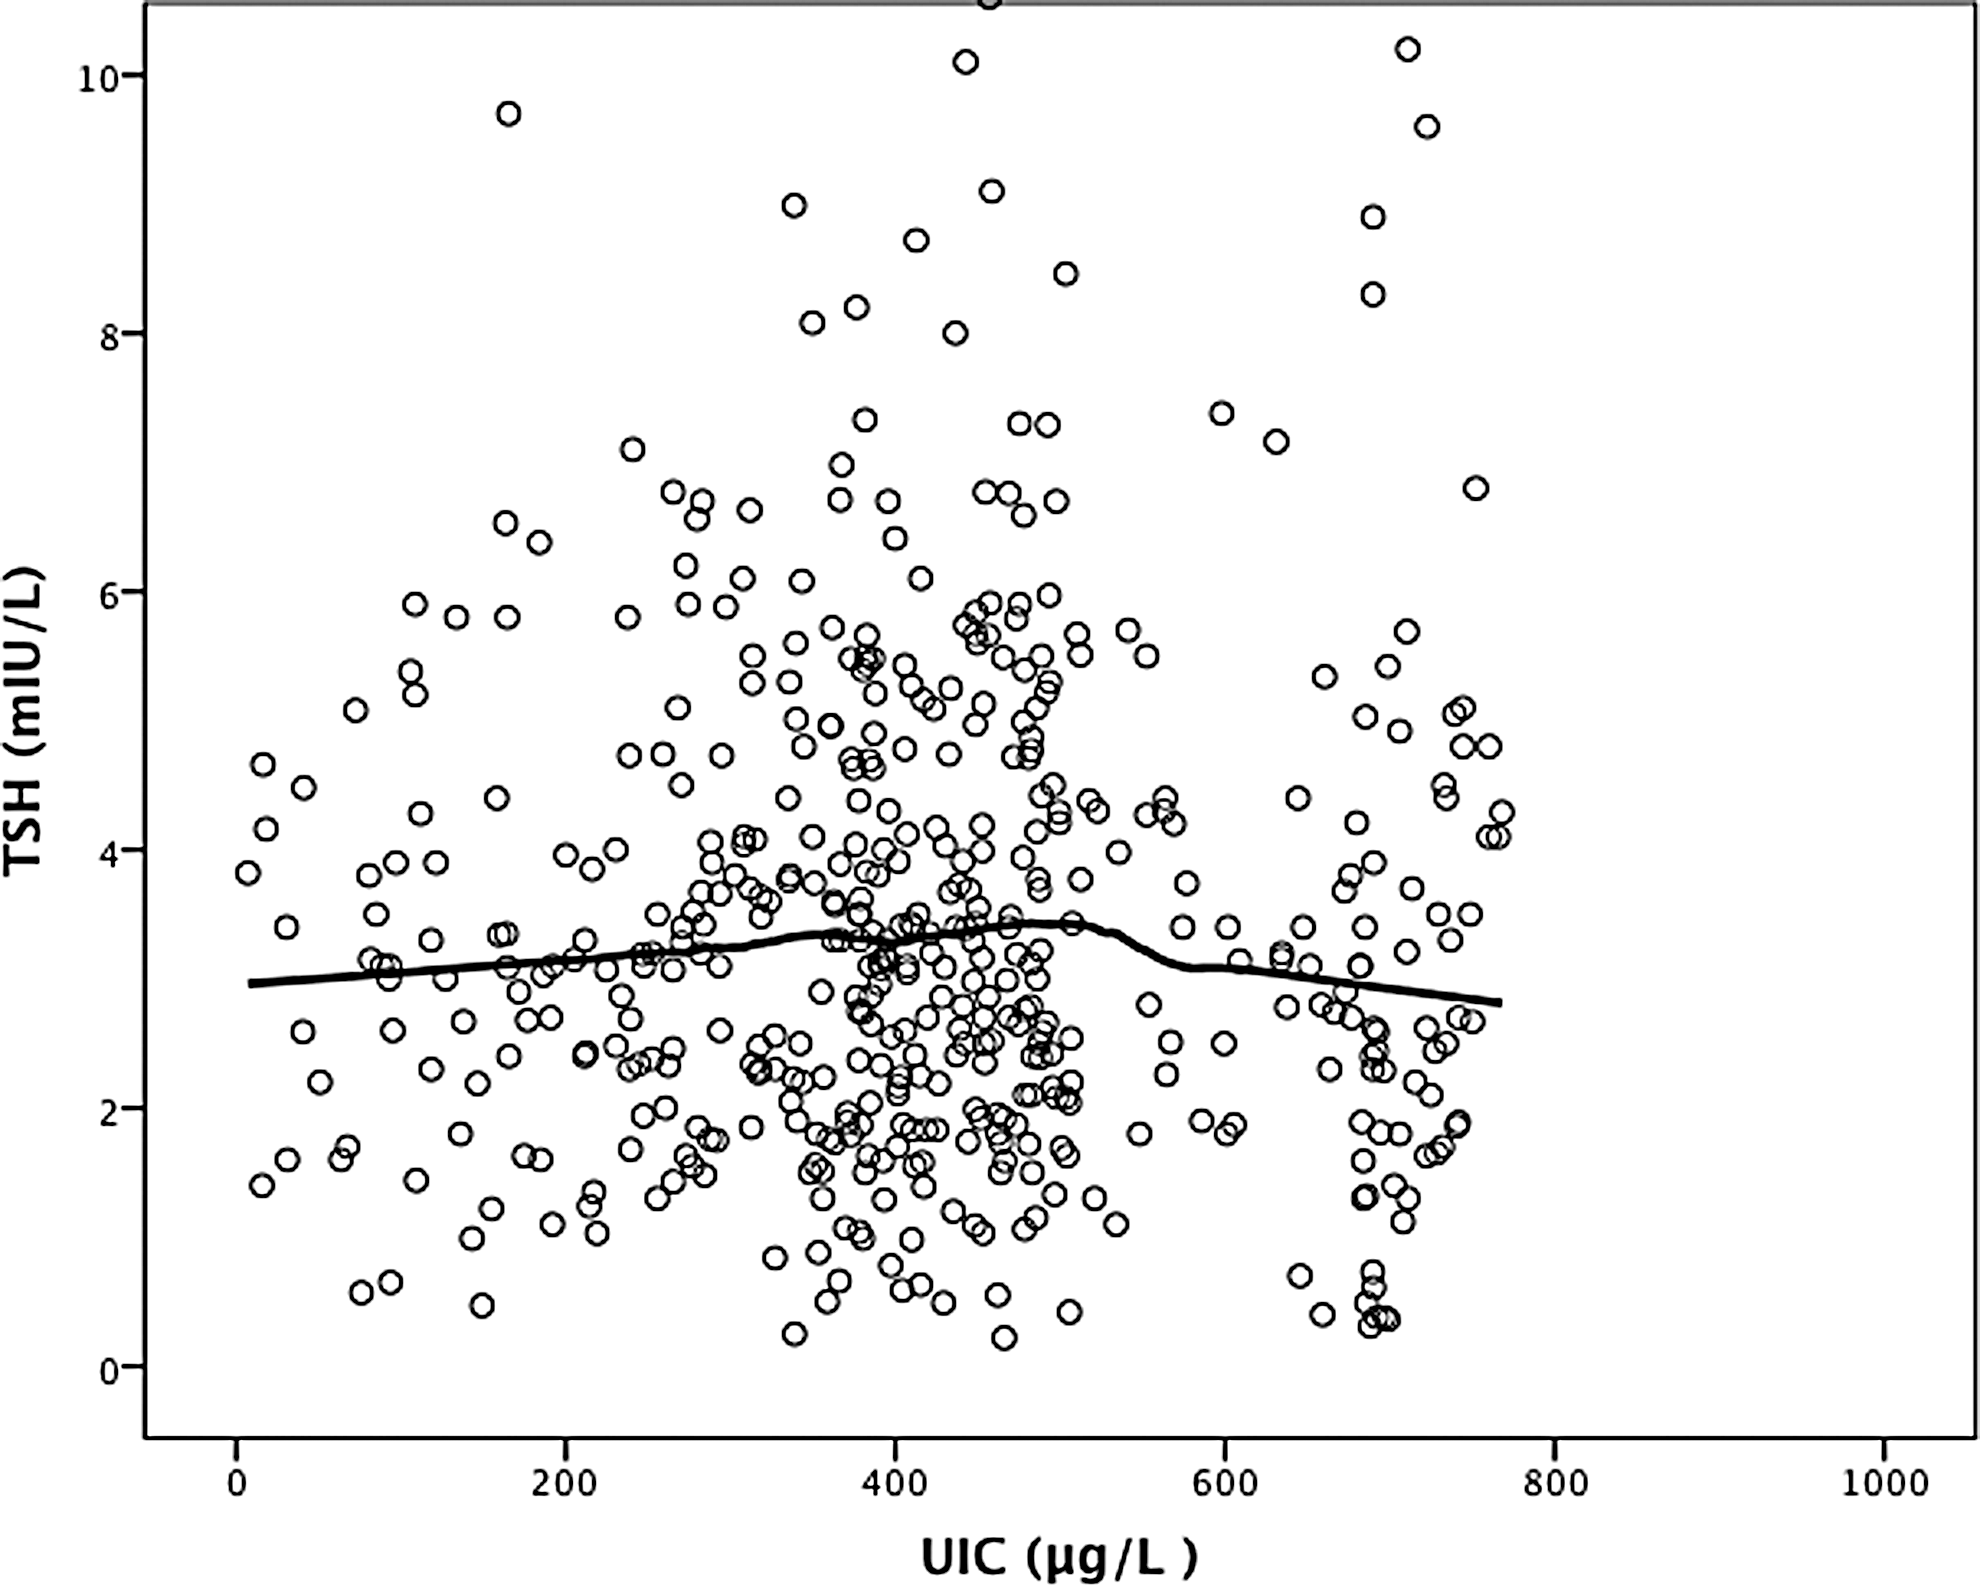
Scatter plots of urinary iodine concentration (UIC) with thyrotropin. Loess smoothed curves are shown as total fit.

Scatter plots of UIC with free thyroxine. Loess smoothed curves are shown as total fit.
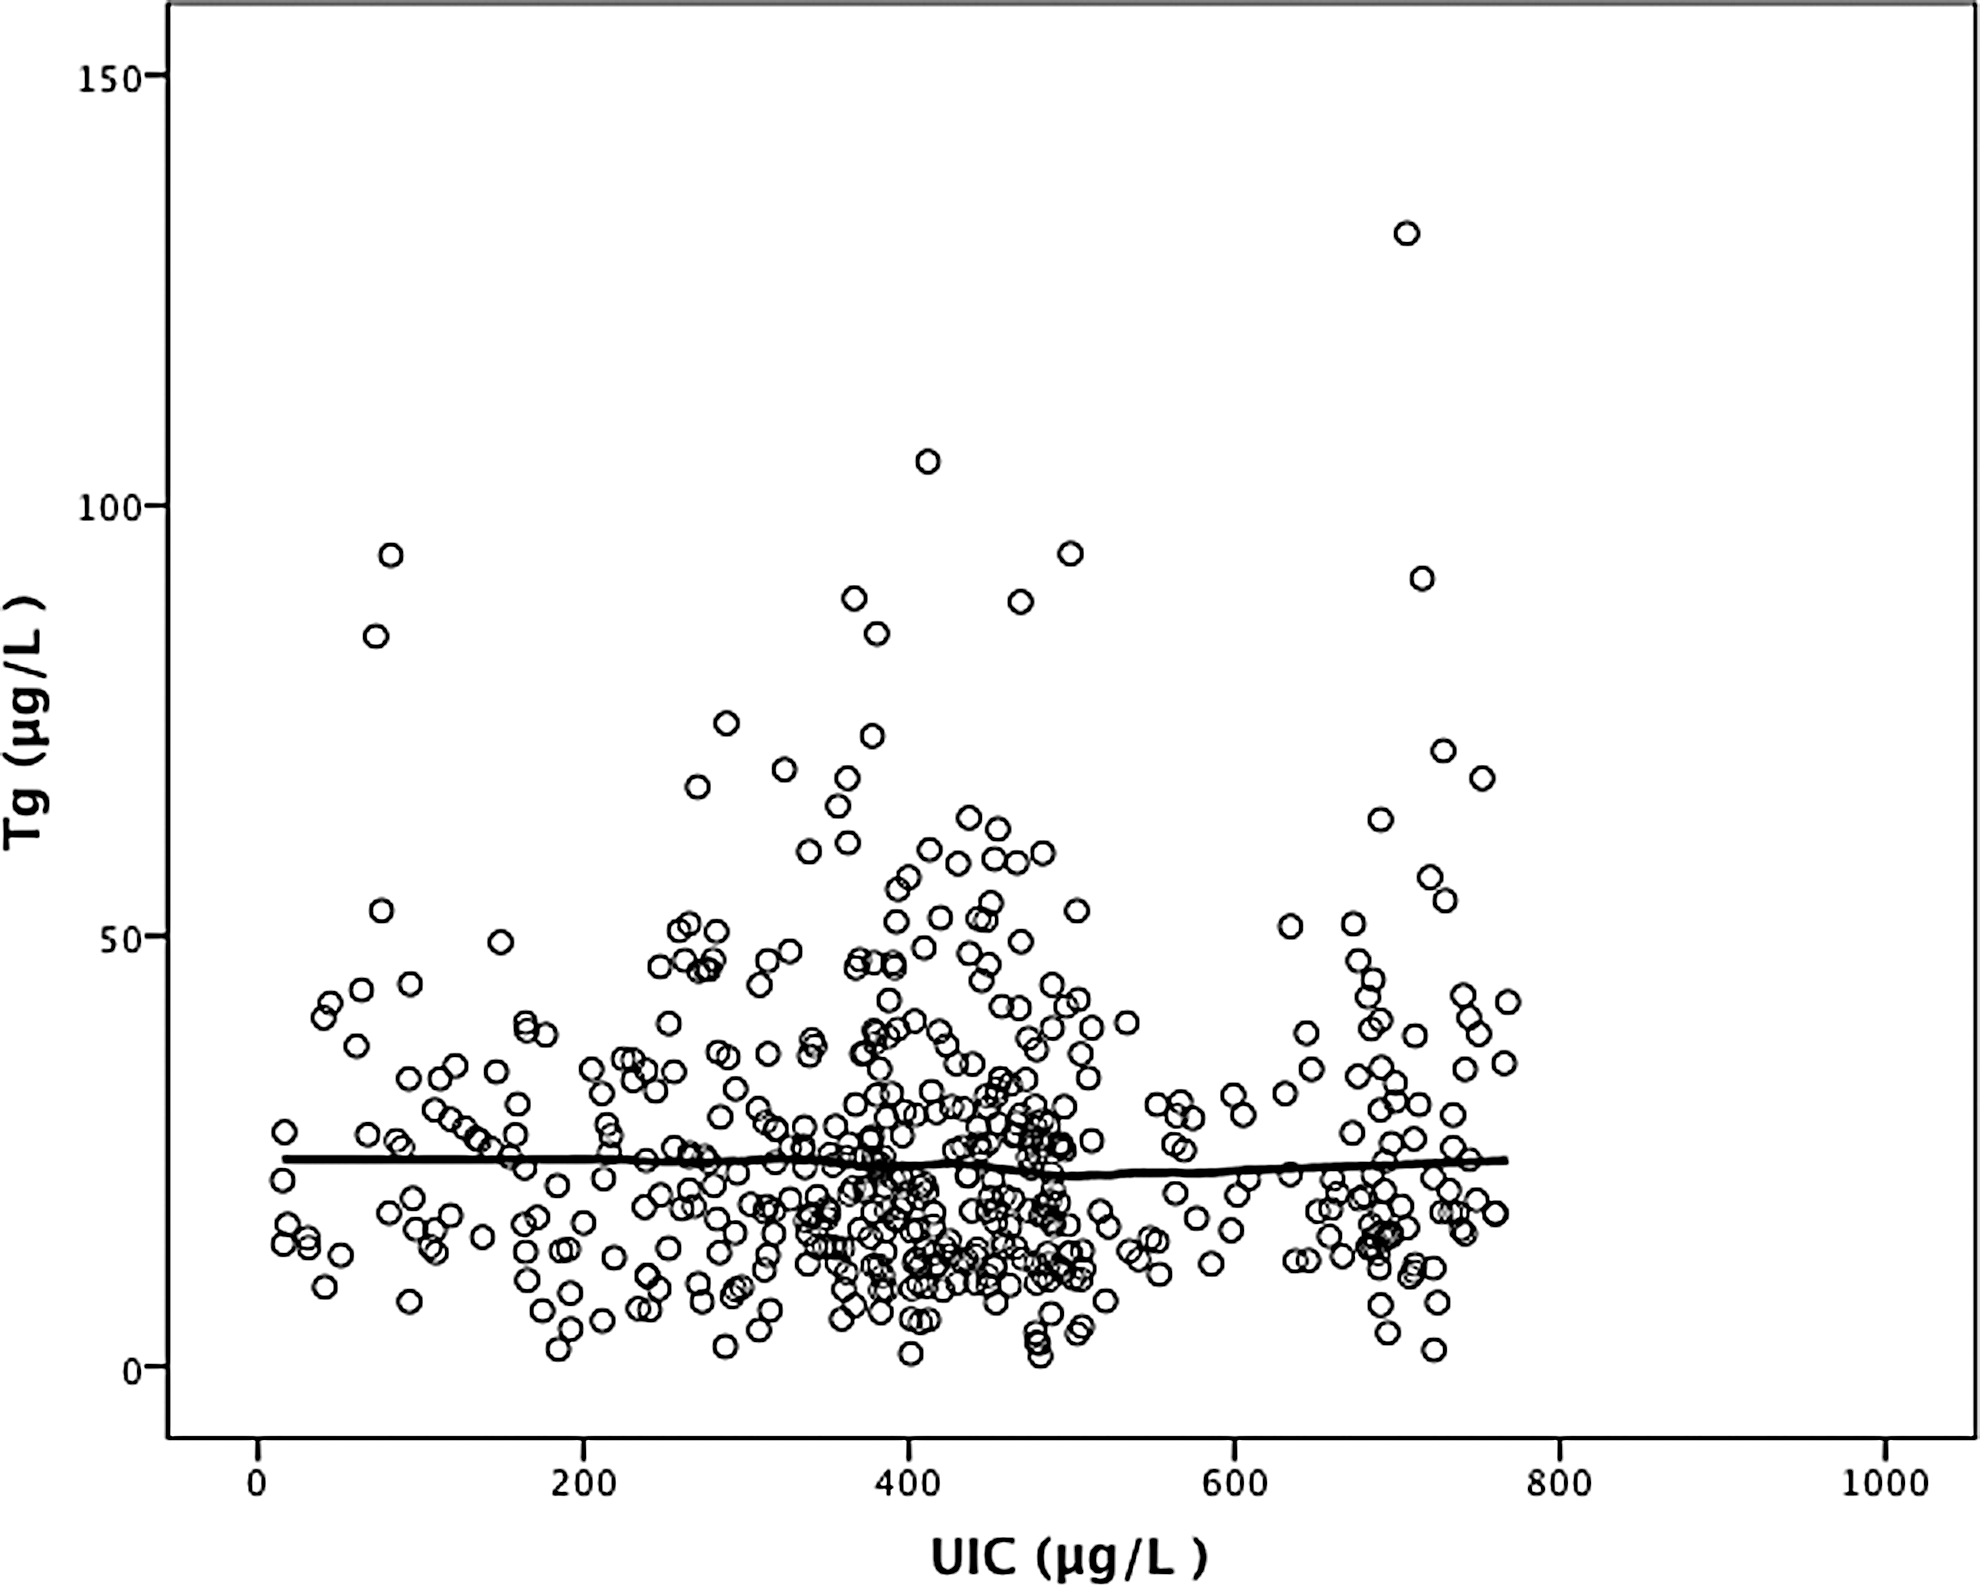
Scatter plots of UIC with thyroglobulin. Loess smoothed curves are shown as total fit.
In the multivariate analysis of the predictors of UIC (Table 4), there were significant negative associations between UIC and age (p=0.004), and there was a positive association with water source (p<0.001) and ethnicity of the infants (p=0.019) with UIC. Infants who consumed water through hand pumps (560 μg/L) had the highest median UIC, followed by well (430 μg/L) and tap water (388 μg/L). Infants of Tharu ethnicity (n=53) had the highest median UIC at 576 (227–694) μg/L, and Brahmin/Chhetri (n=296) had lowest median UIC at 390 (280–475) μg/L. There were no significant associations with district (p=0.372) or geographical locations (p=0.273) in the multivariate model of UIC. SIC was positively correlated with UIC (r=0.137) and this showed a trend toward statistical significance (p=0.09), which disappeared in the multivariate analysis.
Sunsari, Dhankuta, Morang, Jhapa, Tehrathum.
Tap, hand pump, well.
Mongolian, Brahmin/Chhetri, Tharu, Madhesi, Janajati.
Plains, hills.
In a multivariate model, TSH had positive associations with fT4 (p<0.001), Tg (p=0.008), family size (p=0.014), and water source (p=0.027). TSH was highest in infants consuming tap water 3.2 (3.0–3.4) mIU/L and lowest in infants consuming water from the village hand pump 2.26 (1.81–2.75) mIU/L. In a multivariate model of Tg, there was a positive association with TSH (p=0.001).
Discussion
This large population-based study of iodine status in infancy provides new insights into the effects of chronic iodine excess on thyroid function in late infancy. The median UIC (Table 1) was >300 μg/L, the WHO cutoff for excess in 6–12-year-old children, and 76% of infants had a UIC >300 μg/L. An iodine intake above this level was associated with thyroid dysfunction in 6–12-year-old children (10). The calculated median daily iodine intakes were ∼145 μg/day in the younger infants and ∼220 μg/day in the older infants. The WHO recommended nutrient intake (RNI) for 0–59-month-old children is 90 μg/day (1), and the adequate intake (AI) defined by the U.S. IOM (23) for the 6–12-month-old age group is 130 μg/day. Therefore, the estimated daily iodine intake in infants in the present study is 60–140% higher than the WHO RNI, and 12–70% higher than the AI. The Tolerable Upper Intake Level from the European Union and the Upper Limit (UL) from the U.S. IOM (defined as the maximum level of daily nutrient intake that is likely to pose no risk of adverse effects) for those aged one to two years is 200 μg/day. There is no recommendation from either organization for the first year. Thus, the present data suggest median iodine intakes in Nepalese infants are excessive.
The high iodine intakes in the infants are likely due to the overiodized salt present in the households. This may be providing excess iodine directly through salt added to complementary foods (6) or through high iodine concentrations in the breast milk of lactating mothers (24,25) who are consuming the salt. Breast milk iodine concentrations were not measured in this study, so it was not possible to determine which of these routes is more important in this population. Although the current Nepalese legislation stipulates an iodine level in salt at production of 50 ppm, the households in this area are consuming salt that contains a median SIC of 89 ppm, with the 75th percentile of SIC at nearly 150 ppm. Overiodized salt has caused excess iodine intake in several countries (13,26 –28). SIC was positively correlated with UIC (r=0.137), but this correlation was weak in the univariate (p=0.09) and disappeared in the multivariate analyses. The weakness of the association may be due to the well-recognized limitations of using a spot UIC as an individual indicator of iodine status (12).
In the multivariate analysis, water source was a significant predictor of UIC, with use of pump and well water correlating with higher UIC (p<0.001). High iodine in groundwater is a cause of iodine excess in regions of China (29). Samples of household water were not collected, so it cannot be excluded that high iodine from water could be a contributor to the high iodine intakes. Iodine levels in complementary foods in this area were not directly measured either, but according to their product specifications, they are not fortified with iodine (20), except for limited distribution in one district of fortified flour containing 150 μg iodine per serving. During the interviews, the local caregivers generally acknowledged that they often seasoned weaning food with household salt for taste, but this was not systematically measured. This addition of small amounts of iodized salt to weaning foods may have contributed to the high UIC in the infants.
Excess thyroidal iodine concentrations can cause a transient decrease in thyroid hormone synthesis, a phenomenon known as the acute Wolff–Chaikoff effect. This usually protects against overproduction of thyroid hormone during iodine excess (30). In adults, escape from the acute Wolff–Chaikoff effect typically occurs after several days of exposure to excess iodine. This protects against the development of hypothyroidism (30). The mechanism of escape from the acute Wolff–Chaikoff effect appears to be due to a decrease in sodium/iodine symporter (NIS) expression (31). In infants, however, the immature thyroid is often unable to escape from the acute Wolff–Chaikoff effect, making the infant more susceptible to iodine-induced hypothyroidism (2).
Excess maternal dietary iodine intake can impair fetal thyroid function and cause newborn hypothyroidism (4,32 –36). In a Turkish study of 5-day-old newborns and their mothers (n=116) who were using iodized salt in their households, the median UIC in the newborns was 279 μg/L, while it was 84 μg/L in their mothers (37). Among the newborns, 61.2% had a UIC >300 μg/L, but TSH and fT4 did not differ significantly between newborns with deficient and excessive UIC, and the authors cautioned that the high UICs in the newborns could have been due to exposure to iodine-containing disinfectants. A Canadian study reported severe hypothyroidism in a premature neonate due to exposure of iodinated skin disinfectants during the prenatal period (38). In hospitalized French infants (n=114) younger than one year of age with a median (range) UIC of 328 (12–1580) μg/L, serum TSH (n=57) was elevated in 12% (39). In Belgium, at a period when there was no national iodized salt program, median UIC was 101 μg/L in healthy infants aged six months to three years (n=244) (40). In a cross-sectional U.S. study of infants younger than three months of age (n=95), the median UIC was 197 μg/L and did not differ between infants who were exclusively breastfed or formula fed (41). In a Brazilian study of 33 infants younger than six months old, the authors attributed the high median UIC (293 μg/L) to a high mean iodine content in salt (40 ppm) (42).
In this study, 15.8% of infants had an elevated serum Tg, with two-thirds of cases occurring in infants with a UIC >300 μg/L, and 7.4% of the infants had subclinical hypothyroidism, with three out of four cases in infants with a UIC >300 μg/L (Table 3). But overall, only 3% had isolated hypothyroxinemia and <1% of infants had overt hypothyroidism. These data suggest that, in most cases, the thyroid of older infants is able to adapt when exposed to moderately excessive iodine intakes, and maintains euthyroidism. This contention is supported by the data in Figures 3 and 4, where the scatter plots of UIC with T4 and Tg show no clear relationship, while in Figure 2, the scatterplot shows a mild gradual fall in TSH values as the UIC increases to >500 μg/L. At this age, a UIC of 500 μg/L would correspond to a daily iodine intake of ∼270 μg. These are different patterns than seen in studies in older children, where the relationship between UIC and Tg (10) and TSH (43) is U-shaped, with higher TSH and Tg at both low and high chronic iodine intakes. However, because normative values for Tg during infancy are not available, values for 6–12-year-old children were used, which may have influenced the relationship between UIC and Tg in Figure 4. Only 4.8% of the infants in this study had UIC values in the deficient range, so conclusions cannot be drawn about the effects of low intakes on thyroid function at this age. Although antithyroid antibodies were not measured, these are unlikely to occur in infants; in adolescents and adults, iodine excess has been associated with increased thyroid autoimmunity (44 –49).
In conclusion, the data suggest that nearly all infants in this area have adapted to a chronic excess in iodine intake, but these high intakes are unnecessary and may cause an increase in thyroid disorders in older age groups. Because the high iodine intakes are likely due to the overiodized salt, the salt producers in this area who are producing overiodized salt should lower their fortification levels to comply with current Nepalese legislations. In iodized salt programs, regular monitoring and surveillance of UIC and household SIC is important, not only to ensure control of iodine deficiency but also to minimize the risk of iodine excess.
Footnotes
Acknowledgments
We would like to thank all the infants and their mothers or guardians who participated in the study. We are grateful to all the Primary Health Care Center chiefs (Ithahari, Dadabazaar, Rajarani, Jhirikhimti, Basantapur, Manglabaare, Pathari, Chatara, and Hasposa) and Female Community Health Volunteers (FCHV) for their kind co-operation. We are thankful to Prof. Madhab Lamsal and Mr. Basanta Gelal, Senior Demonstrator, Department of Biochemistry, B.P. Koirala Institute of Health Sciences (BPKIHS), Dharan, Nepal, for their intellectual contribution to the study. We also thank Mr. Lalit Chaudhary and Mr. Puskar Bhandari, Department of Biochemistry, BPKIHS, Dharan, Nepal, for their technical help in the study. The study was funded by the Nestlé Foundation, Lausanne, Switzerland.
Author Disclosure Statement
No competing financial interests exist.