
Abstract
Background:
Thyroglobulin (Tg), a biomarker of iodine nutrition, can be measured on dried blood spots (DBS), which simplifies collection and transport in surveys. The World Health Organization recommends DBS-Tg for monitoring iodine status in children. It could also be a useful iodine biomarker during pregnancy. However, the Tg antibody (Ab) used in earlier DBS-Tg assays is no longer commercially available. The aims of the present study were: (i) to develop a new low-cost serum and DBS-Tg sandwich enzyme-linked immunosorbent assay for assessment of Tg in population studies; (ii) to check the stability of DBS-Tg during long-term storage; and (iii) to assess within-subject variability in DBS-Tg.
Methods:
Serum and DBS samples were measured from healthy pregnant women (n = 424) with the new assays, as well as the Immulite 2000 (Siemens), including TgAb positive (n = 150) and TgAb negative (n = 274) women. DBS-Tg stability was tested over 15 weeks of storage at −20°C. Within-subject variability was evaluated over four weeks in four healthy adults.
Results:
Intra-assay and interassay variability was 4.4–7.3% and 10.1–12.9% for the new serum Tg assay, and 7.6–12.3% and 7.6–16.5% for the DBS-Tg assay. Correlation between the two serum methods was high (r = 0.68, p < 0.01). Assay performance in all women and those TgAb negative was comparable. Correlation between the new serum Tg assay and the DBS-Tg assay was high (r = 0.78, p < 0.01), and agreement expressed as a function of the average Tg concentration for the two methods (X) was 0.59X −4.59 μg/L. DBS-Tg was stable for 15 weeks stored at −20°C. Within-subject variability in DBS-Tg was 21.1%. Reagents and antibodies costs for the new serum and DBS assays are ∼US$1.
Conclusions:
These new low-cost serum and DBS-Tg assays perform well over a wide range of Tg concentrations, and the field-friendly DBS assay may be particularly useful in population studies of iodine nutrition.
Introduction
D
Tg is a more sensitive functional biomarker of iodine nutrition compared with TSH or thyroid hormones (7), and reflects iodine nutrition over a period of weeks to months (8 –11). Serum Tg is elevated in iodine deficiency and in iodine excess (7,11 –17). However, Tg measurement remains technically challenging, and interassay variability is high (5). Despite the introduction of a Tg Certified Reference Material (CRM-457), comparisons between different assays continues to be difficult because: (i) some methods are still not CRM-457 standardized; (ii) the coefficient of variation (CV) between Tg methods may be as high as 30%; (iii) most assays have a functional sensitivity limit that is close to the lower reference limit; and (iv) antithyroglobulin antibodies (TgAb) can confound Tg measurements (5,6,18,19).
Collection of DBS by a finger prick onto filter paper cards is a field-friendly way to assay Tg and thyroid hormones (17). It is particularly useful in population-based field studies in remote areas with poor infrastructure. Its advantages include: less invasive sampling, lower/reduced blood volume collection, and ease of sample handling, shipment, and storage at room temperature or cooled to 4°C. DBS-Tg correlates well with UIC and thyroid size, and can be used in conjunction with these indicators in monitoring iodine status in populations (2). The authors previously developed a two-site dissociation enhanced lanthanide fluorescent immunoassay (DELFIA) for DBS-Tg (10), and DBS-Tg was recommended by the World Health Organization in 2007 for monitoring iodine status in school-aged children (2,9). Tg could also be a valuable biomarker of iodine nutrition during pregnancy because iodine requirements and UIC reference ranges during this critical period remain uncertain. Unfortunately, the commercial antibody used for the previous DELFIA assay is no longer available. Therefore, the present study aims were to develop and test a new serum and DBS-Tg enzyme-linked immunosorbent assay (ELISA). The study also assessed the effect of freeze–thaw cycles on the stability of serum Tg, the effect of long-term frozen storage on the stability of DBS-Tg, and within-subject (day-to-day) variability in DBS-Tg.
Materials and Methods
Subjects
Blood samples were obtained from 424 healthy pregnant Thai women in their first or early second trimester of pregnancy. Their median (range) age, gestational age, weight, height, and BMI were 30 (16–41) years, 12 (4–26) weeks, 52 (36–90) kg, 1.58 (1.46–1.73) m, and 20.8 (14.3–35.4) kg/m2, respectively. Ethical committees at Wageningen University (The Netherlands) and Mahidol University (Bangkok, Thailand) approved the study protocol. Informed written consent was obtained from all subjects.
Sample preparation and storage
Whole blood samples were collected in heparin-treated Vacutainer tubes (BD Diagnostics, Preanalytical Systems). The whole blood was centrifuged at 1260 × g (Centrifuge Multifuge X3R, Thermo Scientific) for 10 min, and the serum was removed and pipetted into 1.5 mL Eppendorf tubes. The serum was stored until analysis at −20°C. For the DBS samples, a drop of pendulant blood was spotted from a finger prick onto filter paper cards (Whatman 903, GE Healthcare) and the spots were allowed to dry at room temperature for 24 h before they were stored in sealed plastic bags at +4°C until analysis.
Chemicals and materials
Chemicals
Distilled water (18 Ωm) was used for the preparation of all buffers and reagents. The coating buffer—phosphate-buffered saline (PBS; pH 7.2 ± 0.3)—consisted of 0.15 M NaCl (VWR BDH Prolabo) and 0.01 M phosphate buffer (Na2HPO4*12H2O and NaH2PO4*H2O, VWR BDH Prolabo). The wash buffer (WB; pH 7.2 ± 0.3) consisted of 0.15 M NaCl, 0.01 M phosphate buffer, and 0.1% Tween® 20 (Polysorbat, VWR BDH Prolabo). TMB liquid substrate supersensitive (T4444 Sigma-Aldrich) was used to produce a soluble end product that is blue in color and can be read spectrophotometrically. The TMB reaction was stopped with 1 M H2SO4 (95–97%; Sigma-Aldrich).
Antibodies
A monoclonal mouse Tg, IgG2a 5F9 (2TG12cc, HyTest Ltd.), and a monoclonal mouse antihuman Tg horseradish peroxidase (HRP)-conjugated, IgG2b 5E6 (2TG12ccC, HyTest Ltd.), were used. The capture and detection antibodies were diluted in PBS to a concentration of 0.25 μg/well and 0.04 μg/well, respectively.
Calibrators and controls
Serum control samples (Liquicheck Tumor Marker Control, Bio-Rad, LOT.19950 and LOT.19970) were used as standards for the serum and DBS-Tg assays. In-house samples were used for quality control (QC1 and QC2) at 21.3 μg/L and 46.8 μg/L for serum, respectively, at 20.4 μg/L and 47.4 μg/L for DBS.
ELISA procedure for serum Tg
Each well of the 96-well plate (MaxiSorp C-shape, Nunc) was coated with 100 μL diluted capture antibody. The plate was covered and incubated overnight at 4°C. The following day, the plate was emptied by inversion over a sink and washed five times by pipetting 300 μL/well wash buffer, and the remaining liquid was tapped out into a sink. After the last wash, any remaining wash buffer was removed by tapping the inverted plate on a paper towel. Then, 100 μL diluted serum, controls, calibrators (1:10), and blank were added to the wells. The Liquicheck Tumor Marker Controls were used to obtain a calibration curve with concentrations of 4.84, 10, 20, 51.4, and 129.0 μg/L (Table 1). Standard solutions, blank, serum samples, and quality controls were applied in duplicates and, to minimize bias, were placed in different positions on the plate. The plate was incubated for 2 h at room temperature and then washed five times as described previously. Then, 100 μL diluted HRP-conjugated antibody was added to each well. After incubation for 1 h at room temperature, the plate was washed five times, and 100 μL TMB was added to each well. After sufficient blue color development (defined as a pale blue color that was stable and unchanging, usually occurring after ∼20–25 min), the reaction was stopped by the addition of 50 μL/well of 1 M H2SO4. The optical densities (ODs) were read at a wavelength of 450 nm with the reference wavelength set at 630 nm (PowerWave HT Microplate Spectrophotometer, BioTek).
DBS, dried blood spots.
ELISA procedure for DBS-Tg
The serum Tg ELISA was adapted to work with DBS samples. The materials, reagents, antibodies, calibrators, and quality-control samples were the same as the one for the serum Tg ELISA. Whole blood was collected from healthy individuals in heparin-treated BD Vacutainer tubes and centrifuged at 1260 × g for 10 min, and the plasma was removed before adding 0.9% NaCl to the red blood cells and centrifuging the solution at 1260 × g for 10 min and removing the supernatant. This washing step was repeated four times. Calibrators and controls were then added to the washed erythrocytes and rotated in a blood mixer for 10 min, and then 50 μL were spotted onto filter paper cards and air-dried for 24 h at room temperature. Calibrators with concentrations of 0, 5.48, 10, 20, 51.4, and 100 μg/L (Table 1) and controls with concentrations of 20.4 and 47.4 μg/L were used. Each well of the 96-well plate was coated with 100 μL capture antibody. The plate was covered and incubated for 6 h at room temperature. After 6 h, the plate was emptied by inversion over a sink and washed five times by pipetting 300 μL/well wash buffer and then slinging the buffer out into a sink. After the last wash, any remaining wash buffer was removed by tapping the inverted plate on a paper towel. After the coated plate was washed, a whole blood spot 6 mm in diameter was punched, and 150 μL buffer solution was added to the wells. Calibrators, blank, samples, and quality controls were applied in duplicates, and were placed in different positions on the plate. The plate was incubated for at least 16 h at 4°C and washed five times as described previously, and 100 μL of diluted HRP-conjugated antibody was added to each well. The plate was incubated for 1 h at room temperature and then was washed five times. Finally, 100 μL TMB was added to each well. After 20–25 min, the reaction was stopped by the addition of 50 μL/well of 1 M H2SO4. The ODs were read at 450 and 630 nm.
Validation of the serum and DBS ELISA assays for Tg measurement
To test the new serum assay, serum samples were analyzed from 424 healthy pregnant women with the new assay and with the Immulite 2000 (Siemens Health Diagnostics). The DBS assay was validated by comparing it to the new serum Tg assay in a subsample (n = 93) of DBS collected from the pregnant women. The optimization steps for the new serum and DBS assay for Tg can be found in the Supplementary Data (Supplementary Data are available online at
TgAb measurement
Serum TgAb concentrations were measured using the Immulite 2000 TgAb kit (Immulite 2000, Siemens). The manufacturer's specified reference range is from non-detectable to 40 IU/mL.
Study of Tg stability
To test the stability of serum Tg after repeated freeze–thaw cycles, serum Tg controls (QC1 and QC2) were measured in duplicate before and then again after eight freeze–thaw cycles. To assess the effect of long-term storage at −20°C on DBS-Tg, DBS-Tg controls (QC1 and QC2) were measured in duplicate every week for a total of 15 weeks.
Study of within-subject (day-to-day) variability
For the study of within-subject (day-to-day) variation in DBS-Tg, four healthy young adults were recruited with no history of thyroid disease. Mean ± SD age, weight, height, and BMI were: 31.2 ± 4.5 years, 59.9 ± 14.3 kg, 1.68 ± 0.1 m, and 21.0 ± 3.4 kg/m2, respectively. Finger-prick blood sampling was done between 2.00 and 2.30 pm, and samples were obtained daily during the first week and then three times each week for a subsequent three weeks. A total of 14 specimens were drawn from each subject. All samples were collected and analyzed by the same trained individual (S.S.) to reduce pre-analytic and analytic measure variation.
Statistical analyses
Data were analyzed with Excel 2011 (Microsoft Corp.) and IBM SPSS Statistics for Mac v22 (IBM Corp., Armonk, NY). The normality of the data was checked before analysis with the Kolmogorov–Smirnov test and graphically by evaluating Q-Q and residuals plots, and not normally distributed data were log transformed. If the data were normally distributed, they were presented as mean ± SD or geometrical mean (confidence interval [CI]); if non-normally distributed, they were expressed as median (range). Pearson coefficient of correlation (r) and the R 2 value (square of the correlation coefficient) were calculated to examine the association between the new serum Tg ELISA assay and Immulite 2000, and between the DBS-Tg ELISA and the serum Tg ELISA. Paired t-tests were used to test the difference in Tg concentration between samples measured by the serum Tg ELISA and the Immulite 2000, as well as by the DBS-Tg ELISA and the serum Tg ELISA. Independent t-tests were used to test the difference in Tg concentration between TgAb negative and TgAb positive samples. Bland–Altman bias analysis was performed to determine the agreement between methods. For the serum Tg and Immulite 2000 methods, the average agreement between the methods was expressed as a geometric mean ratio of the individual differences (20). The limits of agreement were calculated on a log scale and back-transformed to the original scale using the equations proposed by Euser et al. (21). The agreement between the DBS-Tg and serum Tg methods was assessed by a regression approach, and the limits of agreement were obtained as a function of the mean X (20). Regression analyses were performed to assess the stability of serum Tg after several freeze–thaw cycles and the effect of long-term storage time on DBS-Tg. For the biological variability of Tg in DBS, the within-subject CV was calculated as follow: CV% = (standard deviation/mean) × 100. Differences with p < 0.05 were considered significant.
Results
Serum Tg assay performance
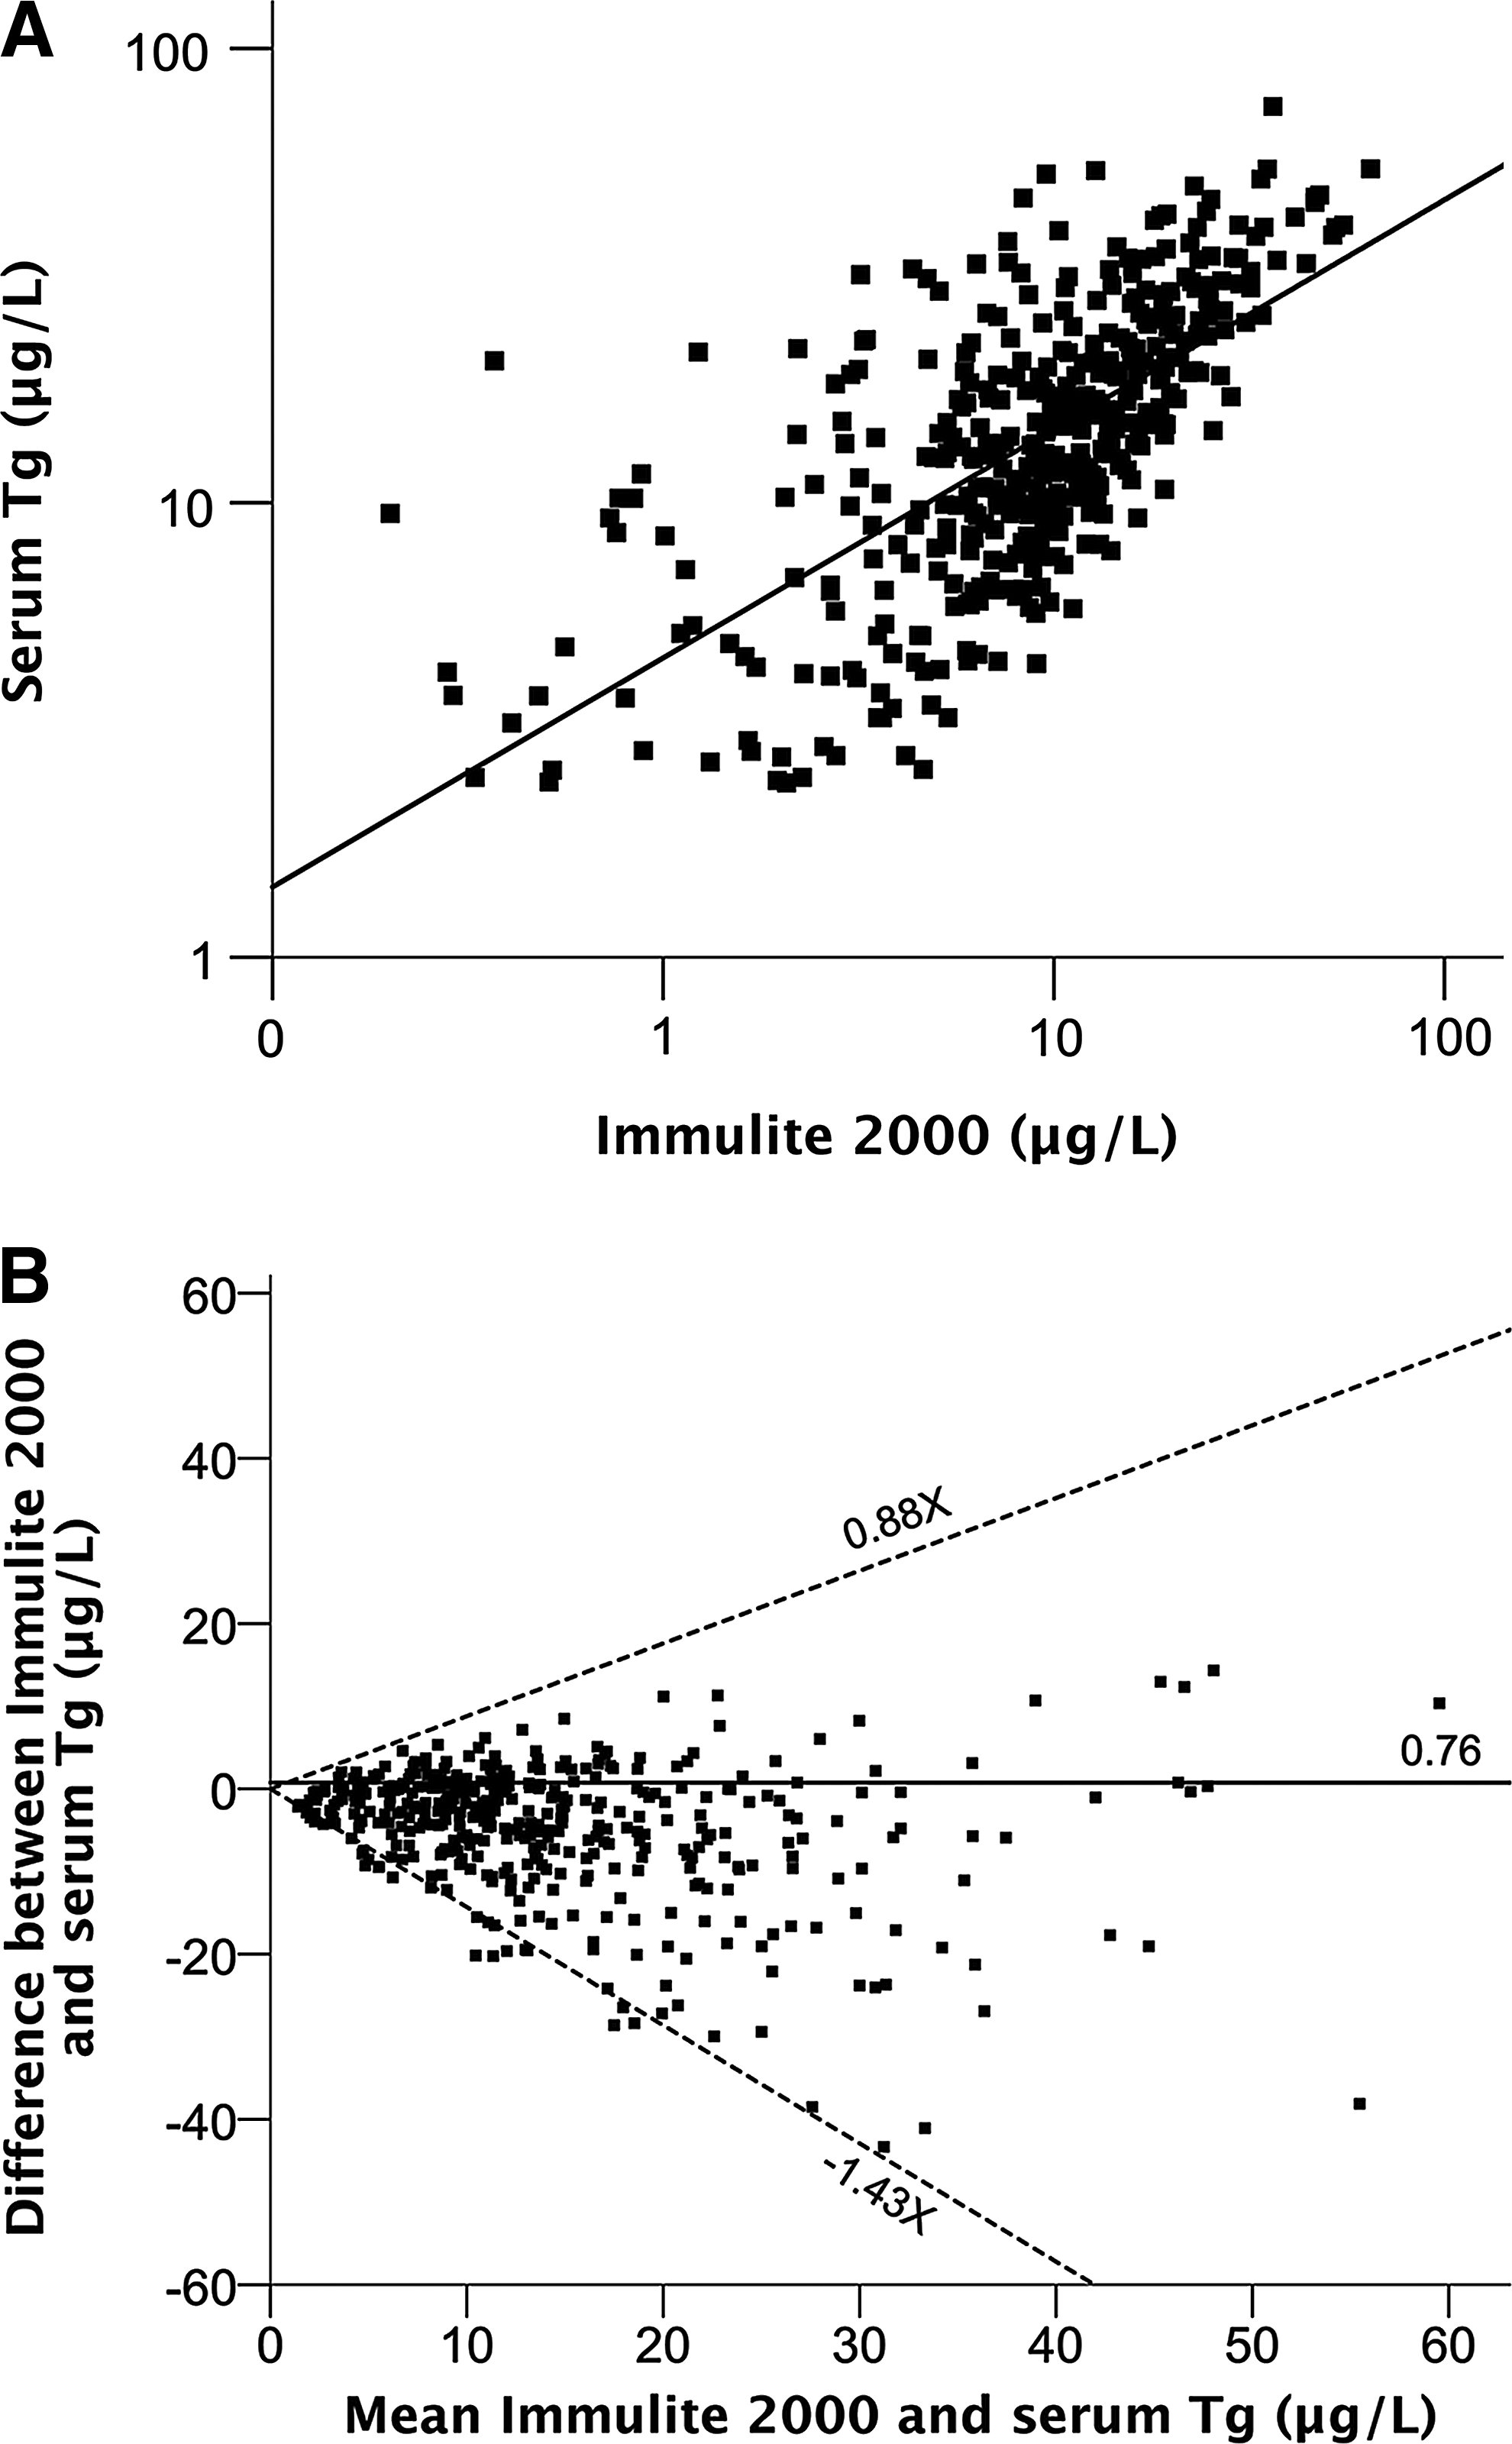
The standard curves were linear in the range 0–129.0 μg/L (Liquicheck Tumor Marker Control, Bio-Rad), and the correlation coefficients of the standard curves were always ≥0.98. The correlation between the Liquicheck Tumor Marker Controls measured by using the new serum Tg assay and by using the Immulite 2000 was r = 0.96, R 2 = 0.92 (p < 0.05; Table 2). The limit of detection (assay sensitivity) of the serum Tg assay was 2.34 μg/L. At Tg concentrations of 21.3 and 46.8 μg/L, the intra-assay CV (n = 10) was 7.3% and 4.4%, and the interassay CV (n = 10) was 12.9% and 10.1%, respectively. The intra-assay variability (n = 10) for four serum samples in the range 8.5–61.7 μg/L was between 4.2% and 5.6%. The geometric mean Tg concentration in the pregnant women (n = 424) was 13.5 μg/L [CI 12.7–14.4] with the new serum Tg assay and 8.6 μg/L [CI 7.9–9.3] with Immulite 2000 (p < 0.001). The correlation between the two methods is shown in Figure 1A (r = 0.68, R 2 = 0.46, p < 0.01). The Bland–Altman plot confirmed higher concentrations measured by the new serum Tg assay: the geometric mean ratio of the individual Tg concentrations (Immulite 2000/new serum Tg assay) was 0.76 (Fig. 1B). The difference between the two methods was proportional to the Tg concentration. The limits of agreement, expressed as a function of the mean Tg (X) for the two methods, were 0.88X μg/L and −1.43X μg/L.
(
Correlation coefficient, r = 0.96 (p < 0.05).
Correlation coefficient, r = 0.98 (p < 0.01).
Tg, thyroglobulin.
Serum Tg assay performance in TgAb negative subjects
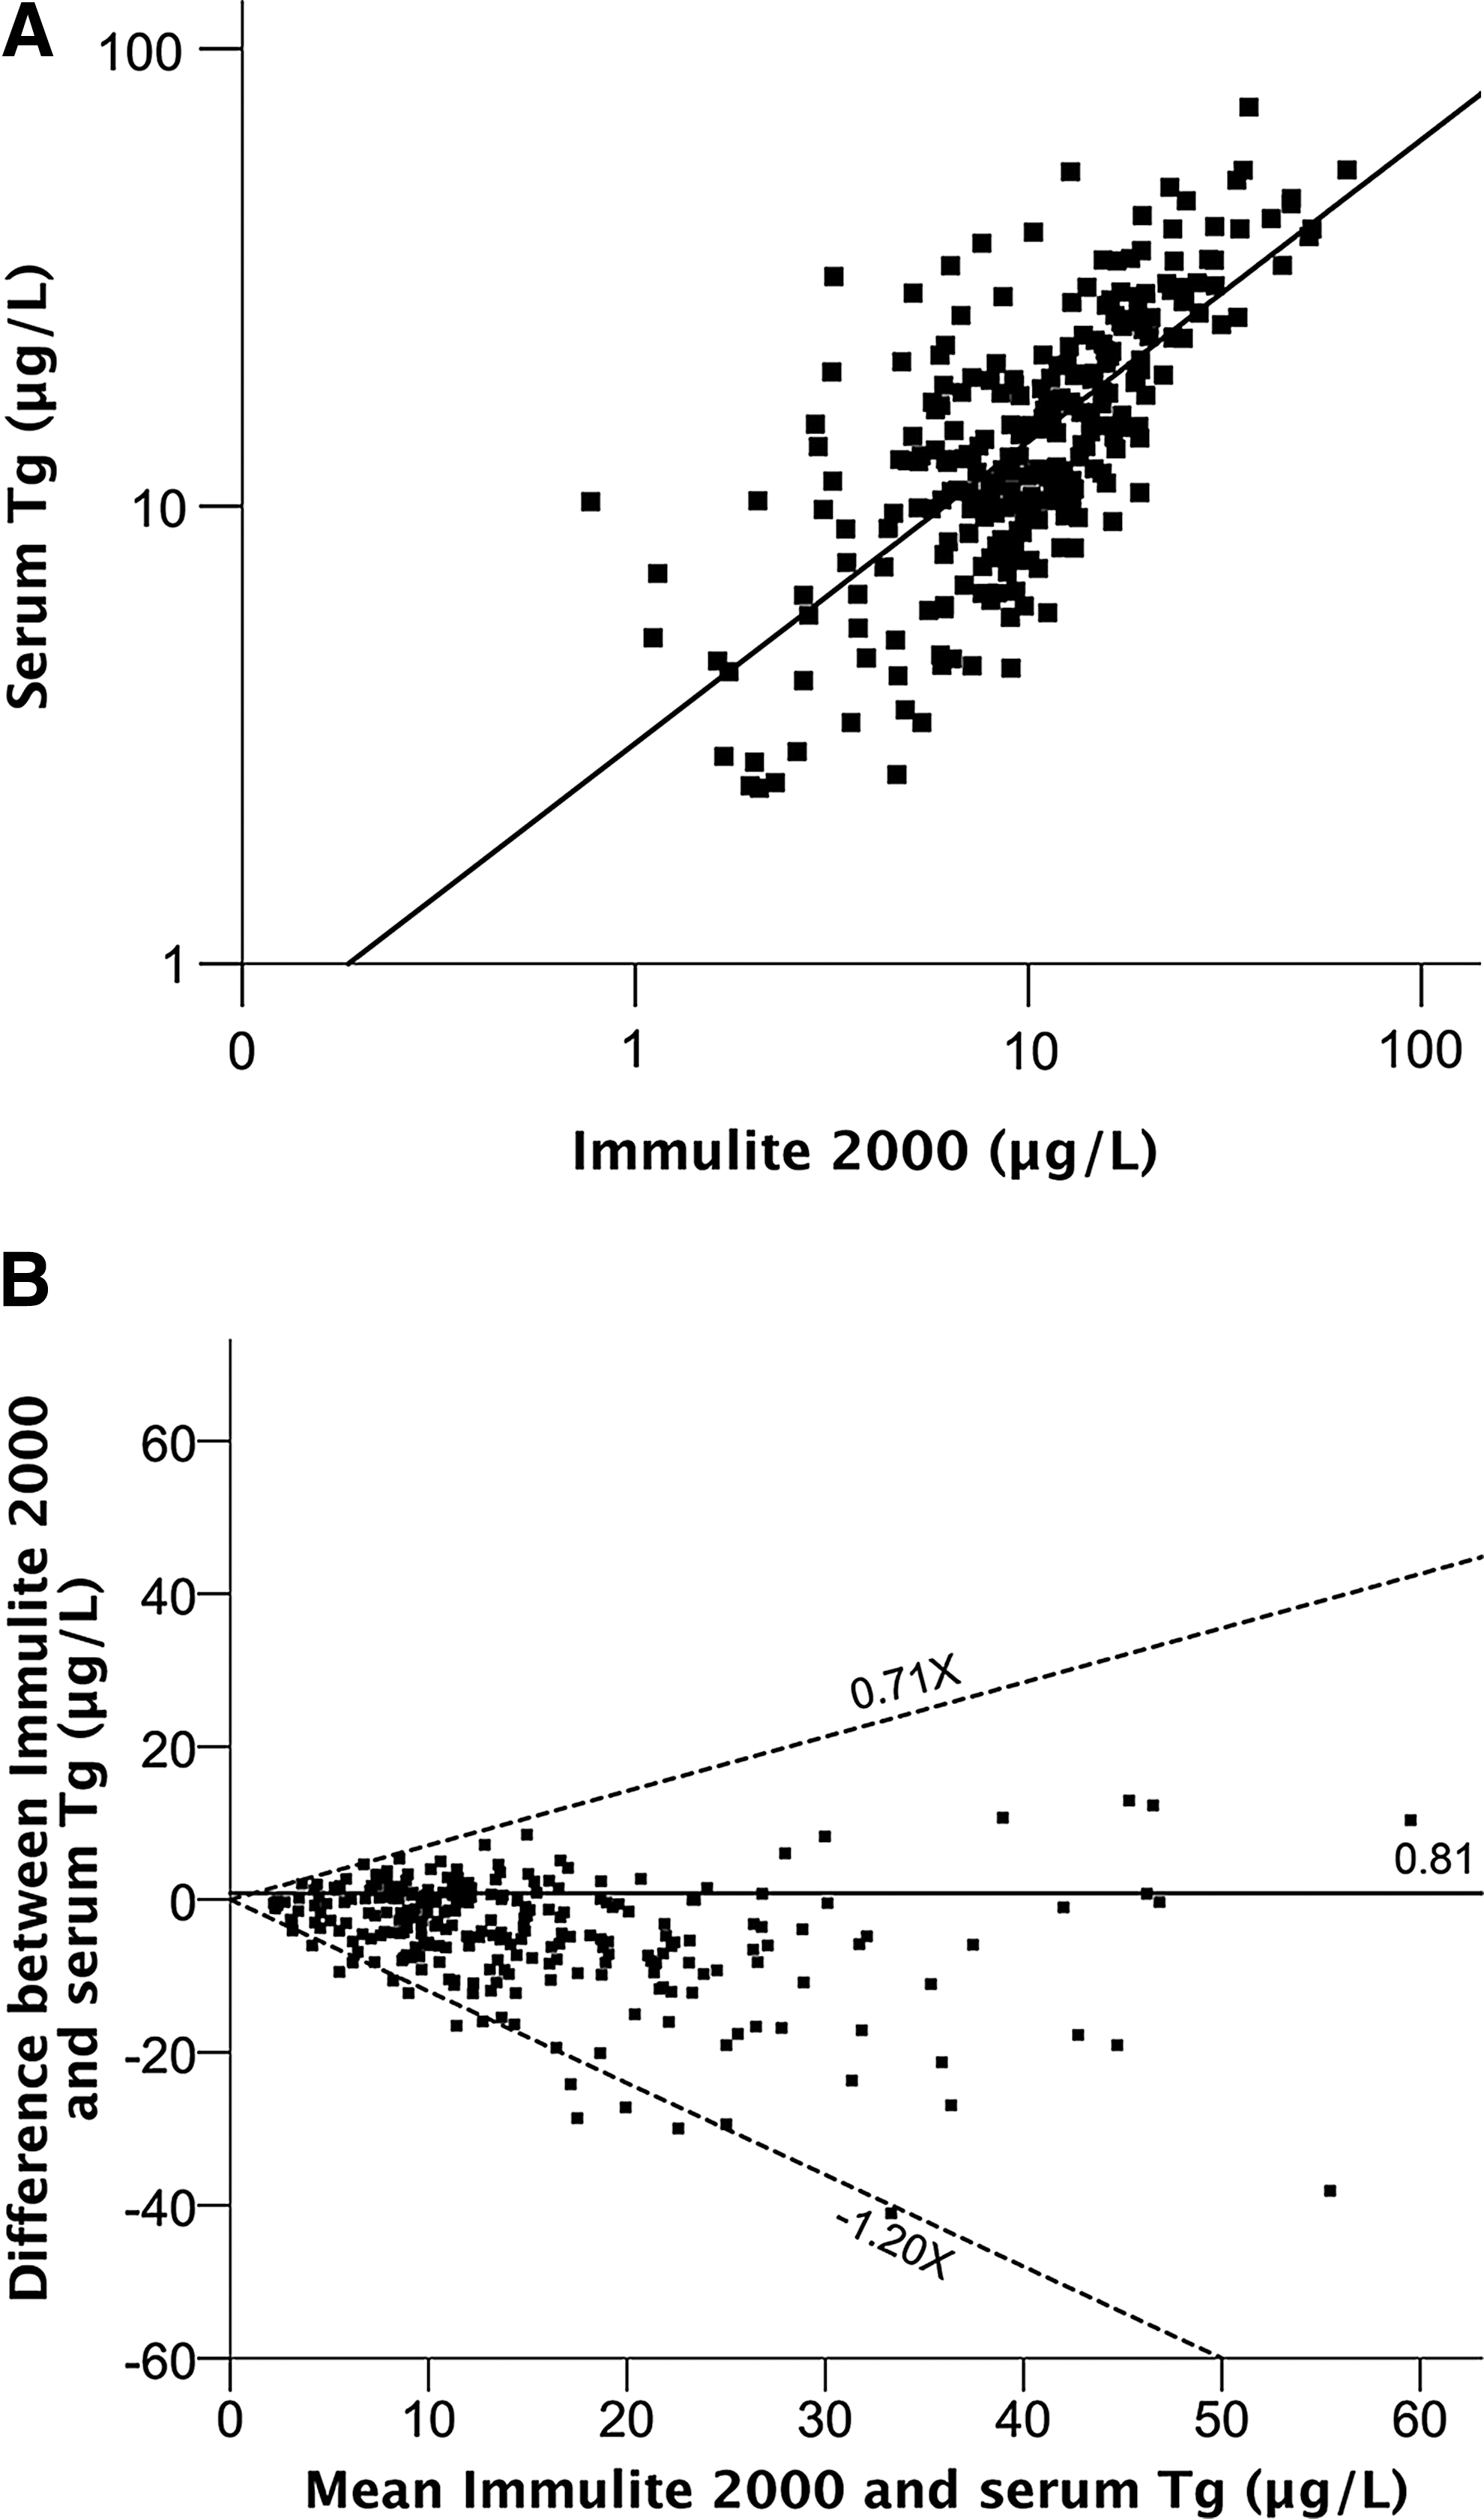
The geometric mean Tg concentration in TgAb negative healthy pregnant women (n = 274) was 13.9 μg/L [CI 12.9–14.9] with the new serum Tg assay and 10.1 μg/L [CI 9.2–10.9] with Immulite 2000 (p < 0.001). The geometric mean Tg concentration with the new serum Tg assay did not differ between TgAb negative (13.9 [CI 12.9–14.9] μg/L) and TgAb positive (12.8 [CI 11.3–14.5] μg/L; n = 150) women (p = 0.29). The geometric mean Tg concentration with Immulite 2000 differed between TgAb negative (10.1 [CI 9.2–10.9]–μg/L) and TgAb positive (6.4 [CI 5.3–7.7] μg/L; n = 150) women (p < 0.001). The correlation between serum Tg measured by using the serum Tg ELISA and by using the Immulite 2000 (Fig. 2A) was r = 0.72, R 2 = 0.51 (p < 0.01). The geometric mean ratio of the individual Tg concentrations (Immulite 2000/new serum Tg assay) was 0.81 (Fig. 2B). The limits of agreement, expressed as a function of the mean Tg (X) for the two methods, were 0.71X μg/L and −1.2X μg/L, respectively.
Effect of freeze–thaw cycles on the serum Tg assay
In the freeze–thaw cycle stability study, there was no significant change in the measured serum Tg concentrations during the eight freeze–thaw cycles (Fig. 3). The serum Tg concentrations of QC1 and QC2 over the eight cycles were not significantly different: F(1, 7) = 0.4, p = 0.54, and F(1, 7) = 0.005, p = 0.95, respectively. The β coefficients for the changes in QC1 and QC2 samples were 0.26 and 0.04.
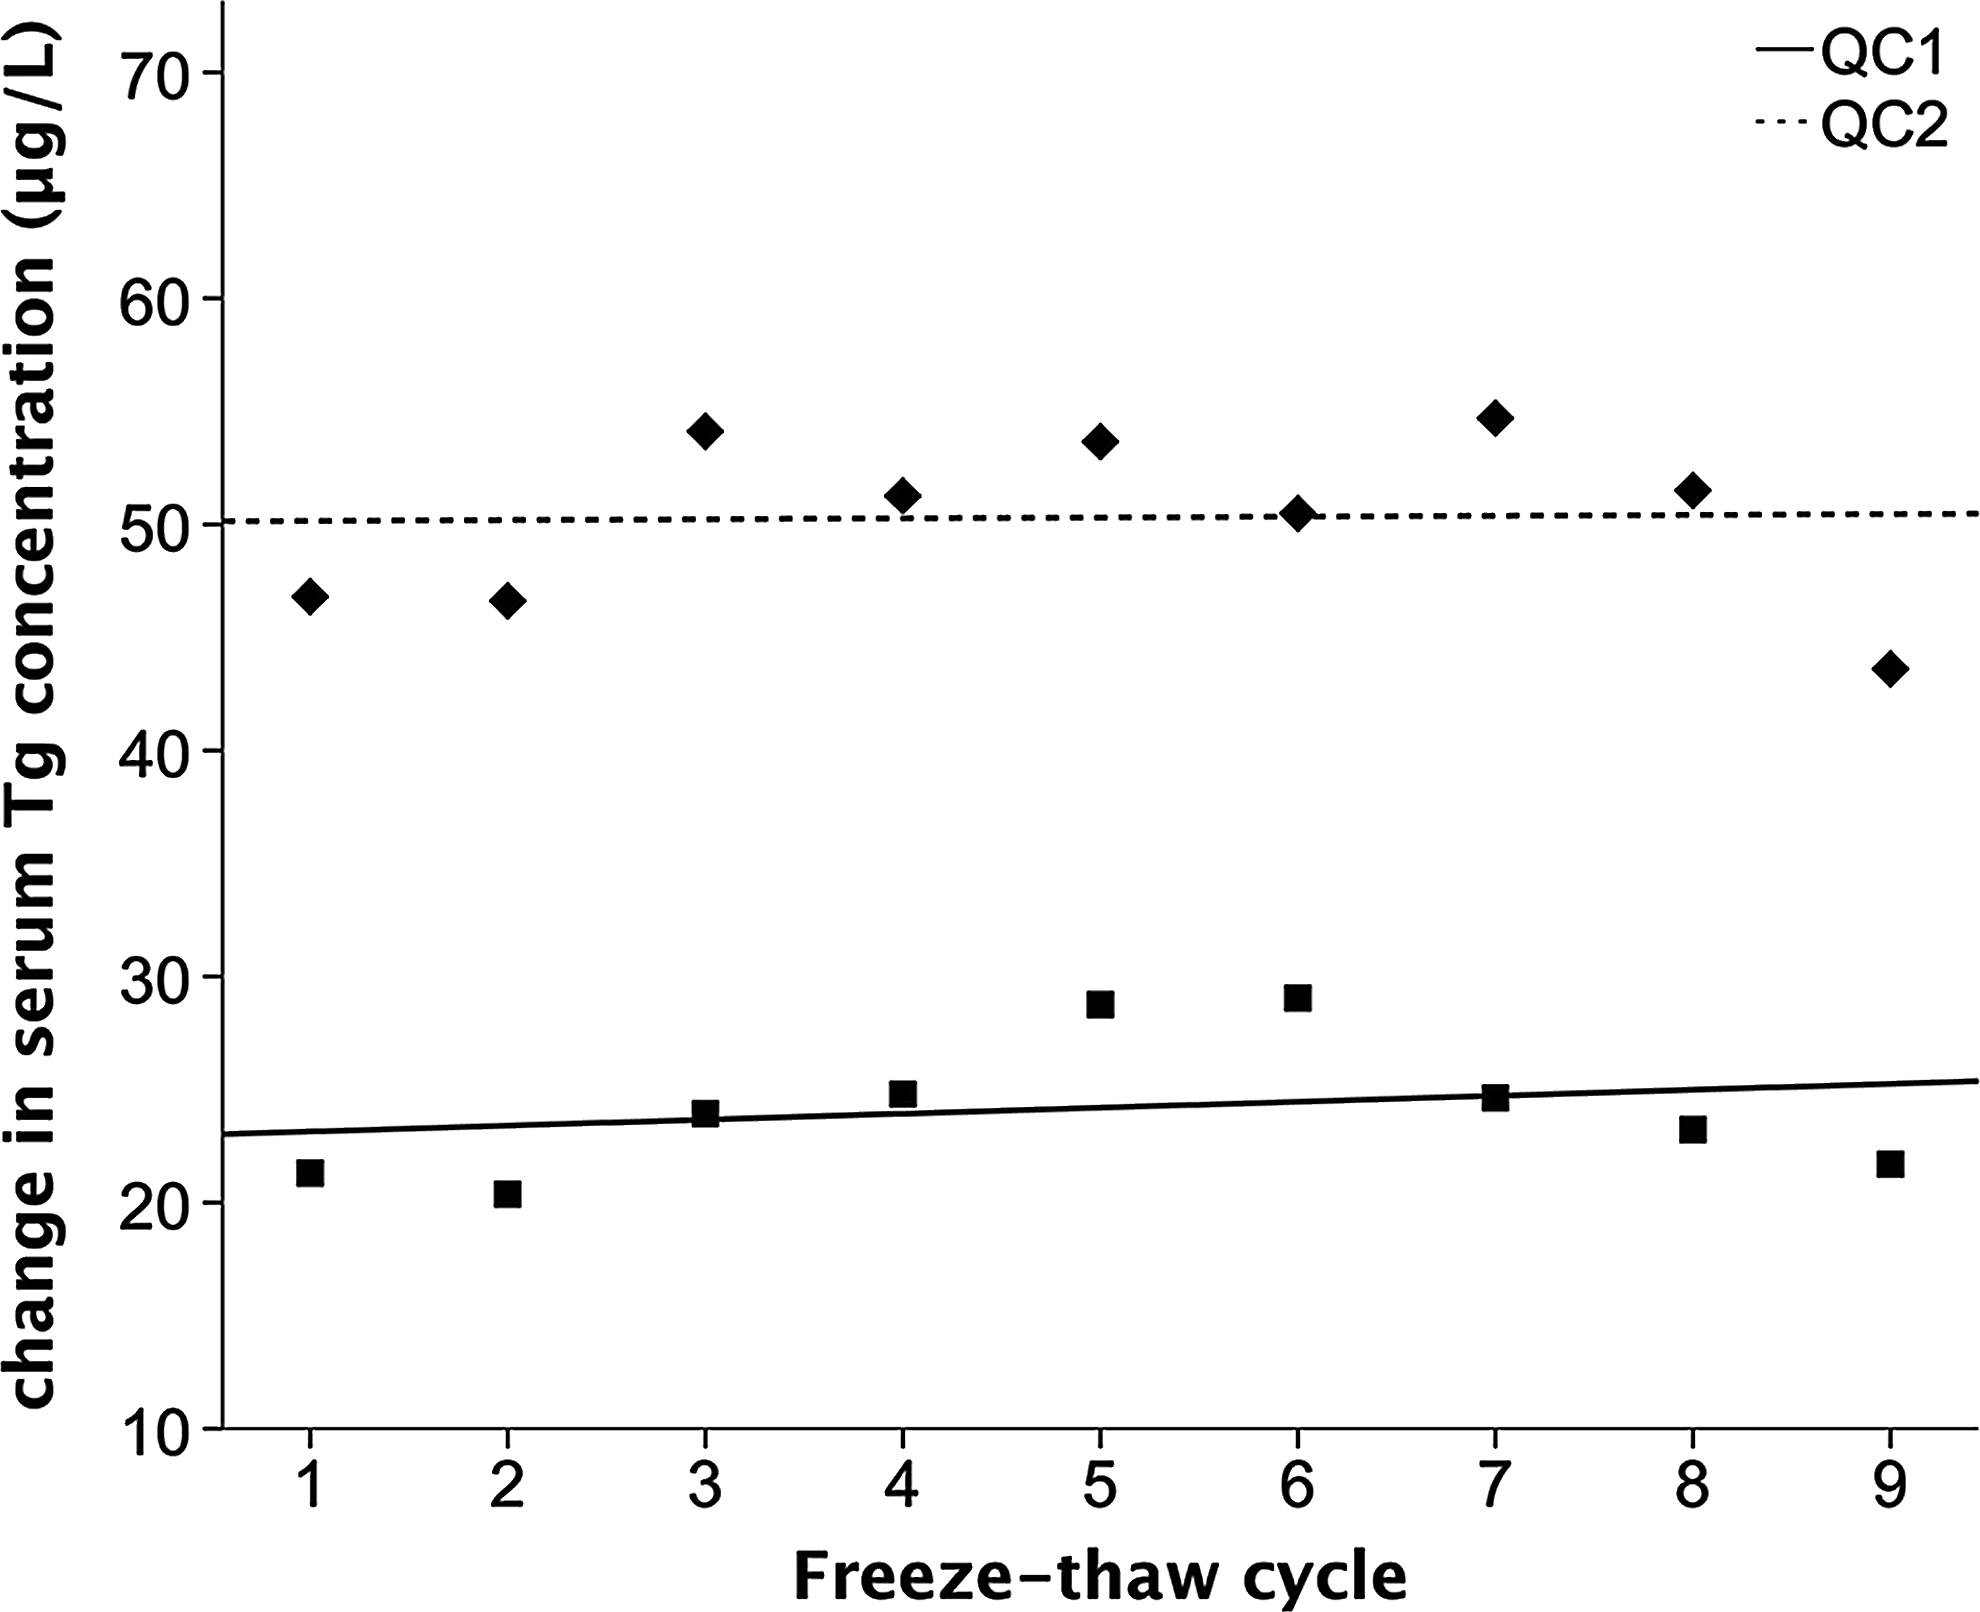
Serum Tg concentration of QC1 and QC2 measured after undergoing eight freeze–thaw cycles. Solid (R 2 = 0.06, p = 0.54) and dashed (R 2 = 0.01, p = 0.95) lines represent the regression lines.
Performance of the DBS-Tg assay
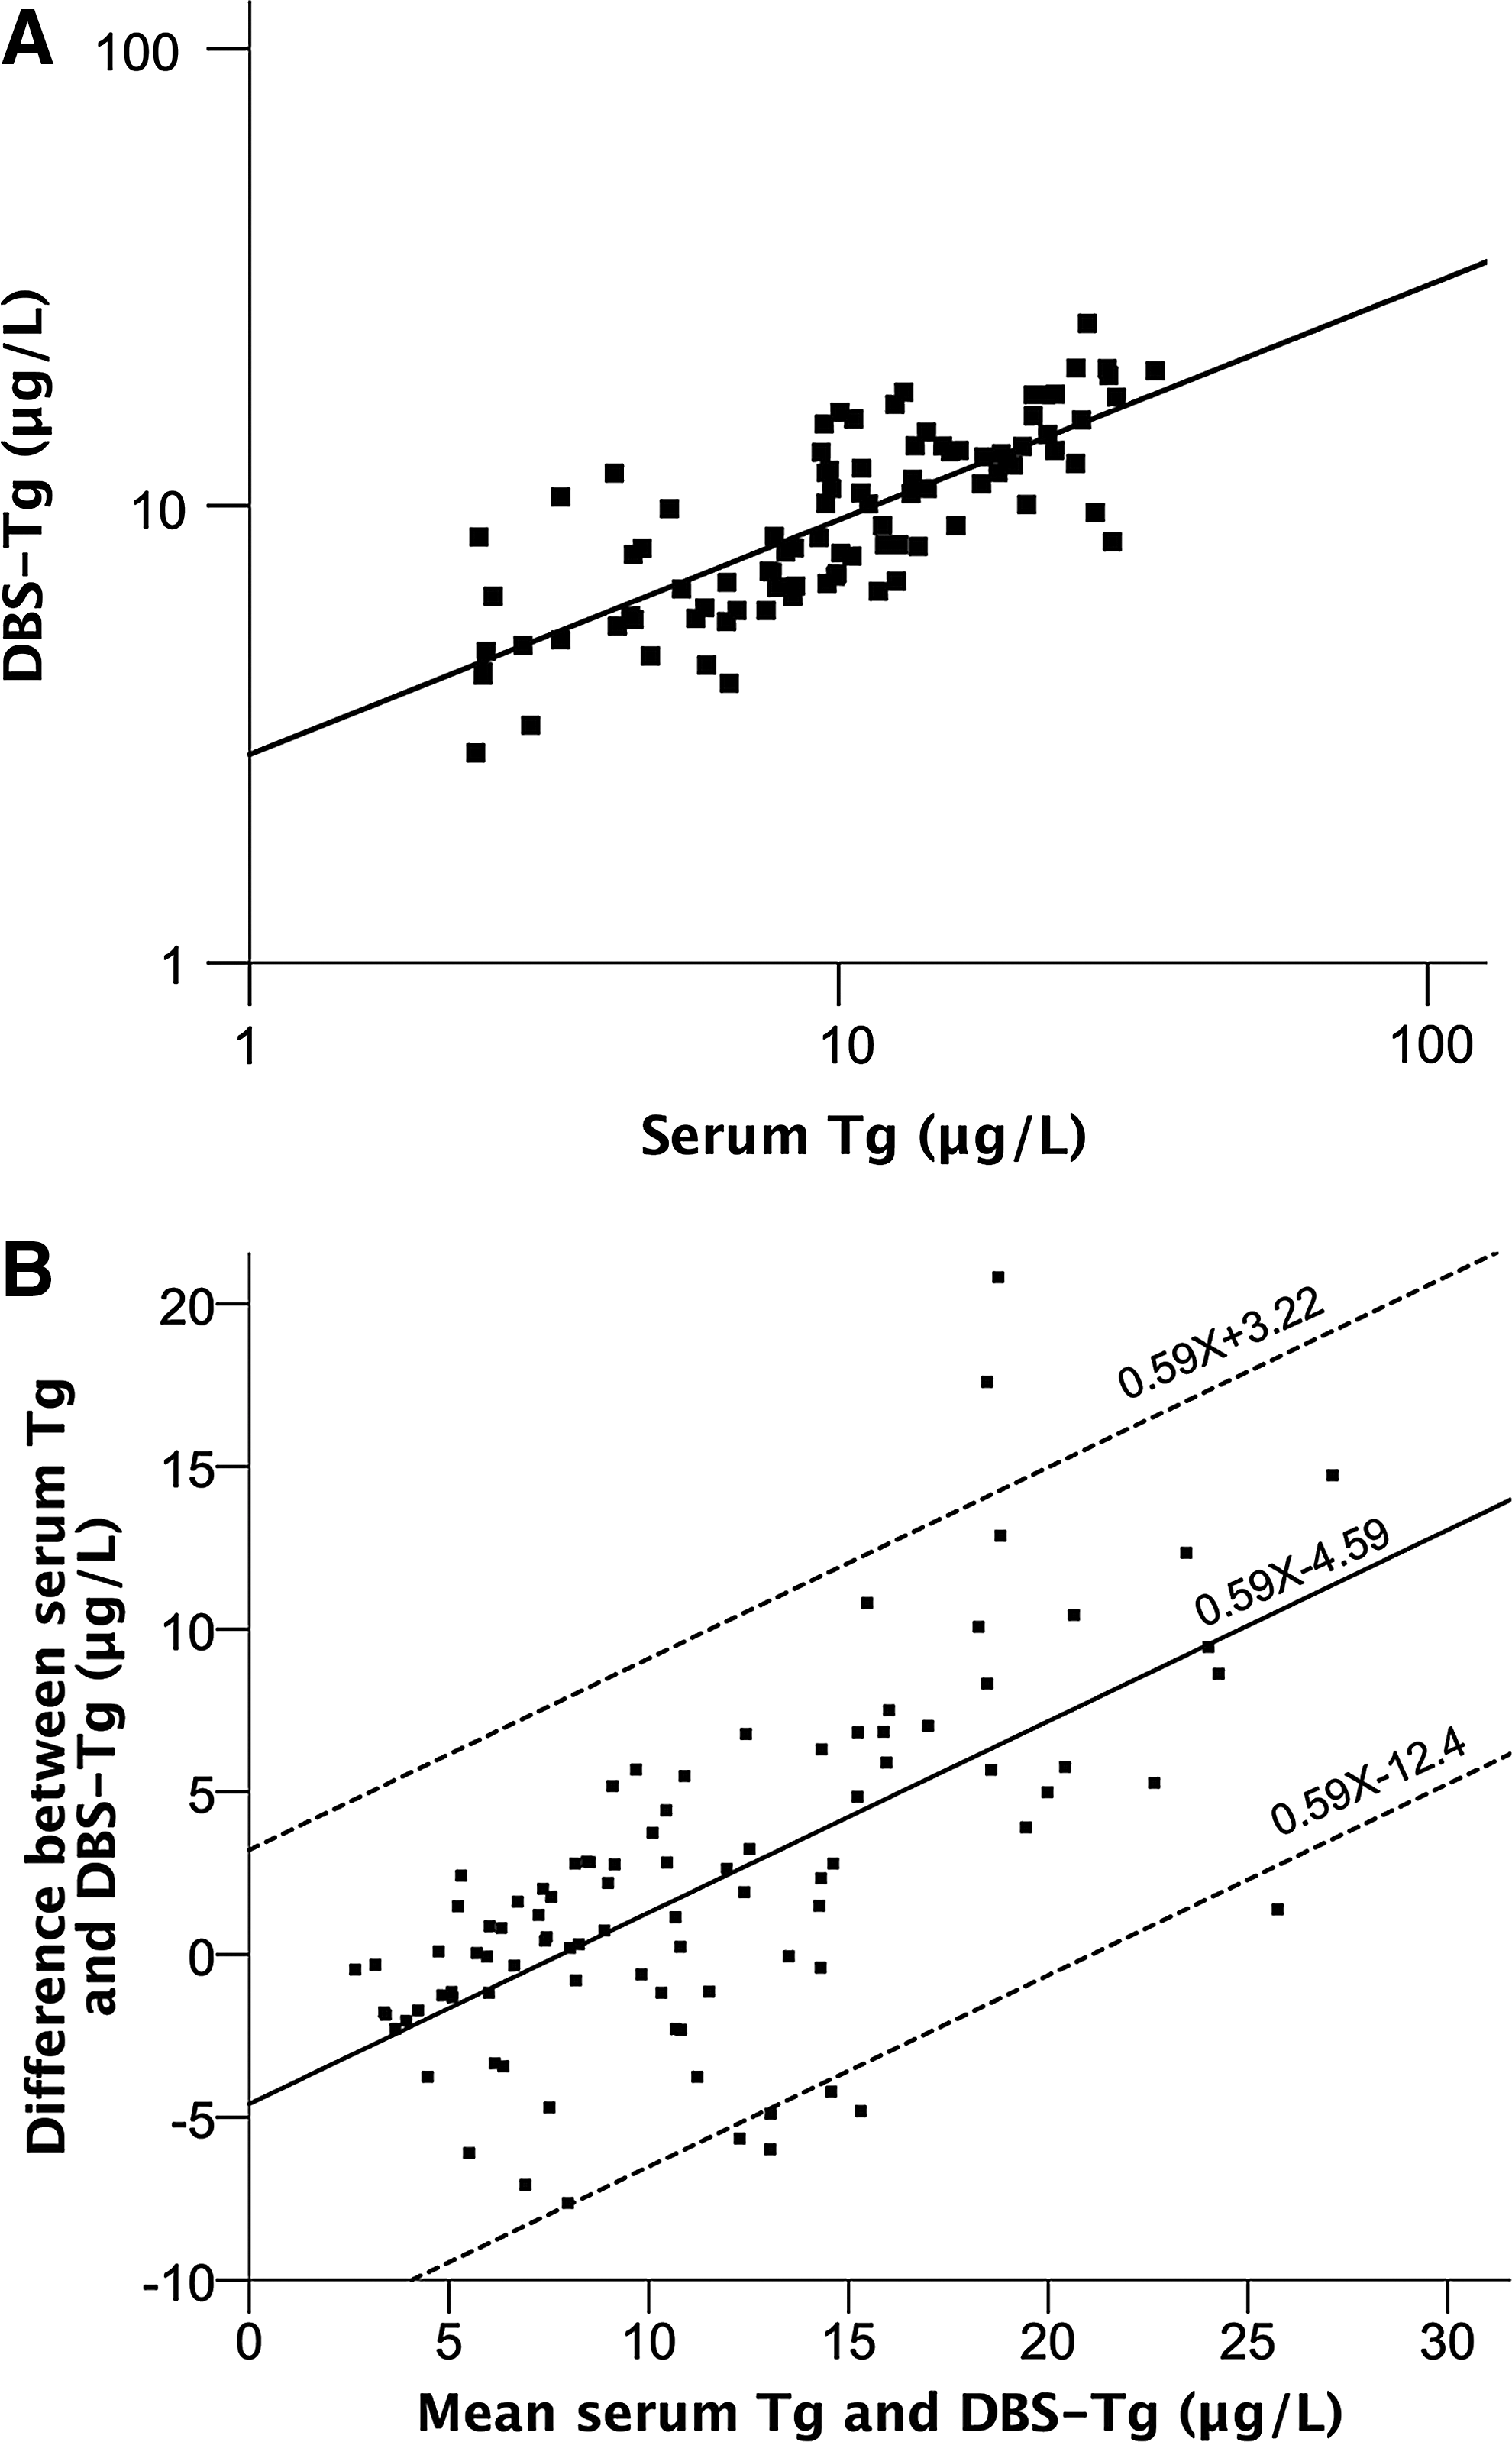
The standard curves were linear in the range 0–100.0 μg/L (Liquicheck Tumor Marker Control, Bio-Rad). The correlation coefficients of the standard curves were always ≥0.98. The correlation between the Liquicheck Tumor Marker Controls in the DBS-Tg and in serum Tg assay was r = 0.98, R 2 = 0.96 (p < 0.01; Table 2). The intra- (n = 10) and inter-assay (n = 10) variability for the quality-control samples for the DBS-Tg method were 12.3% and 7.6% at Tg concentration 20.4 μg/L and 16.5% and 7.6% at Tg concentration 47.4 μg/L. The limit of detection was 0.91 μg/L. The geometric mean Tg concentration in the pregnant women (n = 93) was 9.3 μg/L [CI 8.5–10.2] with the DBS-Tg assay, and 10.0 μg/L [CI 8.7–11.6] with the serum Tg assay (p = 0.12). The correlation between these assays (Fig. 4A) was r = 0.78, R 2 = 0.61 (p < 0.01). The difference in Tg concentrations between the methods was a function of the mean serum and DBS-Tg concentration (X; Fig. 4B). The mean difference between the methods was 0.59X −4.59 μg/L; the limits of agreement were 0.59X + 3.22 μg/L and 0.59X −12.4 μg/L.
(
Effect of storage time on the stability of DBS-Tg
Regression analysis of the results of the 15 weeks stability study showed that long-term storage at −20°C did not lead to significant change in DBS-Tg concentrations (Fig. 5). The DBS concentrations of QC1 and QC2 over the 15 weeks were not significantly different: F(1, 11) = 0.35, p = 0.57, and F(1, 11) = 1.30, p = 0.28, respectively. The β coefficients for the changes in QC1 and QC2 samples were 0.09 and −0.35.
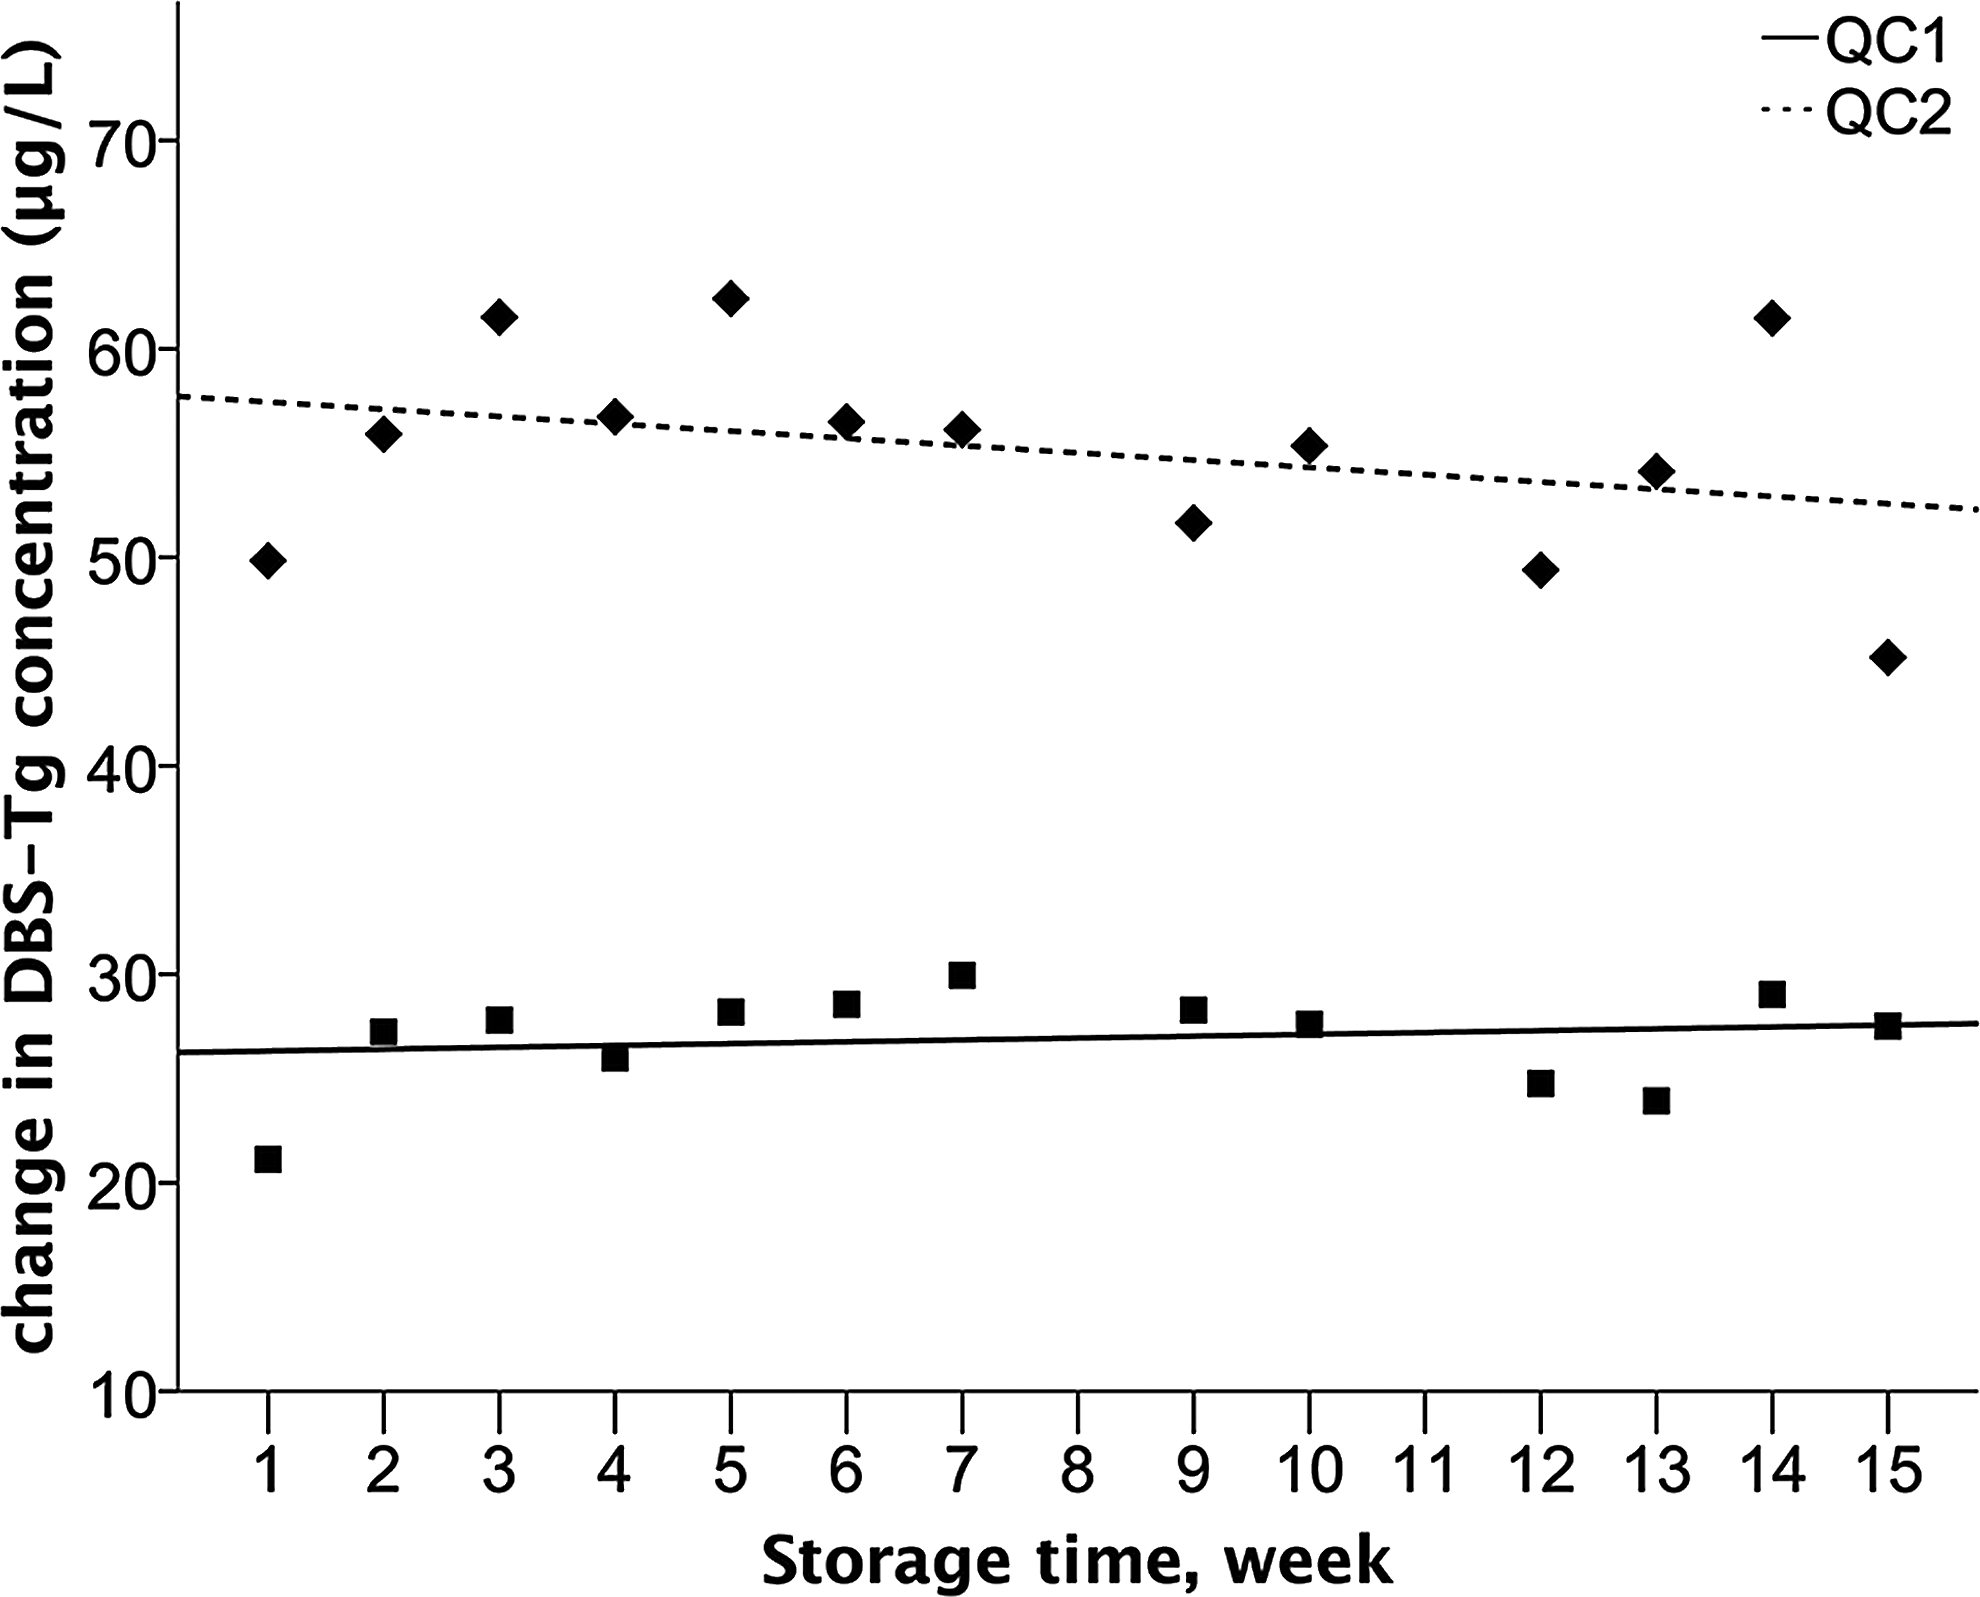
DBS-Tg concentration of QC1 and QC2 measured over 15 weeks of storage at −20°C. Solid (R 2 = 0.03, p = 0.57) and dashed (R 2 = 0.10, p = 0.28) lines represent the regression lines.
Within-subject (day-to-day) variation of DBS-Tg
The within-subject variation of DBS-Tg in the four subjects over four weeks is shown in Figure 6. The mean DBS-Tg for the subjects ranged from 11.3 to 55.5 μg/L. The mean DBS-Tg concentration of all subjects was 27.1 ± 4.7 μg/L.

Within-subject variation in DBS-Tg measured in four healthy adults over 26 days.
Repeated-measures analyses of variance showed no significant changes with time (p = 0.25). The mean within-subject CV was 21.1%, and the analytical CV was 7.5%.
Discussion
The present findings demonstrate acceptable performance of the new serum Tg assay and the new DBS-Tg assay over a wide range of Tg concentrations. The new serum Tg assay had good precision and correlated well with the Immulite 2000 (r = 0.68). There is no gold standard for the measurement of Tg in serum. The decision was made to use Immulite 2000 as the external serum Tg method because it was available in the authors' laboratory, and it is the most widely used immunochemiluminometric assay in the clinical laboratories in Switzerland. The intra- and interassay CVs were comparable to those in the manufacturer specifications of seven commercially available ELISA kits (<13% and <25%, respectively) (22 –28). The new DBS-Tg assay also showed good precision compared to the serum Tg assay (r = 0.78). The intra- and interassay CVs are comparable with those reported for the two-site DELFIA (<10% and <20%, respectively) (10) and IFMA (<10% and <15%, respectively) (16). Interassay variability in serum Tg is large, and this was evident in the present data (Fig. 1B): comparing the overall mean values from the new serum Tg assay and from the Immulite 2000 resulted in a significant bias of approximately 50%. This may be due to differences in: (i) protocols (manual vs. automatic method); (ii) antibody binding pairs (monoclonal–monoclonal vs. monoclonal–polyclonal) specific for Tg; (iii) epitope recognition; and/or (iv) possible interference by TgAb (29).
Studies conducted before the introduction of CRM-457 standards reported an interassay variability in serum Tg of 40–60% between methods (30). Current CRM-457-standardized serum Tg methods have an interassay variability of approximately 30% (5). Serum Tg was recently measured in 68 euthyroid, TgAb-negative control individuals with six currently available CRM-457 standardized methods (two RIAs and four IMAs) (31). The mean interassay variability was 37%—more than double that of the within-person variability (∼15%) (32). The introduction of CRM-457 standards did not reduce the interassay variability, and did not improve the comparability of different Tg assays. Therefore, for the new assays, CRM-457 was not used for calibration purposes, but commercially available serum control samples were used instead in order to minimize matrix effects and maximize comparability between calibrators, controls, and samples (33). However, the wide interassay variability is a major challenge for the establishment of normal reference ranges and cutoffs for serum and DBS-Tg, and this limitation needs to be addressed in future studies that examine the potential of Tg assays to monitor iodine status in populations.
The new serum Tg assay and DBS-Tg assay use the same Tg antibody. The correlation between the methods (r = 0.78, p < 0.01) suggests that the two methods can be used interchangeably in population studies. In settings where serum collection is difficult, DBS collection can be used. The agreement between the methods was tested in the normal range of Tg concentrations. The DBS-Tg assay generated higher values than the serum Tg assay at the lower end of the range, and the Bland–Altman plot showed that the difference between the methods was dependent on the Tg concentration (Fig. 4A and B). Further, in both the serum and DBS-Tg assays, higher variation was found in sample duplicates than in control duplicates, suggesting sampling of blood can be a source of measurement bias (10). Thus, as more data from the two assays become available, a correction factor can be developed to facilitate comparison of results from studies using the new serum Tg assay or the DBS-Tg assay.
The within-subject variation for DBS-Tg was 21.1%—higher than that reported for serum Tg in two previous studies (14–16%) (32,34). Jensen et al. performed a short-term study of approximately one month (34), similar in length to the present study. They included 21 healthy women, and drew blood twice weekly for a total of nine samples. The range of mean Tg was 0.2–26 μg/L. The study by Feldt-Rasmussen et al. (32) covered four months, and enrolled 10 healthy subjects: five females and five males. Blood was taken at two-week intervals during two periods for males, and at weekly intervals during two periods, one month each, for females. They drew a total of six specimens from each male and a total of 10 specimens from each female. The range of mean Tg was approximately 5–12 μg/L in males and 5–10 μg/L in females. Compared with these two studies, the present study found higher within-subject variation in Tg that may be due to greater variation in pre-analytic factors such as collection of DBS versus serum, or could be due to the different assays used. Furthermore, the sample size in the present study for the within-subject variation study was small, and the results need to be confirmed in a larger study.
It is well known that TgAb interfere with immunoassays for serum Tg and can cause falsely high or low values (35). Thus, concurrent measurement of TgAb is required in the clinical setting, that is, for monitoring of thyroid cancer patients. Detectable serum TgAb are found in approximately 5–15% of the general adult population (36 –39). The prevalence of serum TgAb in pregnant women is uncertain. The present study found a prevalence of 36.4%, while in other studies the prevalence has varied between 2.9% and 17.3% (40 –43). The discrepancy found between the present study and the others may be related to the methods used for the screening of serum TgAb and to the varying cutoffs applied to classify the subjects as TgAb positive. The geometric mean Tg concentration was significantly different between TgAb negative and TgAb positive samples measured with Immulite 2000, but not for TgAb negative and TgAb positive samples measured with the new serum Tg assay. This discrepancy may be explained by the epitope specificity of the monoclonal antibody chosen for a method, that is, by the affinity of the first antibody and by the specificity of the second antibody (5). It appears that the new serum Tg assay is less subject to TgAb interference, perhaps because its antibodies are more specific than those used in the Immulite 2000 system. In the present study, there was no improvement in the performance of the serum Tg assay when TgAb positive samples were excluded (Figs. 1 and 2). The correlation graphs showed similar equation lines and Pearson coefficients with or without TgAb positive samples. The Bland–Altman plot showed that the difference between methods and the limits of agreements with or without TgAb positive samples are comparable. These data suggest that concomitant measurement of TgAb may not be necessary in population studies measuring Tg in pregnant women. However, this issue remains uncertain and deserves further investigation. Furthermore, because the prevalence of TgAb may differ among population groups, these results may not be generalizable to children and other adults.
There are few data available on the stability of serum Tg during repeat freeze–thaw cycles. A recent study (44) suggested that serum Tg is vulnerable to freezing and thawing, and demonstrated a small decrease in Tg concentrations after three short cycles and a large decrease after subsequent cycles. In contrast, no significant change in serum Tg concentration was observed during eight freeze–thaw cycles in the present study. The current results are consistent with leading laboratory guidelines that state that repeat freezing and thawing of samples does not significantly influence serum Tg concentrations (45). The long-term stability study showed that DBS-Tg concentrations were stable for 15 weeks when stored at −20°C. The present results agree with a previous study that reported Tg in DBS samples was stable for one year when samples were stored at −20°C (9).
The new serum and DBS-Tg assays presented here may have several advantages over current assays. They are easy to perform and do not require sophisticated instruments or facilities. They require minimal amounts of serum/blood: duplicate measurements can be done using only 20 μL of serum or 100 μL of whole blood (the amount in two typical dried blood spots). In contrast, commercially available serum Tg assays usually require between 50 and 100 μL of serum (6). In the authors' laboratory, the costs for materials, reagents, and antibodies per duplicate measurement using the serum and DBS assays are only US$1–1.5 compared with commercial RIA, IRMA, IFMA, and ICMA Tg assays where the costs are typically around US$5. Moreover, the DBS-Tg assay simplifies collection and transport compared with serum Tg assays because it does not require venipuncture, centrifugation, and transport of frozen samples, which may be difficult in remote areas and in large population-based studies.
Footnotes
Acknowledgments
This work was funded by the Swiss State Secretariat for Education, Research and Innovation (SERI), Bern, Switzerland, the Human Nutrition Laboratory, Institute of Food, Nutrition and Health, ETH Zurich, Switzerland. Administrative support was provided by the European Union Horizon 2020 project EUThyroid 15.0146.
Author Disclosure Statement
No competing financial interests exist.