
Abstract
Background:
The 2015 American Thyroid Association (ATA) management guidelines for adult patients with differentiated thyroid cancer propose the use of the modified initial risk stratification and response to therapy re-stratification systems. This study was conducted to validate the practicality of the revised guidelines for predicting tumor recurrence in patients with differentiated thyroid cancer.
Methods:
Patients with papillary thyroid cancer (n = 2425) who underwent total thyroidectomy with central neck node dissection with or without modified radical neck node dissection at a single institution between October 1985 and July 2009 were retrospectively enrolled. The accuracy of three different risk-stratification strategies for predicting disease-free survival, set out in the 2009 and 2015 ATA management guidelines, was assessed: the initial risk stratification (ATA 2009-RSS), the modified initial risk stratification (ATA 2015-RSS), and the response to therapy re-stratification (ATA 2015-RTR).
Results:
After applying the ATA 2015-RSS, 258/1913 (13.5%) of patients originally designated as intermediate risk by the ATA 2009-RSS were designated as low risk. This was mainly due to the small number of metastatic lymph nodes. Recurrence was detected in 136 (5.6%) patients during follow-up. Of the 2425 cases examined, 375 were designated as low risk by the ATA 2009-RSS, with a recurrence rate of 1.1%. However, the ATA 2015-RSS designated 633 (26.1%) cases as low risk, with a recurrence rate of 0.9%. Implementing the ATA 2015-RTR predicted an excellent response in 1597 (65.9%) cases, with a recurrence rate of 1.1%. According to the proportion of variance explained (PVE), the Akaike information criterion, Harrell's c index, and integrated area under the curve, comparing the predictive accuracy of the ATA 2009-RSS, ATA 2015-RSS, and ATA 2015-RTR revealed that the ATA 2015-RTR was a superior predictor of recurrence.
Conclusions:
A proportion of patients designated as intermediate risk by the ATA 2009-RSS were designated as low risk by the ATA 2015-RSS. The ATA 2015-RTR may be the most accurate predictor of risk of recurrence.
Introduction
D
Molecular markers and clinical risk assessment with respect to PTC have also been rigorously investigated (2 –7). As a result, the clinical implications of pathological parameters such as multifocality, minimally or extensive extrathyroidal extension (ETE), and micro- and macroscopic lymph node (LN) metastases can be used to estimate a continuum of risk, with difference ranges for selected clinicopathologic features. In addition, the BRAFV600E and TERT promoter mutations have been identified as potential markers of a poor prognosis for PTC, although they are not routinely recommended for initial risk stratification (2,3). Based on these scientific advances, the newly proposed 2015 American Thyroid Association (ATA) management guidelines indicate the risk of structural disease recurrence associated with selected clinicopathologic features for the patients without structurally identifiable disease after initial therapy (8). Besides initial risk stratification, the new 2015 guidelines suggest that clinicians use the response to therapy re-stratification system attributed to previous studies about the estimated risk of recurrence based on effectiveness of initial therapy (9 –11).
Even though the above-mentioned risk-stratification system proposed by the new ATA management guidelines cannot be used to make a definite decision at the preoperative stage, it is postulated that the new guidelines will improve the ability to predict tumor progression and recurrence. To test this, the predictive accuracy of three risk stratification systems was compared: (i) the initial risk stratification set out in the 2009 ATA management guidelines (ATA 2009-RSS), (ii) the modified initial risk stratification set out in the 2015 ATA management guidelines (ATA 2015-RSS), and (iii) the response to therapy re-stratification set out in the 2015 ATA management guidelines (ATA 2015-RTR). To achieve this, data were retrospectively collected from a large number of patients with PTC who underwent thyroidectomy at a single institution, and the predictive accuracy of the three systems was examined using quantitative statistical methods.
Materials and Methods
Patients
The study enrolled 2425 patients with PTC who underwent total thyroidectomy between October 1985 and July 2009. Of the 2425 patients, 1423 (58.7%) underwent total thyroidectomy with prophylactic or therapeutic ipsilateral central compartment neck node dissection (CCND), and 1002 (41.3%) underwent total thyroidectomy with prophylactic or therapeutic ipsilateral CCND and therapeutic modified radical neck node dissection due to clinically suspicious or pathologically confirmed N1b nodes. The mean follow-up period was 88.0 months (range 60–265 months). The study was approved by the Institutional Review Board, which waived the requirement for informed consent due to the retrospective design of the study.
Postoperative management and follow-up
After excluding patients with pathologic T1N0M0 PTC, 2314 (95.4%) patients received radioactive iodine (RAI) for remnant ablation at four to eight weeks following surgery. During RAI treatment, serum thyroglobulin (Tg) and antithyroglobulin antibody (TgAb) concentrations were measured after stimulation by thyrotropin (TSH), and post-ablation whole-body scans (WBS) were performed.
To assess disease status, serum Tg and TgAb levels were measured at three and six months after initial treatment and then annually thereafter. In order to evaluate the thyroid bed and central and lateral nodal compartments, neck ultrasound was routinely performed at 6–12 months and then periodically thereafter. Follow-up diagnostic RAI WBS was performed at 6–12 months after adjuvant RAI therapy in patients with a high or an intermediate risk of persistent disease. Chest X-ray, computed tomography (CT), or 18-fludeoxyglucose F-positron emission computed tomography (18FDG-PET/CT) was considered when assessing high-risk PTC patients with an elevated serum Tg level (generally serum Tg >10 ng/mL after TSH stimulation or Tg >1 ng/mL after TSH suppression) or increasing TgAb levels with or without negative RAI WBS imaging.
Among the study patients, 387 (15.6%) presented with a biochemical and structural incomplete response with increased serum Tg levels at one year after surgery. Further imaging studies, including neck ultrasound (100%), RAI-WBS (95.4%), chest X-ray (33.6%), chest CT (15.0%), neck CT (14.2%), and PET/CT (22.0%), were performed in accordance with the follow-up protocol. Recurrence was confirmed when disease sites were found to have local LN metastasis, defined as a positive cytology in a fine-needle aspiration biopsy, or when distant metastasis was confirmed by a biopsy or imaging.
Risk stratification
Patients were stratified according to the ATA 2009-RSS and ATA 2015-RSS. The initial risk stratifications were based on postoperative histopathological, laboratory, and imaging findings. However, data regarding BRAFV600E and TERT promoter mutation status were not available because molecular tests for these mutations were not routinely recommended. ATA 2015-RTR was assessed according to the results of imaging and Tg/TgAb levels measured one year after initial therapy.
Statistical analysis
Continuous, quantitative data are reported as the mean ± standard deviation (SD), and categorical, qualitative data as numbers and percentages. Univariate Cox regression analysis was performed to identify predictors of disease-free survival (DFS), and variables with a p-value <0.10 were included in a multivariate Cox regression analysis to identify independent predictors of DFS. DFS was compared between different risk groups (designated using the same risk-stratification system) using Kaplan–Meier analysis with log-rank test.
The performance of each risk-stratification system was compared using four statistical methods: the proportion of variance explained (PVE) (12), the Akaike information criterion (AIC) (13), Harrell's c index (14), and the time-dependent receiver operating characteristic (ROC) curve method (15,16). While PVE statistics can be used to evaluate the impact of the addition of predictors to a hierarchical model on the amount of variation in the outcome that is explained by a model, use of this statistic is not always straightforward. To improve the predictive ability, a modified PVE is used to assess the dimensionality of a reduced correlation matrix. The modified PVE was calculated using the Cox regression model, where G2 is maximum likelihood ratio from the Cox regression model, and n is the total number of patients. The AIC was calculated for each risk stratification system using the following equation:
where k is the number of estimated parameters included in the model, and L is the maximum value of the likelihood function. Harrell's c index and integrated area under the curve (iAUC) calculated based on the time-dependent ROC curve for the three risk stratification systems were assessed to compare the abilities of the three risk-stratification systems to predict recurrence accurately over the entire follow-up period. The iAUC is a weighted average of the AUC across a particular follow-up period, and measures the predictive accuracy of a model during follow-up. A higher iAUC indicates better predictive accuracy. Differences in iAUC between the three risk-stratification systems were calculated using a bootstrap method, with 1000 re-samplings (17). Two-sided p-values of <0.05 and excluding 0 in the confidence interval (CI) were considered to indicate statistical significance. Statistical analyses were performed using R package v3.1.3.
Results
Demographic and clinicopathologic characteristics of the study patients
The mean age of the 2425 patients was 45.0 ± 12.3 years, and the majority (86.5%) were female. Overall, 1346 (55.5%) patients had stage I disease, and 648 (26.7%) patients had stage III disease. ETE was apparent in 1639 (67.6%) patients, and 2314 (95.4%) received postoperative RAI ablation. All other characteristics are listed in Supplementary Table S1 (Supplementary Data are available online at
Risk migration after applying ATA 2015-RSS and ATA 2015-RTR
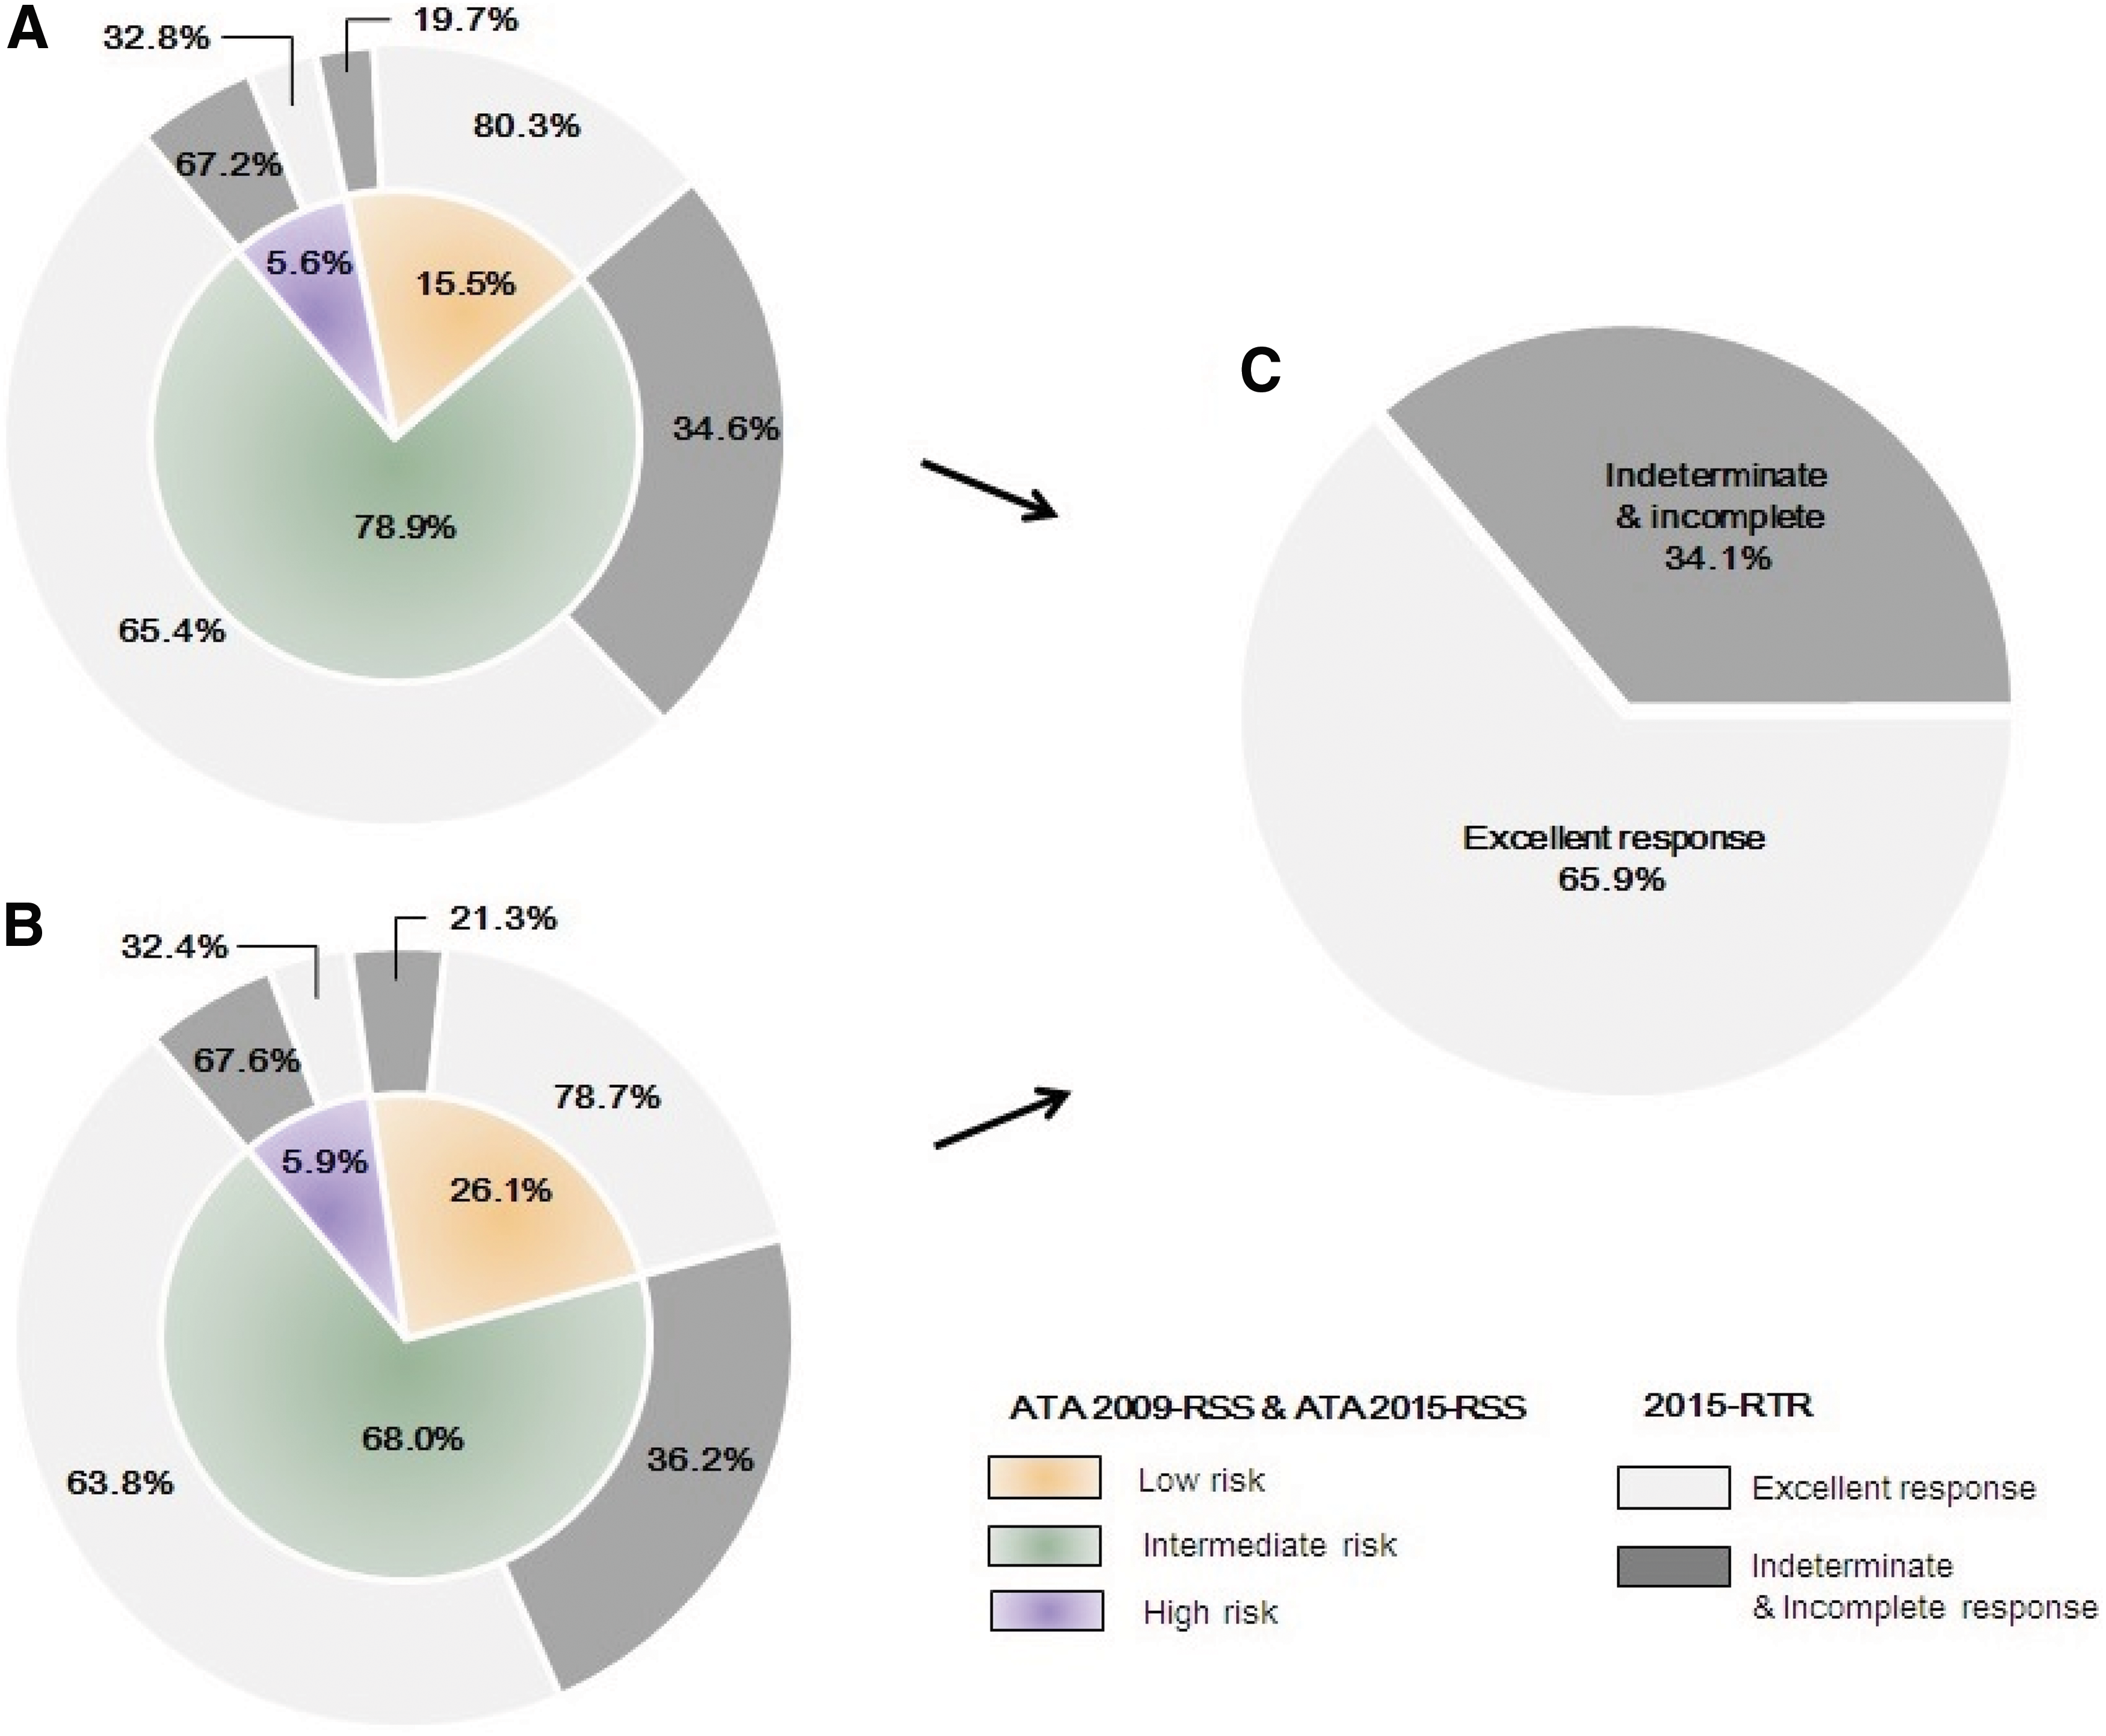
Classification according to the ATA 2009-RSS led to 375 (15.5%), 1913 (78.9%), and 137 (5.6%) patients being assigned to the low-, intermediate-, and high-risk groups, respectively (Supplementary Table S2). However, after application of ATA 2015-RSS, 258 patients in the intermediate-risk group migrated to the low-risk group. This was due to the small volume of metastatic LNs (five or fewer LN micrometastases <0.2 cm). Five patients initially placed in the intermediate-risk group migrated to the high-risk group due to the size of the metastatic LNs (≥3 cm). Finally, the proportion of patients in the low-, intermediate-, and high-risk groups according to ATA 2015-RSS were 633 (26.1%), 1650 (68.0%), and 142 (5.9%), respectively (Supplementary Table S2).
After implementing ATA 2015-RTR to ATA 2009-RSS, an excellent response was observed in 301/375 (80.3%) patients in the low-risk group, 1251/1913 (65.4%) in the intermediate-risk group, and 45/137 (32.8%) in the high-risk group (Table 1 and Fig. 1). Implementing ATA 2015-RTR to ATA 2015-RSS led to an excellent response in 498/633 (78.7%) patients in the low-risk group, 1053/1650 (63.8%) in the intermediate-risk group, and 46/142 (32.4%) in the high-risk group. Thus, a total of excellent responses was observed in 1597/2425 (65.9%) patients (Table 1 and Fig. 1).
Distribution of patients, according to (
Data are expressed as number of patients (%).
ATA, American Thyroid Association; ATA 2015-RTR, the ATA response to therapy re-stratification; ATA 2009-RSS, the initial ATA risk-stratification system; ATA 2015-RSS, the modified ATA initial risk-stratification system.
Risk-stratification systems as the predictors of recurrence
Overall, recurrence was detected in 136 (5.6%) patients during follow-up. To verify the accuracy of the three different systems for predicting tumor recurrence, univariate analyses were performed based on clinicopathologic parameters. As expected, sex, TNM stage, tumor size, multiplicity, bilaterality, ETE, high-dose RAI ablation (≥200 mCi), and all three different risk-stratification systems were significant predictors of recurrence (Table 2). Next, multivariate analyses were performed to analyze the relationships between clinicopathologic parameters and the three risk-stratification systems. Interestingly, all three risk-stratification systems predicted tumor recurrence, with strong statistical significance after adjusting for covariates, including age, sex, multiplicity, bilaterality, and adjuvant RAI ablation (Table 2). However, because several factors such as tumor size, ETE, and TNM stage are already included in the ATA 2009-RSS and ATA 2015-RSS, these clinicopathologic parameters were excluded to avoid collinearity.
These variables were not evaluated in the multivariate analysis because they were included as criteria in the risk stratifications.
HR, hazard ratio; CI, confidence interval; TNM, tumor node metastasis; RAI, radioactive iodine.
Comparison of the ability of the risk-stratification systems to predict recurrence
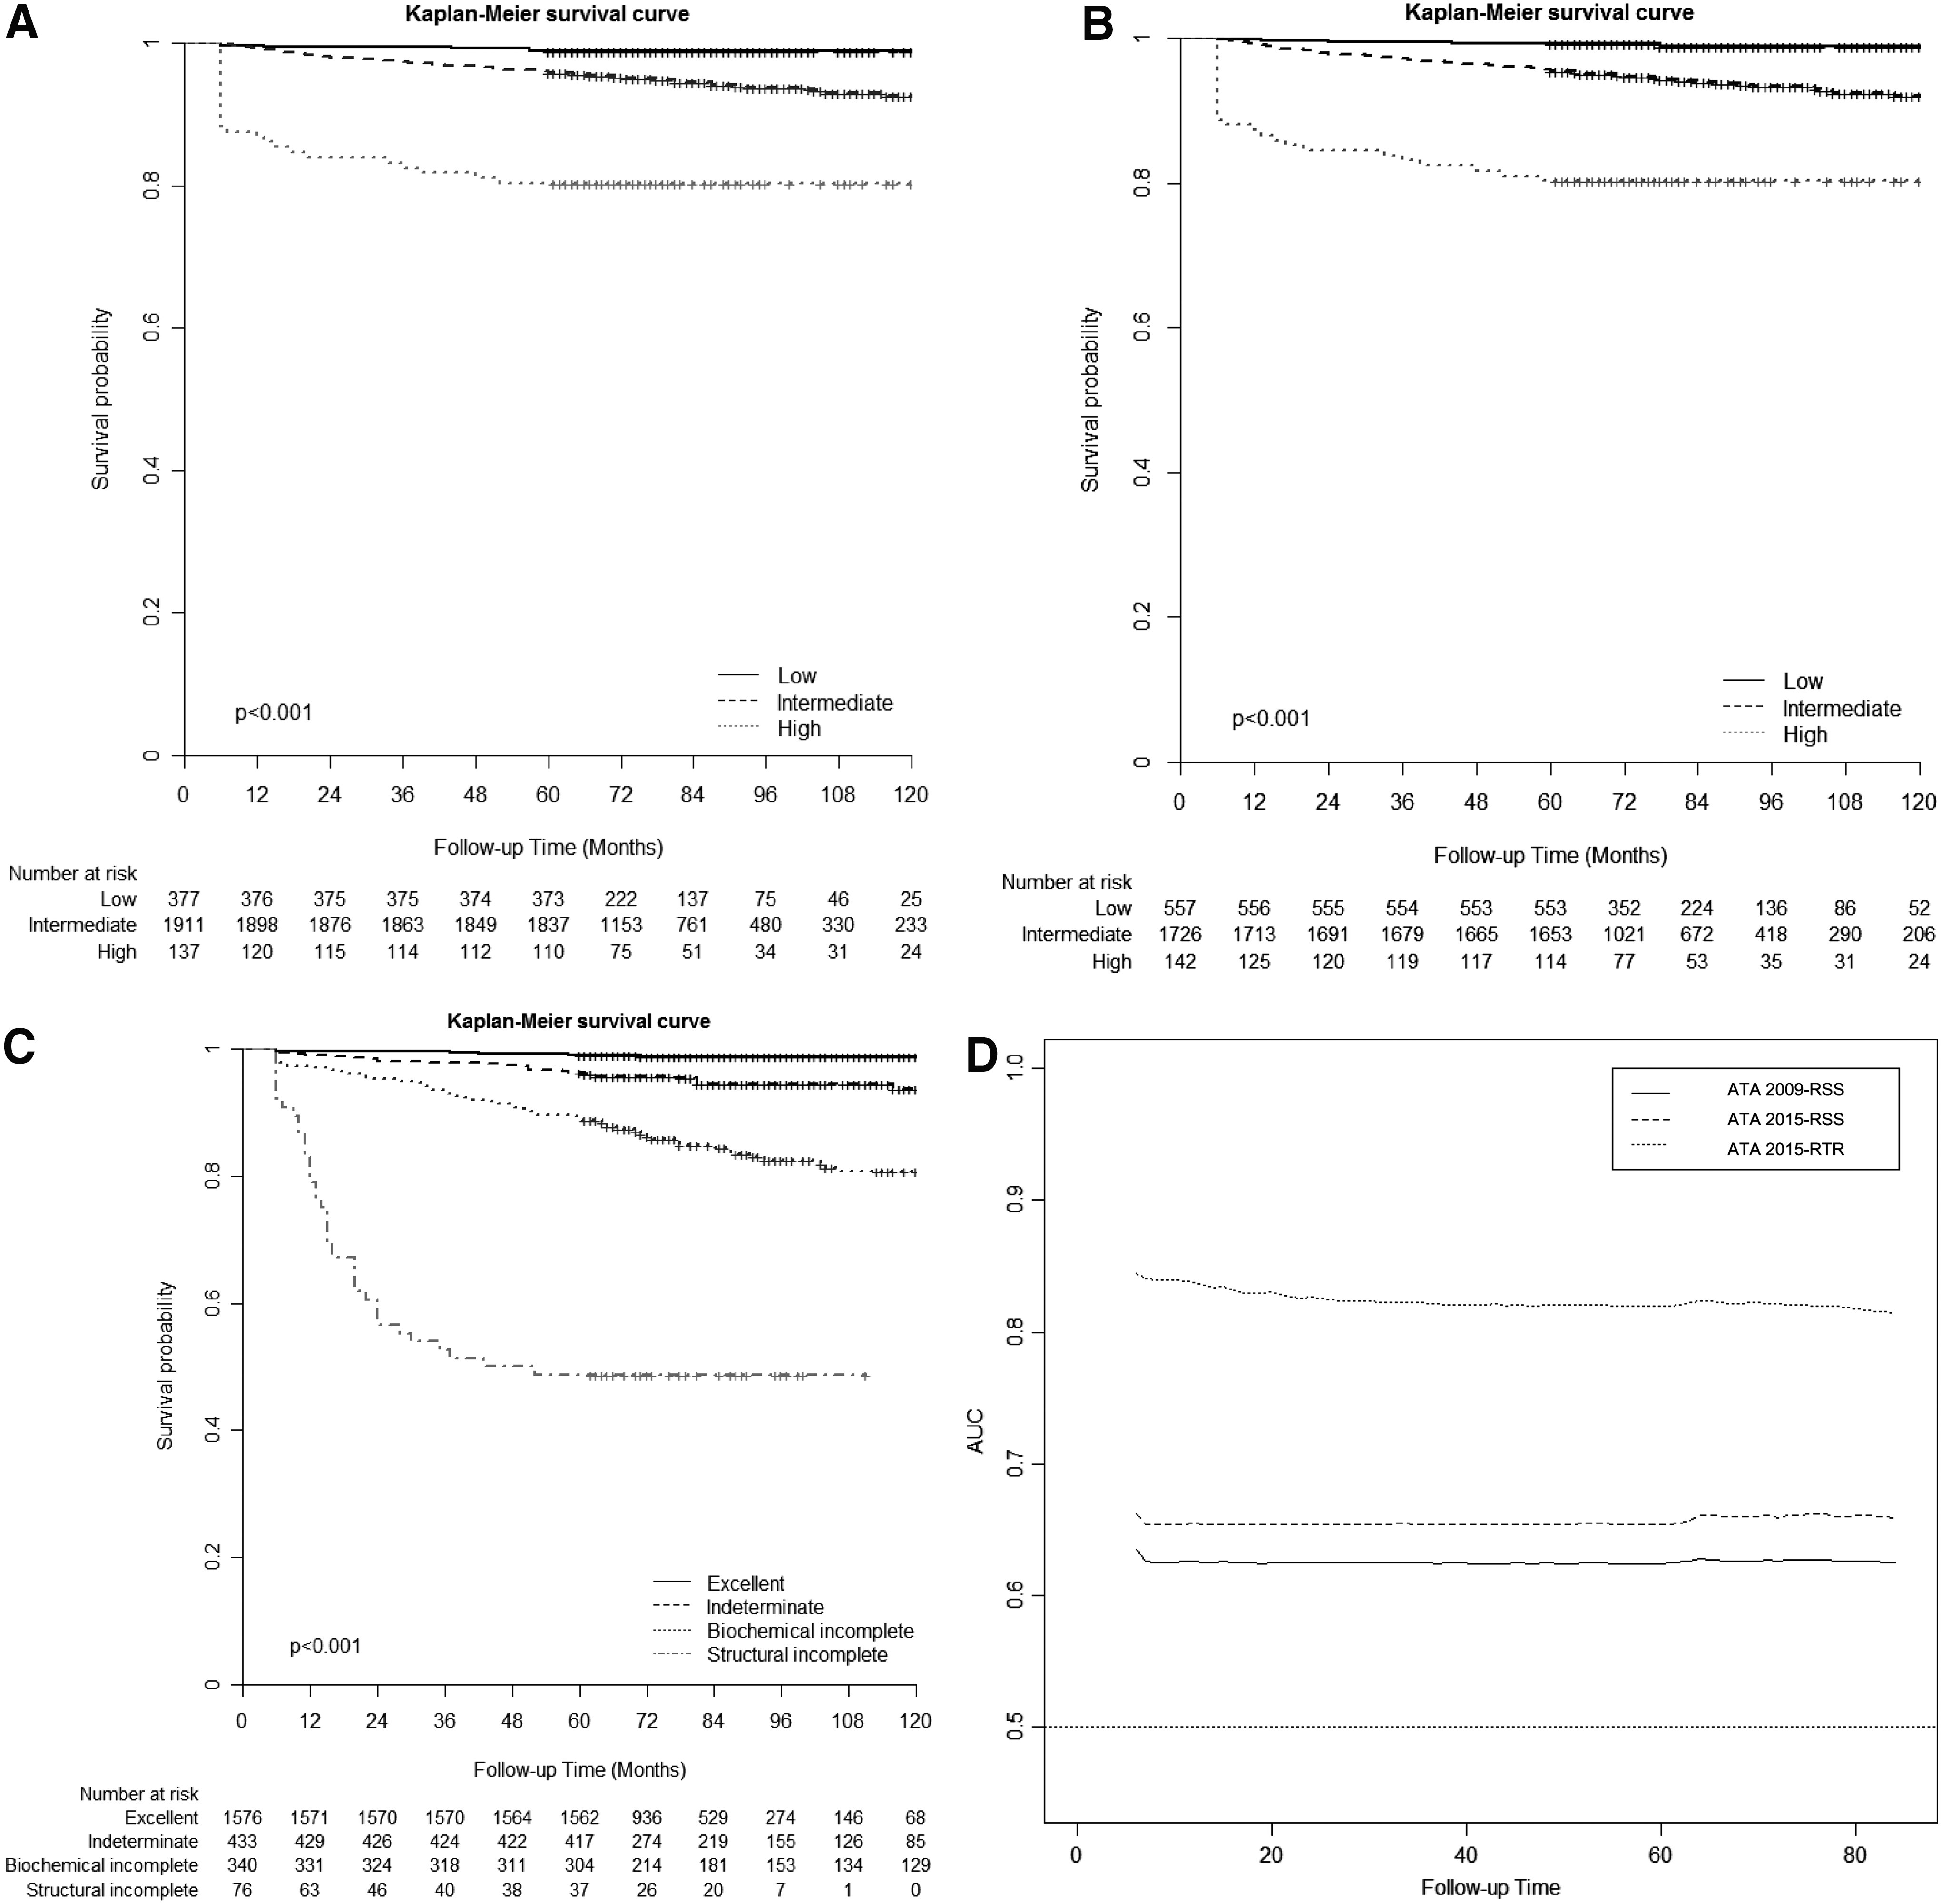
Kaplan–Meier survival analysis revealed that all three risk-stratification systems had significant differences across all stages (p < 0.001; Fig. 2A–C). To examine the correlation between each risk-stratification system and recurrence prediction, the PVE was calculated for the ATA 2009-RSS, ATA 2015-RSS, and ATA 2015-RTR. The results were 75.13%, 89.35%, and 100.00%, respectively (Table 3). The goodness of fit for predicting recurrence was evaluated by the AIC. The ATA 2009-RSS, ATA 2015-RSS, and ATA 2015-RTR scored 2028.35, 2013.25, and 1829.51, respectively (Table 3). Harrell's c index and iAUC, which evaluated the discriminatory ability of the three risk-stratification systems, were 0.64, 0.67, and 0.83 and 0.63, 0.66, and 0.83 for the ATA 2009-RSS, ATA 2015-RSS, and ATA 2015-RTR, respectively (Table 3). The difference in iAUC was 0.03 [CI 0.014–0.044] between ATA 2009-RSS and ATA 2015-RSS, and 0.17 [CI 0.123–0.217] between ATA 2015-RSS and ATA 2015-RTR. A marked difference in the time-dependent AUC for each risk-stratification system was observed (Fig. 2D). This remained steady throughout the whole follow-up period. Taken together, the results show that although all three risk-stratification systems have the statistical power to predict tumor recurrence, the ATA 2015-RTR is the most accurate.
Probability of disease-free survival according to (
PVE, proportion of variance explained; AIC, Akaike information criterion; SE, standard error; iAUC, integrated area under the curve.
Discussion
This study shows that all three risk-stratification systems that were examined are useful for predicting the risk of recurrence after initial treatment, although the ATA 2015-RTR was the most accurate.
After implementing the ATA 2015-RSS to the ATA 2009-RSS, some patients migrated from the intermediate- to the low-risk group. This is because the revised definition of low risk included a small volume of LN metastases. However, the proportion of such patients identified herein (13.5%) was smaller than that in a previous report showing 30% migration (18). The relatively small number of migrated patients might be explained by the peculiar characteristics of PTC in Korea. The frequencies of ETE and lateral LN metastases are higher in Korea than they are in Western countries (9 –11,18 –20). Indeed, aggressive features such as multifocality, bilaterality, and central LN metastases are also more common (9 –11,18,21). Alternatively, aggressive PTC might have been higher because the study patients were mostly managed at a tertiary referral hospital. This is particularly true for rare or advanced disease seen at referral hospitals. In addition, BRAFV600E mutation status, a causal genetic event in almost 80% of PTC cases in South Korea, was not included in the analysis. If BRAFV600E mutation status had been included, it is quite possible that migration from the intermediate- to the low-risk group might have been even smaller.
It is interesting that the ATA 2015-RTR predicted tumor recurrence more accurately than the ATA 2009-RSS or ATA 2015-RSS. Moreover, the ATA 2015-RTR categorized 65% of all patients into the “excellent response” group, with a low rate of recurrence (1.1%), similar to the 1.1% and 0.9% rates predicted by the ATA 2009-RSS and ATA 2015-RSS, respectively. However, the ATA 2009-RSS classified 15.5% of patients as low risk, and the ATA 2015-RSS classified 26.1% as low risk. Therefore, the ATA 2015-RTR might be a better and more cost-effective predictor of tumor recurrence. In fact, 65.4% of patients in the intermediate-risk group and 32.8% in the high-risk group (according to the ATA 2009-RSS) were placed in the “excellent response” group by the ATA 2015-RTR. Similarly, 63.8% of patients in the intermediate-risk group and 32.4% in the high-risk group according to the ATA 2015-RSS were reclassified as excellent responders. Taken together, these data suggest that the effectiveness of therapy is a crucial factor affecting PTC recurrence, although the clinicopathologic behavior of PTC might also be an important factor. Moreover, it was noteworthy that compared with initial stratification systems, the ATA 2015-RTR had the advantage of one year response to therapy.
Considering that the current ATA guidelines do not currently mandate prophylactic CCND, particularly for T1–2 PTC, an attempt was made to reanalyze the accuracy of risk stratification assuming that prophylactic CCND had not been performed on these patients. Data were filtered to exclude the possibility of upstaging PTC due to routine prophylactic CCND, and a new presumption model of risk stratification was designed. In the new model, all those with prophylactic CCND in T1–2 PTC were reclassified as N0. After applying the new presumption model, Kaplan–Meier survival analysis showed there were significant differences between ATA 2009-RSS and ATA 2015-RSS across all stages (p < 0.001; Supplementary Fig. S1A and B). To examine the prediction accuracy of each risk-stratification system, PVE, AIC, iAUC, and Harrell's c index were also examined for the ATA 2009-RSS and ATA 2015-RSS (Supplementary Fig. S1C and Supplementary Table S3). According to the results of the new presumption model, if the possibility of PTC upstaging due to prophylactic CCND was excluded, the ATA 2015-RTR was significantly more accurate than the ATA 2009-RTR.
Four different types of statistical analyses were used to compare the predictive accuracy of the three risk-stratification systems. Because the PVE identifies differences between predicted risk and actual risk, it is normally expressed as a range (from 0 to 100) (12). The 100% PVE for the ATA 2015-RTR indicated that this system exactly matches the actual risk and explains all of the variance. Because AIC measures the relative quality of statistical models and provides a means for model selection, it was used to compare the different models; a smaller AIC indicates a preferred model. Here, it was found that the ATA 2015-RTR had the lowest AIC value. Harrell's c index and iAUC were evaluated for discrimination and predictive ability of the survival model. The bootstrapping method compares predictive accuracy over the entire follow-up period. Again, the ATA 2015-RTR showed the highest Harrell's c index and the highest iAUC. Thus, the ATA 2015-RTR is the most accurate risk-stratification system, although it cannot be used at the preoperative stage.
Conclusion
To the best of the authors’ knowledge, this is the first large cohort study to compare the predictive accuracy of the ATA 2009-RSS, ATA 2015-RSS, and ATA 2015-RTR. It was found that 13.5% of patients assessed as intermediate risk by the ATA 2009-RSS were assessed as low risk by the ATA 2015-RSS. In addition, the ATA 2015-RTR is likely to be the most accurate predictor of recurrence, although the data did not include BRAFV600E and TERT promoter mutation status, and the mean follow-up period was relatively short (88.0 months). Further studies should examine the clinical utility of the ATA 2015-RTR.
Footnotes
Acknowledgments
J.L. was supported by National Research Foundation of Korea (NRF) grants funded by the Korean government (MEST) (NRF-2014R1A1A2059343). Y.S.J. was supported by National Research Foundation of Korea (NRF) grants funded by the Korean government (MEST; NRF-2015R1D1A1A01058912) and by a grant of the Korea Health Technology R&D Project through the Korea Health Industry Development Institute (KHIDI), funded by the Ministry of Health and Welfare, Republic of Korea (HI15C2334).
Author Disclosure Statement
No competing financial interests exist.
References
Supplementary Material
Please find the following supplemental material available below.
For Open Access articles published under a Creative Commons License, all supplemental material carries the same license as the article it is associated with.
For non-Open Access articles published, all supplemental material carries a non-exclusive license, and permission requests for re-use of supplemental material or any part of supplemental material shall be sent directly to the copyright owner as specified in the copyright notice associated with the article.