
Abstract
Background:
The BRAFV600E mutation is the most common driver in papillary thyroid carcinoma (PTC) tumors. In recent years, gene fusions have also been recognized as important drivers of cancer in PTC. Previous studies have suggested that thyroid tumors with fusion genes frequently display an aggressive course. These observations prompted further exploration of gene fusions in PTC tumors. The aim was to search for previously unrecognized gene fusions using thyroid tissue samples from PTC patients.
Methods:
Gene fusions were analyzed in RNA sequencing data obtained from 12 PTC tumors and paired unaffected thyroid tissue samples. Candidate fusions were further filtered and validated using reverse transcriptase polymerase chain reaction, Sanger sequencing, and fluorescence in situ hybridization. An Ohio cohort of 148 PTC tumor samples was screened for a LMO7–BRAF fusion and the BRAFV600E mutation. Functional assays were performed to assess the LMO7–BRAF fusion.
Results:
Two coding fusions (CCDC6–RET and LMO7–BRAF) were found in one tumor sample each. The novel LMO7–BRAF fusion was validated by reverse transcriptase polymerase chain reaction and fluorescence in situ hybridization. The LMO7–BRAF fusion was a recurrent somatic alteration with a frequency of 2.0% (3/148) in PTC tumors, while the BRAFV600E point mutation was found in 63.5% (94/148) of tumors. Enforced expression of LMO7–BRAF fusion protein stimulated endogenous ERK1/2 phosphorylation and promoted anchorage independent cell growth to an extent similar to BRAFV600E .
Conclusions:
A novel fusion gene, LMO7-BRAF, was identified in PTC tumors. The results indicate that the LMO7–BRAF fusion behaves as an oncogenic alteration. This observation expands the spectrum of fusion genes involving kinases in thyroid cancer.
Introduction
T
This study describes the identification by NGS RNA sequencing (RNA-Seq) of a novel fusion gene, LMO7–BRAF, in which the 5′ portion of the LIM domain 7 (LMO7) gene fused with the 3′ portion of the BRAF gene. The LMO7–BRAF fusion is a recurrent abnormality in PTC tumors, with a frequency of 2.0%.
Methods
This study was approved by the Cancer Institutional Review Boards at the Ohio State University Medical Center. All subjects gave written informed consent for participation.
Tissue samples and cell lines
Thyroid tumor tissue samples (n = 148) were obtained from PTC patients undergoing surgical resection. Twelve tumor and noncancerous tissue pairs were studied by RNA-Seq (12). The samples were snap-frozen in liquid nitrogen and stored at −80°C. Clinical data and information regarding the specimens are shown in Table 1. NIH3T3 and HEK293 cell lines were cultured in Dulbecco's modified Eagle's medium supplemented with 10% fetal bovine serum in a humidified atmosphere of 5% CO2.
Other variant: columnar cell, Hürthle cell, solid, or Warthin-like (one case of each).
Mx, distant metastasis cannot be evaluated.
PTC, papillary thyroid carcinoma.
RNA isolation and quality assessment
Total RNA was isolated using TRIzol reagent (Invitrogen) according to the manufacturer's instructions. The purity of extracted RNA was measured using a NanoDrop ND-1000 spectrophotometer (NanoDrop Technologies, Inc.), and the concentration was assessed with Qubit 2.0 Fluorometer (Agilent Technologies) using an RNA HS Assay Kit. Samples with a RNA Integrity Number (RIN) >4 as assessed by a BioAnalyzer (Agilent) with no visible sign of genomic DNA contamination from the HS Nanochip tracings were used for total RNA library generation.
Preparation of strand-specific RNA-Seq libraries and RNA-Seq
The RNA-Seq procedures and the clinical information about the 12 paired PTC tumor and noncancerous tissue samples have been published previously (12). Briefly, the Illumina TruSeq Stranded Total RNA Sample Prep Kit with Ribo-Zero Gold (catalog #RS-122-2201) was used. The protocol consisted of random primer and stranded RNA extraction, RNA fragmentation, reverse transcription, and 100 bp paired-end sequencing using the Illumina HiSeq 2500 system. Pre-alignment data QC was assessed with FastQC. Post-alignment data quality was assessed with an in-house quality control pipeline/database for the RNA-Seq database (13). The RNA-Seq data have been deposited in the Gene Expression Omnibus (GEO) repository and are accessible through the GEO accession number GSE83520.
Fusion transcript identification
To identify fusion transcripts specific for PTC, the fusion detection program Fusion Catcher was used (14), using the “mildly_sensitive” option, with hg19 sequence reference from UCSC and Ensembl release 69 annotation. To enrich for true-positive fusion transcripts specifically expressed in PTC cells, several filtering steps of the initial fusion breakpoint candidates were performed. Candidate fusions between genes were called when they were separated by a distance >100,000 bp and supported by at least two reads spanning the fusion point.
To evaluate the authenticity of the fusion gene candidates further, each fusion candidate was examined by using FuSpot, a program for the visualization of candidate fusion points using reads from the samples in which the candidate fusions were identified. A minimum alignment percentage of ≥95% was used, and candidates were selected with reads that aligned to the breakpoint region.
Validation and screening of fusion transcript breakpoints by reverse transcriptase polymerase chain reaction and Sanger sequencing
Two fusion transcript candidates (CCDC6–RET and LMO7–BRAF) were validated with reverse transcriptase polymerase chain reaction (RT-PCR) in the original index samples. These two fusions were further screened in an Ohio cohort of PTC tumor tissue samples (n = 148). Total RNA was first treated with DNase-1 and then reverse transcribed to cDNA with the High Capacity cDNA Reverse Transcription Kit (Applied Biosystems). Primers were designed to the fusion transcript breakpoint sequences using the Primer3 web application (15). The primer sequences used for the LMO7–BRAF fusion were: LMO7-forward, 5′-AGC ACA AAG CAA CCC GTA CT; BRAF-reverse, 5′-CAC CAC GAA ATC CTT GGT CT. Briefly, RT-PCR was performed using the high-capacity reverse transcription kit according to protocol (Applied Biosystems by Life Technologies). From 50 ng of starting cDNA template, a PCR protocol was initiated with 5 min of HotStarTaq DNA polymerase activation at 95°C, followed by 30 thermal cycles of denaturation for 30 s at 95°C, primer annealing for 1 min at optimal primer melting temperatures, and extension for 1 min at 72°C. To ensure specific amplification of the breakpoint sequences, PCR products positive for the LMO7–BRAF fusion were Sanger sequenced using the ABI 3730 DNA Analyzer (Applied Biosystems). Two sets of primers were used for PCR and sequencing: Seq-Forward1, 5′-CTC TCT CCC TCC CTT GTC CT, and Seq-Reverse1, 5′-CTT CCT TTC TCG CTG AGG TC; Seq-Forward2, 5′-TAC TGG CTG GGA AGA AAA GC, and Seq-Reverse2, 5′-CCA CAA AAT GGA TCC AGA CA. The resulting sequences were analyzed using Sequencing Analysis v5.3.1 software.
Fluorescence in situ hybridization analysis
Dual-color fluorescence in situ hybridization (FISH) was performed on PTC tumor touch imprints (TTIs) from fresh-frozen tumor pieces of the index case, as previously described (16). The FISH probes were provided by Obio LLC (GSP Laboratory;
Expression constructs and DNA transfection
Expression construct of the pcDNA3–LMO7–BRAF fusion was synthesized, subcloned, and sequenced by Invitrogen GeneArt (Thermo Fisher Scientific). Plasmids pcDNA3–BRAF(wt) and pcDNA3–BRAFV600E were constructed in the authors' laboratory. The coding sequences of these constructs were confirmed by Sanger sequencing. Transfections of NIH3T3 and HEK293 cells were performed by the Lipofectamine 2000 method, as suggested by the manufacturer (Invitrogen).
Immunoblotting
Cells were washed in phosphate-buffered saline and lysed in RIPA buffer (Thermo Fisher Scientific). Equal amounts of cell extracts were separated by sodium dodecyl sulfate polyacrylamide gel electrophoresis. Following separation, the proteins were transferred to nitrocellulose membranes and blotted with the appropriate primary and secondary antibodies. Antibodies against ERK (cat. #4695; Cell Signaling), phospho-ERK (cat. #4370; Cell Signaling), and ACTIN (ACTN05; Thermo Fisher Scientific) were used.
Soft agar colony formation assay
NIH3T3 cells were seeded into 60 mm plates and transfected with the indicated plasmid for 48 h. The cells were then trypsinized and plated onto a 96-well plate with soft agar by using a Cytoselect 96-well soft agar cell transformation assay kit (Cell Biolab). The assay was carried out according to the manufacturer's protocol.
Detection of the BRAFV600E mutation
Genomic DNA was extracted from the tumor tissue samples, and a fragment spanning codon 600 of the BRAF gene was amplified by PCR. The PCR products were analyzed by SNaPshot, as described previously. The sequences of the PCR primers are: BRAF-forward TGC TTG CTC TGA TAG GAA AAT G; BRAF-reverse, CCA CAA AAT GGA TCC AGA CA; and BRAF-extension, AGG TGA TTT TGG TCT AGC TAC AG.
Searching for the LMO7–BRAF fusion gene in gene fusion databases
Publicly available fusion gene databases were searched, including The Cancer Genome Atlas (TCGA) fusion gene database (
Results
Identification of LMO7–BRAF fusion transcript in PTC from RNA-Seq data
Fusion transcript analyses of the RNA-Seq data resulted in two fusion transcripts that retained open reading frames (ORFs). One of them (CCDC6–RET, also known as RET/PTC1) has been reported previously as a frequent RET rearrangement in PTC (19). Another fusion transcript, LMO7–BRAF, has not been reported in the literature. These two coding fusions in the index samples were validated by RT-PCR. Confirmation of the LMO–-BRAF fusion was obtained by RT-PCR with primers located in exon 6 of LMO7 (NM_001306080.1) and exon 9 of BRAF, which yielded the expected product (Fig. 1A). Sanger sequences of the LMO7–BRAF fusion RT-PCR products confirmed the breakpoints between the LMO7 and BRAF genes, and determined the intact exon–exon boundary between LMO7 and BRAF (Fig. 1B). Using Sanger sequencing, it was further confirmed that exons 1–6 of LMO7 transcript variant 3 (NM_001306080.1) were present in the fusion gene. The ORF of LMO7 (exons 1–6) theoretically encodes a truncated protein with 154 amino acids, while the ORF of BRAF (exons 9–18) theoretically encodes the partner gene with kinase potential. Multiple RT-PCR reactions were performed, and no splice variants of the fusion transcript were detected in the tumor cDNAs.
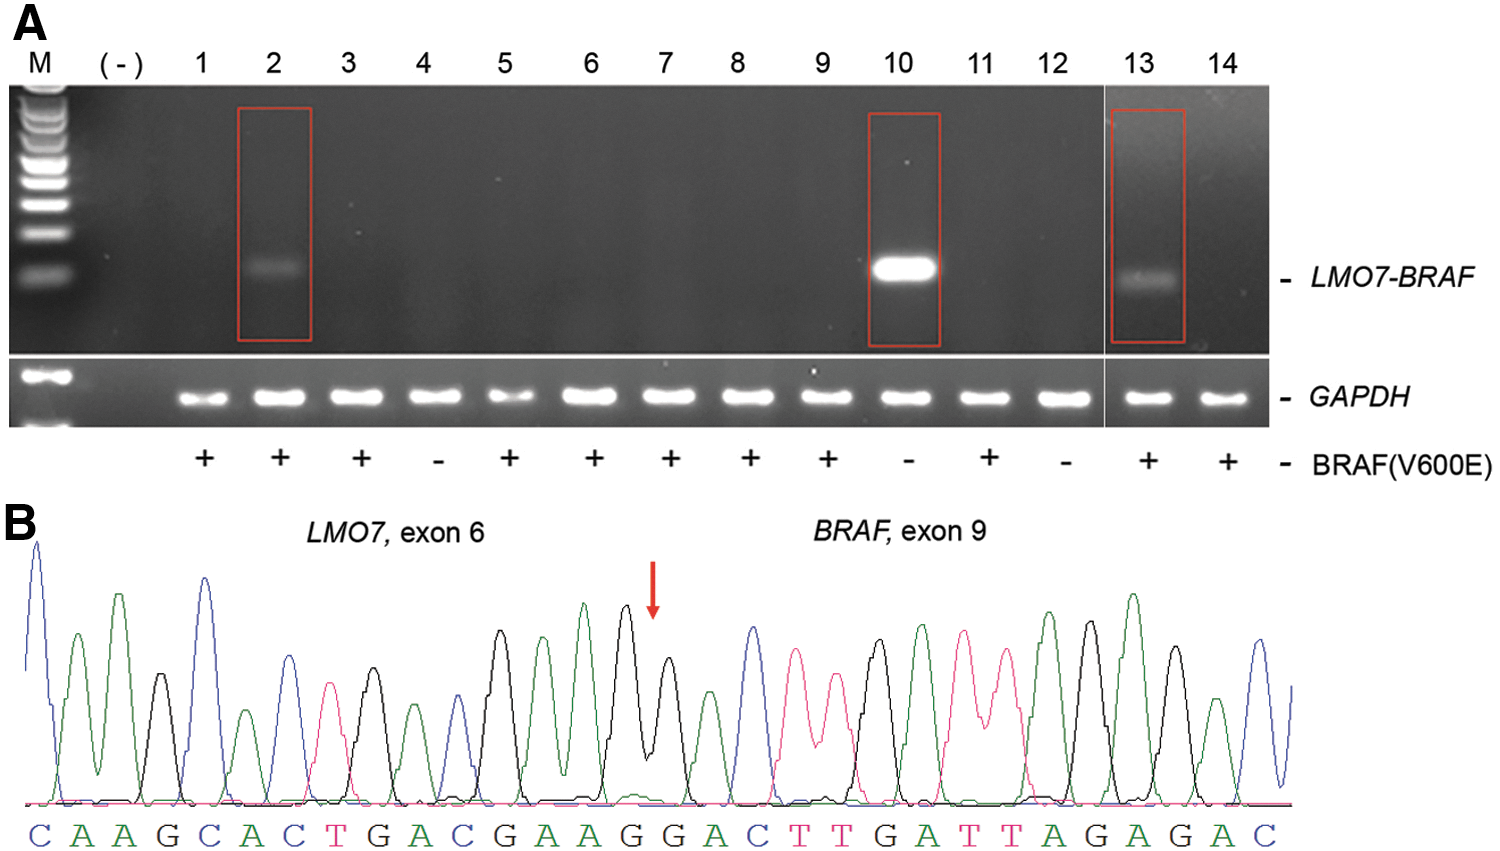
Validation of and screening for the LMO7–BRAF fusion in papillary thyroid carcinoma (PTC) tumors. (
Further confirmation of the LMO7–BRAF fusion was obtained by dual-color FISH with probes corresponding to the BRAF and LMO7 genes. The details of the probes are provided in Figure 2A. A FISH image of the tumor touch imprints of the index case (sample #10) is shown in Figure 2B. The yellow-colored signals indicate fusion of the red (indicating LMO7) and green (indicating BRAF) signals. The majority of the cells had one fusion, two red, two green pattern, indicating fusion of LMO7 and BRAF.
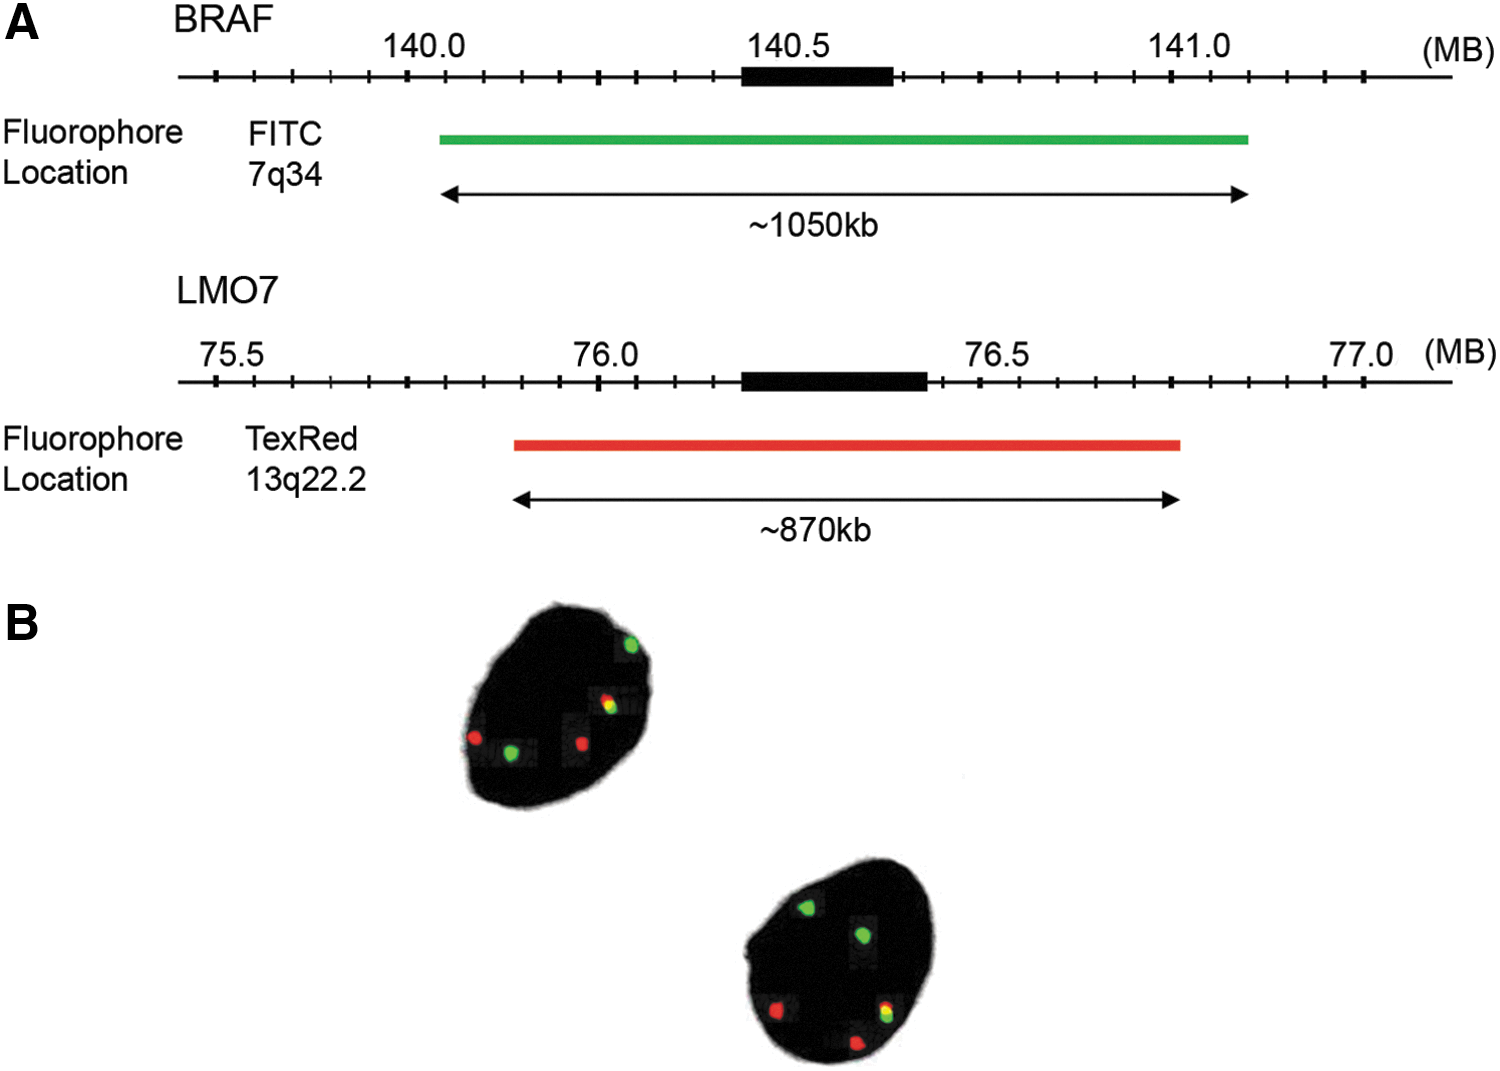
Detection of LMO7–BRAF with fluorescence in situ hybridization (FISH). (
We searched publicly available fusion gene databases, such as TCGA fusion gene database (
Ectopic expression of LMO7–BRAF increases ERK phosphorylation and promotes anchorage-independent cell growth
To elucidate the expression and kinase activating potential of the LMO7–BRAF fusion protein, HEK293 cells were transiently transfected with LMO7–BRAF, BRAFV600E , BRAF(wt), and empty vector constructs. The endogenous ERK phosphorylation level was measured by immunoblotting (Fig. 3A). The LMO7–BRAF fusion protein stimulated endogenous ERK1/2 phosphorylation to an extent similar to BRAFV600E in transfected cells, whereas overexpression of BRAF(wt) had no discernible effect in comparison with cells transfected with empty vector. To determine if LMO7–BRAF induces oncogenic transformation of NIH3T3 cells, soft agar colony formation assays were performed. Ectopic expression of LMO7–BRAF or BRAFV600E revealed significantly increased anchorage-independent cell growth when compared with BRAF(wt) or vector control (Fig. 3B).
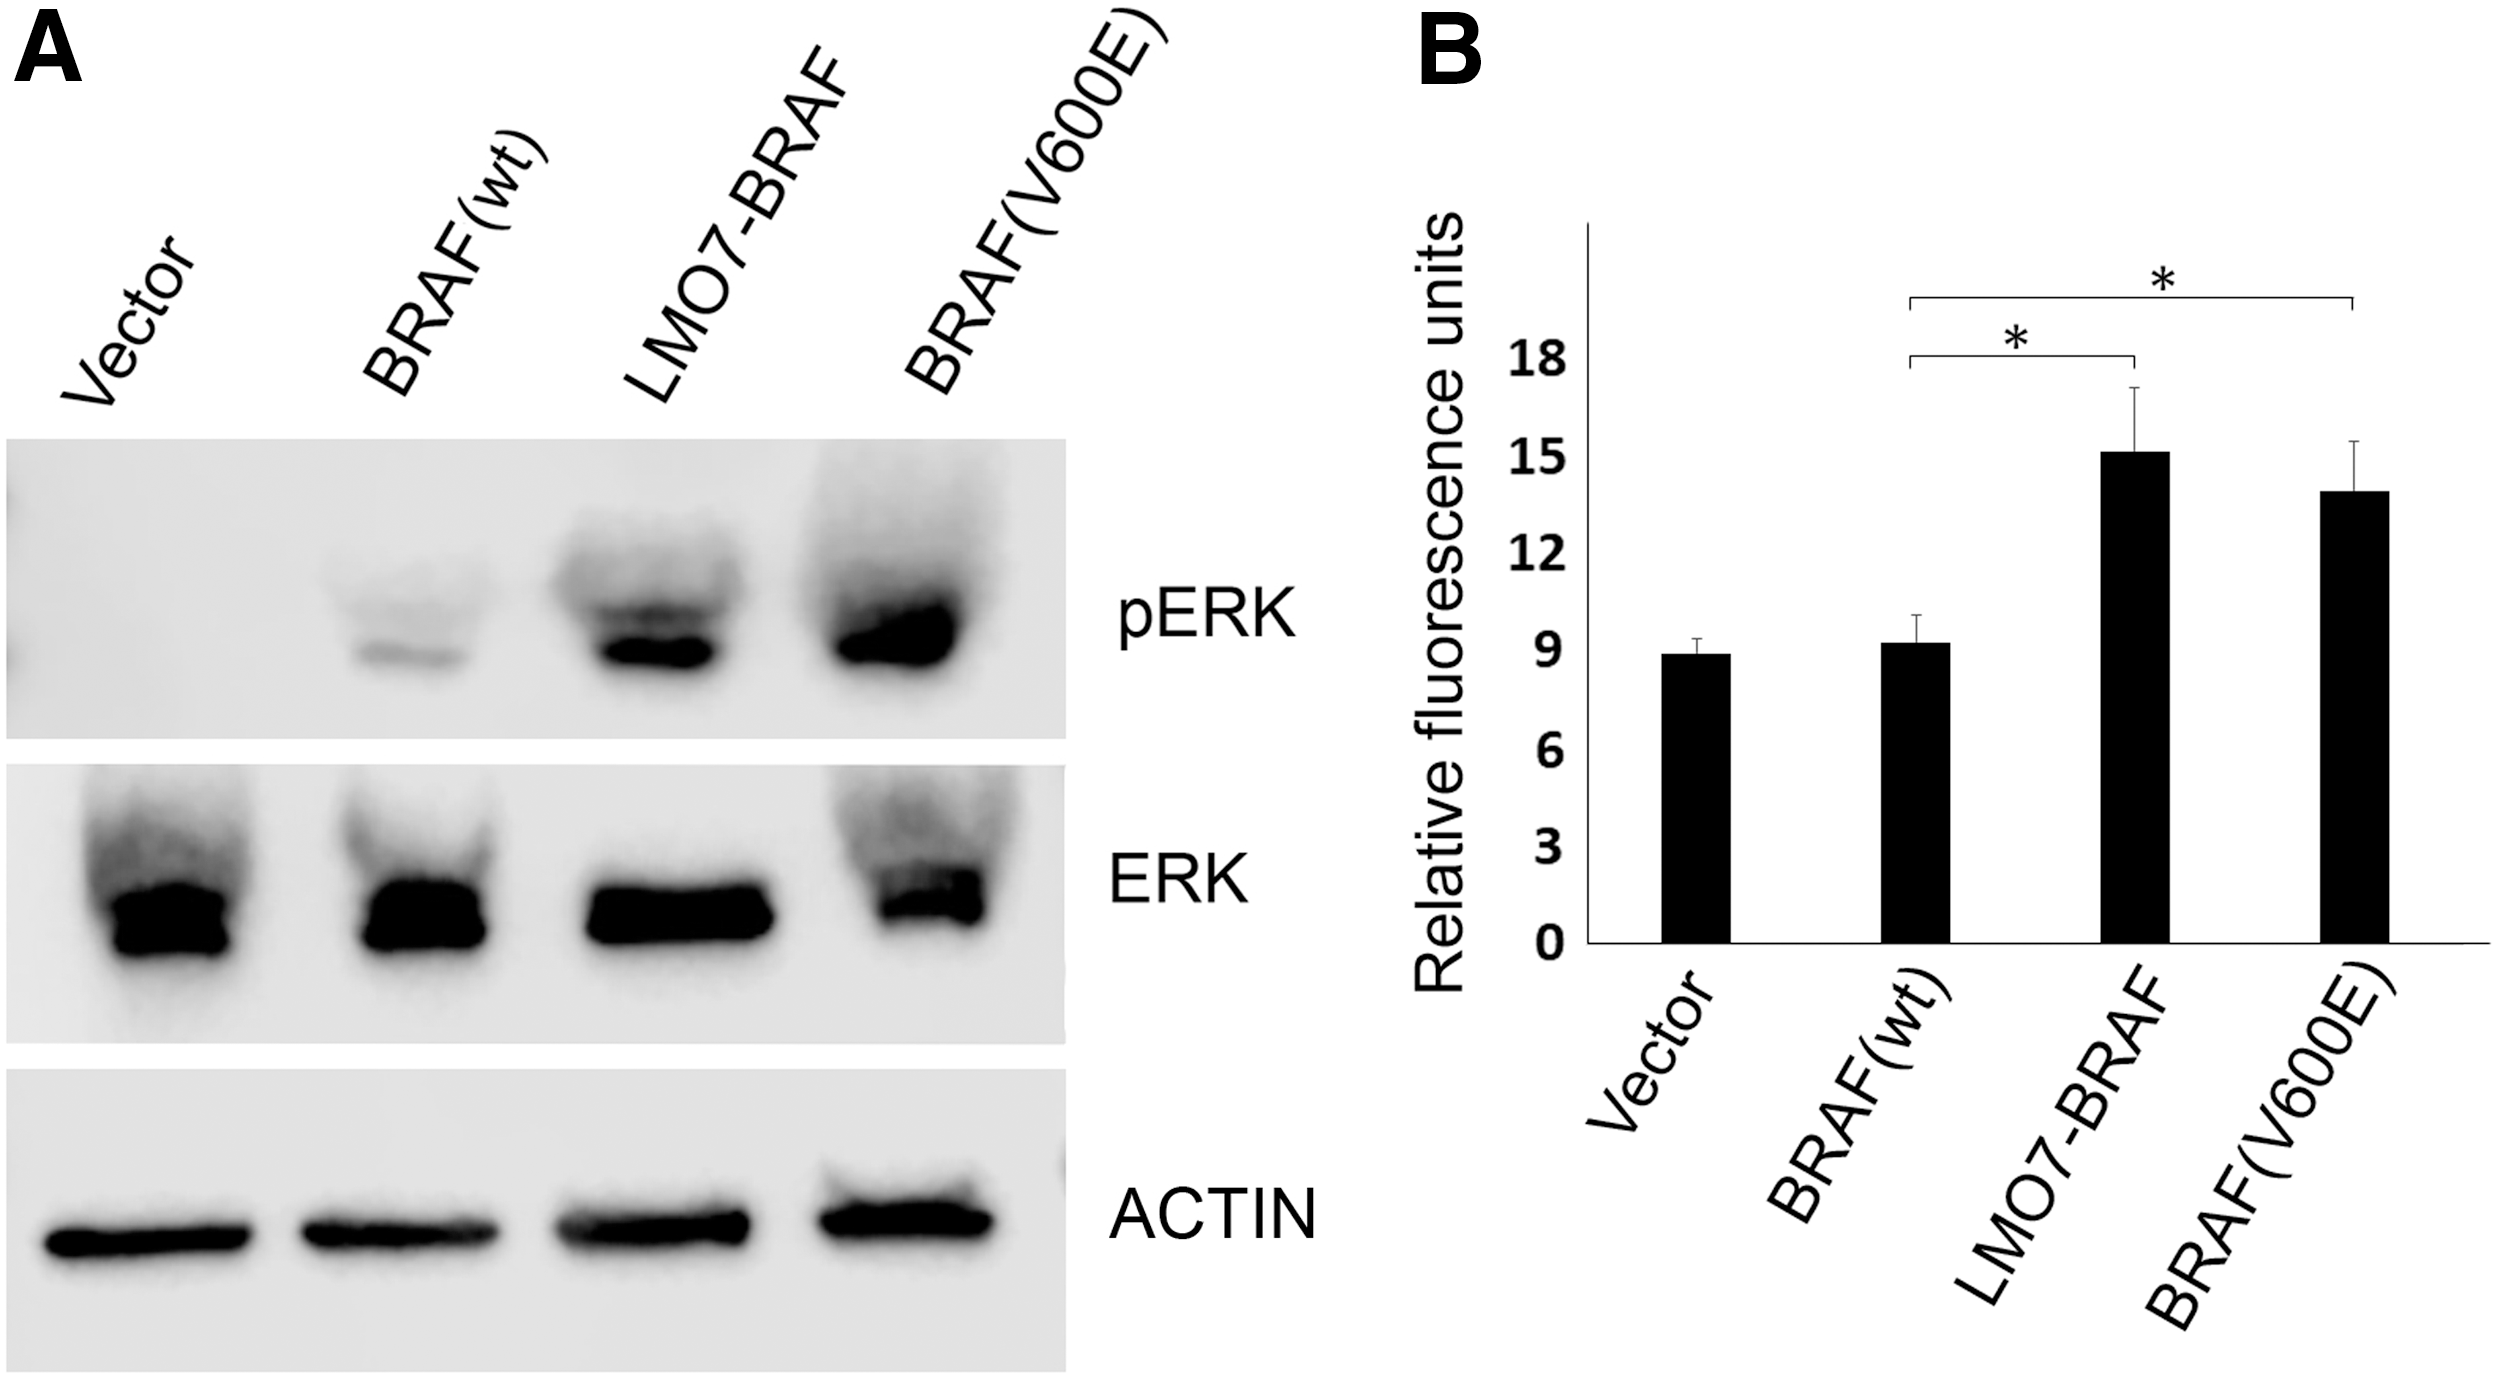
LMO7–BRAF fusion induces MAPK activation and promotes anchorage-independent cell growth. (
LMO7–BRAF is a recurrent fusion in PTC
The LMO7–BRAF fusion was assessed in an Ohio cohort of PTC patients (n = 148) using RT-PCR, and three tumors were detected (samples #2, #10, and #13) with the fusion, as shown in the gel image of 14 samples in Figure 1A. It was noticed that the RT-PCR band intensities varied, with sample #10 (the index sample) showing the strongest band intensity, while samples #2 and #13 had faint bands (Fig. 1A). The RT-PCR reactions were repeated twice, and similar patterns of band intensities were observed in these three samples. The RT-PCR products of samples #2 and #13 were Sanger sequenced, and the fusion breakpoints were confirmed as the same as in sample #10. These observations indicated that the LMO7–BRAF fusion is a recurrent fusion in 3/148 (2.0%) PTC tumors.
BRAFV600E mutation detection
The BRAFV600E mutation was screened in the same sample set, and 94/148 (63.5%) tumors were found carrying this point mutation. Notably, among the three tumor samples positive for the LMO7–BRAF fusion, two samples (samples # 2 and #13) were also positive for the BRAFV600E point mutation (Fig. 1A). These two samples showed weaker band intensities for the LMO7–BRAF fusion in the agarose gel. The clinical information pertaining to these three cases is provided in Table 2. Unique clinicopathologic characteristics were not observed among these three cases.
Index case, used in RNA sequencing.
CLT, chronic lymphocytic thyroiditis.
Discussion
Chromosomal rearrangements are common genetic abnormalities involved in the initiation of cancer development. These rearrangements result in the disruption of genetic material, which can lead to the expression of oncogenic fusion proteins or the disruption of processes involved in tumor suppression (21 –23). Gene fusions have been recognized as important drivers of cancer in a wide array of cancer types, including thyroid cancer (20,24). Recurrent gene fusions that drive oncogenesis are frequent in thyroid cancers, with RET fusions detected in ∼35% of PTC in North America (19). Among RET fusions, CCDC6–RET (RET/PTC1) is a frequently found fusion in PTC (19,25).
RNA-Seq was performed in 12 paired PTC samples, and CCDC6–RET and LMO7–BRAF fusions were found in one tumor each. Both fusions were validated by RT-PCR and Sanger sequencing of the fusion regions. Since the CCDC6–RET fusion has been characterized before, it was not pursued further. The LMO7–BRAF fusion is a novel gene rearrangement, which was not reported in the gene fusion databases such as TCGA fusion gene database (5,26), ChiTaRS 3.1 (17), and FARE-CAFÉ (18). The LMO7 gene encodes a protein containing a calponin homology domain, a PDZ domain, and a LIM domain, and may be involved in protein–protein interactions. The BRAF rearrangements in which the BRAF kinase domain is fused to a variety of 5′ partners, have been reported in several solid tumor types as well as in PTC (26,27). For instance, a recurrent fusion gene AKAP9-BRAF was found in radiation-exposed PTCs and results from an in-frame fusion of the exons 1–8 of the a-kinase anchor protein 9 (AKAP9) gene to exons 9–18 of the BRAF gene (9). In TCGA fusion gene database (
The BRAFV600E point mutation was further screened in the same panel of PTC tumors. Notably, two samples positive for the LMO7–BRAF fusion were also positive for the BRAFV600E mutation. The co-existence of the LMO7–BRAF fusion and the BRAFV600E point mutation in two tumors is consistent with the notion of unanticipated complexities in the patterns of somatic alterations in cancers (8,33,34). On the other hand, the BRAFV600E mutation was observed in 94/148 (63.5%) tumors, which is consistent with the notion that the BRAFV600E mutation is the most common somatic change in PTC. It was noticed that two samples (#2 and #13) showed weaker band intensities for the LMO7–BRAF fusion in RT-PCR gel, which perhaps reflects a sub-clone in each of these two cases. The patient listed as sample #2 was diagnosed as classic PTC at 22 years of age and underwent surgery and radioiodine treatment. The patient listed as sample #13 was diagnosed with an oncocytic PTC at 68 years of age with no other clinical information available. In a screen for BRAF gene fusions in 20,573 solid tumors, Ross et al. identified BRAF fusions involving the intact in-frame BRAF kinase domain in 55 (0.3%) cases across 12 different tumor types, including three cases (3/294; 1.0%) of thyroid cancer. The authors identified a single case of metastatic non-Spitzoid melanoma with both an AGAP3–BRAF fusion and a BRAFV600E mutation (20). Further studies are needed to assess the clinical implication and the therapeutic relevance of the observation.
In summary, a recurrent fusion of LMO7–BRAF is reported in PTC tumors, with a frequency of 2.0% (3/148) in the sample set. Two tumors with the LMO7–BRAF fusion are also positive for the BRAFV600E mutation. The findings expand the knowledge about the genomic landscape of PTC.
Footnotes
Acknowledgments
We thank Jan Lockman and Barbara Fersch for administrative help, and the OSU Comprehensive Cancer Center (OSUCCC) nucleic acid Shared Resource for RNA sequencing. This work was supported by National Cancer Institute Grants P30CA16058 and P50CA168505.
Author Disclosure Statement
The authors have no conflicts of interest to declare.