
Abstract
Background:
The need to integrate the classification of cancer with information on the genetic pattern has emerged in recent years for several tumors.
Methods:
The genomic background of a large series of 208 papillary thyroid cancers (PTC) followed at a single center was analyzed by a custom MassARRAY genotyping platform, which allows the simultaneous detection of 19 common genetic alterations, including point mutations and fusions.
Results:
Of the PTCs investigated, 71% were found to have pathognomonic genetic findings, with BRAFV600E and TERT promoter mutations being the most frequent monoallelic alterations (42% and 23.5%, respectively), followed by RET/PTC fusions. In 19.2% of cases, two or more point mutations were found, and the co-occurrence of a fusion with one or more point mutation(s) was also observed. Coexisting BRAFV600E and TERT promoter mutations were detected in a subgroup of aggressive PTCs (12%). A correlation between several aggressive features and mutation density was found, regardless of the type of association (i.e., only point mutations, or point mutations and fusions). Importantly, Kaplan–Meier curves demonstrated that mutation density significantly correlated with a higher risk of persistent disease. In most cases, the evaluation of the allelic frequencies normalized for the cancer cell content indicated the presence of the monoallelic mutation in virtually all tumor cells. A minority of cases was found to harbor low allelic frequencies, consistent with the presence of the mutations in a small subset of cancer cells, thus indicating tumor heterogeneity. Consistently, the presence of coexisting genetic alterations with different allelic frequencies in some tumors suggests that PTC can be formed by clones/subclones with different mutational profiles.
Conclusions:
A large mono-institutional series of PTCs was fully genotyped by means of a cost- and time-effective customized panel, revealing a strong impact of mutation density and genetic heterogeneity on the clinical features and on disease outcomes, indicating that an accurate risk stratification of thyroid cancer cannot rely on the analysis of a single genetic event. Finally, the heterogeneity found in some tumors warrants attention, since the occurrence of this phenomenon is likely to affect response to targeted therapies.
Introduction
Well-differentiated papillary thyroid cancer (PTC) is the most common type of thyroid malignancy, representing up to 80% of cases. In the last decades, a relevant rise in PTC incidence has been documented worldwide (1). Although PTC has in general a good prognosis, a small fraction shows higher aggressiveness, and therapeutic options are limited for patients not cured by surgery and radioiodine (2).
Monoallelic somatic genetic events in the MAP kinase pathway are found in about 80% of PTCs, including point mutations of BRAF and RAS genes, and RET/PTC and TRK rearrangements (3). The BRAFV600E mutation is the most frequent genetic change, with a prevalence of 23–83% among different series, and it is found in both the classic and more aggressive variants of PTC. There are still controversial data on the relationship between the BRAFV600E mutation and worse outcomes, and its role as a prognostic factor in PTC is controversial (4 –6).
More recently, two mutations in the promoter of the telomerase reverse transcriptase (TERT) gene, c.-124 C>T (C228T) and c.-146 C>T (C250T), have been reported in PTC, with a prevalence ranging from 5% to 15% (2). TERT is the catalytic subunit of telomerase, which maintains telomeres at the end of chromosomes, and its reactivation has been implicated in human tumorigenesis. In PTC, an association has been shown between TERTC228T and TERTC250T mutations and older age at diagnosis, tumor size, distant metastases, reduced progression-free survival, and overall survival (7 –9), indicating the prognostic value of these genetic alterations in the risk stratification of patients. TERT mutations have been reported to be frequently associated with BRAF mutations in PTC, and this duet is associated with aggressive clinicopathologic features (10,11).
Recently, an integrated genomic characterization of a large series of 402 PTCs from several U.S. referral centers, The Cancer Genome Atlas (TCGA), extended the set of known PTC driver alterations, including point mutations in the EIF1AX gene and BRAF gene fusions, reducing the fraction of PTC cases with unknown oncogenic drivers (12). Somatic mutations were found in 83% and gene fusions in 13%, mostly affecting the RAS/RAF/MAPK pathway, with BRAF (61.7%), RAS (12.9%), TERT (9.4%), and RET/PTC (6.8%) as the most frequent genetic events. Another interesting finding of this study is that mutation density appeared to be highly correlated with aggressive histologic features and risk of recurrence.
A recent study from China reported the analysis of 138 PTC samples using the next-generation sequencing (NGS) cancer panel ThyGenCap™ (13). The most frequent genetic event was BRAFV600E (58%), followed by RET fusions (5%), whereas all the other genetic alterations were well below 5%, including KRAS and HRAS (2.2% and 0.7%, respectively), TERT mutations (1.4%), and TRK rearrangements (2.1%). A strong association with distinct clinicopathologic characteristics was identified.
This study did not aim to genotype the large monoinstitutional series of PTCs fully, or to discover possible novel genetic events, but rather it aimed to characterize them for the 19 most frequent genetic alterations. Genetic data, including the evaluation of the allelic frequencies of the driver oncogenes, were obtained by a customized, reliable, highly time- and cost-effective MassARRAY genotyping platform (PTC-MA), recently developed by the authors' group (14), and were then compared with several clinical features and with the disease outcome.
Methods
Patients and clinical data
This was a retrospective cohort study with Institutional Review Board approval (#2018_09_25_04) and informed patient consent for the use of thyroid tumor tissues and collection of clinicopathologic information. A large series of 208 patients with PTC (157 female; 95% Caucasian), all operated on and followed over a period of 21 years at the same referral center, was included in this study. The clinical features are listed in Supplementary Table S1. All specimens were reviewed by three senior pathologists (S.F., G.B., and S.R.) to confirm the diagnosis. Tumors have been classified/reclassified and staged/restaged according to the eighth edition of the TNM staging system (15). The following histologic types were present: classical, follicular, sclerosing, columnar, and poorly differentiated variants (Fig. 1). All patients are included in a comprehensive database, which contains clinical and pathologic information. Criteria used to identify remission or persistent/recurrent disease (outcome) were based on the American Thyroid Association (ATA) guidelines for the management of differentiated thyroid cancer (16).

Histological variants of the analyzed papillary thyroid carcinomas (PTC) and their relative frequencies (left). List of the mutations/fusions detectable by the MassARRAY genotyping platform (PTC-MA) assay divided according to the multiplexed polymerase chain reaction and the starting material used (right).
DNA and RNA extraction, and reverse transcription
Genomic DNA and RNA were extracted from the 208 PTCs (104 fresh-frozen tissues and 104 formalin-fixed paraffin-embedded [FFPE] tissues). For frozen samples, tumors <1.5 cm were micro-dissected to ensure high tumor tissue content. In larger tumors, the core of the sample was macroscopically dissected. For FFPE samples, hematoxylin and eosin sections were evaluated to define tumor purity, which corresponds to the amount of sample occupied by cancer cells and not by surrounding stromal and immune/inflammatory cells, that is, the percentage of neoplastic cells. In order to mitigate variability, the quantification of neoplastic cells was performed by two experienced pathologists (G.B. and S.R.) always in the same section used for sequencing. A minimum of 10% tumor purity was required for sample processing. Genomic DNA was extracted using a commercial kit from either frozen or FFPE tissues (Puregene® Core Kit A; Qiagen, Germantown, MD), following the manufacturer's instructions. Total RNA was extracted from frozen or FFPE tissue samples using a Trizol-based commercial kit (Thermo Fisher Scientific, Waltham, MA), according to the manufacturer's protocol. One microgram of each RNA sample was reverse transcribed using a Superscript Reverse Transcriptase II Kit (Thermo Fisher Scientific), with a hexamer mixture as primers. ACTB amplification from the cDNA was performed as an internal quality control.
PTC-MA assay for identification of hotspot somatic mutations and fusion genes
The custom PTC-MA assay, based on matrix-assisted laser desorption/ionization time-of-flight mass spectrometry, has been previously set up by the authors' group and allows the simultaneous detection of 13 hotspot mutations and six recurrent fusion genes typical of PTC in a sensitive, fast, and economical way (14). This assay is able to detect the presence of point mutations and fusion genes with a sensitivity of 5% (14).
In brief, three multiplex polymerase chain reactions (PCR) were used. Mix 1 was performed using genomic DNA, with intronic/exonic PCR primers for the identification of point mutations. Mix 2 and mix 3 were used to assess cDNA, with exonic PCR primers for the identification of both point mutations located within exons and fusion genes. The complete list of genetic alterations screened using the PTC-MA panel is reported in Figure 1. In detail, the following point mutations were analyzed in the PTC-MA assay: BRAFV600E ; AKT1E17K ; EIF1AX c.338-1G>C; NRASQ61R and NRASQ61K ; HRASG13C , HRASQ61K , and HRASQ61R ; KRASG12V and KRASG13C ; TERT c.-124C>T and TERT c.-146C>T; and PIK3CAE542K . The following fusion genes were assessed: RET/PTC1 (RET/CCDC6), RET/PTC2 (RET/PRKAR1A), and RET/PTC3 (RET/NCOA4) for the RET gene, and TRK (NTRK1/TPM3), TRK-T1 (NTRK-T1/TPR), and TRK-T3 (NTRK1/TFG) for the NTRK1 gene. Since TERT and EIF1AX mutations and AKT1 PCR primers are located in non-coding sequences, they were analyzed using genomic DNA template. The remaining mutations are all located within exons and were analyzed using exonic PCR primers, starting from either genomic DNA or cDNA. The choice of the biological starting material was made to optimize the multiplex PCRs by minimizing the interference among the extension primers. cDNA was also used to analyze the six fusion genes by means of PCR primers designed so that each hybridized to one of the two partner genes involved in the rearrangement. PCR products were obtained only in the presence of the rearrangement, whereas in wild-type samples, no amplification was possible. gDNA and cDNA (approximately 30 ng) were used for PCR, shrimp alkaline phosphatase, and single-base extension (SBE) reactions, which were conducted using the Complete iPLEX Pro Genotyping Reagent Set (Agena Bioscience, San Diego, CA), following the manufacturer's protocol. SBE products were processed on SpectroCHIP II Arrays using a Clean Resin Kit and the MassARRAY Nanodispenser (Agena Bioscience), and then analyzed using MassARRAY Typer 4.0 software (Agena Bioscience).
For point mutations, but not for fusions, the allelic frequencies were recorded and normalized for the cancer cell content in order to estimate the frequency of mutant alleles in cancer cells. For fusion genes, the allelic frequency cannot be evaluated, since their detection involves a selective amplification of the rearranged gene transcript. The percentage of cancer/normal cells was calculated based on the section adjacent to the sample used for nucleic acids extraction. In particular, the percentage of tumor cells was calculated in each sample by looking at 100 cells in four fields at a magnification of 40 × . For each field, the number of cancer cells among 100 cells was counted, and the mean of the results obtained in the four fields was calculated. Major contaminants were normal thyrocytes, lymphocytes, stromal cells, and endothelial cells.
PCR and Sanger sequencing
In 128/208 (61.5%) cases, the genetic analysis of BRAF, TERT, RAS, and RET/PTC had been carried out in previous years by amplification and direct sequencing (ABI 3130; Thermo Fisher Scientific), as already reported (8,17,18).
Statistics
To analyze the association between genetic variants and clinical parameters, continuous data are summarized using the means ± standard deviation (SD) or median and range interquartile, and categorical data are summarized using frequencies and percentages. The t-test (or Wilcoxon's rank sum test in case of no normality) was used to test the difference of the mean of the continuous variables between patients with and without a mutation of a specific gene. The chi-square test (or Fisher's test) was used when appropriate to test the differences of the categorical variables. A linear model was applied to verify the association between allele frequency and tumor size. Ten-year survival curves by mutation density (dichotomized as ≤1 or ≥2 mutations) were examined by Kaplan–Meier analyses with log-rank test, censoring patients at the time of patient remission or, in the case of no remission, at the time of last clinical contact. A proportional hazard regression Cox model was applied to estimate the association between mutation density and probability of remission adjusted for the most important confounders: age, sex, and tumor size. The association was expressed as hazard ratio (HR) and relative confidence interval (CI). Statistical significance was defined as p < 0.05 or p < 0.10. All statistical analyses were performed using SAS v9.2 (SAS Institute, Cary, NC).
Results
Genotyping
At least one genetic variation, either a point mutation or fusion, was found in 148/208 (71%) cases, always in heterozygosity. As shown in Figure 2, the BRAFV600E variant was the most frequently found mutation (87/208; 42%). The frequency of TERT promoter mutations was high (49/208; 23.5%). The majority consisted of the c.-124 (46/49; 94%) mutation, while c.-146 (3/49; 6%) was less prevalent. RAS point mutations were documented in 13/208 (6.2%) cases (n = 7 NRASQ61R , n = 2 NRASQ61K ; n = 2 HRAS Q61R , n = 1 HRASQ6K ; n = 1 KRASG13C ). RET fusions were found in 37/208 (18%) cases, with a predominance of RET/PTC1 (n = 26) compared to RET/PTC3 rearrangements (n = 11). TRK fusions were documented in 5/208 (2.4%) tumors: a TRK fusion was found in one case, and TRK-T1 fusions in four cases. No mutations were found in the AKT1, EIF1AX, or PIK3CA genes and nor were there any RET/PTC2 rearrangements, confirming that they are rarely involved in the pathogenesis of PTC.
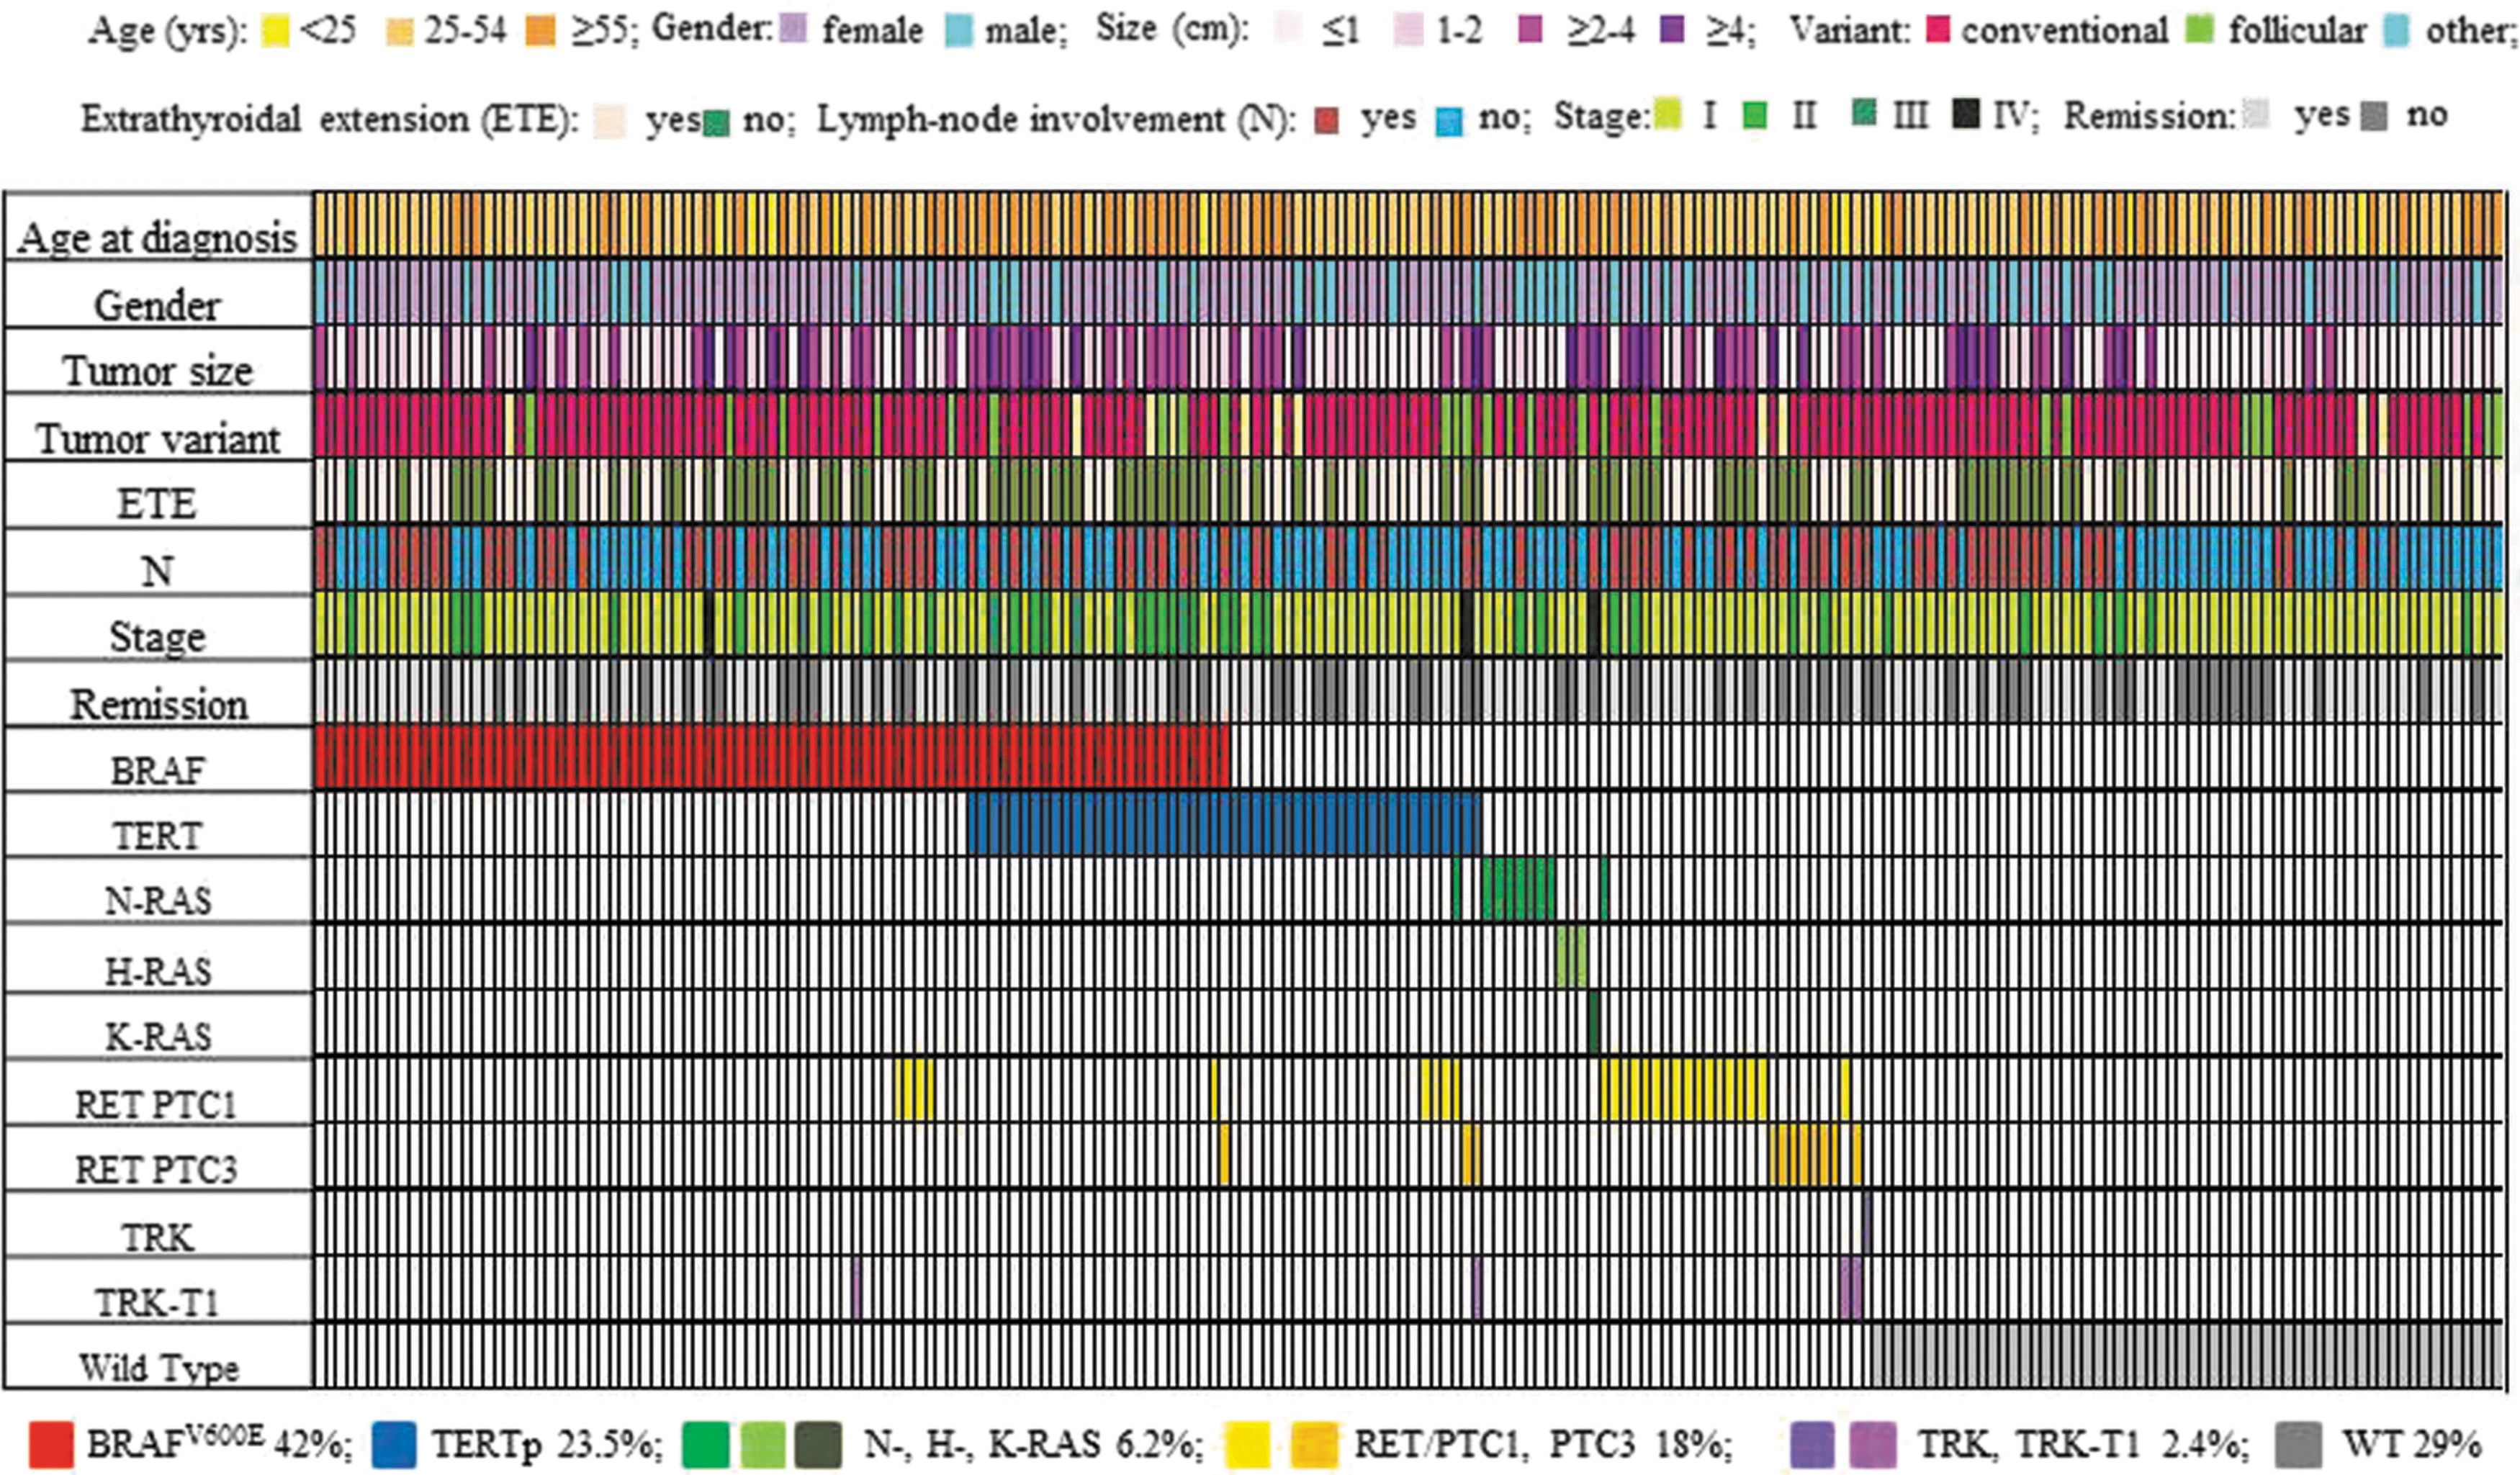
Detailed description of patient demographics and point mutations/fusions landscape of 208 cases of PTC. Colored rectangles indicate mutation categories observed in a given gene and the corresponding clinicopathologic features. The percentages of cases mutated for a given gene are reported at the bottom of the figure.
In 40/208 (19.2%) cases, two or more mutations were found. In particular, the co-occurrence of TERT with BRAF was detected in 25/208 (12%) cases, and with RAS in 1/208 (0.5%) cases. Among BRAF-mutated cases (n = 87) and RAS-mutated cases (n = 14), the frequencies of an association with TERT mutations were of 28.7% and 7.1%, respectively. The co-occurrence of a fusion with one or more point mutation/s was found in 13/208 (6.3%) of cases (n = 10 RET/PTC1, namely with BRAF [n = 4], TERT [n = 3], RAS [n = 1], BRAF and TERT [n = 1], and with RAS and TERT [n = 1]; n = 2 RET/PTC3, namely with TERT [n = 1] and BRAF and TERT [n = 1]; TRK-T1 with BRAF [n = 1]). In two cases, two different gene fusions were found in the same tumor (n = 1 TRK-T1 and RET/PTC3 and n = 1 TRK-T1 and RET/PTC1). Finally, the co-occurrence of two fusions (TRK-T1 and RET/PTC) and the TERT mutation was found in one case who at 28 years of age was treated with total thyroidectomy and a total of 15,921 MBq of 131I for a 4.5 cm classic PTC with lymph node metastases. At the last follow-up visit, there was evidence of residual disease, and the tumor was found be refractory to radioiodine. Interestingly, this patient had been submitted to chemotherapy during childhood for acute lymphoblastic leukemia, which is now in complete remission.
Sensitivity of PTC-MA with respect to Sanger sequencing
About 60% of the cases analyzed by the PTC-MA assay had been previously analyzed by Sanger sequencing. Sequencing and mass spectrometry were 100% concordant for fusions, whereas BRAF, TERT, and RAS mutations were missed by Sanger sequencing in 3.8% (2/53), 30% (9/30), and 11.1% (1/9) of the samples, respectively, indicating the higher sensitivity of the PTC-MA assay in tumor genotyping, especially for tumors harboring allelic frequencies <20% (Supplementary Fig. S1).
Allelic frequencies
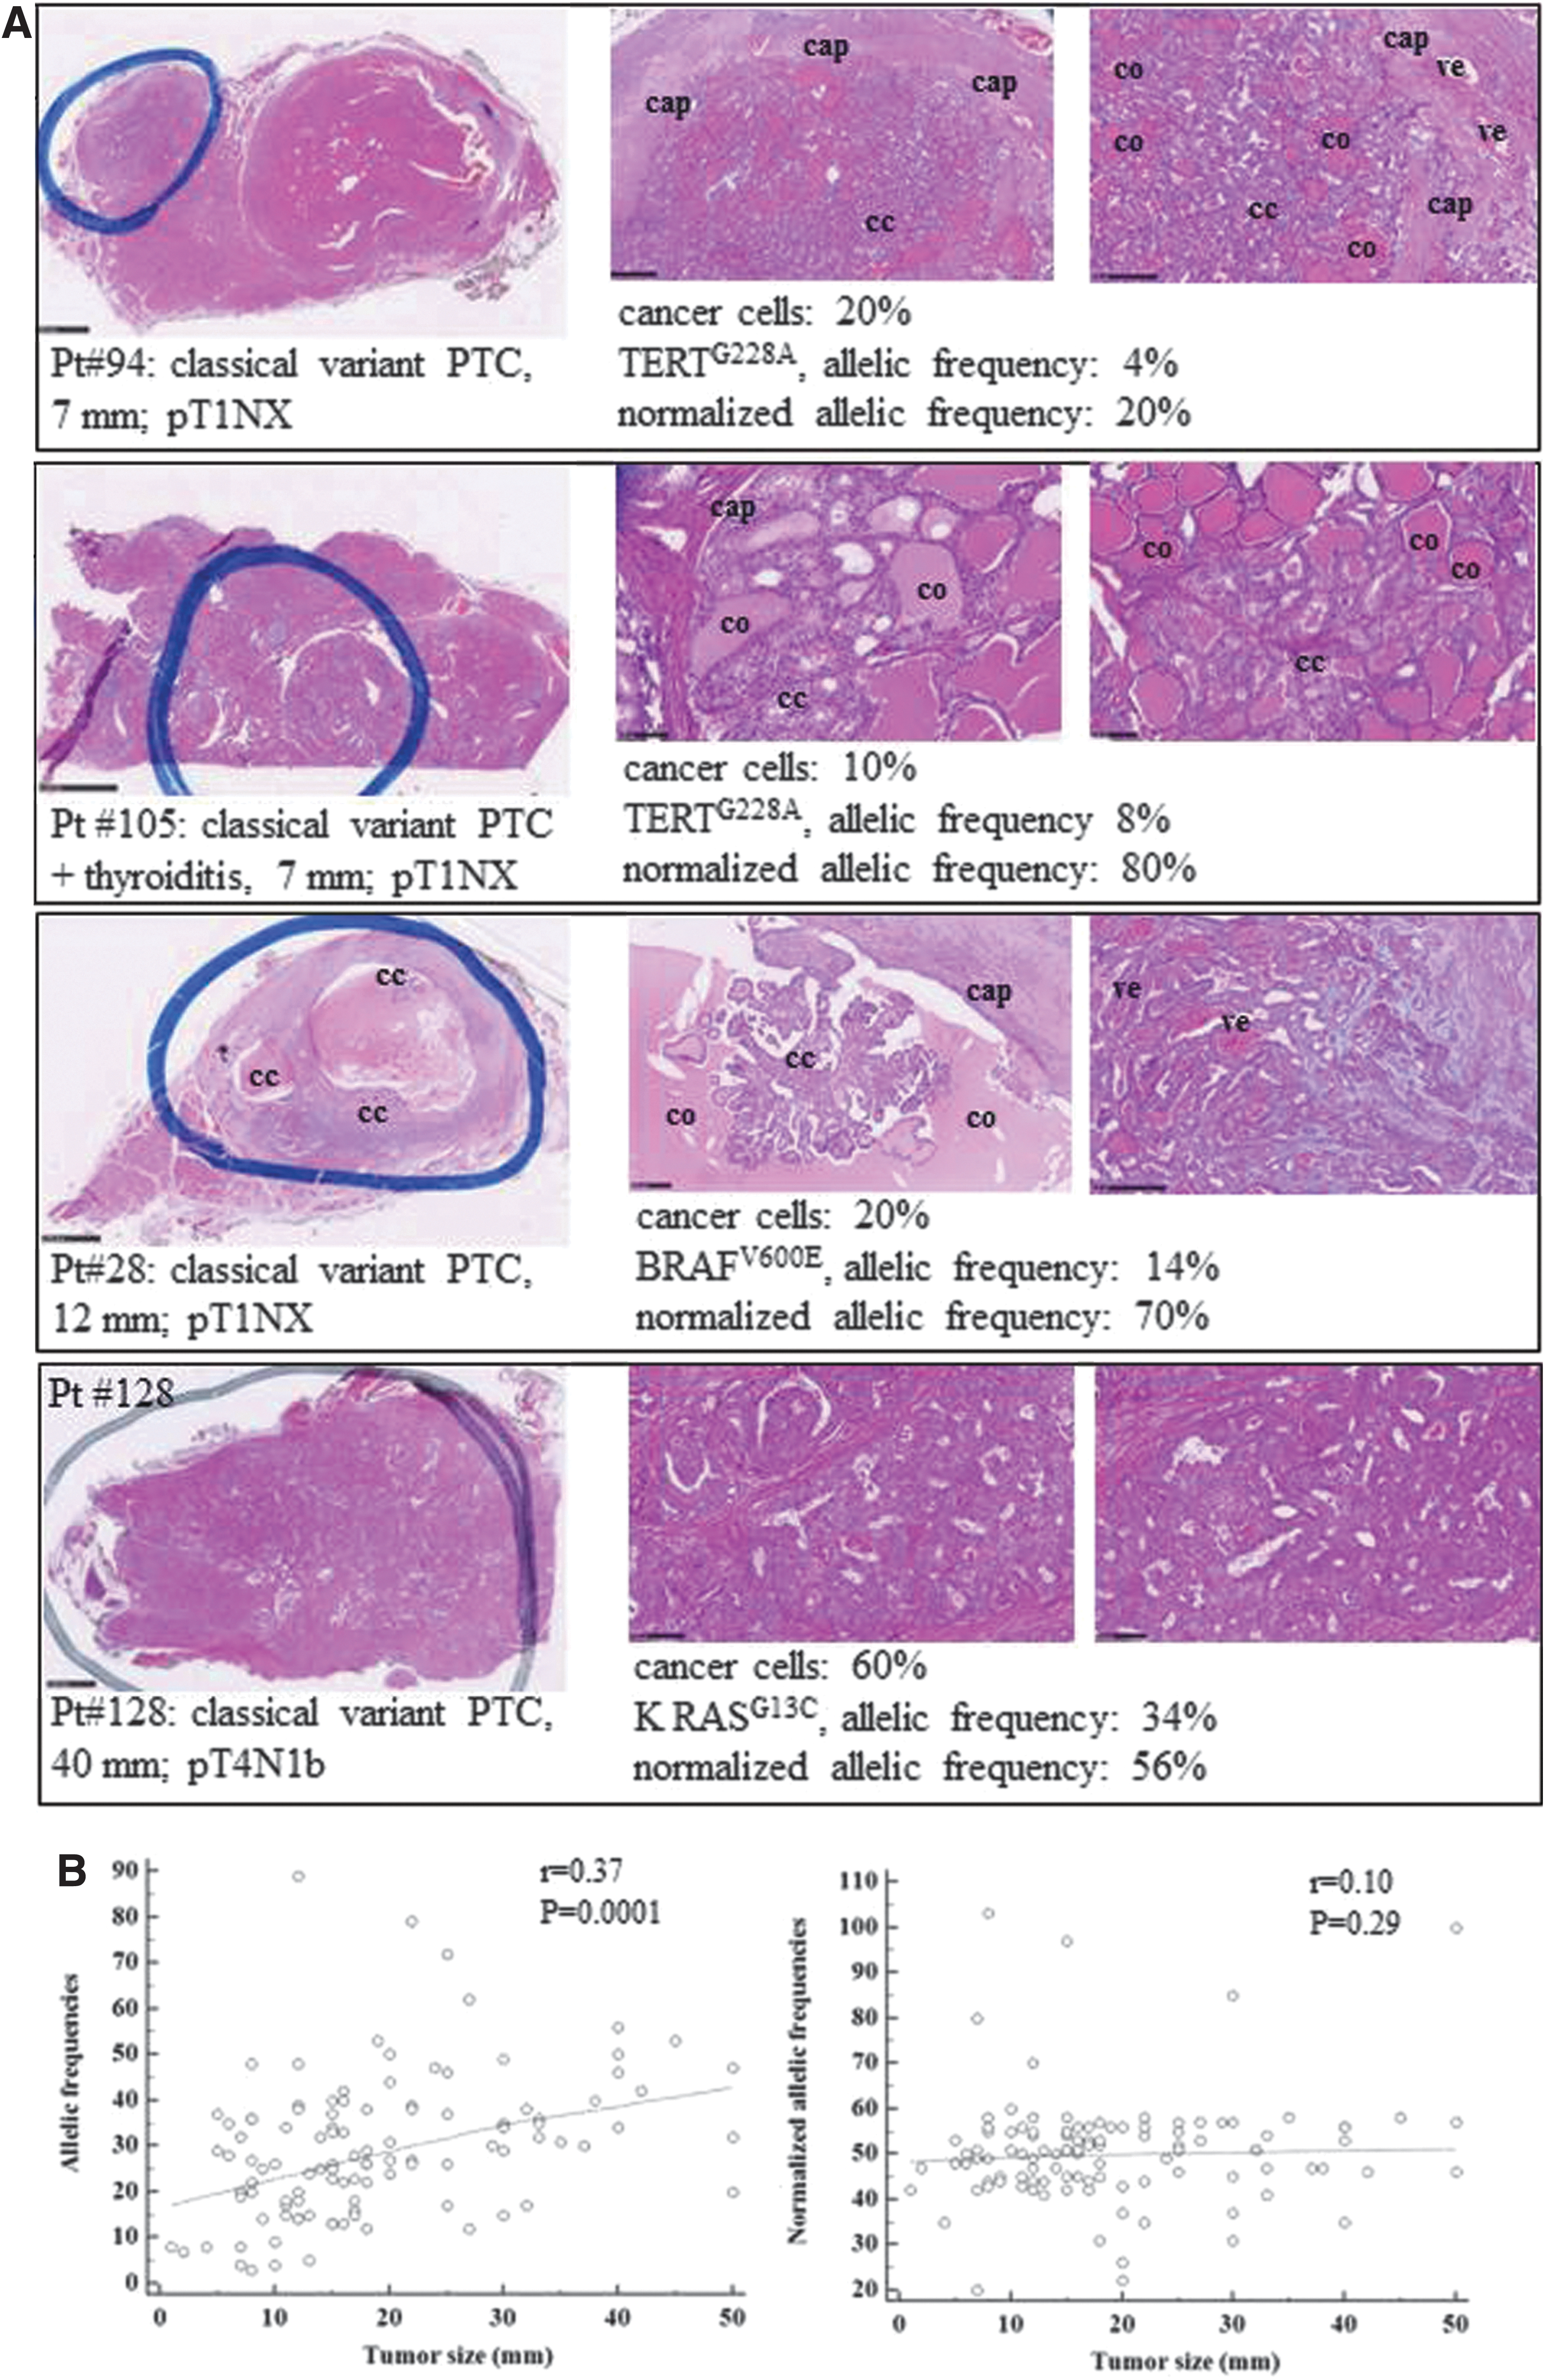
A major benefit of the PTC-MA technology is that it provides automatically, for point mutations, the percentages of the wild-type and mutated alleles detected at each investigated locus, thus indicating the level of heterogeneity of the tumor tested and the percentage of cells that underwent a given genetic event. The high variability in allelic frequencies found among different tumors could be consistent with the variable number of tumor cells obtained from each specimen. Indeed, in several tumors, a wild-type allele contamination is usually found due to the presence of stromal, endothelial, and inflammatory cells (Fig. 3A). The contamination is predicted to be higher in smaller tumors, as it is more difficult to dissect the tumor mass selectively. Accordingly, a positive correlation was found between the tumor size and the allele frequency of the mutation obtained by the PTC-MA assay (p = 0.0001). This finding highlights the need to normalize for the cancer cell content of the sample in order to obtain an estimate of the allelic frequency of the mutation (Supplementary Table S2). Consistently, the correlation between tumor size and allelic frequency was lost when the allelic frequencies were normalized for the cancer cell content (p = 0.29; Fig. 3B). Assuming that somatic mutations usually affect one allele, the frequency of mutant cells in neoplastic samples can be obtained by multiplying by two the normalized allelic frequencies (i.e., an allelic frequency of 50% suggests that all neoplastic cells carry the mutation). In this series, the mean ± SD normalized allelic frequencies were 49.91 ± 11.22 (mode 51, range 22–100) for BRAF, 53.26 ± 18.65 (mode 58, range 3–111) for TERT, and 48.61 ± 8.13 (mode 47, range 25–57) for RAS mutations. Thus, in the majority of the tumors tested, the normalized allelic frequencies were consistent with the presence of the heterozygous mutation in virtually all the neoplastic cells. On the other hand, a minority of cases was found to harbor low allelic frequencies, indicating that the mutations are present in a small subset of cancer cells, thus reflecting tumor heterogeneity. Another subset of <10 cases showed an allelic frequency >50%, possibly indicating a clonal event plus deletion of the wild-type allele (19). Interestingly, in some cases with multiple mutations, the frequency of the mutant alleles was different among the affected genes, thus indicating intratumoral heterogeneity. No significant correlation was found between allelic frequencies and age, stage of the tumor, or outcome (data not shown). Finally, as an additional test to verify the reliability of the assay in the identification of the allelic frequency, the allelic frequencies of BRAF and TERT mutations were calculated in the BCPAP cell line, which is known to harbor these variants in homozygosity, and it was found that 100% of the alleles had both mutations, whereas in the NIM cell line, known to harbor BRAFV600E in heterozygosity (20), 50% mutated alleles were found (Supplementary Fig. S2).
(
Correlation with clinical and pathological features
Several clinical features among PTCs that did not display any of the genetic alterations analyzed in this study and PTCs with one or more genetic alteration(s) were compared. BRAFV600E mutations, which showed an increased frequency over a 21-year period (1995–2016), were more frequent in cases with more aggressive clinical features such as tumor size, extrathyroidal invasion, and higher American Joint Committee on Cancer (AJCC) stage and ATA risk category. TERT mutations were associated with older age at diagnosis and with a higher AJCC stage, whereas RAS mutations were associated with the follicular variant and a lower ATA risk (Table 1). Interestingly, cases harboring the genetic duet of BRAF and TERT mutations showed several features of higher aggressiveness, such as larger tumor size, extrathyroidal invasion, and AJCC stage and ATA risk compared to wild-type cases for these alterations or those with a single mutation (Table 2). No significant correlations were found between clinical parameters and fusions, but regarding TRK rearrangements, this was likely just the consequence of the low number of mutated cases. Indeed, all TRK-mutated cases had a tumor size ≥2 cm with lymph node metastasis and an intermediate/high risk at ATA classification (Table 3).
Sociodemographic and Clinicopathologic Characteristics of the Papillary Thyroid Cancer Series According to the Presence/Absence of BRAF, TERT, and RAS Mutations
Patients not submitted to lymph node removal for whom the N status is unknown (NX).
Chi-square test.
Fisher's test.
t-Test.
Wilcoxon's test.
p < 0.05; ** p < 0.10.
SD, standard deviation; IQR, interquartile range; CPTC, classical variant papillary thyroid carcinoma; FVPTC, follicular variant papillary thyroid carcinoma; SCL, sclerosing variant; COL, columnar variant; PDTC, poorly differentiated thyroid cancer; AJCC, American Joint Committee on Cancer; ATA, American Thyroid Association.
Sociodemographic and Clinicopathologic Characteristics of the Papillary Thyroid Cancer Series According to the Combination of the Two Genetic Events (BRAF and TERT)
Patients not submitted to lymph nodal removal for whom the N status is unknown (NX).
Chi-square test.
Fisher's test.
t-Test.
Wilcoxon's test.
p < 0.05; ** p < 0.10.
Sociodemographic and Clinicopathologic Characteristics of the Papillary Thyroid Cancer Series According to the Presence/Absence of RET and TRK Fusions
Patients not submitted to lymph nodal removal for whom the N status is unknown (NX).
Chi-square test.
Fisher's test.
t-Test.
Wilcoxon test.
p < 0.05; ** p < 0.10.
An original result of this study is the evaluation of the impact of mutation density on disease outcome. The evaluation of the clinicopathologic features according to the number of genetic events (i.e., ≤1 or ≥2) showed a significant correlation between the number of mutations and more aggressive features, such as tumor size, extrathyroidal invasion, and AJCC stage (Table 4). Kaplan–Meier curves demonstrated that the presence of two or more genetic events was associated with a significantly higher risk of having persistent disease at the last follow-up (log rank test = 0.037; Fig. 4). There was a much higher probability of remission in patients harboring no mutations or one mutation compared to patients harboring two or more mutations (HR = 1.505 [CI 0.936–2.420]; p = 0.092). This significance was lost after additional adjustment for aggressive tumor features, which were significant at univariate analysis, such as extrathyroidal invasion and AJCC stage.
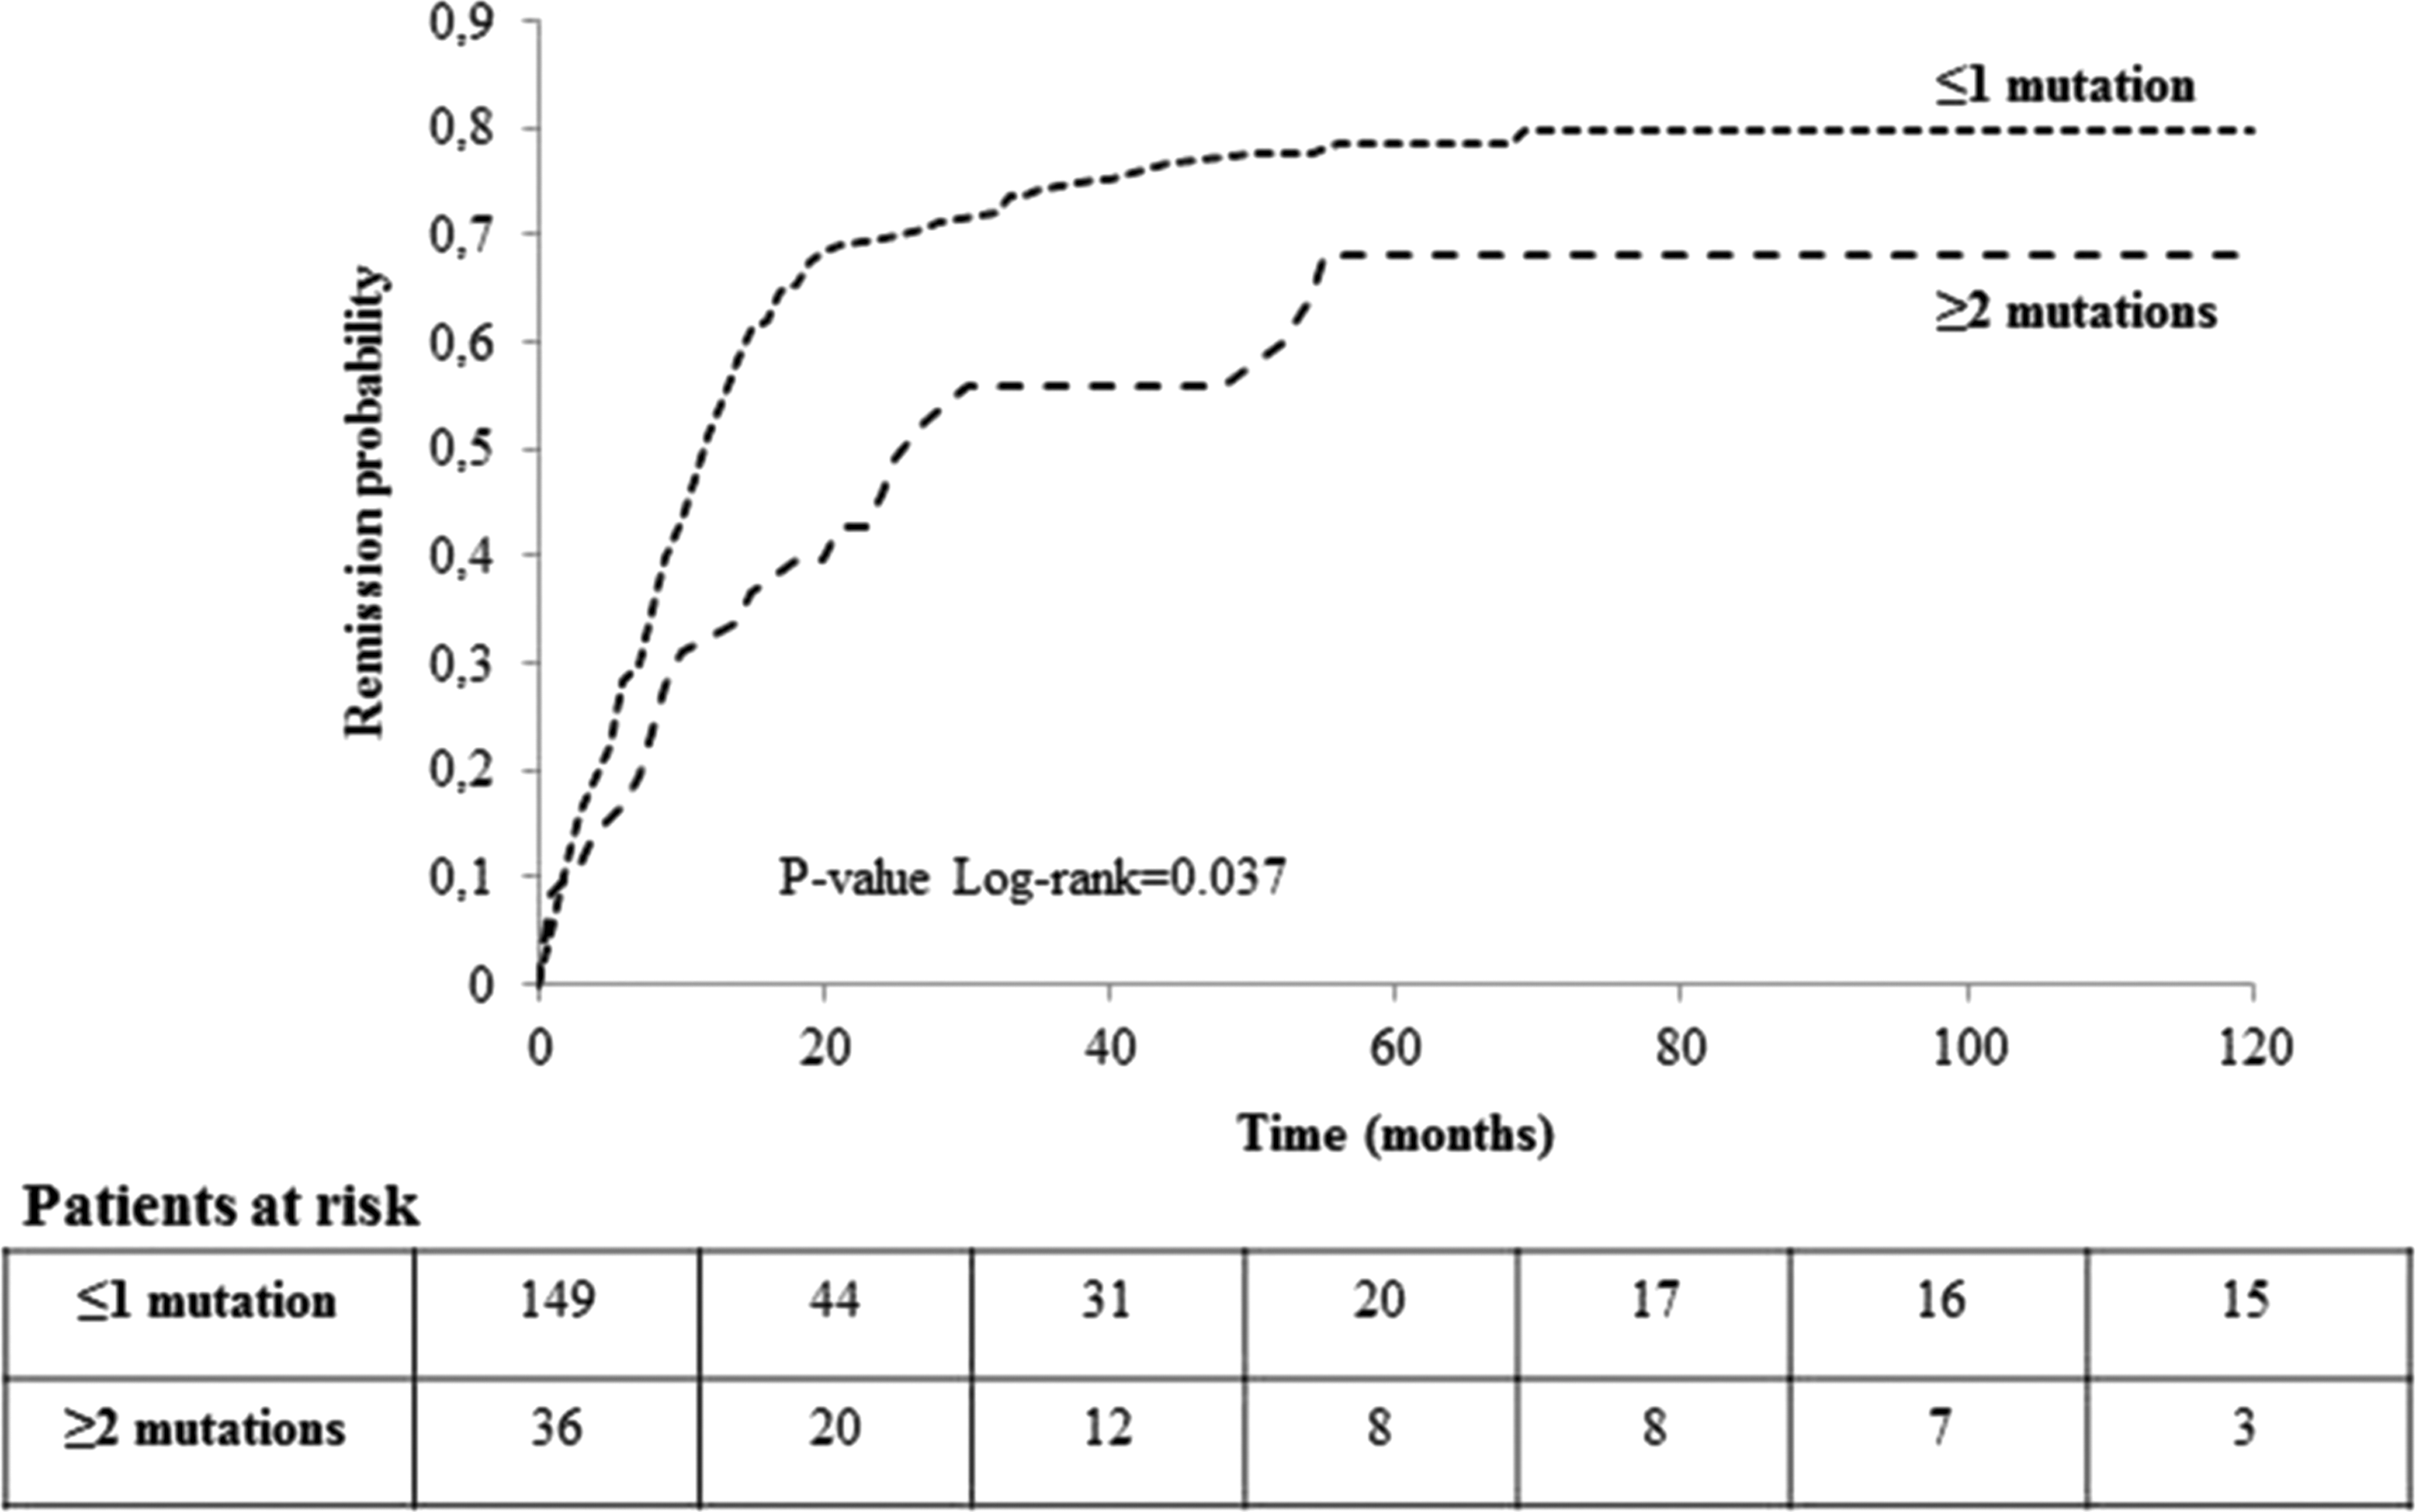
Survival curves by mutation density (dichotomized as ≤1 or ≥2 mutations) examined by Kaplan–Meier analyses with log-rank test, censoring patients at the time of patient remission or, in the case of absent remission, at the time of last clinical contact.
Sociodemographic and Clinicopathologic Characteristics of the Papillary Thyroid Cancer Series According to ≤1 or ≥2 Genetic Events
Patients not submitted to lymph nodal removal for whom the N status is unknown (NX).
Chi-square test.
t-Test.
Wilcoxon's test.
p < 0.05; ** p < 0.10.
Discussion
Recent advances in the molecular classification of thyroid cancer has improved the diagnostic work-up and the care of patients with thyroid nodules and cancer (12,21,22), highlighting the need to add information routinely on the genetic pattern. In this study, the genomic background of a large series of PTCs followed at a single center has been defined by the PTC-MA assay, and around 20% of the mutated tumors were found to harbor two or more different genetic events, always limited to one allele. A correlation between several aggressive features (size, extrathyroidal extension, or AJCC stage) and mutation density was found, regardless of the type of mutations (i.e., only point mutations, or point mutations and fusions). Kaplan–Meier curves demonstrate that the presence of two or more genetic events was associated with a significantly higher risk of having persistent disease at the last follow-up. Likely due to the limited number of samples with multiple mutations, the significance was lost after multivariable adjustments for known risk factors. This finding indicates that an accurate risk stratification of thyroid cancer cannot rely on the analysis of a single genetic event. The biological bases underlying the coexistence of different genetic events in thyroid cancer is still debated, and the scant data available indicate that they could be present in the same cell or in different cells (23 –27), consistent with the presence of intratumoral heterogeneity (27). The actual occurrence of this phenomenon in PTC is supported by the analysis of the allelic frequencies for BRAF, TERT, and RAS mutations. The presence of coexisting genetic alterations with different allelic frequencies in some tumors suggests that PTC can be formed by clones/subclones with different mutational profiles, in agreement with previous data and with studies in other tumors (28 –30).
Interestingly, it was found that PTCs of larger size have a significantly greater proportion of mutated alleles, BRAF, TERT, or RAS within the tumor, similar to data previously reported (28, 29). This result is very likely due to the better isolation of the tumor mass from the surrounding parenchyma in larger tumors, with a higher contamination of non-cancer cells in smaller specimens. Consistently, the correlation between tumor size and allelic frequency was lost when the latter was normalized for the cancer cell content. In the majority of the cases tested, the evaluation of the allelic frequencies normalized for the cancer cell content indicated the presence of the heterozygous mutation in virtually all tumor cells, in agreement with NGS and immunohistochemical data (12,26,29,31). Clinicopathologic features were not associated with the allelic frequencies of driver oncogenes, indicating that at present allelic frequencies cannot be used to optimize the prognostic prediction. On the other hand, the finding that some tumors are heterogeneous with respect to a specific mutation might have important implications for therapeutic approaches. It is expected that tumors that carry a specific molecular alteration only in a fraction of neoplastic cells might show a low level of sensitivity to targeted agents. However, the complexity revealed by this study suggests that for many tumors, combinations of targeted drugs will likely be necessary to control tumor growth.
BRAFV600E was the most frequently found genetic event (42% of cases), and the frequency of TERT promoter mutations was higher (23.5%) than previously reported (7 –9,12). The most plausible explanation for this result resides in the higher sensitivity of the PTC-MA assay compared to the standard methods used in some published series (7 –9). Indeed, the PTC-MA assay is able to detect sequence alterations present in only 5% of cells, which were uncertain or missed by Sanger sequencing (14). Interestingly, sequencing and mass spectrometry were 100% concordant for fusions, whereas among single nucleotide variants, TERT mutations were the most frequently event missed by Sanger sequencing when present at low allelic frequency. The very high GC content of the TERT sequence could explain the lower sensitivity of Sanger or other PCR-based technologies. Another explanation could reside in the fact that TERT mutations occur later in tumor progression when a high number of stromal cells are present in the tumor mass (32). Finally, the differences with series analyzed by high-throughput methods (12) could be related to the clinical characteristics of the samples analyzed or by epidemiologic reasons, as suggested by the highly discrepant frequencies of TERT mutations in series from the United States and China (10% and <3%, respectively) (12,13). Moreover, consistent with previous data (33), the analysis of the mutational distribution over the last 21 years revealed that the genetic profile of PTC is changing, with an increased frequency of BRAF and TERT mutations, particularly in the last five years, a period that was not included in TCGA analysis (12).
It is worth noting that almost half of the TERT mutations were associated with BRAF variations or with RET fusions, confirming that they frequently occur as a second mutational event. Nevertheless, TERT was the only mutated gene in several cases, indicating that it carries its own tumorigenic potential. A strong cooperative role of coexisting BRAFV600E and TERT promoter mutations in the development of a group of PTCs displaying the highest clinicopathologic aggressiveness has been found, confirming the central prognostic value of the association (8,10,34).
RAS point mutations had a prevalence of 6.2%, and were mostly due to NRAS involvement, and they were tightly associated with the follicular PTC variant, consistent with findings of TCGA (12). Interestingly, TRK rearrangements, though rare (2.4%), were found only in young patients and were associated with aggressive features, as previously highlighted in a pediatric population (35). Of note, there are only limited data on tumors harboring this genetic event, since the majority of molecular diagnostic tests currently used for thyroid tumors do not cover TRK gene fusions. Nevertheless, the current results highlight that these fusions must be routinely analyzed, also in view of the recent availability of a small-molecule, highly selective tyrosine receptor kinase inhibitor, which offers new possibilities for the treatment of these patients.
The main limitation of the PTC-MA approach is that only targeted point mutations and stable breakpoints can be analyzed. For that reason, the present genetic analysis did not include some of the mutations recognized to be pathogenic for thyroid cancer (e.g., MET, ALK, BRAF fusions, p53). Nevertheless, those mutations are rare in PTCs, being reported with a prevalence range 0.2–2.3% in TCGA (12). Moreover, it is noteworthy that cases with none of the genetic events tested by the PTC-MA assay typically have no aggressive features and a good outcome, indicating that they are likely caused by mutations with a low transforming power. Thus, the coverage offered by this customized panel could be of significant importance in the definition of the genetic pattern of most PTC cases and, in particular, of those with a more aggressive behavior, even though it will be continuously improved to cover other genetic alterations. This approach has a major translational relevance, since in the era of personalized medicine, it raises the need to set up cost- and time-effective techniques to investigate multiple molecular markers, especially those with a known prognostic impact or that can be targeted pharmaceutically.
Finally, the relatively high level of heterogeneity found in the genotyped tumors warrants attention, since the occurrence of this phenomenon is likely to affect response to targeted drugs. The assessment of such complexity, for instance by the analysis of paired primary and metastatic samples from the same patient to acquire insights into clonality and subclonality patterns of genomic events, is mandatory for the further development of personalized medicine in thyroid cancer.
Footnotes
Acknowledgments
The authors wish to acknowledge the invaluable contribution of Dr. Emanuela Minna, Dr. Mara Mazzoni, and Mrs Maria Grazia Rizzetti in the control experiments for the evaluation of allelic frequencies.
Author Disclosure Statement
The authors declare that there is no conflict of interest that could be perceived as prejudicing the impartiality of the research reported.