
Abstract
Background:
Telomerase reverse transcriptase (TERT) promoter mutations have been found in a subset of papillary thyroid carcinomas (PTCs) and are associated with tumor aggressiveness and worse prognosis. However, little is known about the status of TERT mRNA expression and its relationship between TERT promoter mutations and clinicopathological features.
Methods:
We analyzed 159 PTC samples for TERT promoter mutations using direct DNA sequencing. TERT expression was measured using quantitative reverse transcription polymerase chain reaction. To examine low allelic frequency of TERT promoter mutations with high sensitivity, we used droplet digital polymerase chain reaction (ddPCR). The relationship between the status of the TERT promoter mutation/expression and clinicopathological features including recurrence risk was statistically analyzed.
Results:
TERT promoter mutations were found in 20 cases (12.6%). However, TERT expression was observed not only in the mutation-positive tumors but also in 56 of 139 (40.3%) mutation-negative tumors. Among them, we detected low allelic frequency of TERT promoter mutations in three samples (5.4%) using ddPCR. We confirmed a significant association between TERT promoter mutations and aggressive clinicopathological features in this series. The risk of recurrence of TERT mutation-negative/expression-positive tumors was significantly higher than that of the mutation-negative/expression-negative tumors, suggesting that TERT expression even in absence of a mutation confers a negative influence on PTCs. Moreover, when we reclassified the mutation-negative cases into two groups based on the TERT expression levels: expression-negative/expression levels <80th percentile and expression levels >80th percentile because minimal expression may have a negligible clinical impact, a higher hazard ratio for recurrence was observed. Interestingly, TERT expression levels in the mutation-negative PTCs were inversely correlated with patient age and the presence of BRAF mutations.
Conclusions:
We confirm a strong correlation between the presence of TERT promoter mutations and aggressive clinicopathological features in this PTC series. In addition, there were PTCs showing high TERT mRNA expression even in the absence of TERT promoter mutations. These cases also showed a significantly higher recurrence rate. Since the TERT promoter mutations are observed only in elderly patients, TERT mRNA expression can be a useful prognostic marker especially in younger PTC patients.
Introduction
The incidence of papillary thyroid carcinoma (PTC) has been increasing worldwide (1). PTC has generally a favorable prognosis; however, ∼10–15% of patients have recurrences either locally or/and at distant sites, some of which become refractory to treatment (2,3). To distinguish between high-risk and low-risk cases, there have been many studies evaluating the value of molecular markers to predict PTC aggressiveness and prognosis.
The BRAFV600E mutation is the most frequent genetic change in PTCs. Its prevalence varies from 30% to 80% (4), probably depending on the population. Many studies have indicated an association between the presence of the BRAFV600E mutation and aggressive clinicopathological features; however, its prognostic value, especially as an independent marker, is still debated. According to our results, the mutation rate in Japan is high (∼80%), and we did not find any correlation between the presence of the BRAFV600E mutation and aggressive clinicopathological features and worse prognosis in our series (5).
Recently, mutations in the promoter region of the telomerase reverse transcriptase (TERT) gene have been found in many types of cancers including thyroid carcinomas. There are two hot spots, called C250T (chr5: 1,295,250C>T) and C228T (chr5: 1,295,228C>T) (6,7), and these are mutually exclusive. The average rate of the presence of these mutations in PTC has been reported to be ∼10% (8), and there seems to be no major differences between populations. The mutations create a binding motif for the E26 transformation-specific (ETS) transcription factors and upregulate TERT mRNA expression, especially when the ETS family members are activated (e.g., by BRAFV600E) (9 –11).
While the primary function of TERT is to maintain telomere length, there is increasing evidence regarding its telomerase-independent oncogenic functions through NF-κB, Wnt/β-catenin, and MYC pathways (12 –14). In PTCs, many studies have demonstrated that the coexistence of the BRAFV600E mutation and TERT promoter mutations is strongly associated with aggressive features and worse prognosis (5,15 –27). Moreover, TERT promoter mutations seem to be also associated with anaplastic transformation (28).
However, regarding the impact of TERT promoter mutations, two recent findings should be considered. First, Paulsson et al. have reported that there is a subset of cases showing TERT mRNA expression in the absence of TERT promoter mutations in follicular thyroid tumors (adenomas, follicular tumors with uncertain malignant potential, and carcinomas) (29). In that study, the authors have also demonstrated that tumors with positive TERT mRNA expression showed a shorter time to recurrence than TERT expression-negative carcinomas (29). However, many of the TERT-expressing tumors harbored TERT promoter mutations, and the prognostic value of TERT mRNA expression independent of the presence of TERT promoter mutations has not been analyzed.
Muzza et al. also demonstrated TERT protein expression in PTCs without TERT promoter mutations (30). However, the number of analyzed cases was limited, and a correlation analysis between presence of TERT expression and clinicopathological findings was not presented (30).
Second, according to The Cancer Genome Atlas (TCGA) data, TERT promoter mutations were not clonal in PTCs (31). The mutant allele frequency varied from 5% to 50% (average 23%) and there were cases with low allelic frequency that may not be detectable by regular Sanger sequencing (31).
In PTCs, little is known about the relationship between TERT mRNA expression and clinicopathological features. Therefore, we measured TERT mRNA expression levels and allelic frequency of the TERT promoter mutations in PTCs in this study, and analyzed their impact on clinicopathological features, especially as a prognostic marker.
Materials and Methods
PTC samples and patient information
We collected 159 PTC samples operated between November 2001 and December 2017 at Nagasaki University Hospital (Nagasaki, Japan) and Kuma Hospital (Kobe, Japan). Clinicopathological data were collected from the patients' medical records. Patient age at operation ranged 14–81 years old (median age: 54 years old, 17.0% male). For staging, the AJCC/TNM staging system (8th edition) was used (32,33). The histological subtypes were 146 classic PTCs (25 were microcarcinomas), 10 follicular variant of PTCs (4 were microcarcinomas), 2 diffuse sclerosing variant of PTCs, and 1 tall cell variant of PTCs.
The study protocol was approved by the institutional review boards of Nagasaki University and Kuma Hospital. Written informed consent was obtained from each patient. Fresh tumor tissue samples were obtained during surgical operations, snap frozen in liquid nitrogen, and stored at −80°C. DNA and total RNA were extracted at the same time using ISOGEN reagent (Nippon Gene) according to the manufacturer's protocol.
Direct DNA sequencing
The mutational status of BRAF (around V600) and the promoter region of TERT were analyzed by direct DNA sequencing (the Sanger method) as described previously (5).
Quantitative reverse transcription polymerase chain reaction
Total RNA was reverse transcribed using a High Capacity RNA-to-cDNA kit (Applied Biosystems). The following polymerase chain reactions (PCRs) were done using SYBR Premix Ex TaqII (TaKaRa Bio) in a Thermal Cycler Dice real-time system (TaKaRa Bio). The cycle threshold value, which was determined using the second derivative method, was used to calculate relative expression. The TERT mRNA levels were normalized using TATA-binding protein (TBP) mRNA expression as a reference. Primer sequences are TERT ex6–7 F, 5′-AGCCACGTCTCTACCTTGAC-3′ and TERT ex7–8 R, 5′-CTCATTCAGGGAGGAGCTCT-3′; TBP ex2 F, 5′-CCTGCCACCTTACGCTCAG-3′ and TBP ex3 R, 5′-TGGTGTTCTGAATAGGCTGTGG-3′.
Droplet digital PCR
Droplet digital PCR (ddPCR) was performed using ddPCR Supermix for Probes (Bio-Rad Laboratories) in a QX100 droplet generator (Bio-Rad Laboratories), a C1000 Touch thermal cycler (Bio-Rad Laboratories), and a QX100 droplet reader (Bio-Rad Laboratories). Probes used for the ddPCR were TERT mut, 5′-/56-FAM/C+CC+C+T+TC+CGG/3IABkFQ/-3′, and TERT wt 228, 5′-/5HEX/C+CC+C+C+TC+CGG/3IABkFQ/-3′ (a base preceded by + is Locked Nucleic Acid). Primers were same as those used in direct DNA sequencing.
It is possible to discriminate between C228T and C250T in the two-dimensional (2D) display using the mentioned two probes at the same time because the TERT mut probe can bind to both C228T and C250T, but the wt probe can bind to only C228. In the case of the C250T mutation, both FAM and HEX signals are detected, while only a FAM signal is detected when the mutation is C228T.
Recurrence as an endpoint
Disease recurrence was defined as a surgically removed and pathologically verified local lesion or regional metastasis/distant metastasis detected by ultrasonography, scintigraphy, or other imaging not earlier than 6 months after initial treatment. The time to recurrence was calculated based on the date of reoperation or on the date of recurrence detection by medical imaging.
Statistical analysis
Univariate Fisher's or Fisher–Freeman–Halton exact test was used for categorical data. Pairwise statistical comparisons of proportions in more than two groups were performed with the COMPPROP macros in SAS. Nonparametric Mann–Whitney or Kruskal–Wallis test followed by Dwass, Steel, Critchlow-Fligner multiple comparison procedure for continuous data was used to compare characteristics in different PTC subgroups.
To analyze recurrence-free survival (RFS), the Kaplan–Meier method and log-rank test were used. Factors affecting RFS were assessed in Cox proportional hazard models. To determine a threshold of the TERT expression level based on the concept that minimal expression compared with relatively higher expression by the TERT promoter mutations could have negligible effect on clinical behavior, we first calculated hazard ratios (HRs) in serial optimal Cox models for each cutoff percentile (mRNA expression-negative plus expression levels below each percentile cases vs. expression levels above the percentile cases) in five percentile increment. We next ran Kaplan–Meier analyses using percentiles that demonstrated relatively higher HR. Then optimal threshold was selected based on the log-rank p-value.
Multivariable logistic regression models were used to identify factors associated with extrathyroidal extension or pT category. Analyses with very small number of outcomes (<5 per cell) or when quasi-complete separation was observed were conducted using Firth's approach to bias-reducing penalized maximum likelihood fit. Nonautomatic model optimization was routinely performed using the Akaike information criteria. Stepwise variable selection was applied to the models amendable to automatic optimization. Once the most appropriate model was determined, the maximum likelihood estimates of the respective parameters and their Wald-type 95% confidence intervals (CIs) were calculated. Statistical assessments were performed using the 3.71 release of SAS Studio for the 9.4M5 version of SAS (SAS Institute) or IBM SPSS Statistics Version 24 software (IBM). Graphs were drawn using GraphPad Prism 6 (GraphPad). All p-values were two-sided and considered significant if p < 0.05.
Results
Mutational status of the TERT promoter region and TERT expression
We first screened 159 PTC samples for mutations of the TERT promoter region (C228T and C250T) by direct DNA sequencing. TERT promoter mutations were found in 20 (12.6%) samples, all of which were C228T, and there was no C250T substitution in the current series. We next examined TERT mRNA expression by real-time quantitative reverse transcription PCR. TERT expression was confirmed in all of the TERT promoter mutation-positive samples. Interestingly, even among 139 mutation-negative samples, 56 (40.3%) showed TERT expression. We then explored the possibility that there are tumors with low allelic frequency of TERT promoter mutations that are not detectable by regular sequencing.
To investigate the presence of the mutations with high sensitivity, we used ddPCR. First, the detection limit of the ddPCR for the two TERT promoter mutations was determined using serial dilutions of the PCR product of the TERT promoter region containing C228T or C250T in the PCR product of the wild-type promoter. In our hands, the detection limit of the mutant allele frequency was ∼0.25% (Supplementary Fig. S1). We then analyzed all of the 56 TERT-expressing samples using ddPCR. We identified the mutation with low allelic frequency in three samples (5.4%), hereafter PTCs A, B, and C (Fig. 1A). According to the 2D display, all harbored a C228T mutation.

Low allelic frequencies of the TERT promoter mutation in three samples, PTC A, PTC B, and PTC C. (
The allelic frequencies of the mutant were 17%, 10%, and 5% in PTCs A, B, and C, respectively (Supplementary Table S1). Since tumor tissues consist not only of tumor cells but also of stromal, endothelial, and blood cells, the allelic frequency of the mutant in the tumor cells was corrected for tumor purity based on the ratio of the TERT promoter mutation to the BRAFV600E mutation because the BRAFV600E mutation is considered a clonal monoallelic mutation in all tumor cells according to the data obtained using next-generation sequencing and immunohistochemistry (34,35). However, one should note that there is also some debate about the allelic frequency of the BRAFV600E mutation. Guerra et al. reported variable BRAF mutant allelic frequencies in PTCs using pyrosequencing (36). For this study, we assumed that all tumor cells were BRAFV600E positive. After the correction, the allelic frequencies of the TERT promoter mutation in tumor cells were as follows: PTC A, 14%; PTC B, 4%; and PTC C, 3%, which means that 28%, 8%, and 6% of the tumor cells had the TERT promoter mutation in PTCs A, B, and C, respectively (Supplementary Table S1).
We then retrospectively checked the chromatograms of the direct DNA sequencing results of these samples. There were discrete peaks of C228T (Fig. 1B), but it was impossible to confidently discriminate these signals from background signals. The results of direct DNA sequencing, expression analysis, and ddPCR are summarized in Figure 2A–C.
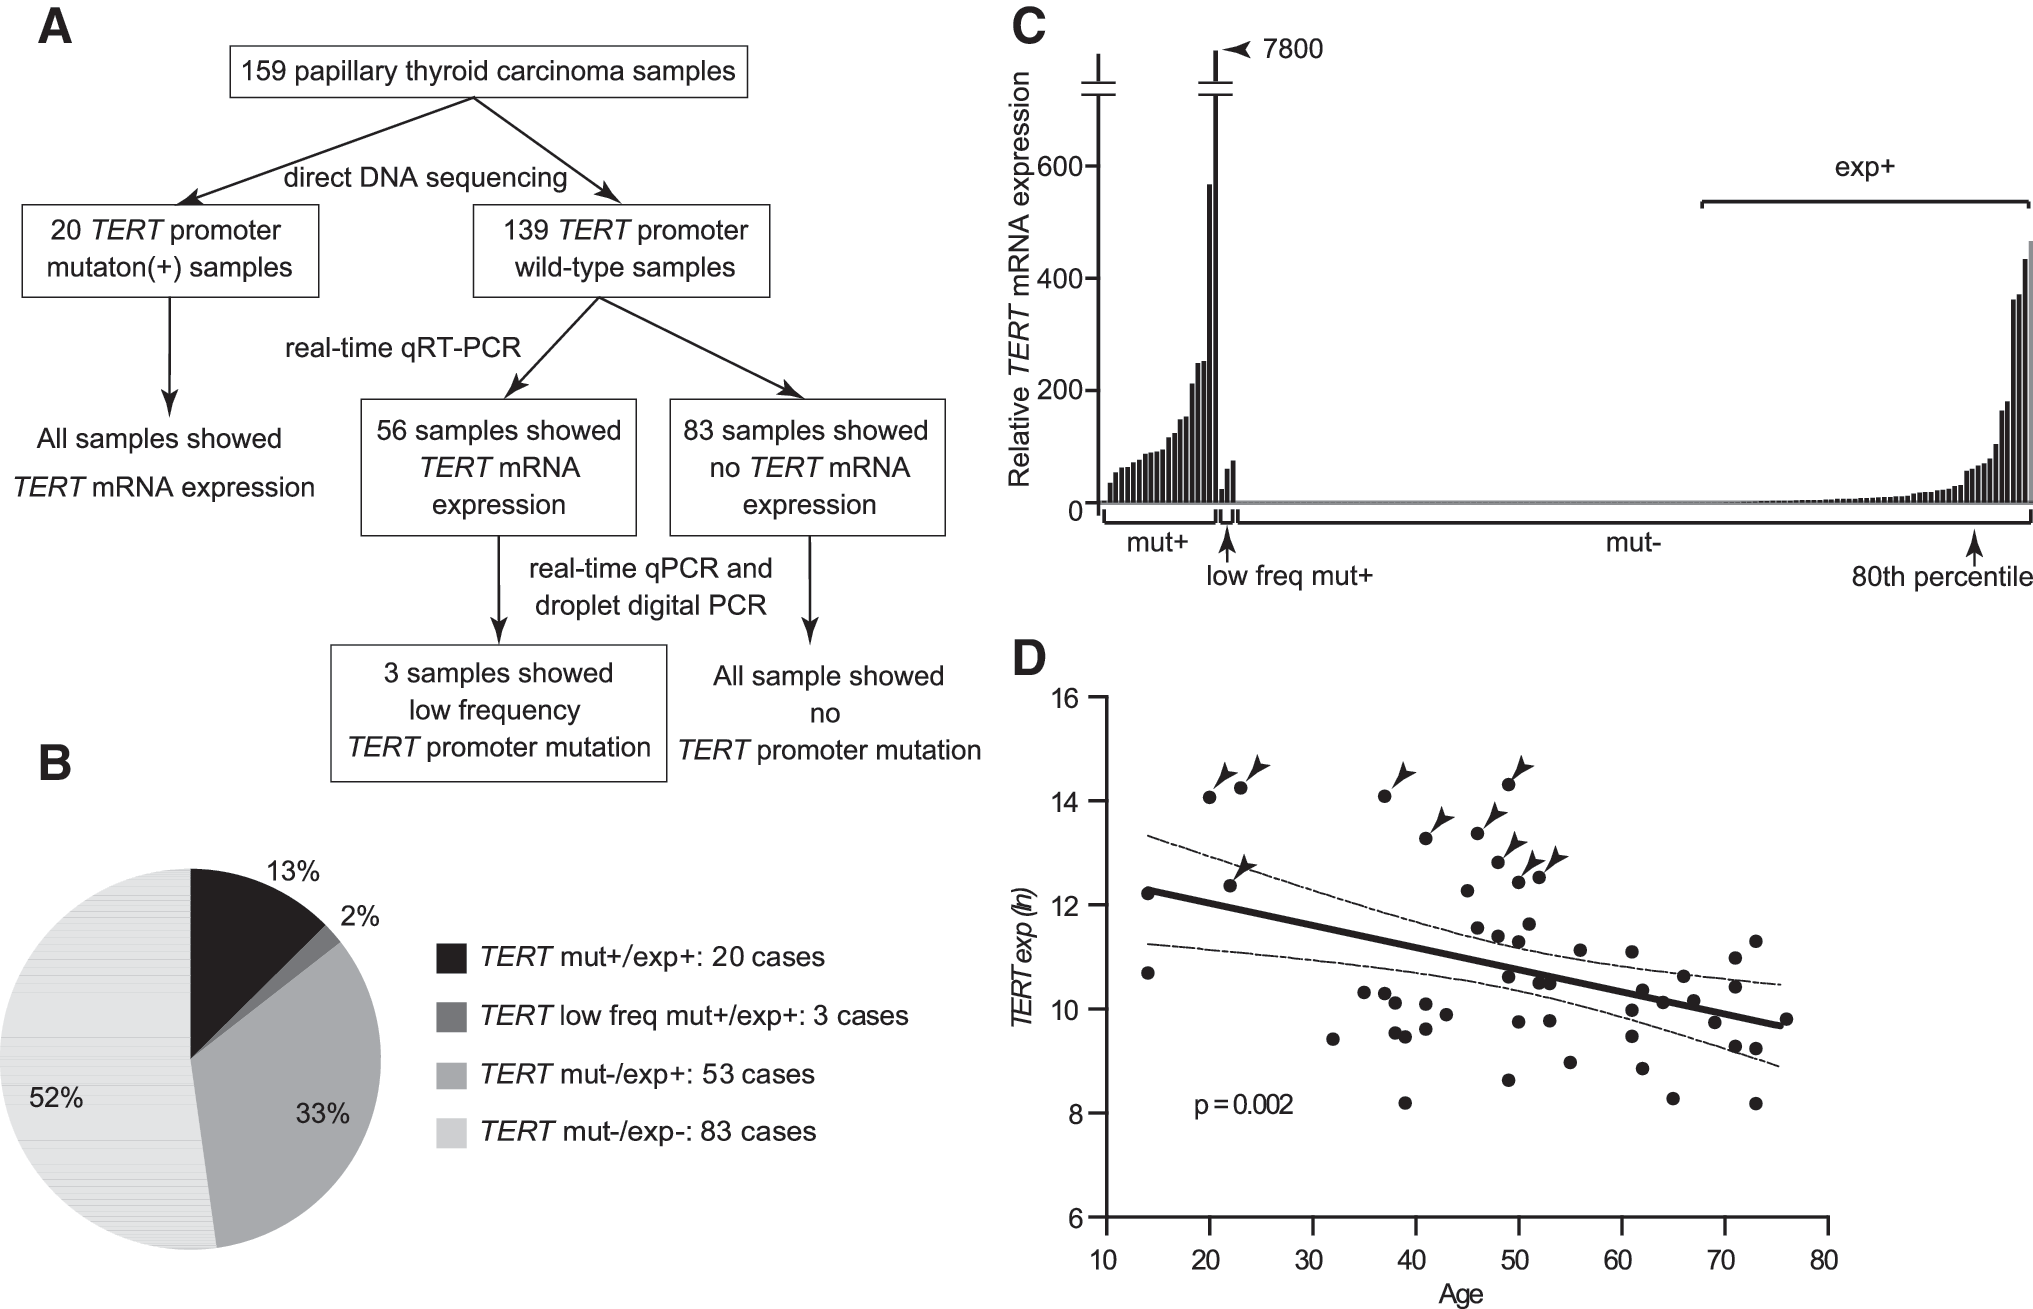
Summary of the TERT mutational and expression status in the current series. (
Taken together, TERT expression was observed in all of the tumors with the TERT promoter mutation as expected, even in the cases with low allelic frequency; however, TERT expression was also detected in 38% of mutation-negative cases, suggesting that there are other mechanisms to upregulate TERT expression.
Relationship between TERT mutational/expression status and clinicopathological features
We analyzed the relationship between the status of the TERT promoter mutation/expression and clinicopathological features. We classified the 159 cases into three groups: the TERT promoter mutation-negative/mRNA expression-negative group (mut−/exp−), the TERT promoter mutation-negative/mRNA expression-positive group (mut−/exp+), and the TERT promoter mutation-positive group (mut+/exp+). As shown in Table 1, tumors with the mutation (mut+/exp+) showed statistically significant differences in age, extrathyroidal extension, stage II/III/IV, compared with the other two groups (mut−/exp− and mut−/exp+) (1 vs. 3 and 2 vs. 3). These findings suggest that the TERT promoter mutation confers aggressive properties to PTCs.
Association Between TERT Mutational/Expression Status and Clinicopathological Features
Four cases with distant metastasis and 20 cases that were followed for <6 months were not included.
CI, confidence interval; LN, lymph node; mut−/exp−, TERT promoter mutation-negative/mRNA expression-negative; mut−/exp+, TERT promoter mutation-negative/mRNA expression-positive; mut+/exp+, TERT promoter mutation-positive/mRNA expression-positive; ns, not significant, p ≥ 0.05; SD, standard deviation; TERT, telomerase reverse transcriptase.
RFS was evaluated using the Kaplan–Meier method and Cox proportional hazard models. In this analysis, we excluded four cases that had distant metastasis at the time of operation and additional 20 cases that were followed for <6 months. The survival curves of the three groups separated, and there was a statistically significant trend (Fig. 3A; log-rank trend, p < 0.001).
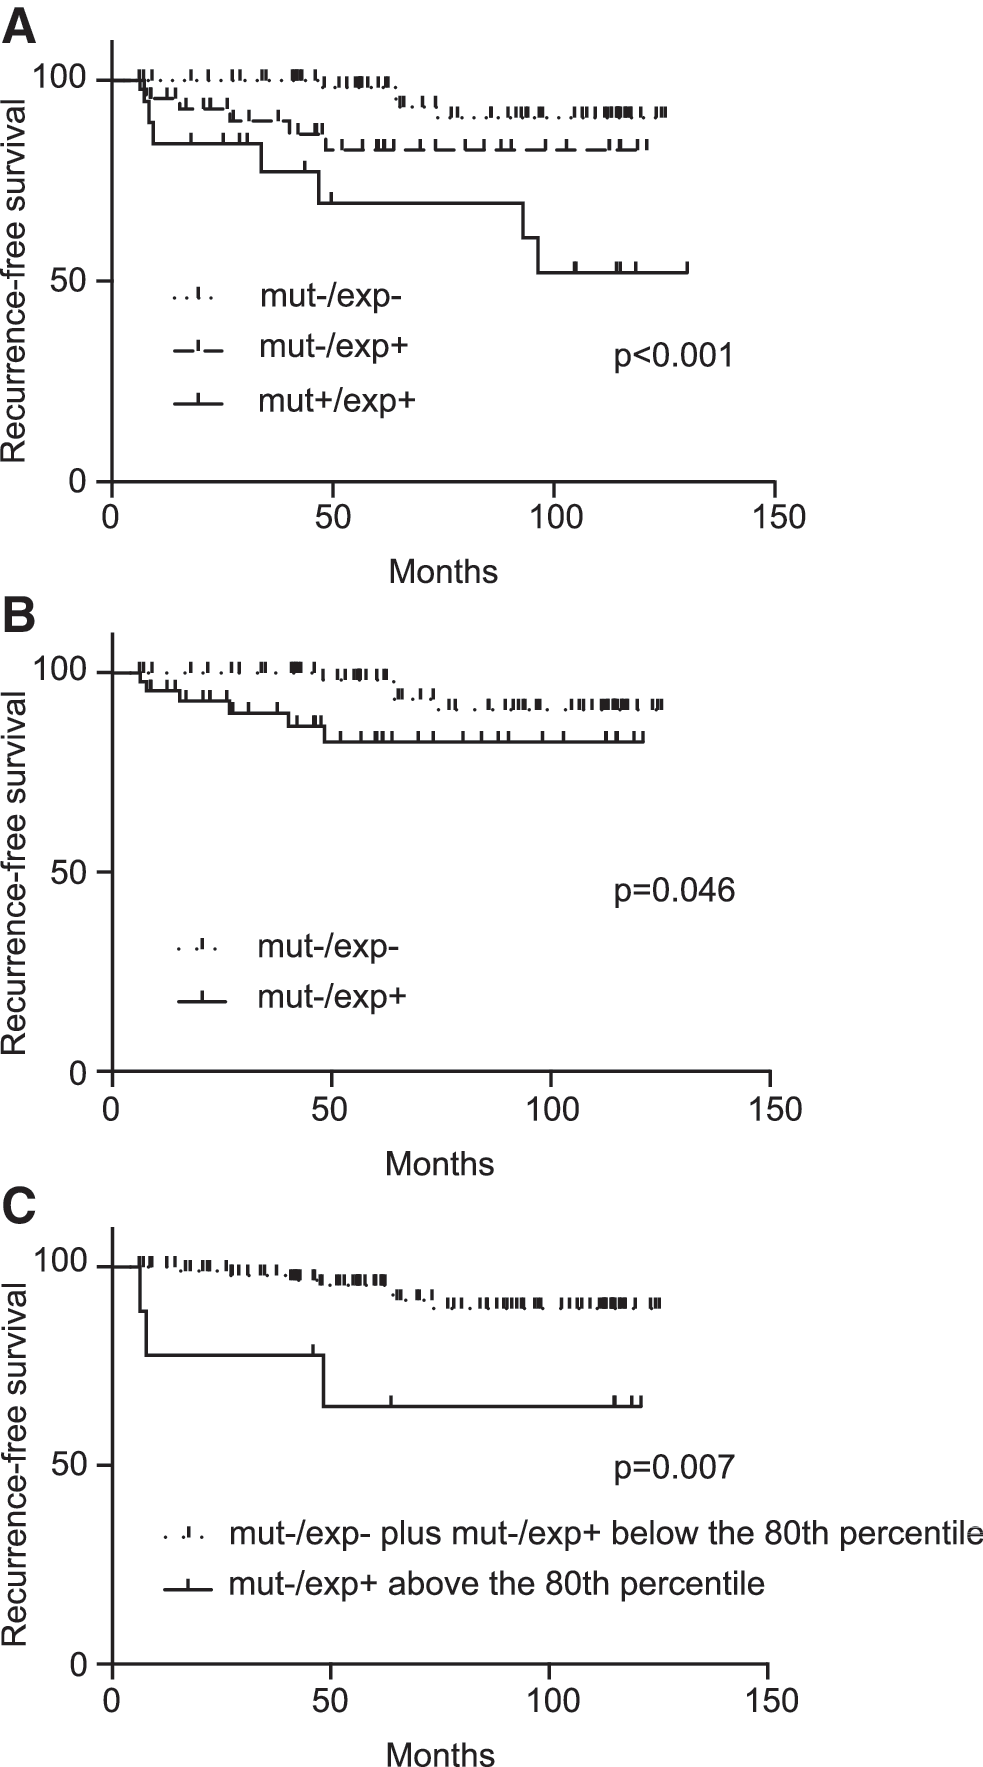
Kaplan–Meier curves of RFS. The vertical tick marks correspond to censored data. (
The HRs for recurrence of the mut+/exp+ group relative to the mut−/exp− group and the mut−/exp+ group after adjustment for age, sex, tumor size, extrathyroidal extension, and lymph node metastasis were 20.47 ([95% CI 4.54–114.1], p < 0.001) and 5.38 ([95% CI 1.14–30.32], p = 0.046), respectively (Table 2; 1st and 2nd comparisons). In the optimal models, the HRs of the mut+/exp+ group relative to the mut−/exp− group and the mut−/exp+ group were 23.39 ([95% CI 4.49–121.85], p < 0.001) and 6.24 ([95% CI 1.44–27.13], p = 0.015), respectively (Table 2; 1st and 2nd comparisons).
Hazard Ratios of Disease Recurrence
In the optimal model, only “age” was used for adjustment.
HR, hazard ratio; mut−/exp >80th percentile, TERT mRNA expression levels >80th percentile of the mut−/exp+ cases; mut−/exp− and exp <80th percentile, TERT promoter mutation-negative/mRNA expression-negative and mRNA expression levels <80th percentile of the mut−/exp+ cases; mut−/exp−, TERT promoter mutation-negative/mRNA expression-negative; mut−/exp+, TERT promoter mutation-negative/mRNA expression-positive; mut+/exp+, TERT promoter mutation-positive/mRNA expression-positive.
In two-group analysis, based on the mutational status (mut−/exp− and mut−/exp+ vs. mut+/exp+) and the expression status (mut−/exp− vs. mut−/exp+ and mut+/exp+), the Kaplan–Meier curves and the HRs are shown in Supplementary Figure S2A and B and Supplementary Table S2, respectively.
Regarding the grouping based on the expression status (regardless of the mutational status), we attempted to set a threshold based on the concept that minimal expression could have a negligible effect on the clinical behavior because many of the mut–/exp+ tumors showed very low expression compared with the mut+/exp+ group (Fig. 2C).
First, we calculated HRs in serial optimal Cox models for each cutoff percentile (mRNA expression-negative plus expression levels below each percentile cases vs. expression levels above the percentile cases) (Supplementary Fig. S3A). We then ran Kaplan–Meier analyses between the 50th and 70th percentiles showing high HRs (Supplementary Fig. S3B). This allowed us to identify the optimal threshold, the 65th percentile (Supplementary Fig. S3B). Based on this, recurrence was the only parameter that was statistically significant (Supplementary Table S3), and the HR adjusted for age, sex, tumor size, extrathyroidal extension, and lymph node metastasis was 4.12 ([95% CI 1.55–10.72], p = 0.005). In the optimal model, the HR was 4.44 ([95% CI 1.71–11.53], p = 0.002) (Supplementary Table S2; 5th comparison). Other results using different adjustments are listed in Supplementary Table S2.
Relationship between TERT expression and clinicopathological features in the mutation-negative cases
Next, we focused on the TERT promoter mutation-negative cases. Interestingly, there were no statistical differences between the mut−/exp− group and the mut−/exp+ group in all clinicopathological parameters except mean recurrence time (Table 1; 1 vs. 2). The Kaplan–Meier curve showed a significant difference (Fig. 3B, p = 0.046), and Cox proportional hazard models also demonstrated statistical significance after adjustment for covariates (Table 2; 3rd comparison).
The HR of the mut−/exp+ group relative to the mut−/exp− group adjusted for age, sex, tumor size, extrathyroidal extension, and lymph node metastasis was 4.25 ([95% CI 1.15–17.71], p = 0.041) (Table 2; 3rd comparison). In the optimal model, the HR was 4.24 ([95% CI 1.13–15.90], p = 0.032) (Table 2; 3rd comparison). Since the unadjusted HR was not significant (p = 0.067), we analyzed the relationship between age and the amount of TERT expression. Surprisingly, TERT expression was inversely correlated with age (Fig. 2D, p = 0.002), a finding that is opposite to the presence of TERT promoter mutations. These results indicate that TERT expression, even without presence of a TERT promoter mutation, has a negative influence on PTC prognosis.
Because many cases of the mut−/exp+ tumors showed very low TERT expression compared with the mut+/exp+ group (Fig. 2C), we also attempted to reclassify all mut− cases into two new groups based on the TERT expression level using the same method already described (Supplementary Fig. S3C). Kaplan–Meier analyses were run between the 75th and 85th percentiles, and the optimal threshold was determined to be the 80th percentile (Supplementary Fig. S3D). Using this threshold, the unadjusted HR was 5.72 ([95% CI 1.39–19.23], p = 0.01) (Table 2; 4th comparison), which was higher than the HR calculated based on the presence or absence of the expression (exp− vs. exp+). In the optimal model, the HR was 4.34 ([95% CI 1.11–16.94], p = 0.035) (Table 2; 4th comparison).
Using this grouping, there were significant differences in age (the group of expression levels >80th percentile was younger), stage, recurrence, recurrence time, and the prevalence of the BRAF mutation (Table 3). Interestingly, all cases with an expression level >80th percentile were stage I and displayed a significantly lower rate of the BRAF mutation (30.0% vs. 69.9%) (Table 3). Even though tumors in which the expression levels were >80th percentile were present in patients with younger age, lower stage, and a lower BRAF mutation rate, their prognosis was worse. The Kaplan–Meier curve also demonstrated a significant difference (Fig. 3C, p = 0.007).
Association Between TERT Expression and Clinicopathological Features in the TERT Promoter Mutation-Negative Cases
Three cases with distant metastasis and 20 cases that were followed for <6 months were not included.
ns, not significant, p ≥ 0.05; TERT exp− and exp <80th percentile, TERT mRNA expression-negative and mRNA expression levels <80th percentile; TERT exp− >80th percentile, TERT mRNA expression levels >80th percentile.
Discussion
First, in this study, we have successfully reconfirmed the strong correlation between the presence of TERT promoter mutations and aggressive clinicopathological features in this PTC series. Second, we have demonstrated that there is a subset of PTCs that express TERT mRNA even in the absence of the TERT promoter mutation (mut−/exp+). In this case, TERT expression conferred a significant negative impact on PTC prognosis, which was, however, not as high as in the cases with a TERT promoter mutation. Since TERT promoter mutations are only observed in elderly patients, TERT expression may be a promising marker in younger patients.
Among TERT mut−/exp+ cases (determined by regular sequencing), there seems to be a small number of tumors with low allelic frequency of the TERT promoter mutation. Hence, in addition to a low allelic frequency of TERT promoter mutations, there are other mechanisms that upregulate TERT expression in the majority of the TERT mut−/exp+ cases. In other types of cancers, it has been reported that amplification, structural variants, alternative splicing, and promoter methylation also upregulate TERT expression (37 –44). Of note, the allelic frequency depends on tumor cell purity and sensitivity of a detection method. It is still unclear whether the low allelic frequency of the TERT promoter mutation has a significant influence on tumor aggressivity because the number of such cases in the current series was too small. Further studies are needed to fully understand the mechanisms of the TERT mRNA upregulation in PTCs.
In the current series, all of the TERT promoter mutation-positive cases were 55 years of age or older, and among the 8 recurrent cases in this age group, 7 had a TERT promoter mutation. Thus, the presence of a TERT promoter mutation is probably a good marker in elderly patients. In contrast, since there was no TERT promoter mutation-positive case in the patients younger than 55 years, this mutation is not useful in younger patients presenting with PTCs. However, in these patients, TERT expression appears to have prognostic value.
In the TERT mut−/exp+ group, there were many tumors with a very low amount of TERT expression compared with the levels of TERT expression in the TERT promoter mutation-positive cases. Such a minimal expression may not have clinical significance; therefore, we attempted to seek the best threshold based on the TERT expression levels. In this study, the highest HR was obtained when the mutation-negative cases were categorized into two groups: cases with expression levels >80th percentile and others. However, it is necessary to analyze a much larger number of cases to determine a proper threshold. In addition, the threshold may be influenced by the detection method. This is a limitation of this study. Moreover, since an active surveillance management approach has been used for low-risk micro-PTCs in Japan, current cases may not be fully representative of the whole PTC spectrum. It should rather be considered as a proof of principle that high TERT expression is associated with risk for recurrence.
The TERT expression levels >80th percentile cases were associated with larger tumor size, more frequent lymph node metastasis and extrathyroidal extension, and more T3 and T4 tumors than those in the other group, yet these differences were not statistically significant (Table 3), which could be due to the very small number of cases (only 10) in the group. For the same reason, it was difficult to compare these cases with the mutation-positive cases. Intriguingly, in the mutation-negative cases, TERT expression levels were inversely correlated with patient age and the frequency of the BRAF mutation. We have reported that tumor size is inversely correlated with the presence of the BRAF mutation in pediatric and adolescent PTCs (45). Taken together, tumors without the BRAF mutation may likely have higher TERT expression levels and more aggressive features in young PTC patients.
In summary, as reported by others, we confirm the association between presence of TERT promoter mutations and aggressive clinicopathological characteristics in PTCs. Moreover, high TERT expression levels were observed in PTCs even in TERT promoter mutation-negative tumors in patients of all ages, and TERT expression was associated with worse prognosis. Since TERT promoter mutations are only found in elderly patients, TERT expression can also be a useful marker, especially in younger patients with PTCs.
Footnotes
Acknowledgment
This study was supported, in part, by Grants-in-Aid for Scientific Research (JSPS KAKENHI) Grant Nos. 26293222, 26293142, and 16K09804.
Author Disclosure Statement
No competing financial interests exist.
Supplementary Material
Supplementary Figure S1
Supplementary Figure S2
Supplementary Figure S3
Supplementary Table S1
Supplementary Table S2
Supplementary Table S3