
Abstract
Background:
Inflammation is associated with marked changes in cellular thyroid hormone (TH) metabolism in triiodothyronine (T3) target organs. In the hypothalamus, type 2 deiodinase (D2), the main T3 producing enzyme, increases upon inflammation, leading to an increase in local T3 availability, which in turn decreases thyrotropin releasing hormone expression in the paraventricular nucleus. Type 3 deiodinase (D3), the T3 inactivating enzyme, decreases during inflammation, which might also contribute to the increased T3 availability in the hypothalamus. While it is known that D2 is regulated by nuclear factor κB (NF-κB) during inflammation, the underlying mechanisms of D3 regulation are unknown. Therefore, the aim of the present study was to investigate inflammation-induced D3 regulation using in vivo and in vitro models.
Methods:
Mice were injected with a sublethal dose of bacterial endotoxin (lipopolysaccharide [LPS]) to induce a systemic acute-phase response. A human neuroblastoma (SK-N-AS) cell line was used to test the involvement of the thyroid hormone receptor alpha 1 (TRα1) as well as the activator protein-1 (AP-1) and NF-κB inflammatory pathways in the inflammation-induced decrease of D3.
Results:
D3 expression in the hypothalamus was decreased 24 hours after LPS injection in mice. This decrease was similar in mice lacking the TRα. Incubation of SK-N-AS cells with LPS robustly decreased both D3 mRNA expression and activity. This led to increased intracellular T3 concentrations. The D3 decrease was prevented when NF-κB or AP-1 was inhibited. TRα1 mRNA expression decreased in SK-N-AS cells incubated with LPS, but knockdown of the TRα in SK-N-AS cells did not prevent the LPS-induced D3 decrease.
Conclusions:
We conclude that the inflammation-induced D3 decrease in the hypothalamus is mediated by the inflammatory pathways NF-κB and AP-1, but not TRα1. Furthermore, the observed decrease modulates intracellular T3 concentrations. Our results suggest a concerted action of inflammatory modulators to regulate both hypothalamic D2 and D3 activities to increase the local TH concentrations.
Introduction
Inflammation is associated with profound changes in thyroid hormone (TH) metabolism and secretion, the ensemble of which is known as the so-called nonthyroidal illness syndrome (NTIS) (1). NTIS is characterized by low serum triiodothyronine (T3) concentrations, in severe illness also by low serum thyroxine (T4) concentrations, while serum thyrotropin is frequently not elevated. The observed alterations result from a variety of changes in local TH metabolism in T3 target organs and marked alterations in the hypothalamus/pituitary/thyroid axis. Type 2 deiodinase (D2), expressed in tanycytes lining the third ventricle, increases in various NTIS animal models (2 –4) thereby generating T3 locally. Increased availability of T3 subsequently lowers the expression of thyrotropin releasing hormone (TRH) in the hypothalamic paraventricular nucleus (PVN), which has been observed in humans and rodents (5).
Local availability of T3, and thereby T3 target gene expression, is determined by the net effect of changes in TH transporters, deiodinating enzymes, and thyroid hormone receptor (TR) expression (1). Besides D2, the TH inactivating enzyme type 3 deiodinase (D3) is expressed in the hypothalamus, mainly in neurons (6). D2 and D3 are often regulated in a reciprocal manner (7). Indeed, acute and chronic inflammation decreases D3 expression in the hypothalamus (8,9), which may contribute to increased T3 availability in the hypothalamus.
D2 expression in tanycytes is regulated by nuclear factor κB (NF-κB) during inflammation (3,10,11). However, the underlying mechanisms of inflammation-induced D3 downregulation are unknown. We hypothesize that inflammatory pathways activated by lipopolysaccharide (LPS) such as the NF-κB or activator protein-1 (AP-1) are also involved in the regulation of D3 either via a direct effect on D3 transcription or via the TR.
TRs are members of the nuclear receptor family and encoded by two genes, the TRα (THRA) and TRβ (THRB) genes. Due to alternative splicing and alternative promoter usage, the TRα gene may give rise to a variety of isoforms; the thyroid hormone receptor alpha 1 (TRα1) isoform is the only bona fide TRα. The TRβ gene encodes the thyroid hormone receptor beta 1 (TRβ1) and thyroid hormone receptor beta 2 (TRβ2) isoforms, which both bind T3 (12). In the hypothalamus, TH responsiveness of D3 is mediated by TRα (13). TR expression itself is also affected by inflammation; both hepatic TRβ1 and TRα1 expression is decreased in LPS-injected mice (2,14) and in an interleukin (IL)-1β-treated liver cell line (HepG2). The TRβ1 decrease is mediated by the NF-κB pathway, while the TRα1 decrease requires both NF-κB and AP-1 signaling (15,16). The LPS-induced hypothalamic D3 decrease is similar in TRβ0/0 and wild-type (WT) mice, also suggesting a role for TRα in the regulation of hepatic Dio3 (17).
To investigate the regulation of D3 expression and activity during inflammation, we used an in vivo and in vitro approach. Mice were injected with LPS to assess D3 expression in the hypothalamus. SK-N-AS cells, a human neuroblastoma cell line expressing D3 (7), were stimulated with LPS in combination with inhibitors of the NF-κB and AP-1 pathway. In addition, SK-N-AS cells were transfected with specific Thra small interfering RNAs (siRNAs) to assess whether the LPS-induced D3 decrease is dependent on TRα signaling. The in vitro results were confirmed using TRαKO mice. To measure the effect of changes in D3 activity on intracellular TH concentrations, we modified our liquid chromatography (LC)-tandem mass spectrometry (MS) method to measure intracellular T3 concentrations in SK-N-AS cells.
Methods
Animal experiments
Male and female 129Sv/Ev (WT) and TRα0/0 mice were used at 6–12 weeks of age. TRα0/0 mice were generated as previously described (18). WT and TRα0/0 mice were crossed and bred separately. All the mice were kept in 12-hour light/dark cycles in a temperature-controlled room. A week before the experiment, the animals were housed in groups according to the experimental setup. Acute inflammation was induced by an intraperitoneal (i.p.) injection of 200 μg LPS (E. coli O127:B8; Sigma, St. Louis, MO) diluted in 0.5 mL saline. Control mice received 0.5 mL saline. To control for diurnal variations, each time point had its own control and all experiments started at 9 AM. At time points 0, 4, 8, and 24 hours after LPS or saline injection, 6 mice per group were anesthetized under isoflurane and killed by cervical dislocation as described previously (19). The hypothalamus was dissected and frozen in liquid nitrogen. The hypothalamic tissue block was used for dissection of the periventricular area (PE) consisting of the PVN, their direct surrounding, and the upper part of the ependymal lining of the third ventricle. All studies were approved by the local animal welfare committee.
Cell culture
The human neuroblastoma cell line SK-N-AS was cultured in Dulbecco's modified Eagle's medium GlutaMAX™ (Gibco), supplemented with 10% fetal bovine serum (Sigma), 1% penicillin, streptomycin, and antimycotic (Thermo Fisher), and 1% non-essential amino acids modified Eagle's medium (Lonza). For the mRNA expression experiments, 1 × 10⁵ cells per well were grown for 24 hours in a 24-well plate. For the deiodinase activity experiments, 5 × 10⁵ cells per well were grown in a 6-well plate. For ultra performance liquid chromatography tandem mass spectrometry (UPLC-MS/MS) analysis, cells were grown in a 75-cm2 flask until confluent. Cells were stimulated with 1 μg/mL LPS (E. coli O26:B6; eBioscience, Thermo Fisher) dissolved in phosphate-buffered saline (PBS). To inhibit NF-κB, 2 mM sulfasalazine (a chemical inhibitor of NF-κB; Sigma-Aldrich) or 50 μM JSH-23, an inhibitor of nuclear internalization of NF-κB (Calbiochem, Darmstadt, Germany), was dissolved in dimethyl sulfoxide (DMSO; Sigma-Aldrich). To inhibit the AP-1 complex, 50 μM SP600125 (Sigma-Aldrich) was used. As a control, the cells were incubated in 0.1–0.8% DMSO. Cells were preincubated with one of the inhibitors for 30 minutes before LPS stimulation. RNA knockdown of Thra (TRα) was performed by introducing siRNA via transfection by Lipofectamine (20 pmol/well; Invitrogen). Thra (ID138870, ID4526, and ID289416) and control siRNAs (scrambled siRNAs with matching GC content) were predesigned by Ambion, Life Technologies. Following transfection, cells were plated at 5 × 10⁴ cells/mL and rested for 24 hours before stimulation. siRNA introduction resulted in an overall knockdown of ∼65–75% of Thra determined by quantitative polymerase chain reaction (PCR).
RNA isolation and real-time polymerase chain reaction
Hypothalamic mRNA was isolated on the Magna Pure system (Roche Molecular Biochemicals, Mannheim, Germany) using the Magna Pure LC mRNA tissue kit according to the manufacturer's protocol. RNA from SK-N-AS cells was isolated using the High Pure RNA Isolation Kit (Roche Life Science). cDNA synthesis was performed using the AMV First Strand cDNA Synthesis Kit for real-time polymerase chain reaction with oligo d(T) primers (Roche). Real-time PCR was performed using the LightCycler 480 SYBR Green I Master kit (Roche) for the hypothalamus and the SensiFAST SYBR No-ROX Kit (Bioline) for the cell experiments. Primer pairs and PCR conditions for mouse hypoxanthine phosphoribosyl transferase (HPRT) and mouse D3 and D2 have been previously described (2). For the SK-N-AS cell-experiments of human origin, we used the following: hD3 F: 5′-AACTCCGAGGTGGTTCTGC-3′ and R: 5′-TTGCGCGTAGTCGAGGAT-3′, hTRα1 F: 5′- CATCTTTGAACTGGGCAAGT-3′and R: 5′- CTGAGGCTTTAGACTTCCTGATC-3′, hHPRT F: 5′- CCTGCTGGATTACATCAAAGCACTG-3′ and R: 5′- TCCAACACTTCGTGGGGTCCT-3′, hTBP F: 5′- CCCGAAACGCCGAATATAATCC-3′and R: 5′- AATCAGTGCCGTGGTTCGTG-3′, and hEF1α1 F: 5′- TTTTCGCAACGGGTTTGCC-3′ and R: 5′- TTGCCCGAATCTACGTGTCC-3′. Primers were either intron-spanning or genomic DNA contamination was tested using a cDNA synthesis reaction without the addition of reverse transcriptase. Samples were corrected for their mRNA content using HPRT as a reference gene for the animal study (20) or the geometric mean of HPRT, TBP, and EF1α1 for the cell culture experiments. Reference gene expression was statistically evaluated and not affected by treatment.
Deiodinase activity
For D3 activity measurements, SK-N-AS cells were washed, scraped in ice-cold PBS, spun down, and the pellet was homogenized in PED50 (0.1 M sodium phosphate, 2 mM EDTA pH 7.2, 50 mM DTT) using a polytron (Kinematica, Luzern, Switzerland). Homogenates were snap frozen in aliquots and stored at −80°C until further use. Protein concentration was measured with the Bio-Rad protein assay using bovine serum albumin as the standard following the manufacturer's instructions (Bio-Rad Laboratories, Veenendaal, The Netherlands). D3 activity was measured as described before (21) on a Shimadzu high pressure liquid chromatography system in combination with a Waters Symmetry C18 column (4.6 × 250 mm, 5 μm), coupled to a Perkin Elmer Radiomatic scintillation analyzer (150 TR flow).
Intracellular T3 concentrations
SK-N-AS cells were washed with cold PBS, scraped, and homogenized in PBS using a Polytron. Protein concentration was measured as described above. Three hundred microliters of cell homogenates was used for the UPLC-MS/MS determination of the TH concentrations as described by Ackermans et al. (22), with minor adaptation for cell homogenates instead of tissue. Briefly, the sample pretreatment was adapted using the basic Biotage EVOLUTE EXPRESS AX 30 mg Solid Phase Extraction (SPE) as described by Williams and colleagues (Comparison of SPE Approaches for the Extraction of THs: T3, reverse T3, and T4 before LC-MS/MS analysis, P107 MSACL-EU; Biotage Uppsala Sweden).
Data analysis and statistics
Animal experiment
Animal experiment differences between LPS and saline or between TRα0/0 and WT mice were evaluated by two-way analysis of variance (ANOVA) with two grouping factors (time and treatment or time and genotype). Normal distribution was tested with the Shapiro–Wilk test on the residues of the ANOVA. If not normally distributed, data were ranked. To test pairwise comparisons, ANOVA was followed by Student's t-test or Mann–Whitney U tests for data without normal distribution. Symbols in the figures represent pairwise p-values. p-Values ≤0.05 were considered significant. All tests were performed using SPSS (SPSS, Chicago, IL).
Cell experiments
Cell experiments were carried out at least three independent times in different passages of SK-N-AS cells. Means of three to six technical replicates (relative to assay mean) were calculated per experiment. Unless otherwise specified, data presented in the graphs indicate the mean ± standard error of the mean of the total number of experiments. One-way or two-way ANOVA was followed by Sidak's multiple comparison to test for differences between control and LPS groups per experimental treatment.
Results
Hypothalamic D2 and D3 mRNA expression changes after LPS administration in mice
LPS injection increased D2 mRNA and decreased D3 mRNA expression in the periventricular area after 24 hours compared with saline injection in mice (Fig. 1).
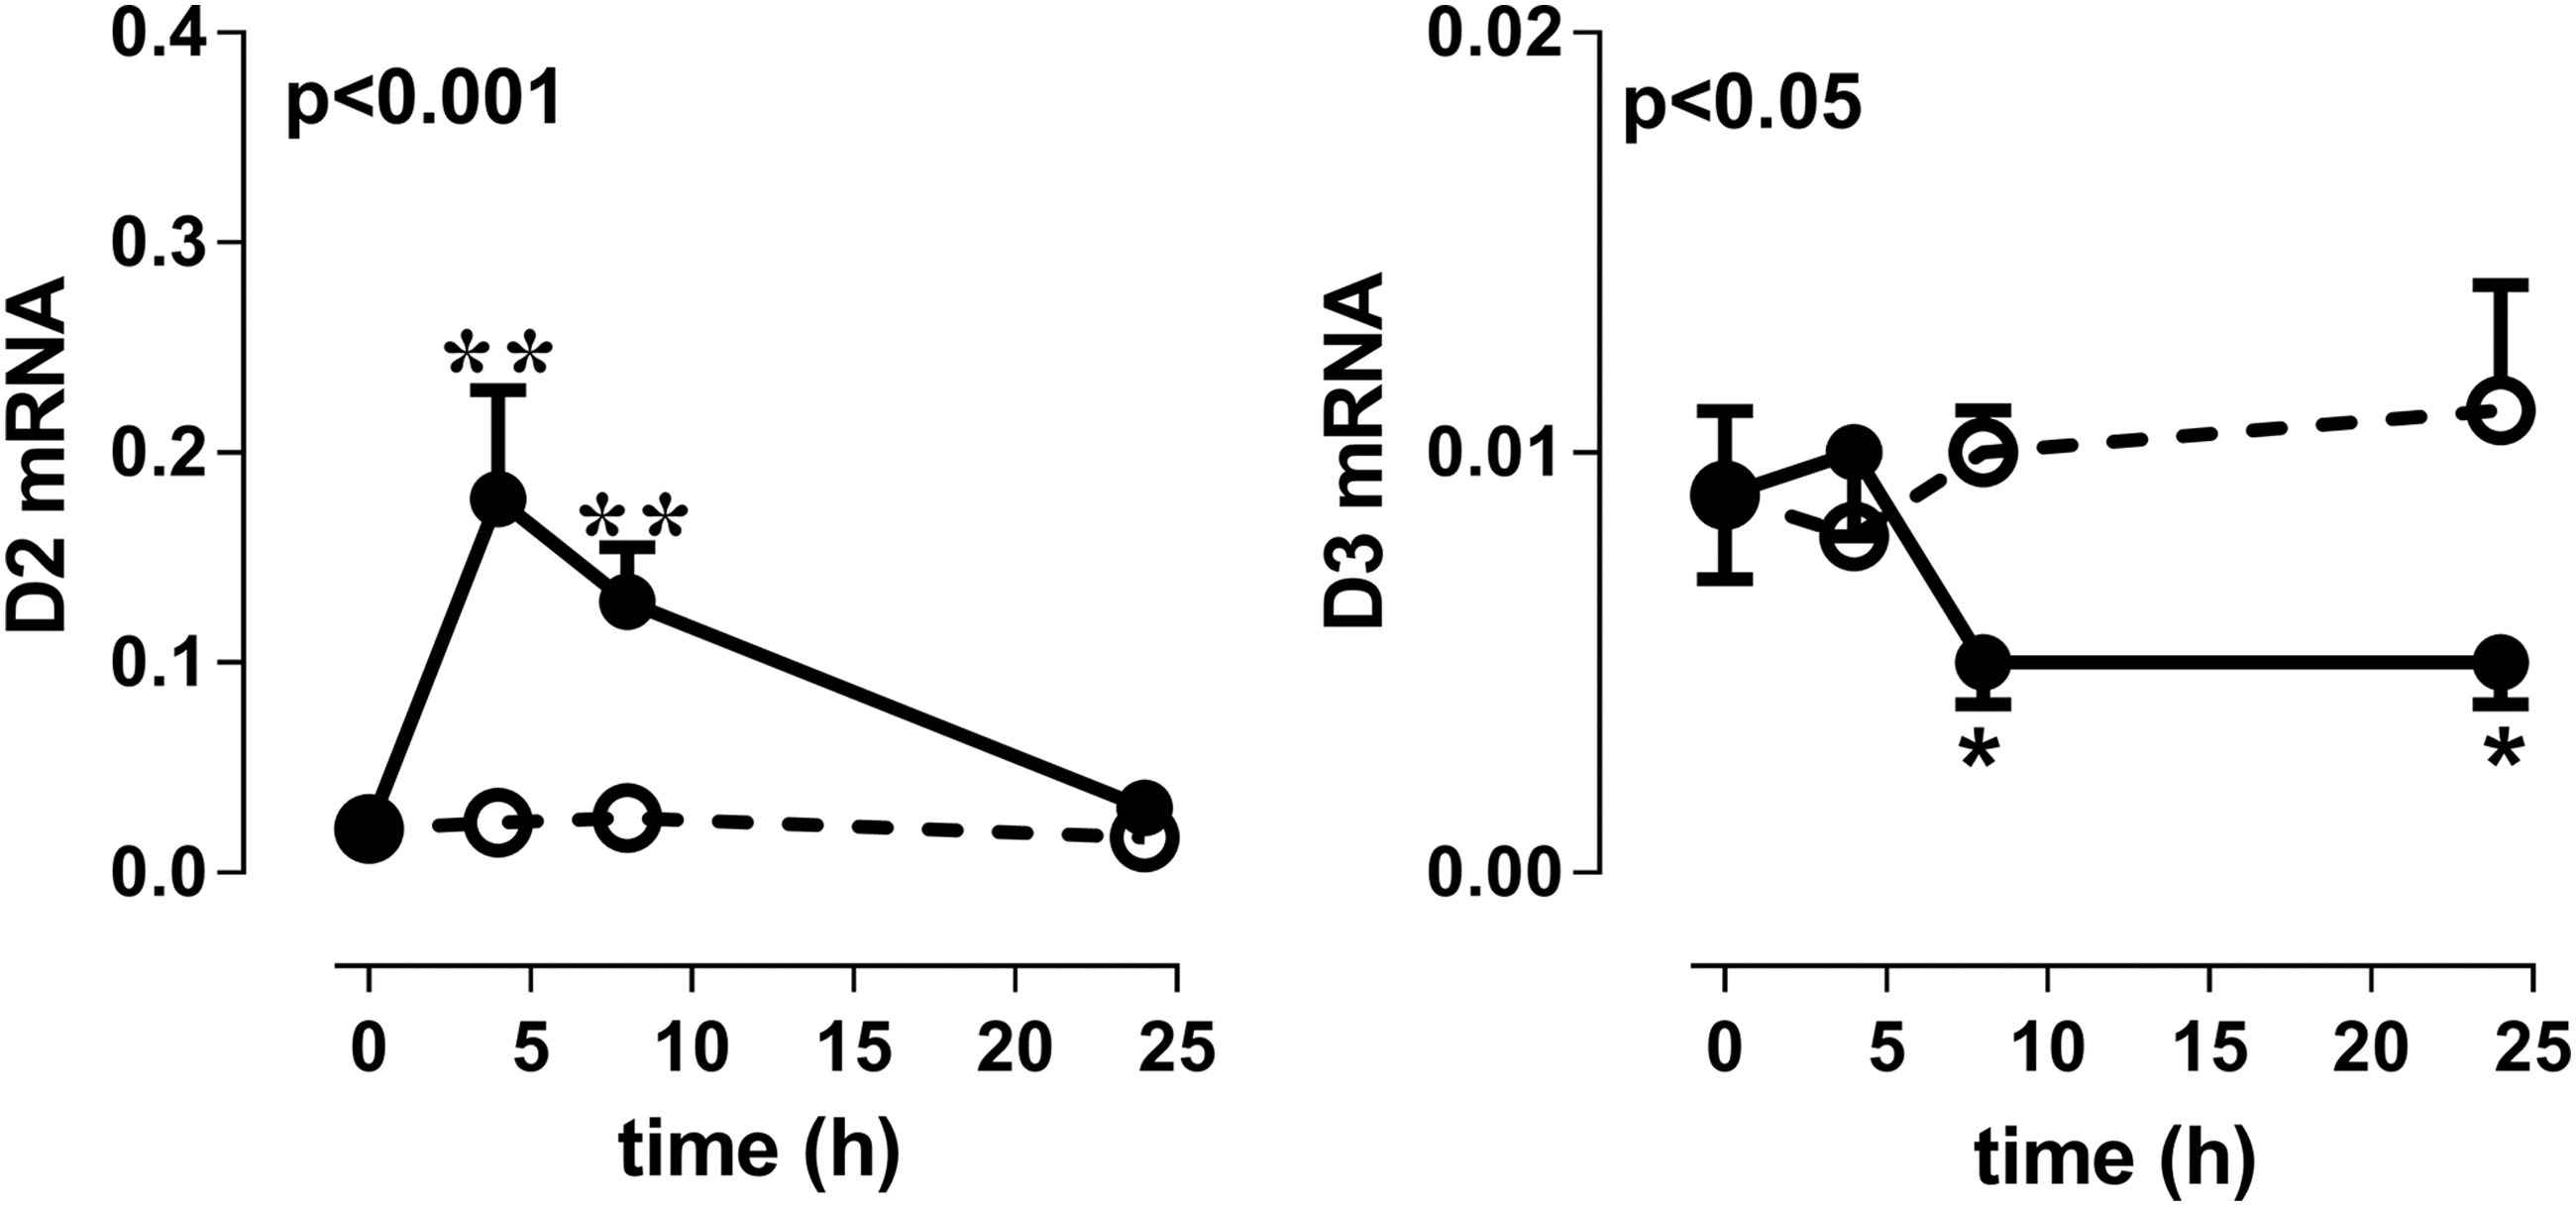
Relative D2 and D3 mRNA expression in the periventricular area of mice 0, 4, 8, and 24 hours after LPS (black circles) or saline (clear circles) injection. Mean values ± SEM (n = 6) are shown. Symbols indicate differences at separate time points (*p < 0.05, **p < 0.01). D2, type 2 deiodinase; D3, type 3 deiodinase; LPS, lipopolysaccharide; SEM, standard error of the mean.
D3 mRNA expression and activity upon inflammation in SK-N-AS cells
To study the mechanism involved in the LPS-induced decrease of hypothalamic D3 expression, we used the human neuroblastoma cell line SK-N-AS as a model. Incubation of SK-N-AS cells with LPS decreased D3 mRNA expression and D3 activity (average D3 activity levels in control cells ranging from 0.16 to 0.27 fmol/min/mg) after 24 hours compared with control treated cells (Fig. 2).
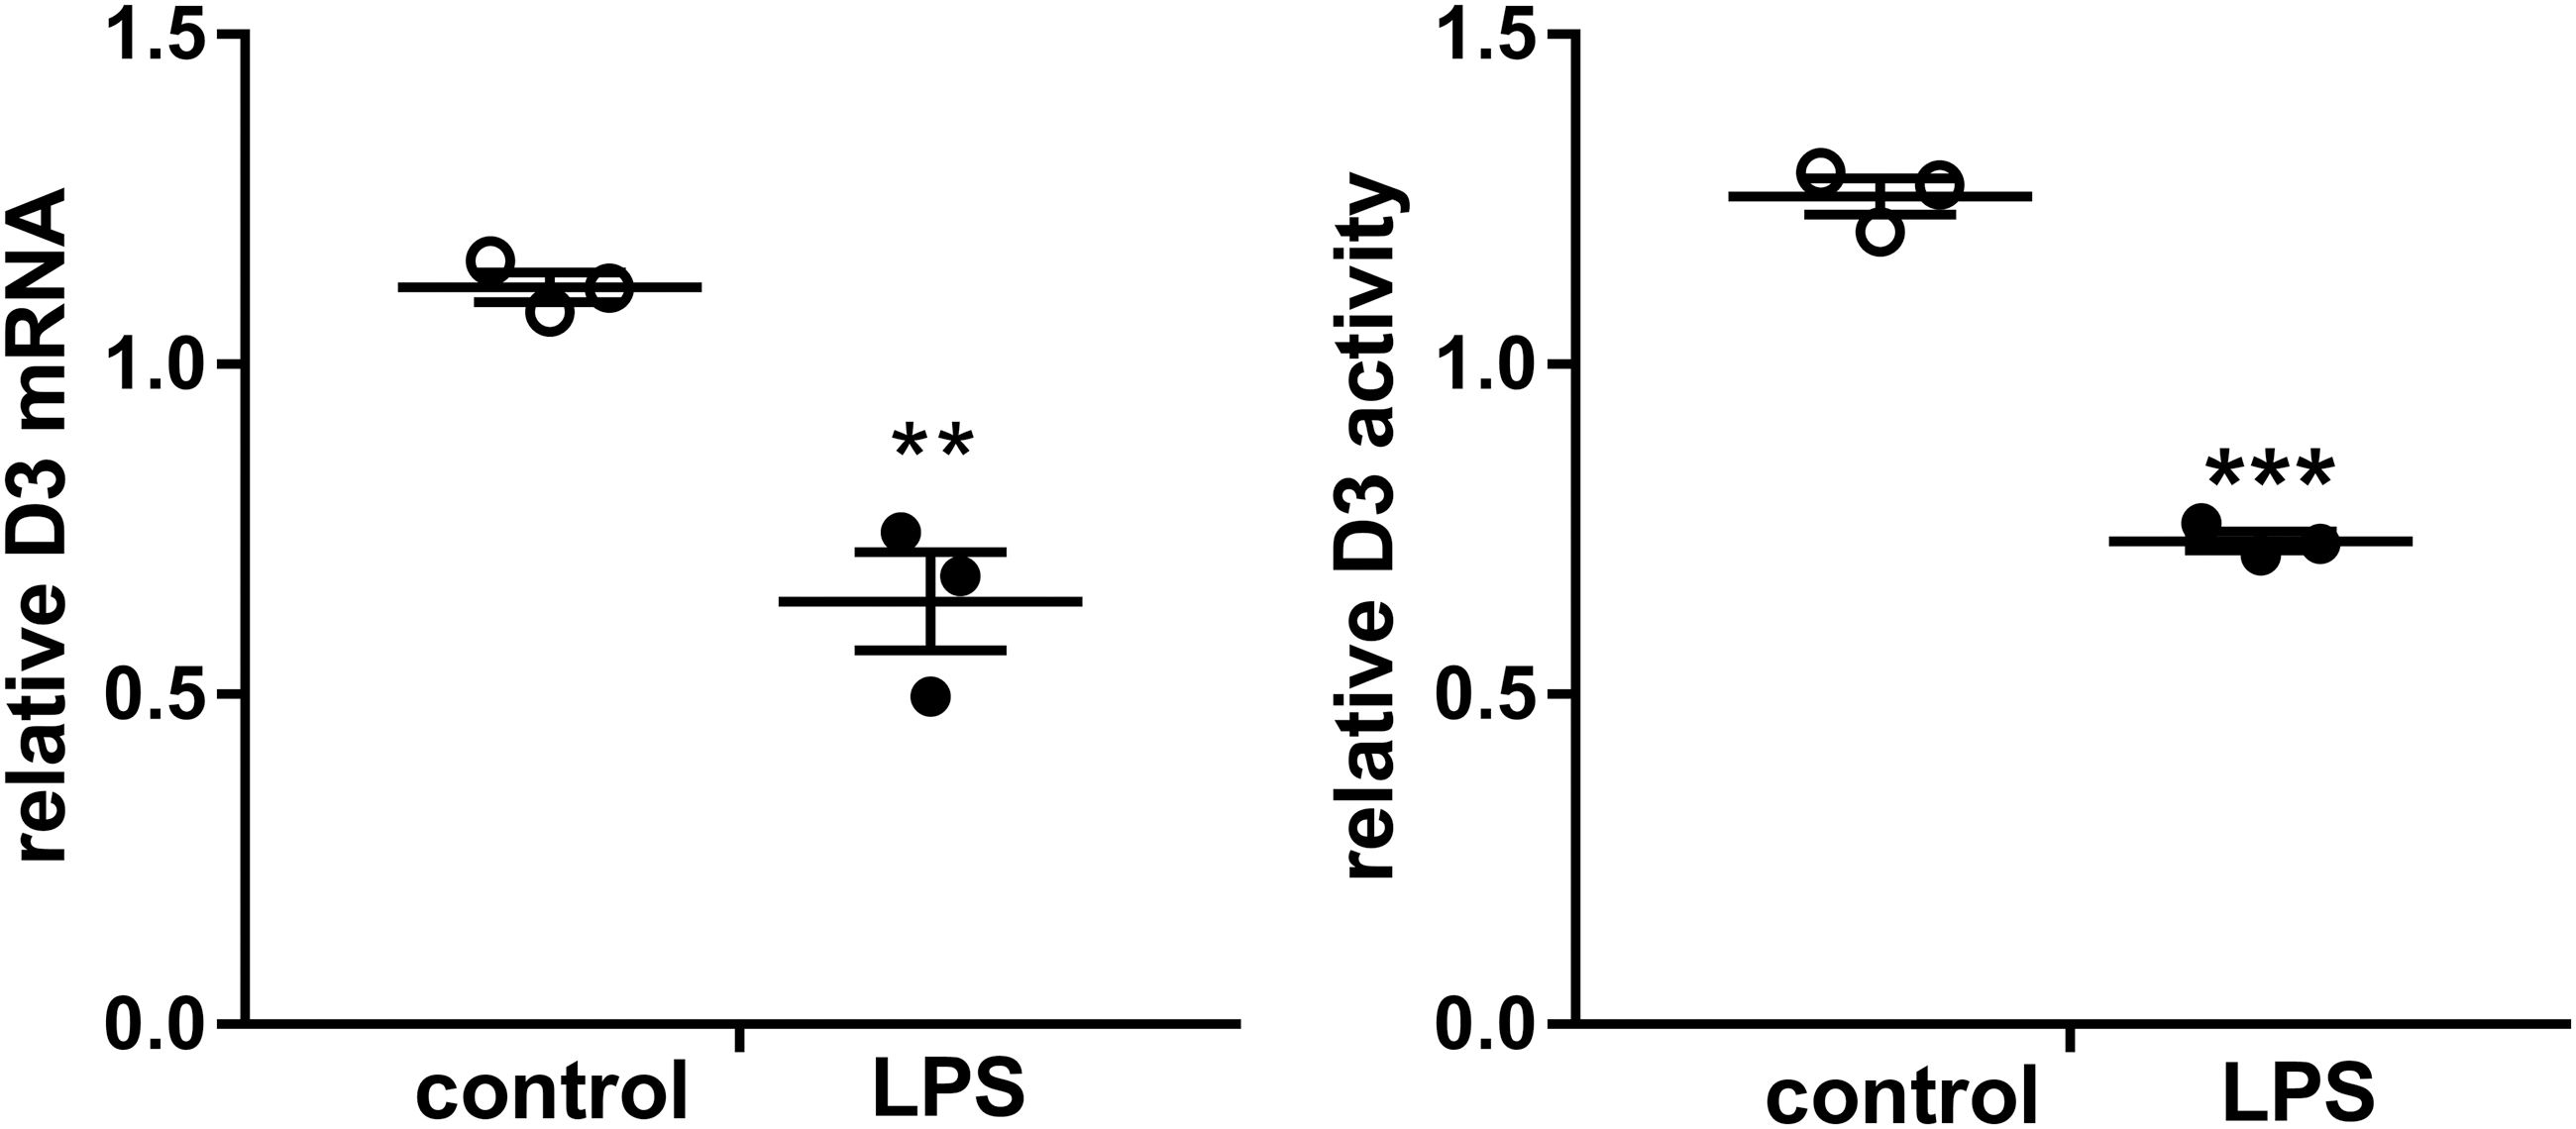
Relative expression of D3 mRNA and D3 activity (average D3 activity levels in control cells ranging from 0.16 to 0.27 fmol/min/mg) in SK-N-AS cells after LPS stimulation. White symbols represent controls and black symbols LPS. Expression and activity levels of each sample are calculated as relative value of the assay mean, three independent experiments have been performed and represented are the mean ± SEM of these experiments. Symbols represent differences between control and treatment groups tested with Student's t-test (**p ≤ 0.01, ***p ≤ 0.001).
Subsequently, we investigated whether decreased D3 activity leads to changes in intracellular T3 concentrations. To this end, we measured T3 concentrations in SK-N-AS cell homogenates with a UPLC-MS/MS method. LPS stimulation indeed increased intracellular T3 concentrations markedly (Fig. 3).
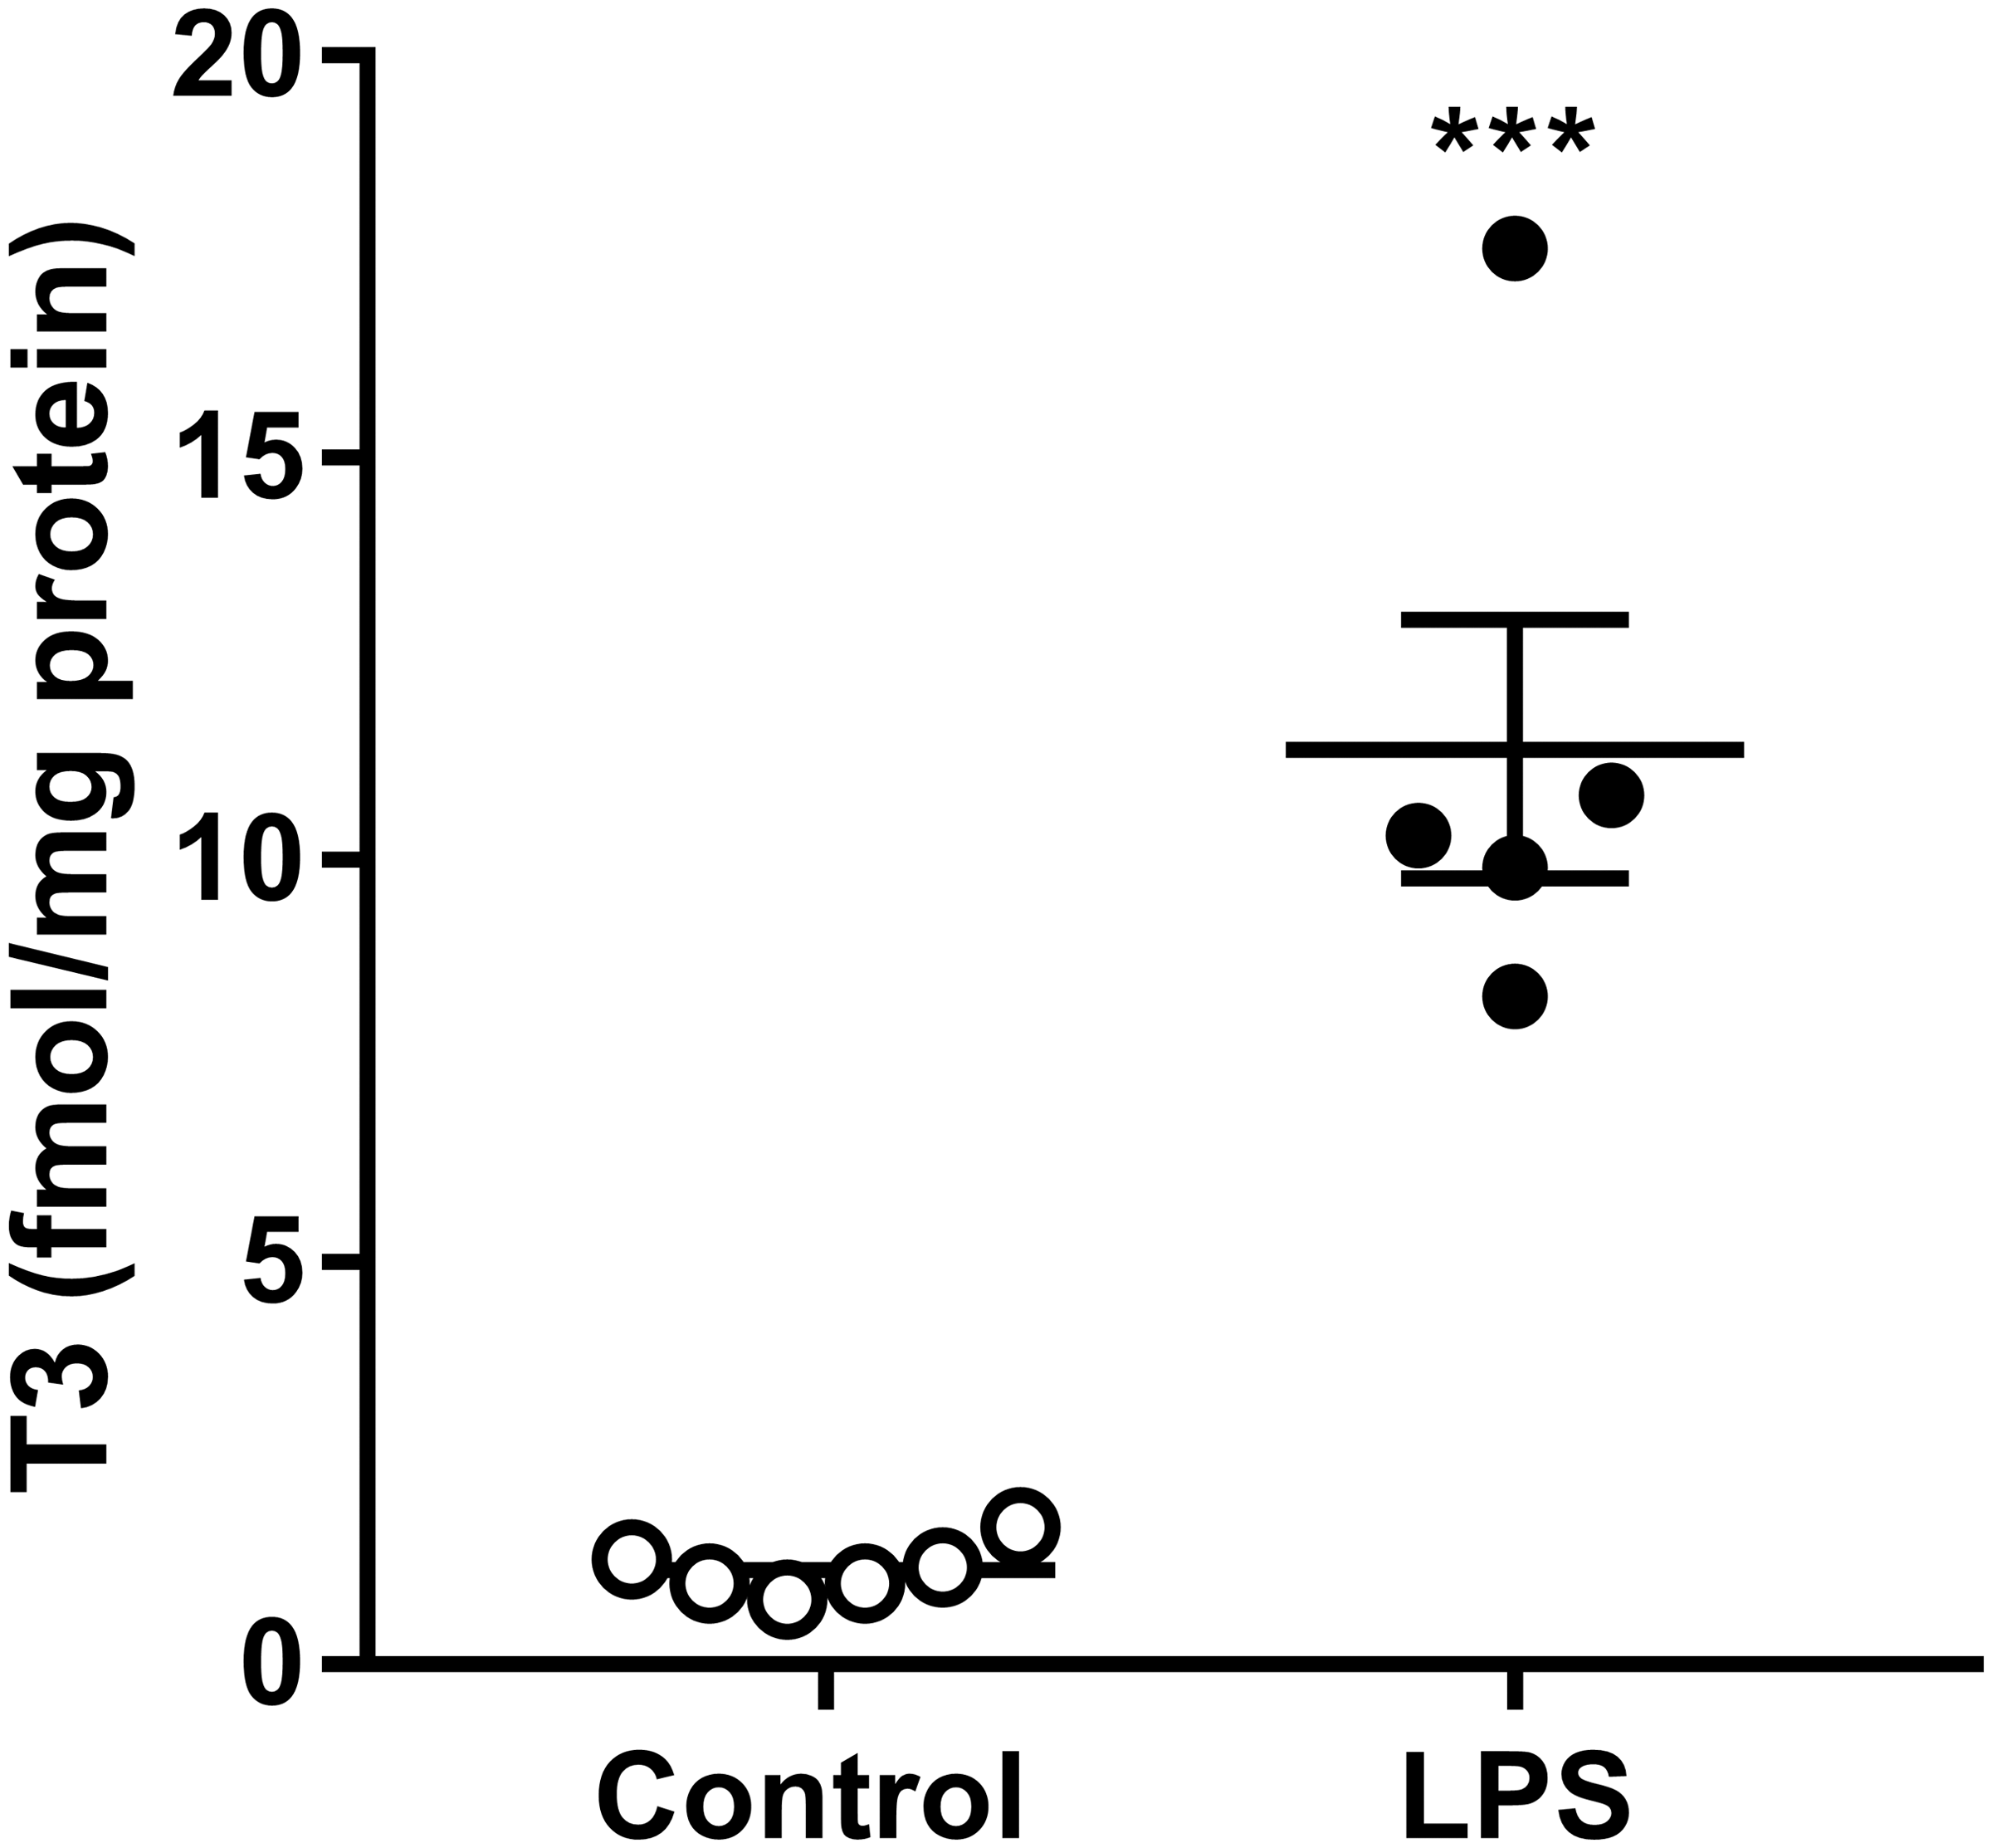
Intracellular T3 concentrations (measured as fmol/mg protein) in SK-N-AS cells stimulated with control (white dots) or LPS (black dots) for 24 hours. The experiment consisted of six replicates and was analyzed by Student's t-test (***p ≤ 0.001). T3, triiodothyronine.
THs are transported into the target cell by specific transporters, including MCT8 and MCT10. The expression of MCT8 and MCT10, two particularly important transporters, was measured to exclude the possibility that increased intracellular TH concentrations were due to altered TH transporter expression. MCT8 mRNA expression increased after LPS treatment, while MCT10 expression decreased, suggesting that the differential expression of these TH transporters does not explain the observed changes in intracellular TH levels (data not shown). In addition, it is unlikely that the increased T3 concentrations are derived from the culture medium since T3 concentrations were below the detection limit of our in-house radio immune assay.
The involvement of inflammatory pathways
Preincubation with sulfasalazine and JSH-23, inhibitors of the NF-κB signaling pathway, decreased basal D3 mRNA and D3 activity and further attenuated the LPS-induced decrease. Preincubation with SP600125, an inhibitor of the AP-1 pathway, also prevented the LPS-induced D3 decrease but without affecting basal levels (Fig. 4).
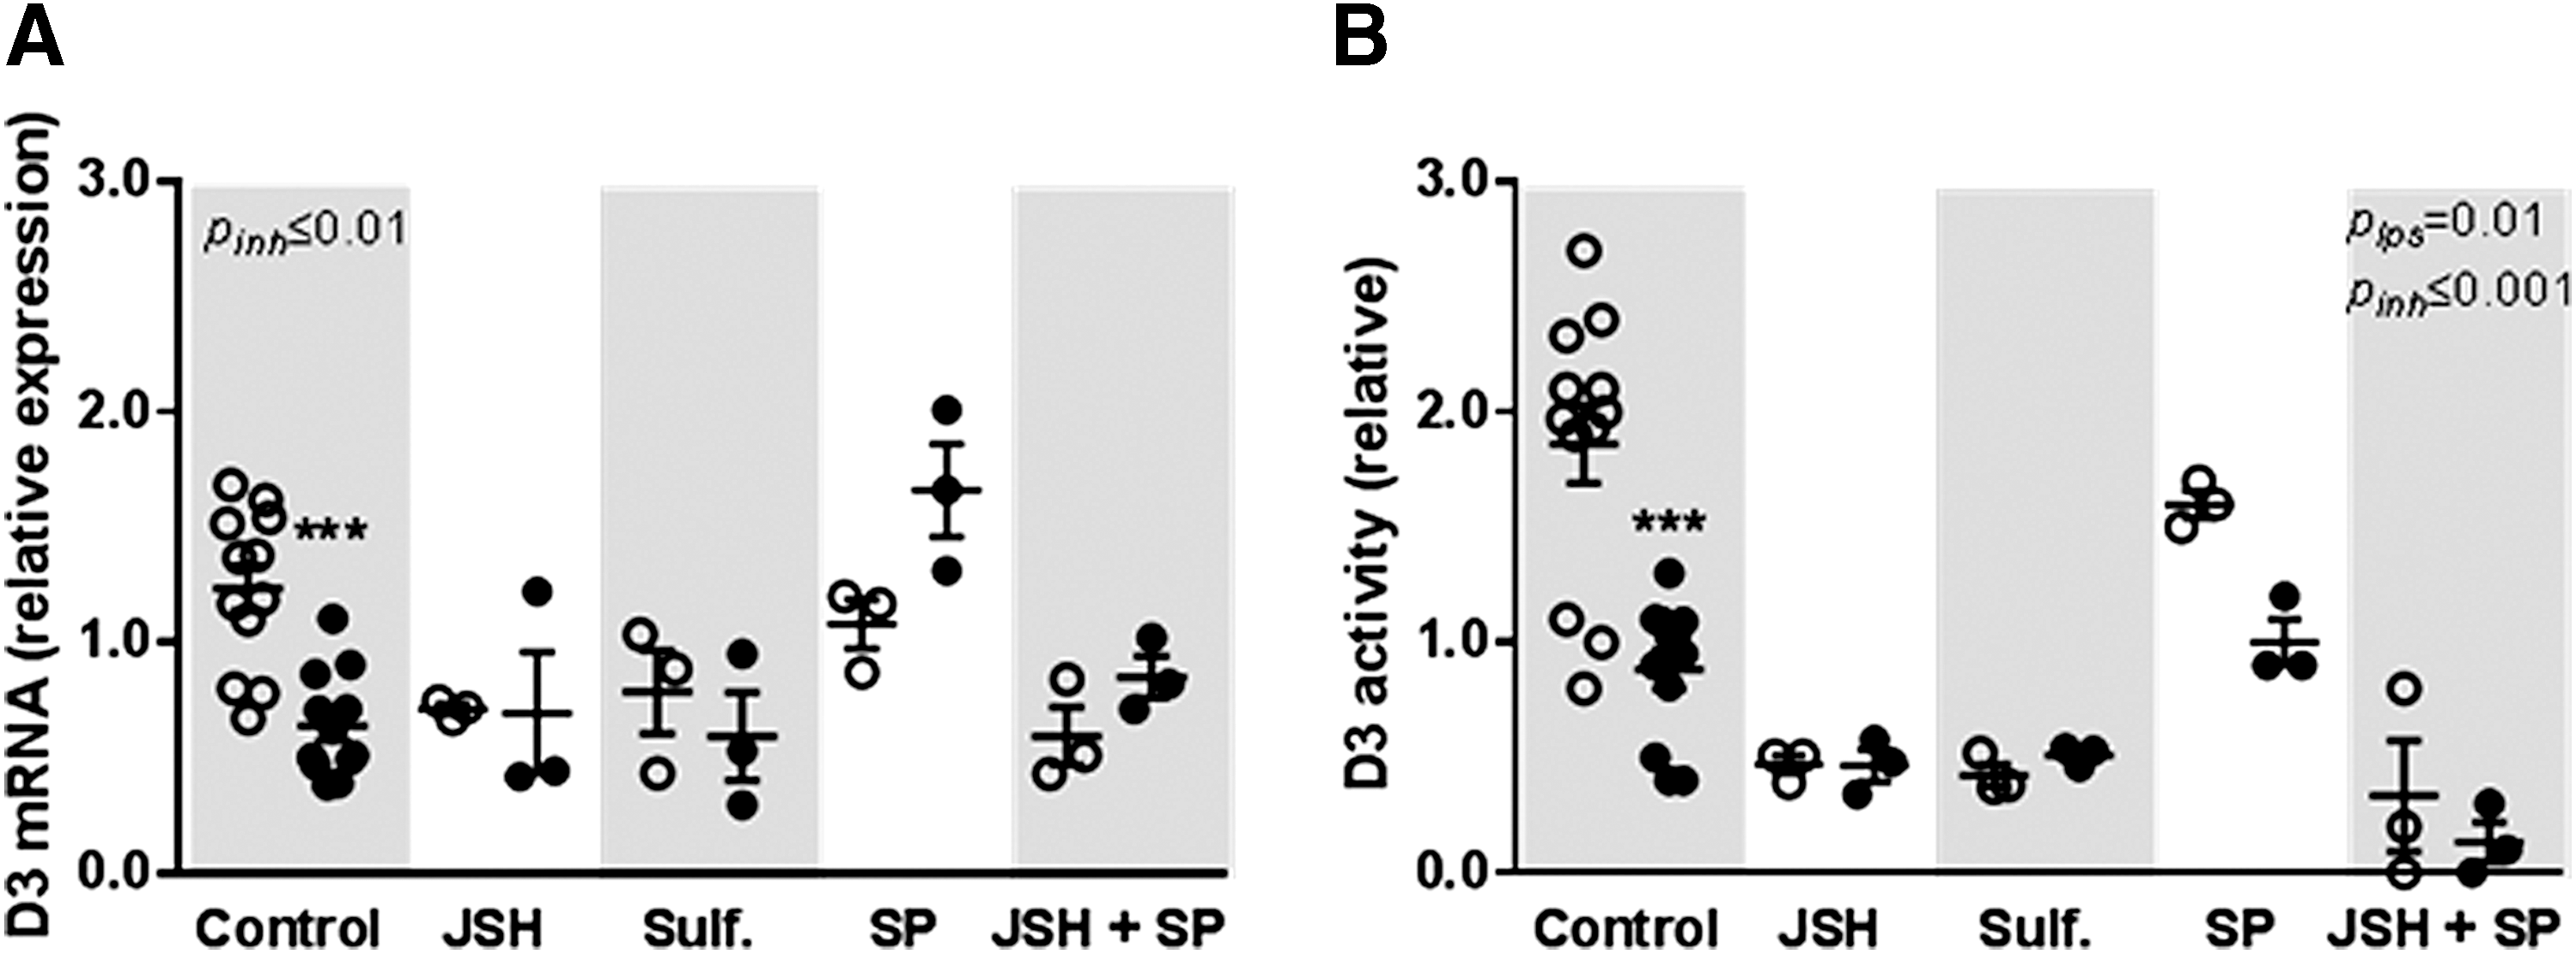
Relative expression of D3 mRNA (
The role of TRα in the LPS-induced D3 mRNA decrease
To study the role of TRα1 on the LPS-induced D3 decrease after 24 hours, SK-N-AS cells were stimulated with LPS for 6 hours and TRα1 mRNA expression was measured. LPS stimulation decreased TRα1 mRNA independently of NF-κB or AP-1 signaling; inhibition of the NF-κB or AP-1 pathway did not prevent the LPS-induced decrease of TRα1 mRNA expression (Fig. 5). To study the role of TRα signaling in the LPS-induced D3 decrease, SK-N-AS cells were transfected with specific siRNAs before stimulating the cells with LPS. Transfection resulted in a TRα knockdown of ∼65–75% throughout the experiments; TRα1 mRNA expression decreased to a similar extent in TRα siRNA-transfected cells with and without LPS (data not shown). LPS led to a decrease in D3 mRNA expression in control cells; inhibition of the TRα gene did not prevent the LPS-induced D3 decrease indicating that the TRα1 did not play a causative role (Fig. 6).

Relative expression of TRα1 mRNA in SK-N-AS cells stimulated with saline (white symbols) or LPS (black symbols) for six hours after preincubation with DMSO control (Control), JSH-23 (JSH), sulfasalazine (Sulf), SP600125 (SP), or a combination of JSH-23 and SP600125 (JSH+SP). Expression of each sample is calculated as relative value of the assay mean, and at least three independent experiments have been performed and represented are the means of 12 (control) or 3 (all other inhibitor groups) experiments ± SEM. p-Values represent the outcome of two-way ANOVA with two grouping factors (LPS and inhibitors). Symbols represent differences between saline and LPS per treatment group as tested with Sidak's multiple comparison test (**p ≤ 0.01, ***p ≤ 0.001). TRα1, thyroid hormone receptor alpha 1.
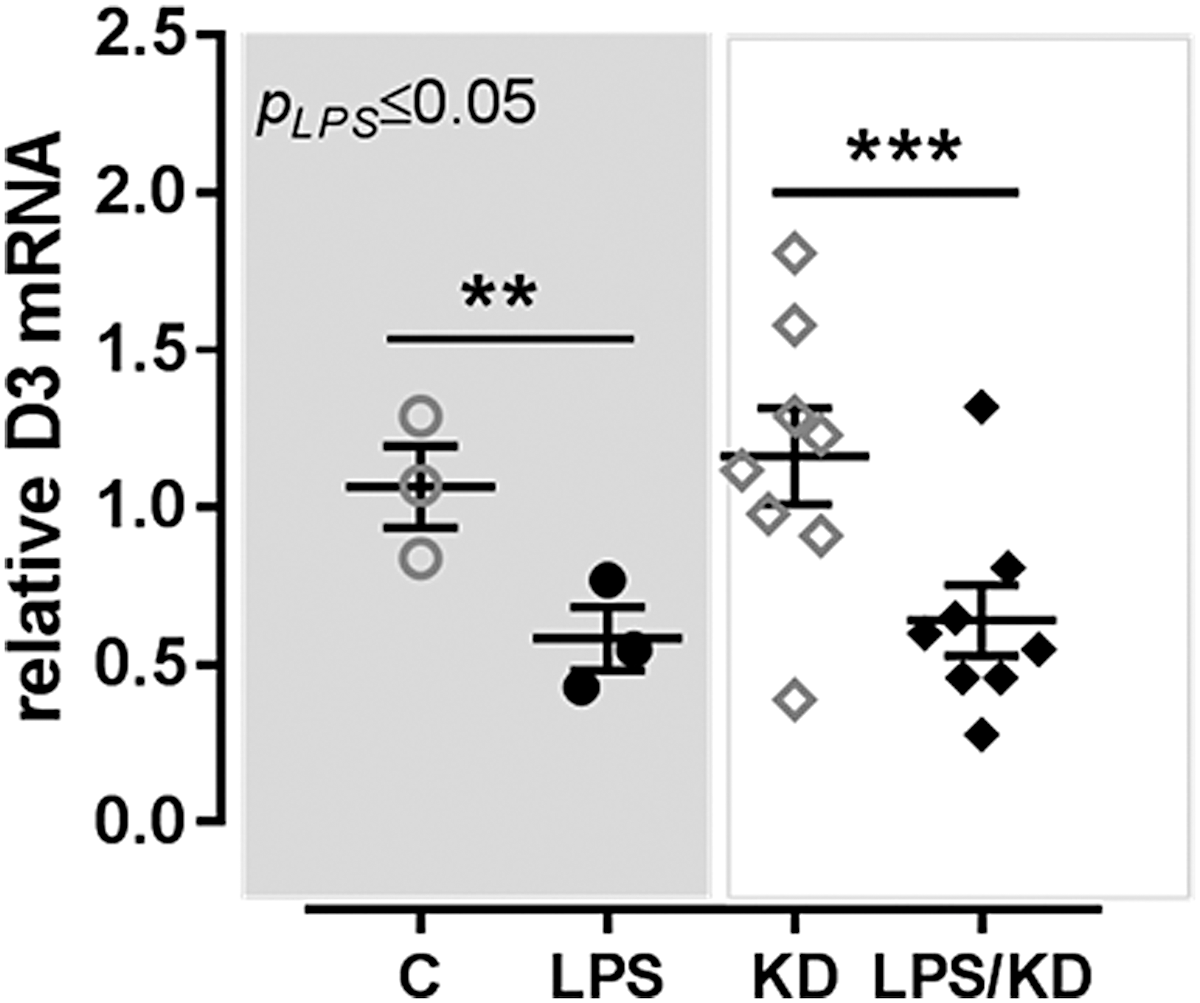
Relative expression of D3 mRNA in SK-N-AS cells stimulated with saline (open symbols) or LPS (black symbols) for 24 hours after KD of the TRα gene using siRNAs. Expression of each sample is calculated as relative value of the assay mean, and at least three independent experiments have been performed and represented are the means of three (control/LPS) and eight (TRα KD) experiments ± SEM. p-Values represent the outcome of one-way ANOVA and symbols represent differences between groups as tested with Sidak's multiple comparison test (**p ≤ 0.01, ***p ≤ 0.001). KD, knockdown; siRNAs, small interfering RNAs.
The effect of LPS administration was also studied in mice lacking the TRα gene; LPS injection decreased D3 mRNA expression in the periventricular area (PE) after 24 h compared with saline injection in TRα0/0 mice. The observed decrease was similar in TRα0/0 and WT mice, confirming that TRα1 does not play a role in decreasing D3 mRNA expression during inflammation (Fig. 7).
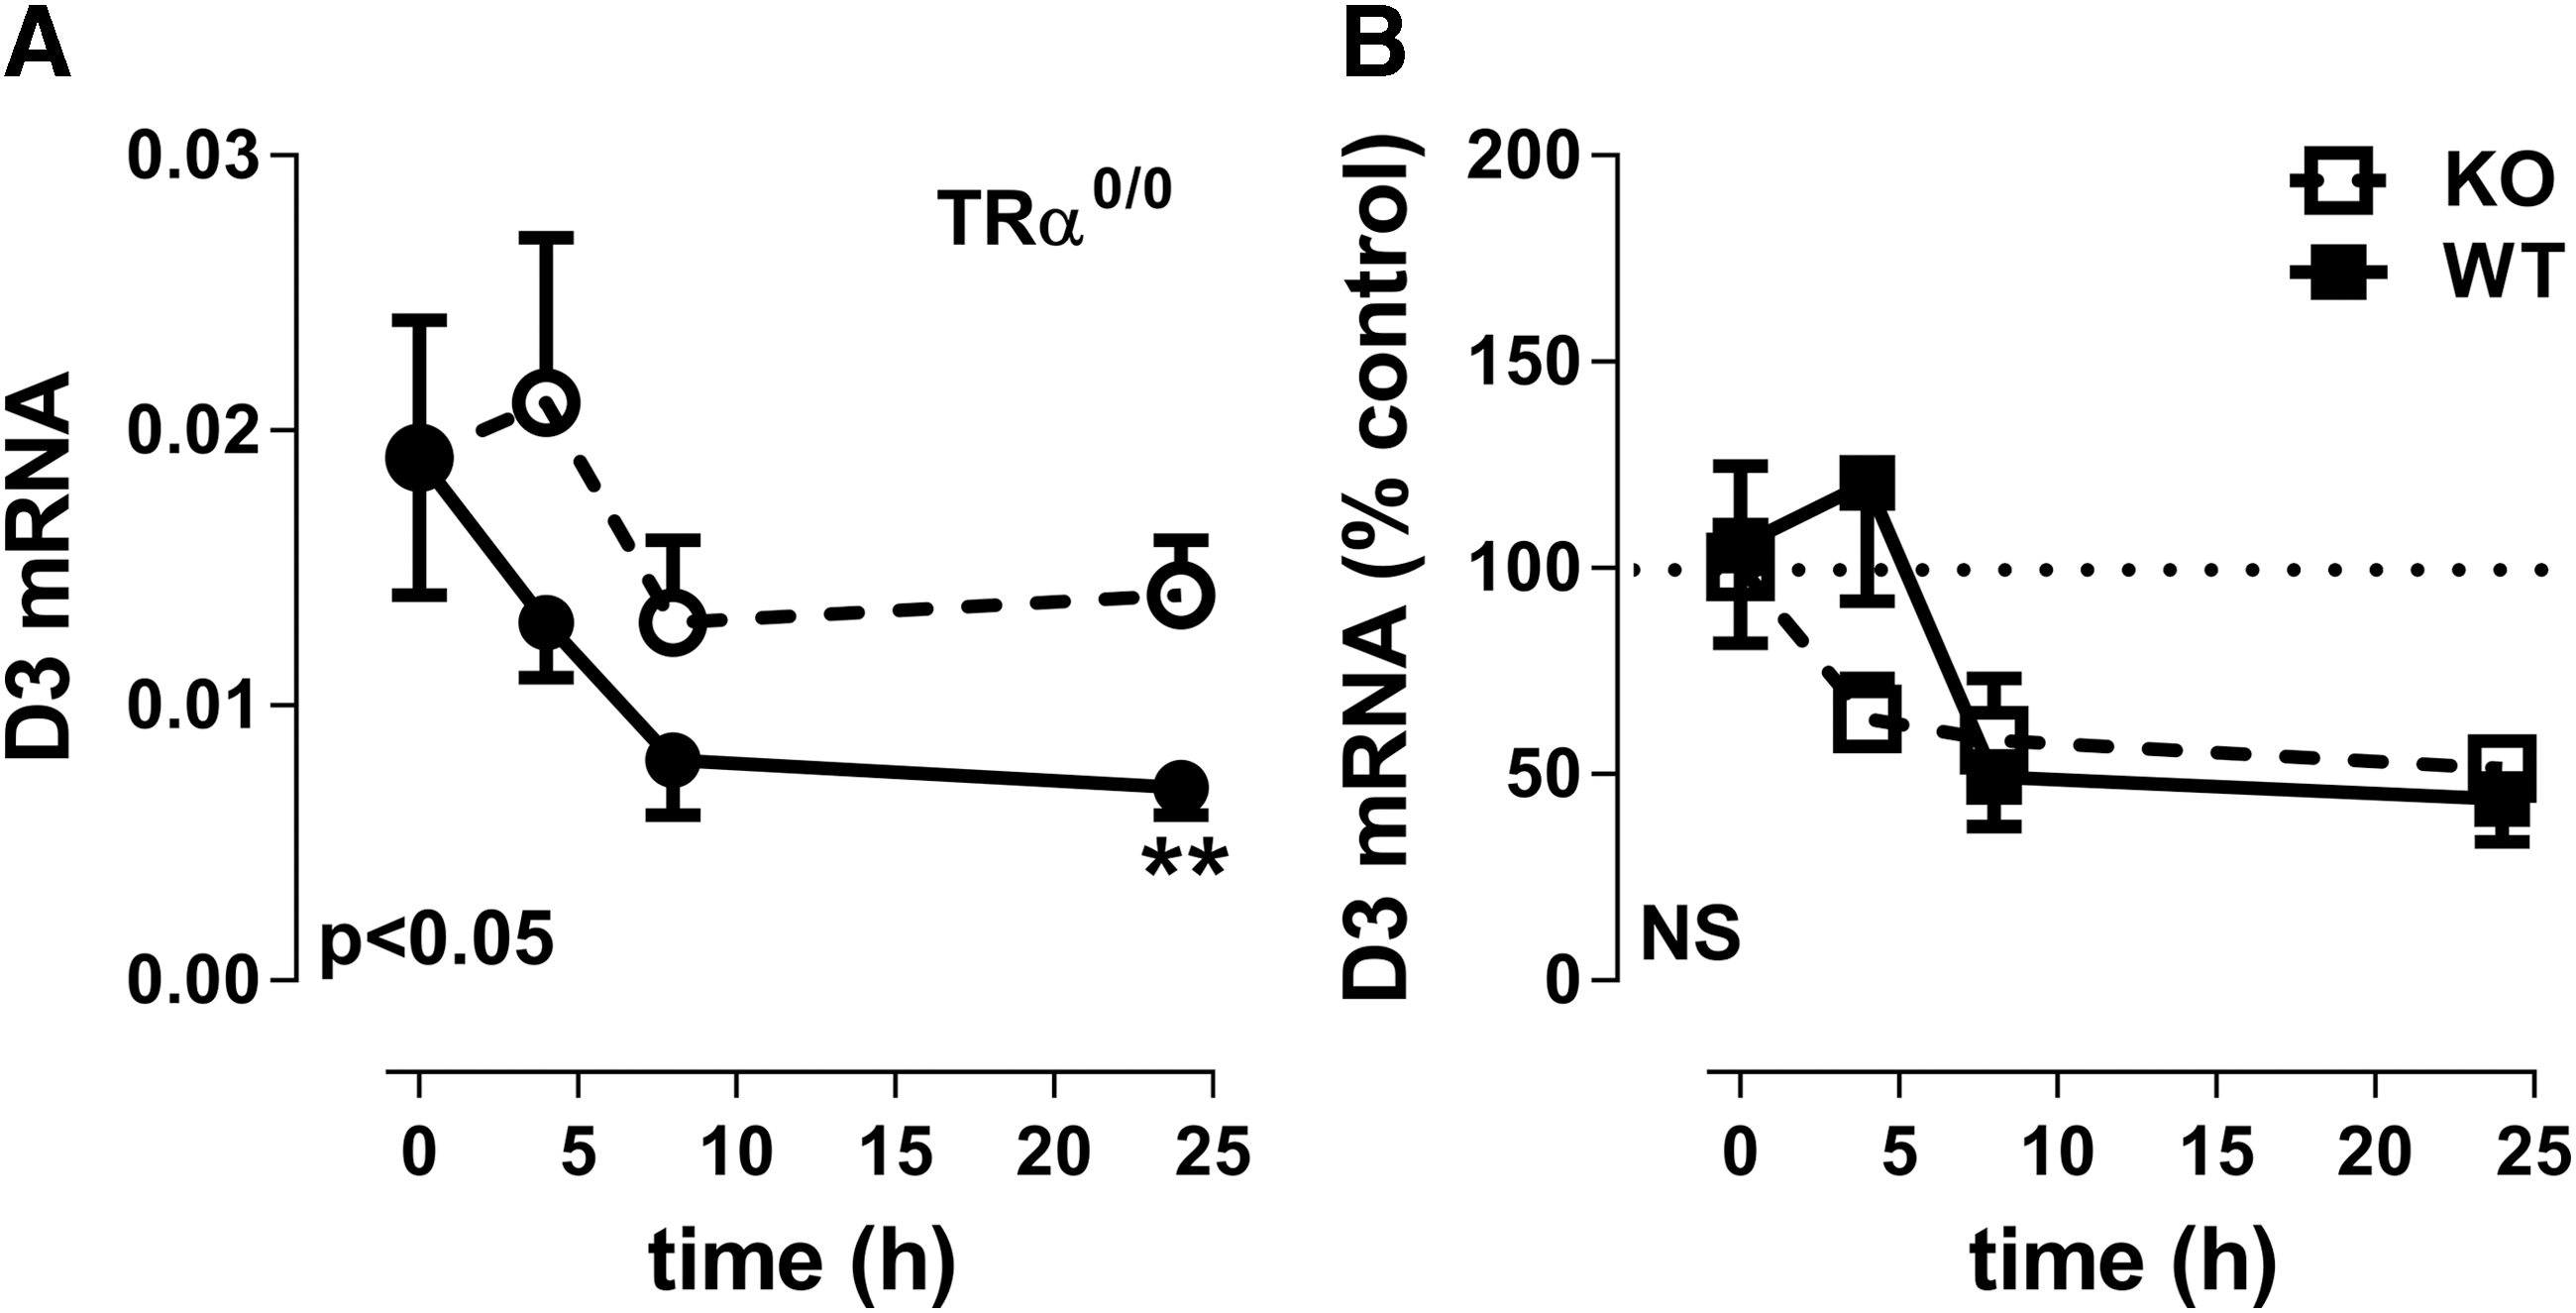
Relative expression of D3 mRNA in the periventricular area of TRα0/0 mice 0, 4, 8, and 24 hours after LPS (black circles) or saline (clear circles) injection (
Discussion
Inflammation results in profound changes in the transcriptional and translational activity of genes involved in TH transport and local TH metabolism ranging from inhibition to activation. These peripheral changes vary in different tissues and are also dependent on the severity of illness, ultimately resulting in specific changes in local TH concentrations (23). The effects of inflammation are often studied in rodents by administering a sublethal dose of bacterial endotoxin or LPS. LPS is a component of gram-negative bacteria and it elicits a strong inflammatory response that lasts ∼24 hours. LPS binds to the toll-like receptor 4 (TLR4), a pattern recognition receptor essential for the sensing of pathogens, and activation of this receptor leads to activation of a variety of intracellular inflammatory pathways (24).
In the hypothalamus, D2 increases upon inflammation, leading to an increase in local T3 availability, which in turn decreases TRH expression in the PVN, one of the hallmarks of NTIS (1). The illness-induced hypothalamic T3 increase might also be effective in other illness-related phenomena such as diminished food intake. It has been shown recently that selective knockdown of TRβ in the ventromedial hypothalamus leads to severe obesity due to hyperphagia, suggesting that activation of the TRβ diminishes food intake as observed during illness (25).
We and others have shown that in vitro and in vivo D2 expression in tanycytes is regulated by NF-κB during inflammation (3,10,11). The present study shows that LPS increased hypothalamic D2 and decreased hypothalamic D3 expression in mice as observed before (17), and lowered D3 expression and activity in SK-N-AS cells. The D3 decrease was prevented when the cells were incubated with a specific NF-κB and AP-1 inhibitor. The LPS-induced downregulation of D3 was observed before by Freitas et al. who showed in a coincubation cell system of glia (H4 glioma cells) and neurons (SK-N-AS cells), a 30% decrease in D3 mRNA and activity in SK-N-AS cells, while D2 mRNA and activity increased threefold in H4 cells (7). Our results suggest a concerted action of inflammatory modulators to regulate both hypothalamic D2 and D3 activities at the same time to increase hypothalamic TH levels. A similar phenomenon is seen in muscle precursor cells; D2 expression is markedly increased during myoblast differentiation, whereas D3 is decreased. The group of Dentice and colleagues showed that an enzyme involved in chromatin modification (histone H3 demethylating enzyme, LSD-1 or kdm1a) is essential for transcriptional induction of D2 and repression of D3 via interaction with FoxO3 (26). LSD-1 relieves repressive marks on the Dio2 promoter and activates specific marks on the Dio3 promoter, thereby regulating gene transcription. It is unknown at the moment whether LSD-1 is regulated by NF-κB. However, a study of De Santa et al. showed that Jmjd3, an efficient H3K27me3 demethylase and also involved in chromatin modification, is induced in macrophages depending on direct binding of NF-κB to a cluster of three kB sites in the Jmjd3 gene promoter (27). It is therefore tempting to speculate that NF-κB is also able to regulate LSD-1. This assumption, in combination with the fact that LSD-1 is highly expressed in murine neurons and astrocytes (28), suggests a link between inflammation, LSD-1, and reciprocal regulation of D2 and D3.
One of the few mechanisms published on NF-κB-mediated suppression of genes is RNA sequence-dependent, posttranscriptional downregulation. If multiple copies of the mRNA cis-regulatory motif 5′-ACUACAG-3′ are present in the promoter of an NF-κB-sensitive gene (29), that ACTACAG motif may form a binding site for a factor that regulates the stability of the mRNA. Sitcheran et al. suggest that the ACTACAG motif may form part of a stem-loop structure likely via the expression of a factor that regulates RNA stability. We scanned the D3 promoter locus for that motif and found only one that is located about 1.5 kb upstream of the transcription start site of the “regular” 2.2 kb transcript. It seems therefore unlikely that this mechanism is markedly involved in the NF-κB-dependent downregulation of D3.
The LPS-induced decrease in D3 in SK-N-AS cells is also prevented by inhibition of the AP-1 pathway. The AP-1 transcription factor complex, which consists of dimers of the Jun and Fos protein families, is activated by Jun N-terminal kinase 1 via phosphorylation, which in turn is activated by stimulation of the TLR4 by LPS and proinflammatory cytokines (30). Simultaneous inhibition of NF-κB and the AP-1 complex is necessary to prevent the IL-1β-induced D1 decrease in a human liver cell line (HEPG2 cells) (16). This is in contrast with the observation that inhibition of AP-1 alone is sufficient to block the LPS-induced decrease of D3 in SK-N-AS cells. The mechanism involved in AP-1-mediated repression is unknown. Mittelstadt and Patel showed that AP-1 mediates transcriptional repression of a metalloproteinase (MMP-9) gene by recruitment of histone deacetylase to the promoter in response to interferon beta (31) pointing to a role of chromatin modification.
D3 is a T3 responsive gene, as T3 treatment induces D3 mRNA expression, which is mediated by TRα (13). It should be noted that TRα mRNA expression by itself is affected by inflammation; liver TRα1 mRNA expression decreased rapidly upon LPS administration, followed by decreased nuclear TR protein expression (14). We have shown that the IL-1β-induced decrease of TRα1 is a direct effect of decreased promoter activity, probably via phosphorylation-dependent repression of the TRα promoter (16). Hypothalamic TR mRNA expression, however, does not change dramatically after LPS administration (2), but changes in specific TR isoform expression in PVN neurons and tanycytes have not been carefully studied yet. The present study shows that TRα1 mRNA rapidly decreases after LPS administration in SK-N-AS cells. Inhibition of the NF-κB signaling or the AP-1 pathway did not prevent the LPS-induced decrease of TRα1 mRNA expression in those cells, suggesting tissue/cellular-specific regulation of TR expression during inflammation. This is in agreement with a study of Castro et al. who showed decreased TRβ mRNA expression in porcine heart and liver after LPS treatment while NF-κB was not activated (32). The observed decrease in TRα1 mRNA could be due to the activation of other inflammatory pathways, epigenetic changes, or increased mRNA degradation. In addition, inhibition of the TRα gene did not prevent the LPS-induced D3 decrease indicating that the expression of TRα1 did not play a causative role. This is confirmed by the observation in mice lacking the TRα gene; LPS injection decreased D3 mRNA expression in the periventricular area in TRα0/0 mice to the same extent as in WT mice.
In conclusion, the present study shows that the inflammation-induced D3 decrease in the hypothalamus is mediated by the inflammatory pathways involving NF-κB and AP-1. The mechanism involved is at present unknown, but chromatin modification of the D3 promoter by specific enzymes is a plausible possibility. The simultaneous increase in hypothalamic D2 and decrease in hypothalamic D3 are expected to result in locally increased TH concentrations, subsequently lowering TR expression in the PVN as observed before (5). We show for the first time that the LPS-induced D3 decrease in SK-N-AS cells results in elevated cellular T3 levels in the same cells.
Footnotes
Acknowledgments
E.M.d.V. was supported by a research grant from the European Thyroid Association (ETA) (2016). We thank Dr. Arturo Hernandez (Maine Medical Center Research Institute) for assistance in analyzing the D3 promoter and Prof. Balázs Gereben (Laboratory of Molecular Cell Metabolism Hungarian Academy of Sciences) for critical reading of the article.
Author Disclosure Statement
No competing financial interests exist.