
Abstract
Background:
Knowledge about the population's iodine status is important, because it allows adjustment of iodine supply and prevention of iodine deficiency. The validity and comparability of iodine-related population studies can be improved by standardization, which was one of the goals of the EUthyroid project. The aim of this study was to establish the first standardized map of iodine status in Europe by using standardized urinary iodine concentration (UIC) data.
Materials and Methods:
We established a gold-standard laboratory in Helsinki measuring UIC by inductively coupled plasma mass spectrometry. A total of 40 studies from 23 European countries provided 75 urine samples covering the whole range of concentrations. Conversion formulas for UIC derived from the gold-standard values were established by linear regression models and were used to postharmonize the studies by standardizing the UIC data of the individual studies.
Results:
In comparison with the EUthyroid gold-standard, mean UIC measurements were higher in 11 laboratories and lower in 10 laboratories. The mean differences ranged from −36.6% to 49.5%. Of the 40 postharmonized studies providing data for the standardization, 16 were conducted in schoolchildren, 13 in adults, and 11 in pregnant women. Median standardized UIC was <100 μg/L in 1 out of 16 (6.3%) studies in schoolchildren, while in adults 7 out of 13 (53.8%) studies had a median standardized UIC <100 μg/L. Seven out of 11 (63.6%) studies in pregnant women revealed a median UIC <150 μg/L.
Conclusions:
We demonstrate that iodine deficiency is still present in Europe, using standardized data from a large number of studies. Adults and pregnant women, particularly, are at risk for iodine deficiency, which calls for action. For instance, a more uniform European legislation on iodine fortification is warranted to ensure that noniodized salt is replaced by iodized salt more often. In addition, further efforts should be put on harmonizing iodine-related studies and iodine measurements to improve the validity and comparability of results.
Introduction
The iodine status of regions is assessed by median urinary iodine concentrations (UICs) determined in representative samples of populations. National iodine fortification programs are initiated and modified based on such studies. According to the World Health Organization (WHO), a region is iodine sufficient if the median UIC is ≥100 μg/L in nonpregnant populations (1). Based on this criterion, worldwide maps of country-specific iodine status are drawn (2,3). Laboratory methods for measuring UIC, however, are heterogeneous, hampering the comparability of iodine monitoring studies (1). In a recent ring trial in Germany consisting of 300 samples, variations of up to 50% were observed between different UIC laboratory methods. These findings emphasize the need for standardization of iodine monitoring status as well as UIC measurements, ensuring valid estimates of the iodine status in populations (4).
Besides the standardization of iodine monitoring studies, it will be necessary to harmonize fortification programs. In Europe, iodine fortification programs differ according to type of regulations (mandatory vs. voluntary iodine fortification), amount of iodine used, and chemical form (iodine vs. iodate) (5,6). The variety of iodine fortification programs within Europe is a challenge for companies acting on the global market. In consequence, large parts of Europe can be seen as mildly to moderately iodine deficient with only 27% of European households having access to iodized salt (7). Around 350 million citizens are exposed to iodine deficiency being at higher risk for developing neurodevelopmental anomalies, since iodine deficiency remains as an important yet preventable cause of brain damage (7). In contrast, the “Global Scorecard of Iodine Nutrition 2017” provided by the Iodine Global Network (IGN) shows that large parts of Europe are adequately supplied by iodine (2). This discrepancy may be explained by a lack of standardization of iodine measurements used for the IGN scorecard. Furthermore, iodine status is reported at the national level in the IGN map, but, particularly in countries with voluntary iodine supply, median iodine levels may differ substantially between subpopulations and regions within the respective country. Therefore, harmonized monitoring studies and UIC measurements as well as the consideration of regional and population differences are of great importance when evaluating and monitoring the effectiveness of fortification programs. In our study, we aimed to standardize European iodine monitoring studies with respect to these considerations to establish a valid map of the iodine status in European populations.
Materials and Methods
Within the framework of the EUthyroid consortium, we collected data on iodine status from 48 European studies using the EUthyroid data exchange system (8). Information on data owner, study design (population based, volunteers, or patients), study population (children, adults, or pregnant women), year of data collection, blood sampling, urine collection, and laboratory methods was collected from each study. Details of the included studies can be found in Supplementary Table S1. The maximum number of studies, for which UICs were analyzed in one laboratory, was three. The study region was assessed using the EU-recommended “Nomenclature of Territorial Units for Statistics” system, which classifies each European country by five hierarchical levels (9). For each study participating in the cross-laboratory comparison, the relevant ethics approval was obtained and each study followed the declaration of Helsinki.
The individual studies were postharmonized by standardizing the UIC data. For this purpose, we established a gold-standard EUthyroid laboratory at Finnish Institue for Health and Welfare in Helsinki, where UIC was measured with inductively coupled plasma mass spectrometry (ICP-MS) using an Agilent 7800 ICP-MS system (Agilent Technologies, Inc., Santa Clara, CA). One-hundred microliters of urine was extracted using ammonium hydroxide solution. Iodine was scanned on m/z = 127 and tellurium was used as internal standard. The National Institute of Standards and Technology reference standard materials SRM2670a (with certified mass concentration value) and SRM3668 Level 1 and Level 2 were used to ensure accuracy of urinary iodine determinations. Coefficient of variation of control samples was 2.9% ± 0.8% during the course of the study. The laboratory participates regularly successfully in the external quality assessment scheme “Ensuring the Quality of Urinary Iodine Procedures” organized by the Centers for Disease Control and Prevention.
For standardization of the UIC data from the individual studies, each partner was asked to send 75 spot urine samples to the EUthyroid gold standard laboratory. This number was a priori determined by a power analysis, accounting for the variation of UIC measurements. Since the distribution of UICs varies according to current iodine supply of the respective study region, it is not useful to determine one strict cutoff to define these marginal areas. Instead the cutoffs should be determined study-specific based on distributional characteristics. To detect deviations at either end of the UIC distribution, the low and the high ends were oversampled. Thus, samples were selected the following way: Between 0 and 5th percentile—12 samples Between 5th percentile and 25th percentile—13 samples Between 25th percentile and 50th percentile—13 samples Between 50th percentile and 75th percentile—13 samples Between 75th percentile and 95th percentile—13 samples Between 95th percentile and 100th percentile—11 samples
Based on the comparisons, we calculated mean deviations ±1.96 standard deviations in percentage by Bland & Altman plots. Correlations between two laboratory methods were assessed by linear regression (10). Conversion formulas derived from linear regression models were established and applied to the original studies. We also recalculated formulas using Passing–Bablok regression for all laboratories and found no substantial differences to our findings when applying these formulas to the study data (data not shown).
Out of the 48 studies, 8 studies were not able to submit samples to the EUthyroid laboratory, resulting in a total number of 40 standardized studies from 23 European countries. Standardized UICs were calculated as median for each of the studies and plotted on the European map. Data analyses were conducted using Stata 15.1 (Stata Corporation, College Station, TX). Maps were generated in ArcGIS (Environmental Systems Research Institute (ESRI), ArcGIS Release 10.3.1, Redlands, CA).
Results
In comparison with the gold-standard EUthyroid laboratory, UIC measurements were on average higher in 11 laboratories and lower in 10 laboratories (Table 1). The mean differences ranged from −36.6% to 49.5%. Correlations of UICs to the gold-standard EUthyroid laboratory were ≥0.9 for 9 laboratories (42.9%), 0.8–0.9 for 5 laboratories (23.8%), 0.7–0.8 for 3 laboratories (14.3%), and <0.7 for 4 laboratories (19.0%). Conversion formulas used for generating standardized UIC values are given in Table 1.
Laboratory Comparisons with the EUthyroid Central Laboratory for Urinary Iodine Concentrations
Mean and SDs derived from Bland & Altman plots; correlations and conversion formulas from linear regression models; p int and p slope are the p-values derived from the regression model for the intercept = 0 and the slope = 1. p < 0.05 indicates significant difference.
SDs, standard deviations; UIC, urinary iodine concentration.
Of the 40 standardized studies from 23 countries, 16 (40.0%) were conducted in schoolchildren, 13 (32.5%) in adults, and 11 (27.5%) in pregnant women. Table 2 gives the median standardized UIC for all 40 studies, and in Figure 1 the median standardized UICs are printed on the European map. Studies are presented depending on the exact study region (status is not extrapolated to the national level) and very small study regions are highlighted by circles for better visibility. In population monitoring of iodine status using UICs, schoolchildren have been least impacted by thyroid medication (11), therefore, preference has been given to studies carried out in schoolchildren. Thus, the UIC data have been selected for each country in the following order of priority: data from the most recent nationally representative survey carried out in (i) schoolchildren, (ii) adults, and (iii) pregnant women. In the absence of recent national surveys, subnational data were used in the same order of priority.
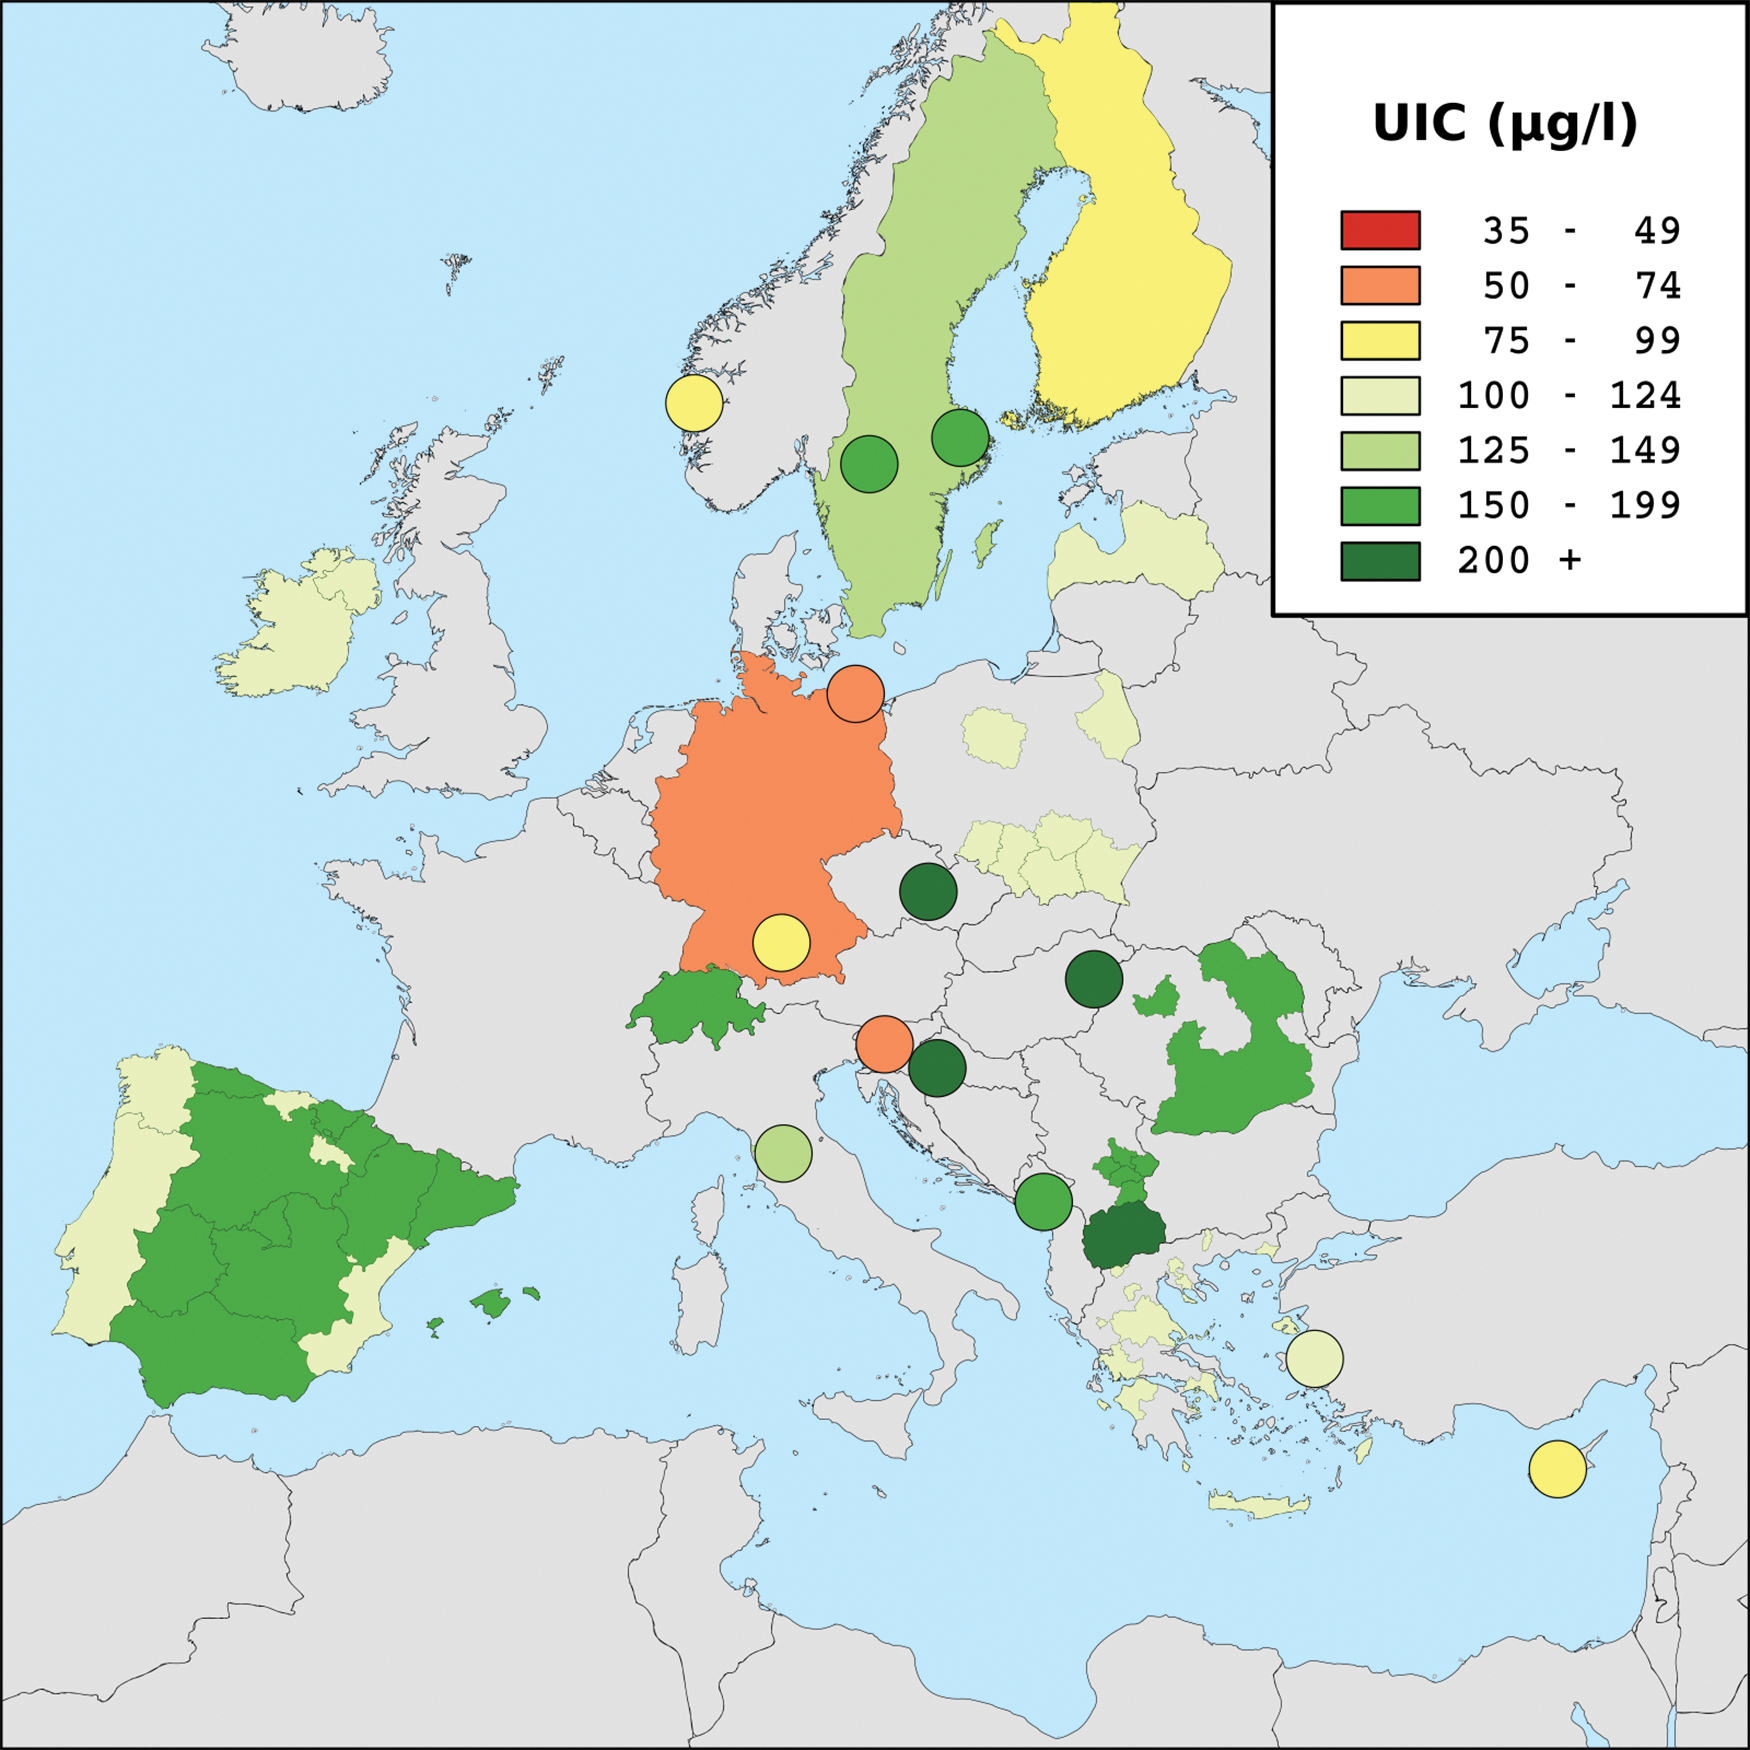
Standardized European map of median UICs; studies have been selected for each country in the following order of priority: most recent study in (i) schoolchildren, (ii) adults, (iii) pregnant women; gray shadings indicate “no data available.” UICs, urinary iodine concentrations. Color images are available online.
Standardized Median Urinary Iodine Concentrations in European Monitoring Studies
CI calculated by bootstrapping with 500 repetitions.
CI, confidence interval.
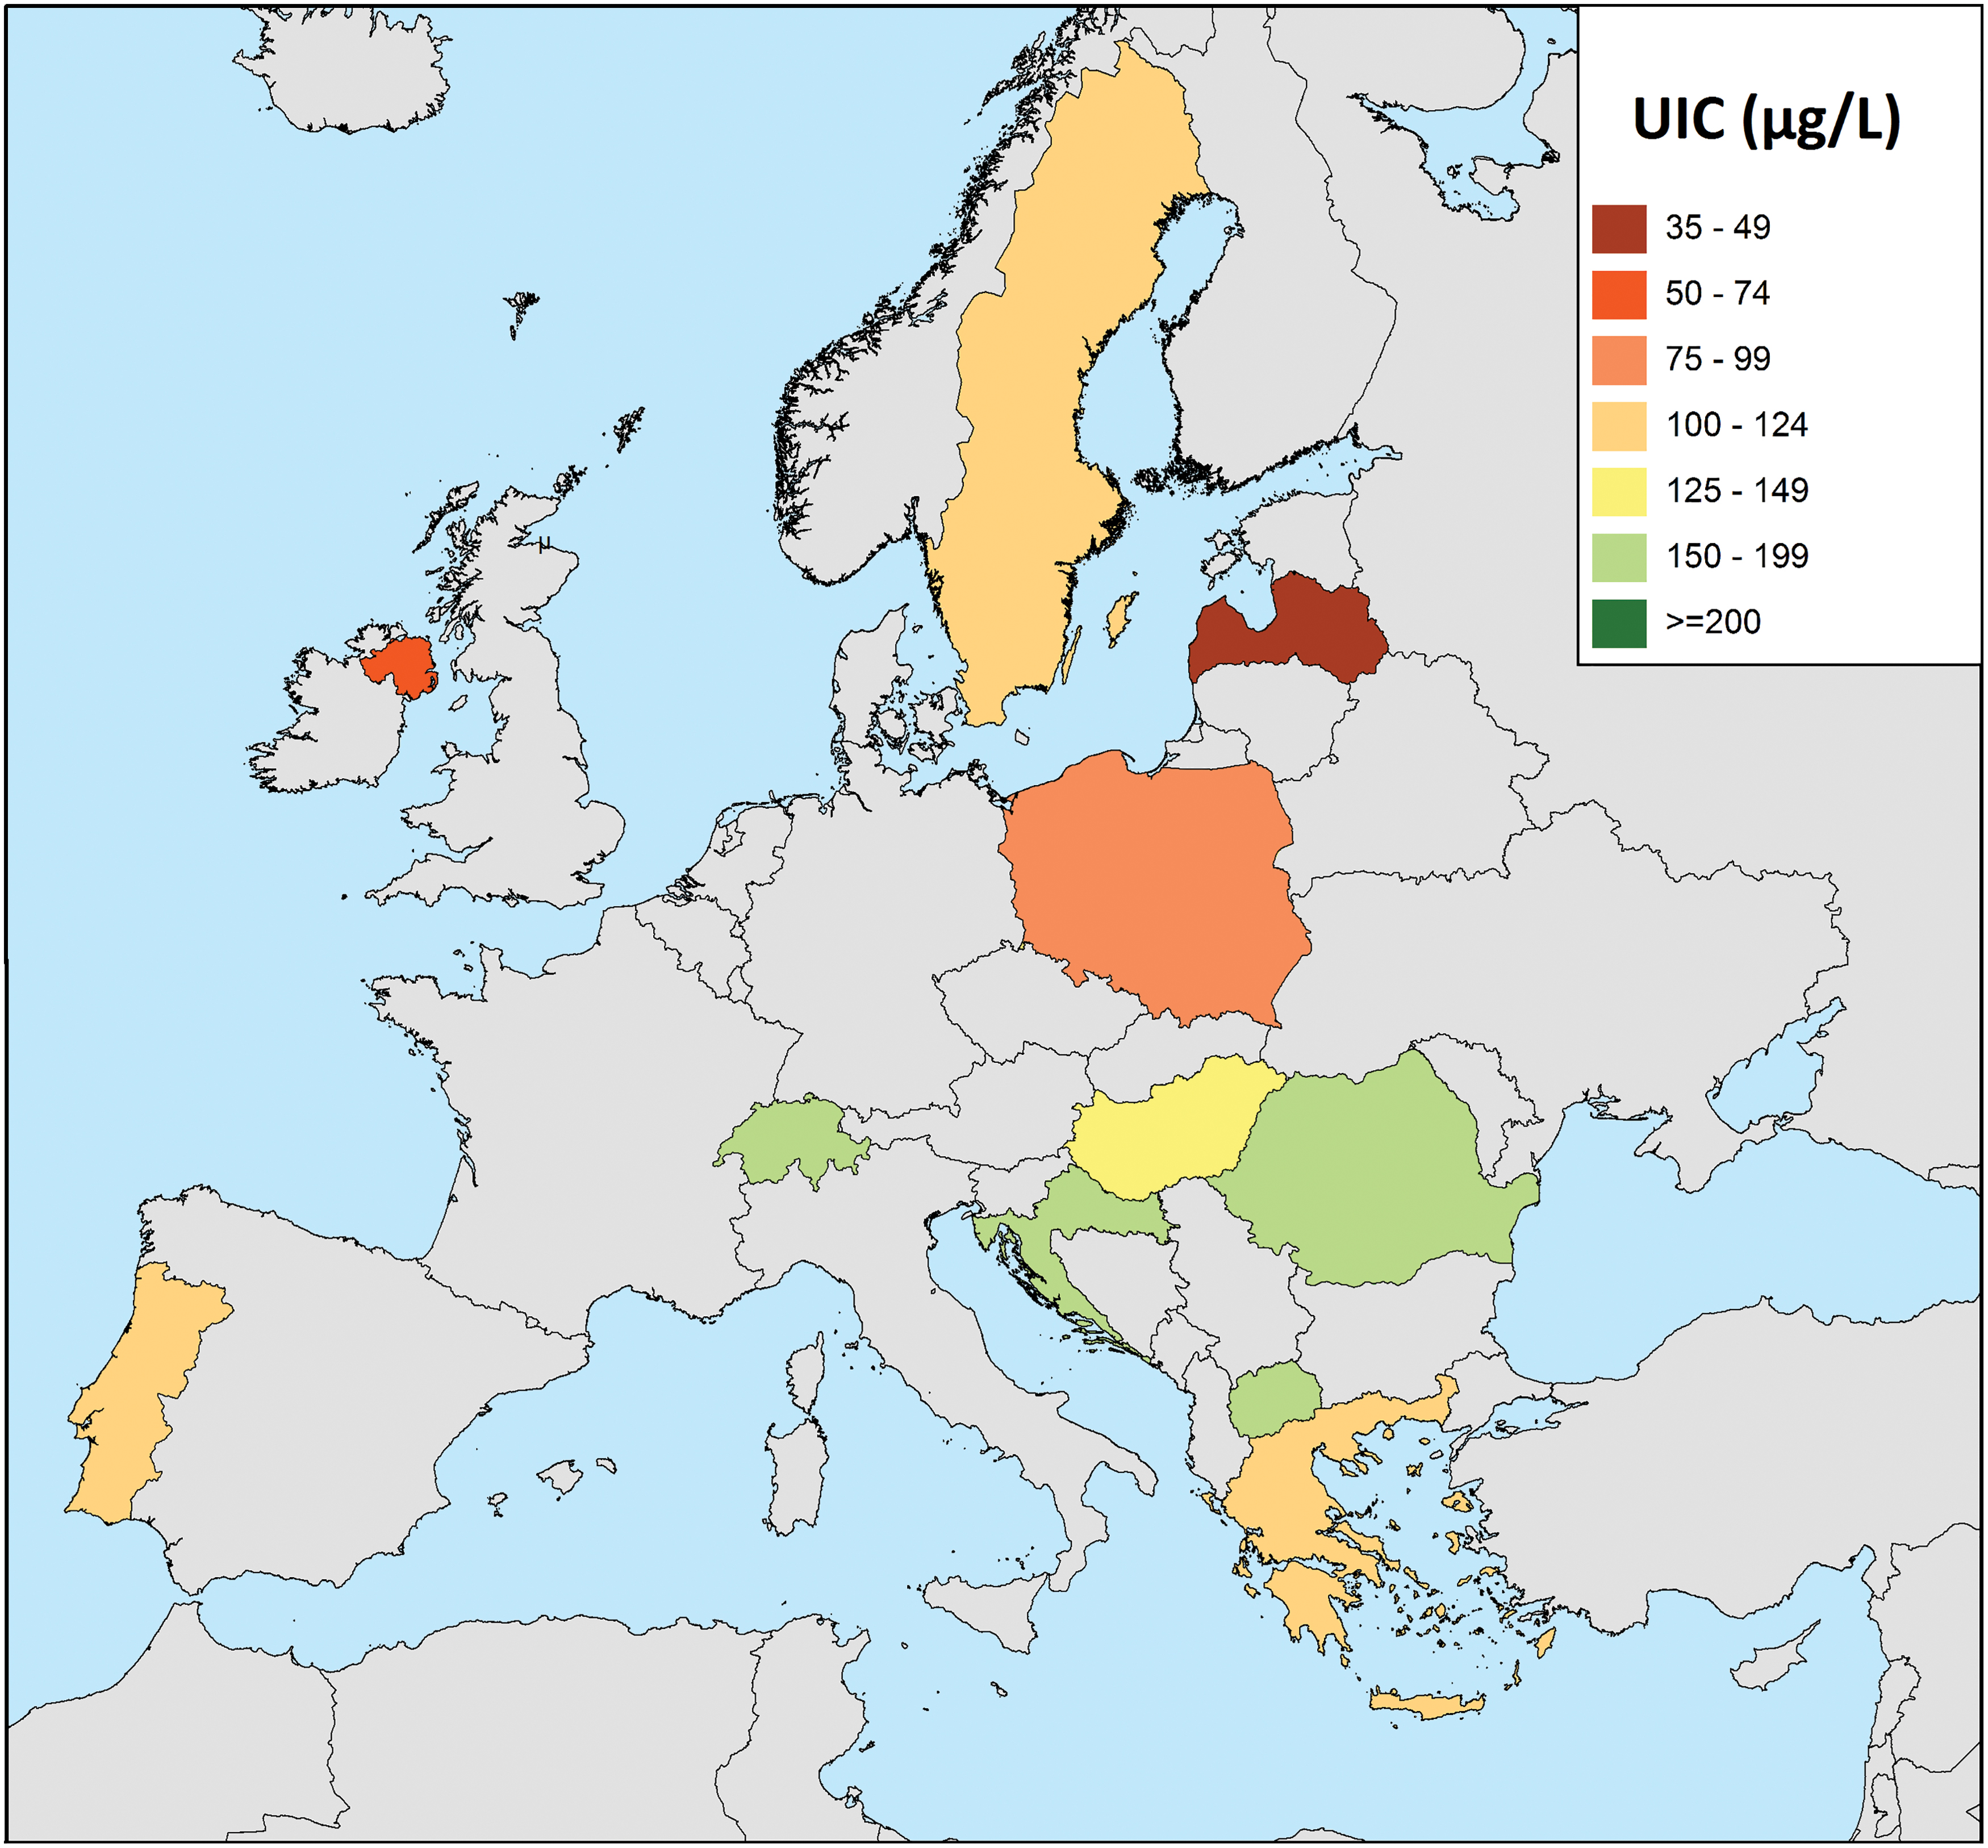
European maps of standardized UICs in schoolchildren, adults, and pregnant women are displayed in Figures 2 –4 at the country level. Median standardized UIC was <100 μg/L in 1 out 16 (6.3%) studies in schoolchildren, while in adults 7 out of 13 (53.8%) studies had a median standardized UIC <100 μg/L. In tendency, countries from eastern Europe were better supplied by iodine than northern and western European countries. Seven out of 11 (63.6%) studies in pregnant women revealed a median standardized UIC <150 μg/L. In some countries, median UIC differed strongly across subpopulations. Especially in Latvia, but also in Germany, Switzerland, Spain, Czech Republic, and Macedonia, schoolchildren had higher median UICs than adults.
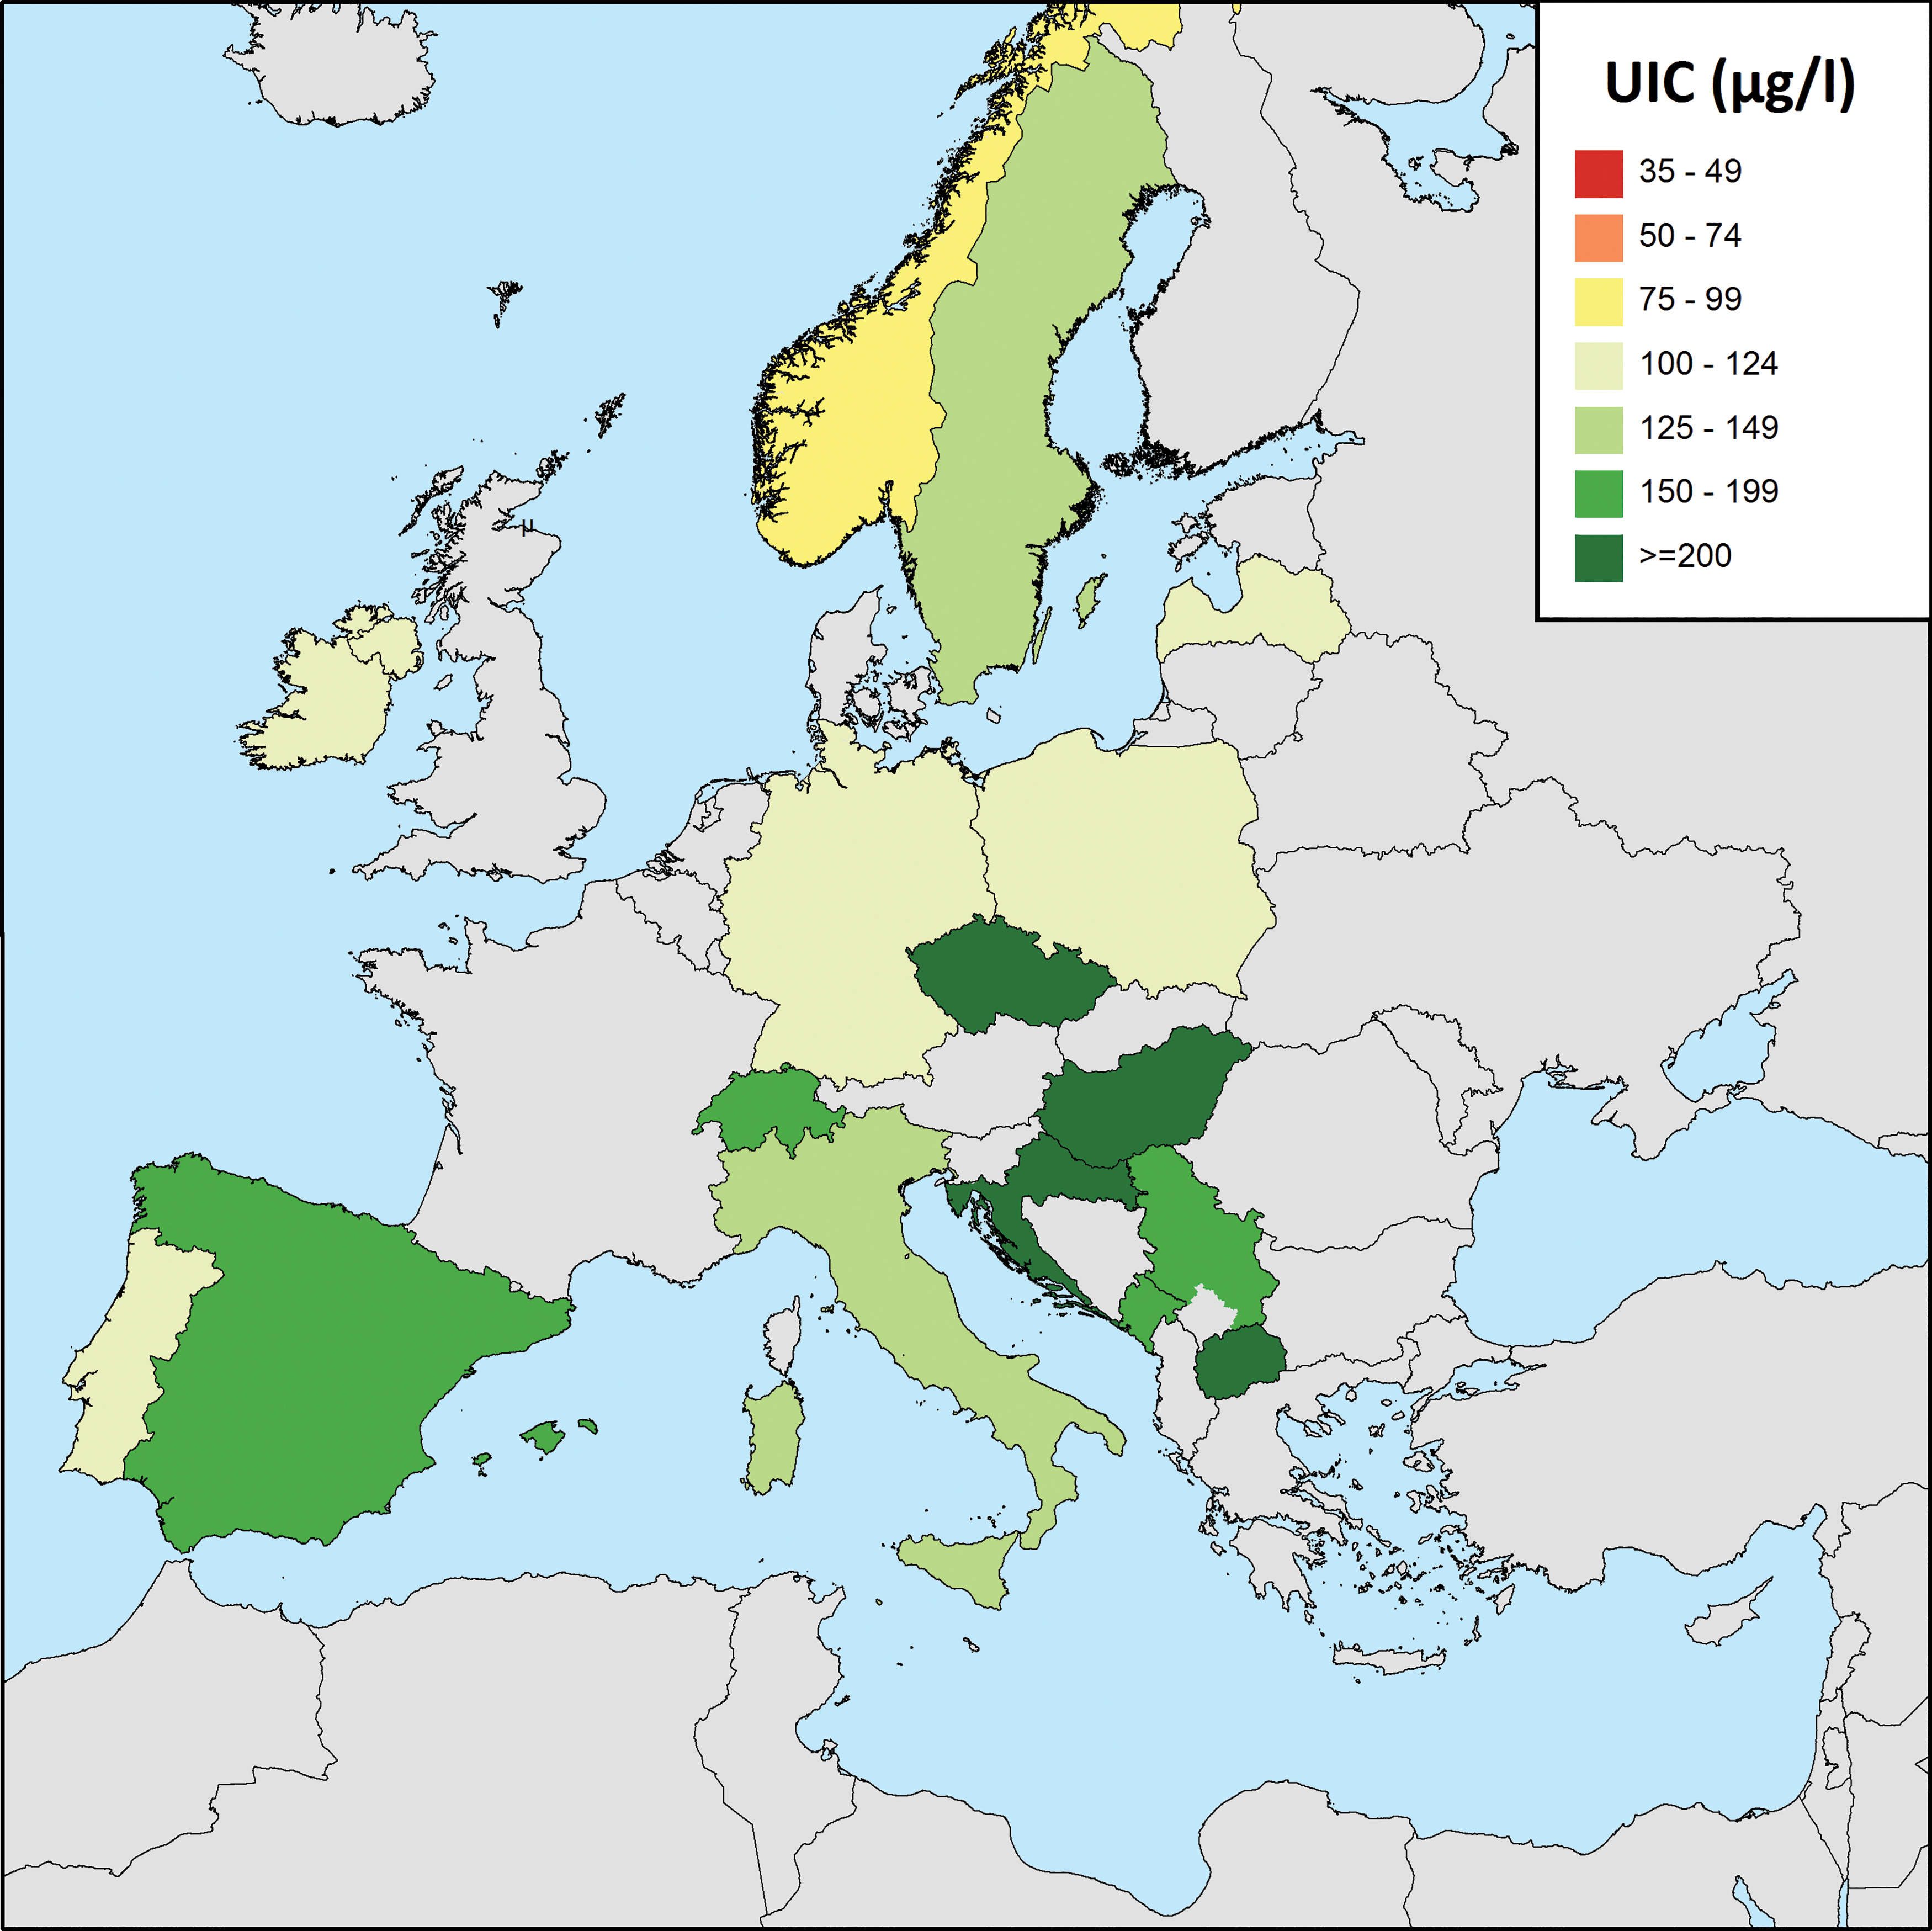
Standardized European map of median UICs in schoolchildren; gray shadings indicate “no data available.” Color images are available online.

Standardized European map of median UICs in adults; gray shadings indicate “no data available.” Color images are available online.
Standardized European map of median UICs in pregnant women; gray shadings indicate “no data available.” Legend reflects adequate iodine intake in pregnant women with a median UIC of 150–249 μg/L as recommended by the World Health Organization (WHO). Color images are available online.
Discussion
We observed substantial differences in UIC measurements between different laboratories. These results show that standardizing UIC measurements is important when comparing results. Looking for example at the population-based German adults studies DEGS (nationwide, 2011), SHIP-Trend (northeast Germany, 2012), and KORA (south Germany, 2008), the range of nonstandardized median UICs varied substantially and was between 44 and 158 μg/L. Even though voluntary iodine fortification in Germany can lead to regional differences in iodine status, such large differences were not expected and do not seem plausible. However, different laboratories were responsible for the UIC measurements in the latter studies and we previously demonstrated larger differences in UIC measurements across these laboratories (4). While UIC measurements by Sandell–Kolthoff reaction were quite comparable with UIC measurements by the gold-standard ICP-MS for one laboratory, there were substantial differences in UICs for the other two laboratories using the Sandell–Kolthoff reaction compared with the ICP-MS method (4). Thus, we believe that a potential explanation for the differences across the laboratories is the use of different digestion methods (4). Particularly, an insufficient amount of the oxidizing digestion acid may result in elevated UIC measurements. After standardizing data from the European studies using the gold-standard EUthyroid laboratory, the median UICs were less variable, ranging between 51 and 93 μg/L, which indicates that Germany is currently mild to moderately iodine deficient.
Our standardized UIC data show that mild-to-moderate iodine deficiency is still common in the adult population and in pregnant women in Europe, according to WHO criteria (1). Schoolchildren, in contrast, are mostly iodine sufficient, according to this study. Compared with children and adolescents, adults are likely to obtain less iodine from the diet because of lower consumption of milk products, the main source of dietary iodine in many countries (12 –14). This, together with larger urine volumes in adults compared with schoolchildren (15) or amount of liquids consumed, may explain the higher frequency of adult studies with median UIC <100 μg/L compared with studies in schoolchildren.
Pregnant women represent a specific subgroup of the general population. During pregnancy, iodine demand is higher and iodine clearance in the kidney increases, which is taken into account in the WHO pregnancy population cutoff for sufficient iodine supply (150 μg/L) in UIC (1). Pregnant women are recommended to take iodine supplementation in some countries (16), which hampers the comparison between iodine status in pregnant women and other populations in a study region. Furthermore, physiological changes during pregnancy and the fact that sample collection from pregnant women is sometimes performed in conjunction with ultrasound measurements, when they are advised to drink more water, lead to a higher dilution of the urine samples and in consequence to lower UICs (17). For these reasons, monitoring studies in pregnant women should not be used to characterize the iodine status of the general population and should be assessed separately from monitoring studies in children and adults. Our data demonstrate that pregnant women are particularly affected by iodine deficiency in Europe, emphasizing the importance of monitoring studies and an improved iodine status in this vulnerable subgroup.
Our standardized UIC data show iodine deficiency in 53.8% of all adult studies, but iodine deficiency in only 6.3% of studies in schoolchildren. The 2017 iodine scorecard of the IGN indicates only two European countries as iodine deficient, but in the IGN scorecard, the iodine status of all countries with data is based on studies in schoolchildren, with the exception of Finland (2). WHO recommends monitoring of UICs in school-age children as a proxy for the general population (1). Although WHO also defines adequate iodine intake in adults as a median UIC value ≥100 μg/L (1), the scientific basis for this threshold is weak (18). Future research to define a functional UIC cutoff value for adults indicating iodine deficiency would be valuable.
For the IGN scorecard, studies were not standardized, which may also be an explanation for the differences to our map. Another potential source of variation when comparing iodine surveys is the use of iodine–creatinine ratios (ICRs). ICR has the advantage that UIC measurements are standardized to dilution of the urine samples, but the measurement error of ICR is larger than that for UIC, because two biomarkers are set into context. In large populations, the effect of the dilution of urine samples should cancel out. In a recent study, it was reported that a study size of 500 individuals is needed to determine the iodine level of a population with a precision of 5% (19). Thus, we recommend to analyze UICs instead of the ICR in larger population studies. In pregnant women, however, ICR data are useful, because of the large variation in the dilution of urine during pregnancy.
Iodine supply appears to be better in eastern European countries than in western or northern European countries. This may be due to the fact that in eastern Europe, iodine fortification programs are obligatory and well monitored, whereas in the rest of Europe, iodine fortification programs are mostly voluntary (6).
The major strength of our study is that we present, for the first time, standardized data on iodine status for Europe. For standardization of each laboratory, we used a sufficient number of samples (n = 75) covering the whole range of UICs. The standardization approach was not ideal, because it was based on postharmonization of data from existing studies. However, it yields a general view of the current iodine status across Europe, and indicates that preharmonized studies are needed, as well as actions to improve iodine intake in certain population groups. The main limitations of our study arise from differences of the monitoring studies included, for example, in recruitment procedures (population based or not), size of study (ranging from 74 to 14,641 study participants), or timing of sample collection. Furthermore, subnational UIC surveys should be interpreted with caution. These surveys are commonly carried out to provide a rapid assessment of population iodine status, but due to a lack of sampling rigor, they may over- or underestimate the iodine status at the national level. Even though schoolchildren are the ideal population, they are not representative for adult populations, because adolescents and adults are expected to have a lower UICs due to differences in diet. Particularly, the consumption of milk varies significantly between these subpopulations.
In the EUthyroid project, we standardized the data from European iodine monitoring studies and demonstrated that iodine status is generally adequate in schoolchildren but iodine deficiency may still be present in adults and pregnant women. An improvement of the iodine supply in Europe is hampered by different national legislations, leading to a disproportionate use of iodized salt in processed food production (6). Therefore, a more uniform European legislation on iodine fortification is required. The standardized European map of UIC is an important milestone to provide robust evidence to encourage stakeholders to improve and harmonize legislations toward Europe and beyond. In future studies, much more effort should be put on harmonizing the procedures used in iodine monitoring studies, beginning from the planning phase and including sample collection procedures and UIC measurements, to improve the validity and comparability of iodine studies.
Footnotes
Author Disclosure Statement
No competing financial interests exist.
Funding Information
The EUthyroid project has received funding from the European Union's Horizon 2020 research and innovation program under grant agreement no. 634453.
Supplementary Material
Supplementary Table S1