
Abstract
Background:
Mitochondrial stress is known to activate the mitochondrial unfolded protein response (UPRmt). The UPRmt results in the secretion of mitochondrial cytokines (mitokines), which can promote a hormetic response cell nonautonomously, and has been reported to be protumorigenic. Growth differentiation factor 15 (GDF15) is a well-characterized mitokine, which is reported to have a mitohormetic effect. Thus, we investigated whether GDF15 induction could prime a subpopulation of thyroid cancer cells to provide invasive advantages.
Methods:
The UPRmt, including mitokine expression, was assessed in the context of thyroid cancer in vitro and in vivo. GDF15 expression in 266 patients with papillary thyroid carcinoma (PTC) was determined by immunohistochemistry. The serum levels of GDF15 were measured in healthy subjects and PTC patients. In addition, our own and The Cancer Genome Atlas data were analyzed to determine the expression level of GDF15 in thyroid cancers. The role of GDF15 in tumor aggressiveness was investigated by observing the effects of GDF15 knockdown in BCPAP, TPC-1, 8505C, and FRO cells.
Results:
Pharmacological inhibition of mitochondrial oxidative phosphorylation function in thyroid cancer cells robustly increased GDF15 expression. The expression of GDF15 was associated with activation of the mitochondrial integrated stress response pathway in PTC patients. Circulating GDF15 levels were significantly higher in PTC patients than in the controls, and tumor expression of GDF15 was related to tumor aggressiveness. In vitro and in vivo knockdown of GDF15 in a thyroid cancer model showed decreased viability, migration, and invasion compared with the control cells via regulation of STAT3.
Conclusions:
In this study, we demonstrated that GDF15 is a mitokine induced in thyroid cancer cells upon mitochondrial stress. GDF15-induced STAT3 activation determined tumor progression in thyroid cancer. The GDF15-STAT3 signaling axis may be a target in aggressiveness of thyroid cancer.
Introduction
The energy metabolism of most cancer cells differs markedly from that of normal cells, as increased energy is required to meet the demands of tumor progression (1). Mitochondria play pivotal roles in tumorigenesis as they are vital organelles responsible for energy production, the generation of radical oxygen species, calcium homeostasis, and the regulation of apoptotic signaling (2). Cancer cell proliferation is regulated by these mitochondrial functions during cancer development (3,4). Recently, it has become clear that the control of cellular energy metabolism by oncogenes and other tumor-related factors is a critical factor involved in the determination of the clinical phenotypes of cancer. The importance of mitochondria in thyroid cancer has also been demonstrated, as previous studies found that the majority of the mutations in thyroid tumor cell lines were located in the genes encoding mitochondrial complex I of the respiratory chain and that the disruptive mtDNA mutations were markers for oncocytic thyroid tumors, which accumulate abnormal mitochondria (5,6).
Mitohormesis, a phenomenon that moderates mitochondrial stress and can lead to persistent activation of cytoprotective mechanisms, has a critical role in homeostasis in multiple organs, and a theory of mitochondria as a central regulator is emerging (7,8). The mitochondrial unfolded protein response (UPRmt) is a retrograde response activated by proteotoxic stress (9,10). As mitochondrial dysfunction is an integral part of the initial stages of tumorigenesis, mechanistic insight into the effects of altered mitochondrial function on carcinogenesis may lead to novel therapeutic approaches (11). Upregulation of mitochondrial stress responses, such as the UPRmt, due to a deficiency in oxidative phosphorylation (OxPhos) or metabolic stress, can lead to increased levels of mitokines, including fibroblast growth factor 21, growth differentiation factor 15 (GDF15), and angiopoietin-like protein 6, and such factors have been demonstrated to maintain tissue homeostasis and to improve glucose intolerance due to mitochondrial stress in diverse metabolic disease rodent models (11 –13). These mitokines were identified as regulators of systemic adaptations to organ-specific OxPhos dysfunction; however, it remains unclear whether mitokines influence tumor aggressiveness. Interestingly, a recent study showed that mitohormesis promotes tumor aggressiveness by upregulating mitochondrial stress responses, providing an adaptive metastatic advantage (14). The authors showed that the SIRT3 axis of the UPRmt is necessary for invasion and metastasis in breast cancer patients and discovered that UPRmt-HIGH patients have expression profiles characterized by metastatic programs and the cytoprotective outcomes of mitohormesis. These findings suggested that while mitohormesis is associated with tissue-protective signaling in healthy people or those with metabolic disease, it is now recognized to have protumorigenic effects in cancer cells.
Recent studies suggest that secretory factors may mediate non-cell autonomous stress responses under conditions of systemic stress. GDF15, a member of the transforming growth factor beta superfamily and a putative mitokine, has anti-inflammatory activities (15,16). Furthermore, serum GDF15 level was elevated in patients with viral hepatitis, cancer, or metabolic disease relative to its level in healthy controls (17 –20). Mitochondrial dysfunction was also associated with elevated serum GDF15 levels in obese mice, which was linked to the restoration of metabolic homeostasis (16). Therefore, GDF15 induction is thought to be an adaptation to stress response signaling pathways activated by mitochondrial stress in various inflammatory diseases. GDF15, in particular, has also been reported to be related to cachexia in cancer patients (21,22); however, its role as a mitohormetic factor in thyroid cancer remains to be explored. In this study, we aimed to establish a direct link between mitochondrial function and GDF15 induction in thyroid cancer. The aim of this study was to investigate whether GDF15 induction occurred under endogenous oxidative stress in thyroid cancer and to explore the role of GDF15 in promoting tumor growth and progression.
Materials and Methods
Cell culture and transfection
All cell lines were kindly provided by Dr. Young Joo Park (Seoul National University College of Medicine, Seoul, Republic of Korea). Nthy-ori3-1 cells (a normal thyroid follicular cell line from an adult human) and 8505C cells (an anaplastic thyroid cancer cell line) were cultured in RPMI 1640 medium (Invitrogen, Carlsbad, CA) supplemented with 5% fetal bovine serum (FBS), 100 U/mL penicillin, and 100 μg/mL streptomycin at 37°C in a humidified atmosphere of 5% CO2. XTC.UC1 cells (a Hürthle cell carcinoma cell line) and human papillary thyroid carcinoma (PTC) cell lines (including the BCPAP and TPC-1 cell lines) were cultured in Dulbecco's modified Eagle medium (DMEM) supplemented with 5% FBS, 100 U/mL penicillin, and 100 μg/mL streptomycin under the same environmental conditions. Transient transfection was performed when the cells reached 60% confluence using Lipofectamine 2000 reagent (Invitrogen). BCPAP, TPC-1, and 8505C cells were transfected with 20 pmol of GDF15 siRNA-1 (sense: 5′-CAA GAA CUC AGG ACG GUG AAU GGC U-3′; antisense: 5′-AGC CAU UCA CCG UCC UGA GUU CUU G-3′), GDF15 siRNA-2 (sense: 5′-UCG GAC CAA CUG CUG GCA GAA UCU U-3′; antisense: 5′-AAG AUU CUG CCA GCA GUU GGU CCG A-3′), STAT3 siRNA (sense: 5′-CC GAG CCA AUU GDG AUG CU-3′; antisense: 5′-AG CAU CAC AAU UGG CUC GG-3′), or control siRNA (#SN-1003; Bioneer, Daejeon, South Korea) dissolved in Opti-MEM medium (Gibco) using Lipofectamine RNAiMAX reagent (Thermo Fisher Scientific, Waltham, MA) according to the manufacturer's protocol. All experiments were performed in duplicate and repeated at least three times.
Oxygen consumption rate measurement
Oxygen consumption rate (OCR) was measured using a Seahorse XF-24 analyzer (Seahorse Bioscience, Inc., North Billerica, MA). Briefly, thyroid cells were seeded in XF-24 plates (4 × 10⁴ cells in 200 μL of growth medium per well) and placed in a 37°C/5% CO2 incubator for 24 hours. The sensor cartridge was placed into the calibration buffer supplied by Seahorse Bioscience and incubated at 37°C in a non-CO2 incubator for 24 hours before the experiment. Immediately before measurement, the cells were washed and incubated in assay media at 37°C for 1 hour in a non-CO2 incubator. The following compounds were added to the ports of the XF 24 biosensor cartridge: oligomycin A (20 μg/mL), the inhibitor ATP synthase (complex V) was injected to measure cellular ATP production, and carbonyl cyanide m-chloro phenyl hydrazine (optimized concentration; 50 μM), the uncoupling agent was secondary treated to measure maximal respiration due to disruption of the mitochondrial membrane potential. Rotenone, a complex I inhibitor, was injected to shut down mitochondrial respiration (20 μM) and to calculate the nonmitochondrial respiration. The OCR was automatically recorded by the sensor cartridge and calculated using the Seahorse XF-24 software.
Western blot analysis
Cells were lysed in RIPA buffer (30 mM Tris, pH 7.5, 150 mM sodium chloride, 1 mM phenylmethylsulfonyl fluoride, 1 mM sodium orthovanadate, 1% Nonidet P-40, and 10% glycerol) containing phosphatase and protease inhibitors (Roche, Basel, Switzerland). The Western blot analyses were performed with 30–50 μg of protein from tissue or cell homogenates using commercially available antibodies. Detailed descriptions of the methods are provided in Supplementary Table S1 and in the Supplementary Materials and Methods section.
Messenger RNA isolation and quantitative real-time reverse transcriptase–polymerase chain reaction
Total RNA was isolated using TRIzol (Invitrogen, Life Technologies). Complementary DNA (cDNA) was prepared from the total RNA using M-MLV Reverse Transcriptase and oligo-dT primers (Invitrogen). Real-time polymerase chain reaction (PCR) was performed using the cDNA, QuantiTect SYBR Green PCR Master Mix (Qiagen), and specific primers. The PCR program included 40 cycles of 95°C for 15 seconds, 60°C for 1 minute, and 72°C for 1 minute. Primer sequences used in the present study are provided in Supplementary Table S2.
Subjects
In our study, all participants were diagnosed with PTC via ultrasound-guided fine-needle aspiration biopsy. Data from 266 PTC patients who underwent total thyroidectomy and cervical lymph node (LN) dissection at Chungnam National University Hospital (CNUH) from 2003 to 2010 were retrospectively analyzed. Prophylactic central LN dissection was performed on 176 patients without clinical evidence of positive LNs via imaging or palpation. Thirty-six patients with clinically evident positive central LNs underwent therapeutic central LN dissection. The remaining 54 patients underwent central and lateral LN dissection due to evidence of metastatic LNs in the lateral neck before surgery. The median follow-up period for evaluating tumor recurrence was 98.7 ± 37.4 months. The protocol for this study was approved by the institutional review board (IRB) of CNUH (Reg. No. CNUH IRB No. 2017-07-005). Our blood samples for measurement of GDF15 were collected at the time of the initial diagnosis of thyroid cancer. Venous blood samples were taken after at least an 8-hour fast on the morning of thyroid surgery. In control participants, blood samples were also collected after at least an 8-hour fasting. Plasma was prepared by centrifugation at 2000 g at 4°C for 15 minutes and was then stored in liquid nitrogen until analysis. Detailed information on the subjects is provided in the Supplementary Materials and Methods section.
Immunohistochemistry
The tissue samples were retrieved from the archives of the Department of Pathology, CNUH, South Korea. Four-micrometer-thick sections of paraffin-embedded tissue blocks were incubated at 56°C for 3 hours before immunohistochemistry. Specimens were stained using the Vectastain ABC HRP kit (Vector Laboratories, Inc., Burlingame, CA). Antigen retrieval was performed by microwaving the samples in citrate buffer for 10 minutes. Endogenous peroxidase activity was inactivated via incubation in 3% hydrogen peroxide for 10 minutes. Nonspecific binding sites were blocked via incubation in 10% normal goat serum in phosphate-buffered saline. The tissue section slides were incubated with primary antibodies for one hour at room temperature. Detailed descriptions of the methods are provided in the Supplementary Materials and Methods section.
RNA extraction for sequencing
To analyze the transcriptome and identify differentially expressed genes (DEGs), RNA was extracted from tumor tissue samples and paired nontumor tissue samples from thyroid cancer patients. The thyroid tissue samples were isolated from specimens frozen at −80°C immediately after thyroidectomy. The tissue samples were homogenized using a mortar and pestle, and the total RNA was extracted using the easy-spin Total RNA Extraction Kit (iNtRON, Korea) following the manufacturer's protocol. All experiments were conducted under clean conditions, and the equipment was pre-autoclaved. The extracted RNA quality was evaluated using an Agilent 2100 Bioanalyzer RNA Nano Chip. A total of 1 μg of extracted RNA was used to construct RNA libraries using the TruSeq stranded mRNA Sample Preparation Kit v2 (Illumina) according to the manufacturer's protocols. The library quality was analyzed with an Agilent 2100 Bioanalyzer using the Agilent DNA 1000 Kit. All samples were sequenced on the Illumina HiSeq 2500 platform (Illumina) yielding an average of 38 million paired-end 100 base pair reads.
Bioinformatic transcriptome analysis
The reads were aligned to the UCSC Homo sapiens reference genome (GRCh37/hg19) using TopHat2 v2.1.5. The default TopHat parameter options were used. To analyze the DEG profiles between the compared groups (normal vs. tumor), the Tuxedo protocol was used (23). The aligned reads were processed via Cufflinks v2.2.1, which is based on the fragments per kilobase of exon model per million reads mapped (FPKM), and unbiased normalized RNA-seq fragment counts were used to analyze the relative transcript levels (23). Gene transfer format (GTF) files were generated to quantitatively compare the transcript levels in each sample with those in a reference GTF file. Next, we used Cuffdiff to calculate the differences in the FPKMs between each group. False discovery rate (FDR)-adjusted p-values (<0.05) were calculated via the Benjamini–Hochberg multiple testing method (24). We also investigated the pivotal role of GDF15 using The Cancer Genome Atlas (TCGA) database, and these methods are described in the Supplementary Materials and Methods section. In addition, we identified DEGs by establishing two groups based on the GDF15 expression level in tumor of TCGA database. To compare gene set in the CNUH cohort and TCGA database, the gene set collection of KEGG was obtained from Enrichr. DEG and KEGG with corrected values <0.05 by the Benjamini–Hochberg method were considered statistically significant. Heat maps were performed with PermutMatrix Version 1.9.3.
Cell viability assay
Cells were plated at a density of 5 × 10³ per well in serum-free culture medium and then treated with 0.1% bovine serum albumin (BSA) (control) or rGDF15 (100 ng/mL). After incubation for 12 hours, the viability of the thyroid cancer cells was measured using the WST-1 cell viability reagent (Roche Diagnostics Corporation, Indianapolis, IN). The results are presented as percentages of the control cell value.
Cell migration and invasion assays
PTC cell migration was assessed in Transwell chambers (Corning Costar, Cambridge, MA) with 6.5 mm diameter polycarbonate filters (8 μm pore size). The lower surface of the filter was coated with 10 μg of gelatin for the migration assays and 25 μg of reconstituted basement membrane substance (Matrigel; BD Bioscience) for the invasion assays. Fresh DMEM or RPMI containing 3% FBS was placed in the lower wells. PTC cells (BCPAP and TPC-1) and anaplastic cells (8505C) were incubated for 24 hours in medium containing 1% FBS and then trypsinized and suspended at a final concentration of 1 × 10⁶ cells/mL in medium containing 1% FBS. Cell suspensions (100 μL) were loaded in the upper wells, and the chambers were incubated at 37°C for 12 hours with 0.1% BSA as the control or 100 ng/mL rGDF15. The cells were then fixed and stained with crystal violet. The non-migrating cells on the upper surface of the filter were removed by wiping with a cotton swab. Chemotaxis was quantified by counting the numbers of cells that migrated to the lower side of the filter using an optical microscope (200 × ). Eight randomly chosen fields were counted for each migration assay.
Plasmid construction and site-directed mutagenesis
The pGL3B-human GDF15 (21,739/+70) luciferase reporter constructs were provided by Dr. Y. Moon (Pusan National University, Pusan, Korea). The pGL3B-GDF15 deletion (STAT3 [2660 base pair]) plasmid was constructed by inserting the PCR-amplified fragment of the human GDF15 promotor into the KpnI/XhoI-digested pGL3Basic vector (Promega Corp., Madison, WI). The nucleotide sequence of the 59-flanking region of the GDF15 promoter was scanned, and 1 putative STAT3-binding site (2670–2661, TTCCTGGAA) was identified. To create a STAT3 mutRE point-mutant reporter (GDF15 STAT3mut-Luc [21,739/+70]), the 59-gaagacTTCCTGGAAgaggggctttttgcg-39 sequence of the STAT3 RE (2670) vector was mutated to 59-gaagacCCCAACCCCgaggggctttttgcg-39 using DpnI-based site-directed mutagenesis (Agilent Technologies). The nucleotide sequences of all plasmids were confirmed by automated sequencing.
Animal experiments
Six-week-old BALB/c nude mice were obtained from Orient Bio (Seongnam, South Korea). The animals were housed at 24°C with a 12-hour day/night cycle under specific pathogen-free conditions. They had ad libitum access to a γ-ray-irradiated laboratory rodent diet (Purina Korea) and autoclaved water. All experiments were performed in accordance with the relevant guidelines and regulations of the animal care unit at Chungnam National University. The animal protocols for these experiments were approved by the ethics committee of Animal Experimentation of Chungnam National University (No. CNUH-019-A0001-1). GDF15-targeting siRNA- or control siRNA-transfected Luc-FRO cells (1 × 10⁶; 1:1 ratio with Matrigel) were subcutaneously injected every three days in a total volume of 100 μL (n = 10 per injected group). The mice were divided into four groups of five and then intraperitoneally administered STAT3 inhibitor (10 mg/kg/day) or vehicle (n = 10 per injected group). Body weight was recorded periodically. Tumor dimensions were measured using a caliper, and tumor volumes were estimated as follows: tumor volume = (length × width × depth) × π/6, where length and width represent the largest tumor diameter and depth represents the perpendicular tumor diameter. At the experimental endpoint, the tumors were harvested and used for histological analyses. All the animal experiments were repeated at least two times with similar results.
In vivo imaging
Bioluminescence imaging was performed using an in vivo imaging system (IVIS) consisting of a Lumina XRMS instrument (Perkin Elmer). To obtain in vivo bioluminescence imaging, animals were anesthetized via inhalation of 2.5% isoflurane and received intraperitoneal injections of RediJect
Statistics
The significance for between group differences was evaluated using Student's t-test or the Mann–Whitney U test, and continuous variables are expressed as the mean ± standard deviation. Between group differences were compared using the chi-square test, and categorical variables are expressed as percentages. To evaluate associations between serum GDF15 level and other variables, we used Pearson and partial correlation analyses. A two-tailed p-value <0.05 was considered statistically significant. All statistical analyses were performed with SPSS version 22.0 (IBM Corp., Armonk, NY).
Results
Mitochondrial stress response-induced GDF15 expression in thyroid cancer cells
Our previous work with the XTC-UC1 cell line, which carries mitochondrial DNA mutations, revealed ineffective mitophagy, that is, turnover of abnormal mitochondria, due to dysfunctional translocation of Parkin into the mitochondria (25). Oncocytic changes in thyroid follicular cells were also frequently detected in patients with differentiated thyroid cancer, and the presence of oncocytic changes due to abnormal mitochondria was a poor prognostic factor (26). These results suggest that mitochondrial biogenesis and maintenance of mitochondrial quality control have significant roles in tumor aggressiveness in thyroid cancer.
As expected, the XTC-UC1 cell line contained reduced levels of OxPhos function compared with that of a normal thyroid cell line (Nthy-ori3-1) (Fig. 1A). Surprisingly, other thyroid cancer cell lines also showed reduced mitochondrial function compared with that of Nthy-ori3-1 cells (Fig. 1A). Furthermore, BCPAP cells, a PTC cell line with the BRAFV600E mutation, showed elevated accumulation of swollen, abnormal mitochondria with disrupted cristae compared with the Nthy-ori3-1 cells; however, this feature was weaker than that of the XTC-UC1 cells, which exhibited abundant cytoplasm in which functionally defective mitochondria aberrantly accumulated (Fig. 1B). Additionally, blue native-polyacrylamide gel electrophoresis (BN-PAGE) and Western blot analysis revealed that the thyroid cancer cell lines exhibited different levels of the OxPhos complexes compared with those in Nthy-ori3-1 cells (Fig. 1C, D). This suggested that these stressed abnormal mitochondria could induce the UPRmt in thyroid cancer cells. Since we previously identified a role for GDF15, a mitokine induced by the mitochondrial stress response, we investigated the GDF15 expression levels in the thyroid cancer cell lines. GDF15 was expressed in all the thyroid cancer cell lines (Fig. 1E), and XTC-UC1 cells showed the highest GDF15 expression level compared with the other thyroid cancer cell lines (Fig. 1E). Furthermore, induction of mitochondrial stress in the PTC cell lines via doxycycline treatment increased GDF15 secretion (Fig. 1F) and increased the expression of genes related to the UPRmt (LONP1, HSPD1, and TID1) and ER stress response (CHOP, ATF4, and spliced XBP1) (Fig. 1G–I). Thus, our data reveal that decreased mitochondrial function in thyroid cancer cells was likely related with GDF15 expression.
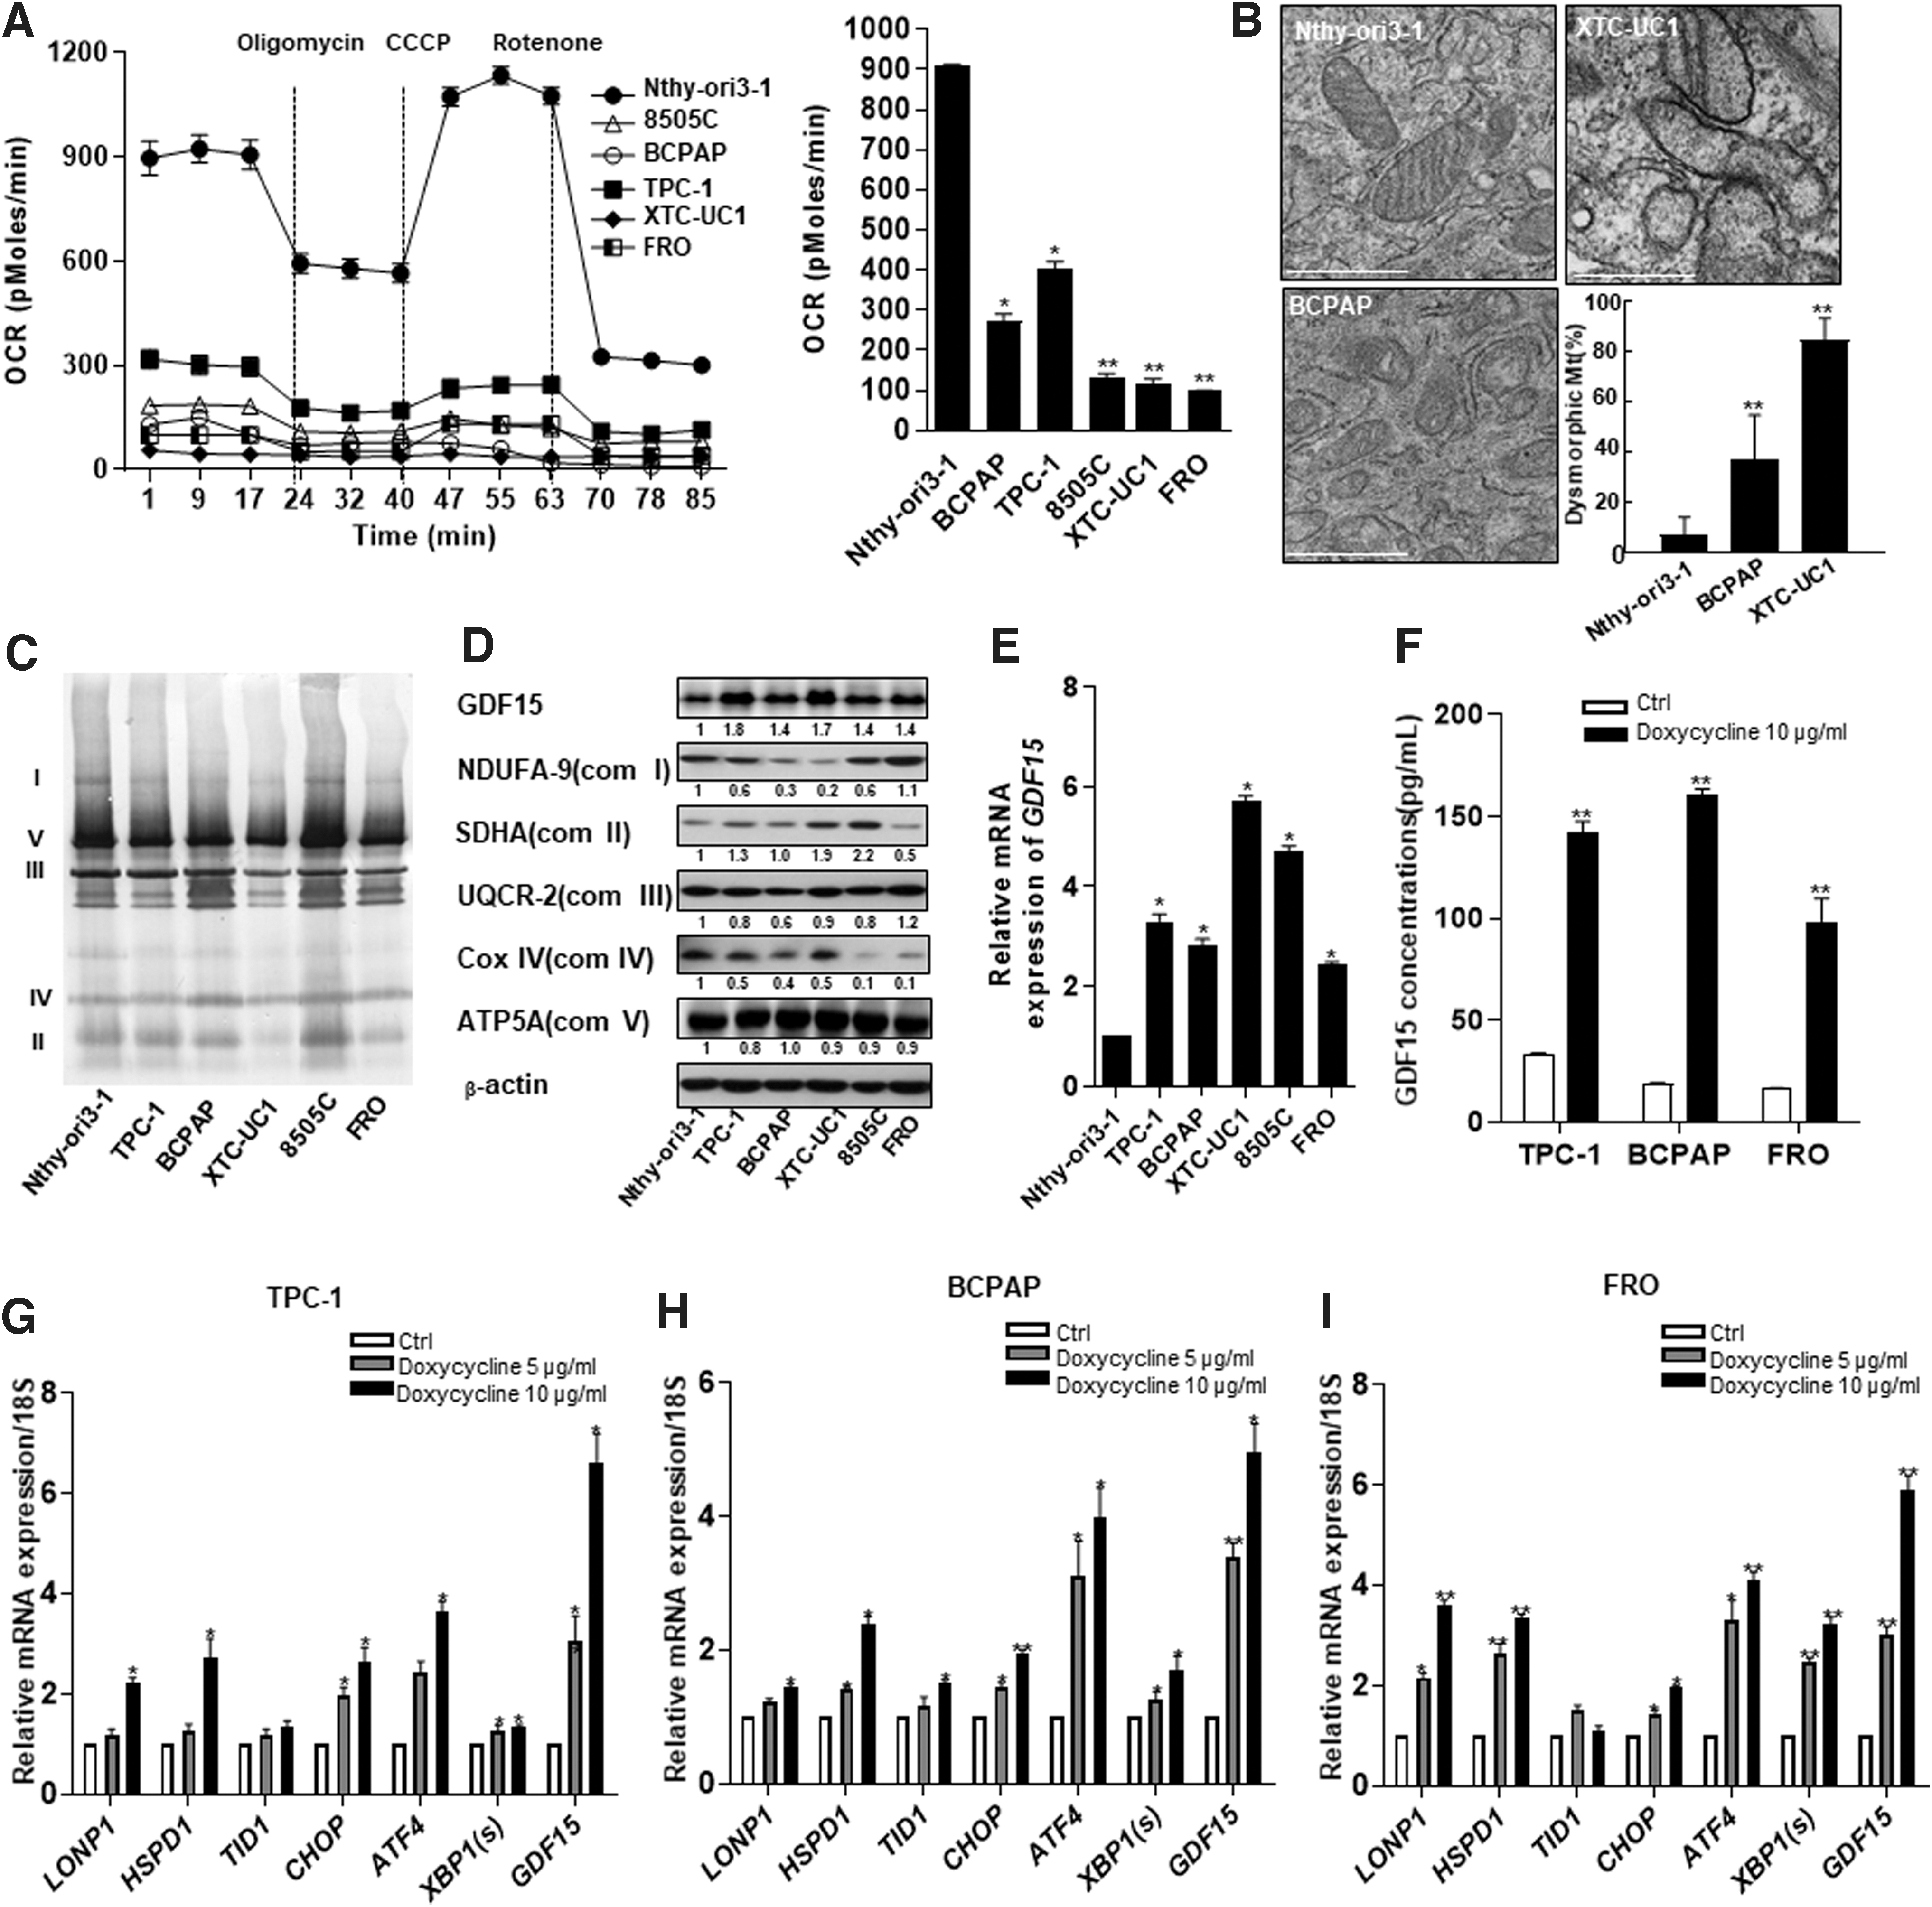
GDF15 expression in thyroid cancer cell lines was associated with reduced mitochondrial OxPhos function and a mitochondrial stress response. (
GDF15 expression is associated with mitochondrial stress response in human thyroid cancer
To determine whether GDF15 represents a significant prognostic marker in human thyroid cancer, we examined the GDF15 immunoreactivity in tumor samples from patients with PTC. As shown in Supplementary Figure S1A, epithelial cells forming normal thyroid follicles did not exhibit significant GDF15 immunoreactivity. By contrast, GDF15 expression was consistently higher in thyroid cancer samples. Comparison of the GDF15 expression levels in tumor samples and paired normal samples from 88 patients revealed significant GDF15 overexpression in thyroid cancer (Fig. 2A, B).
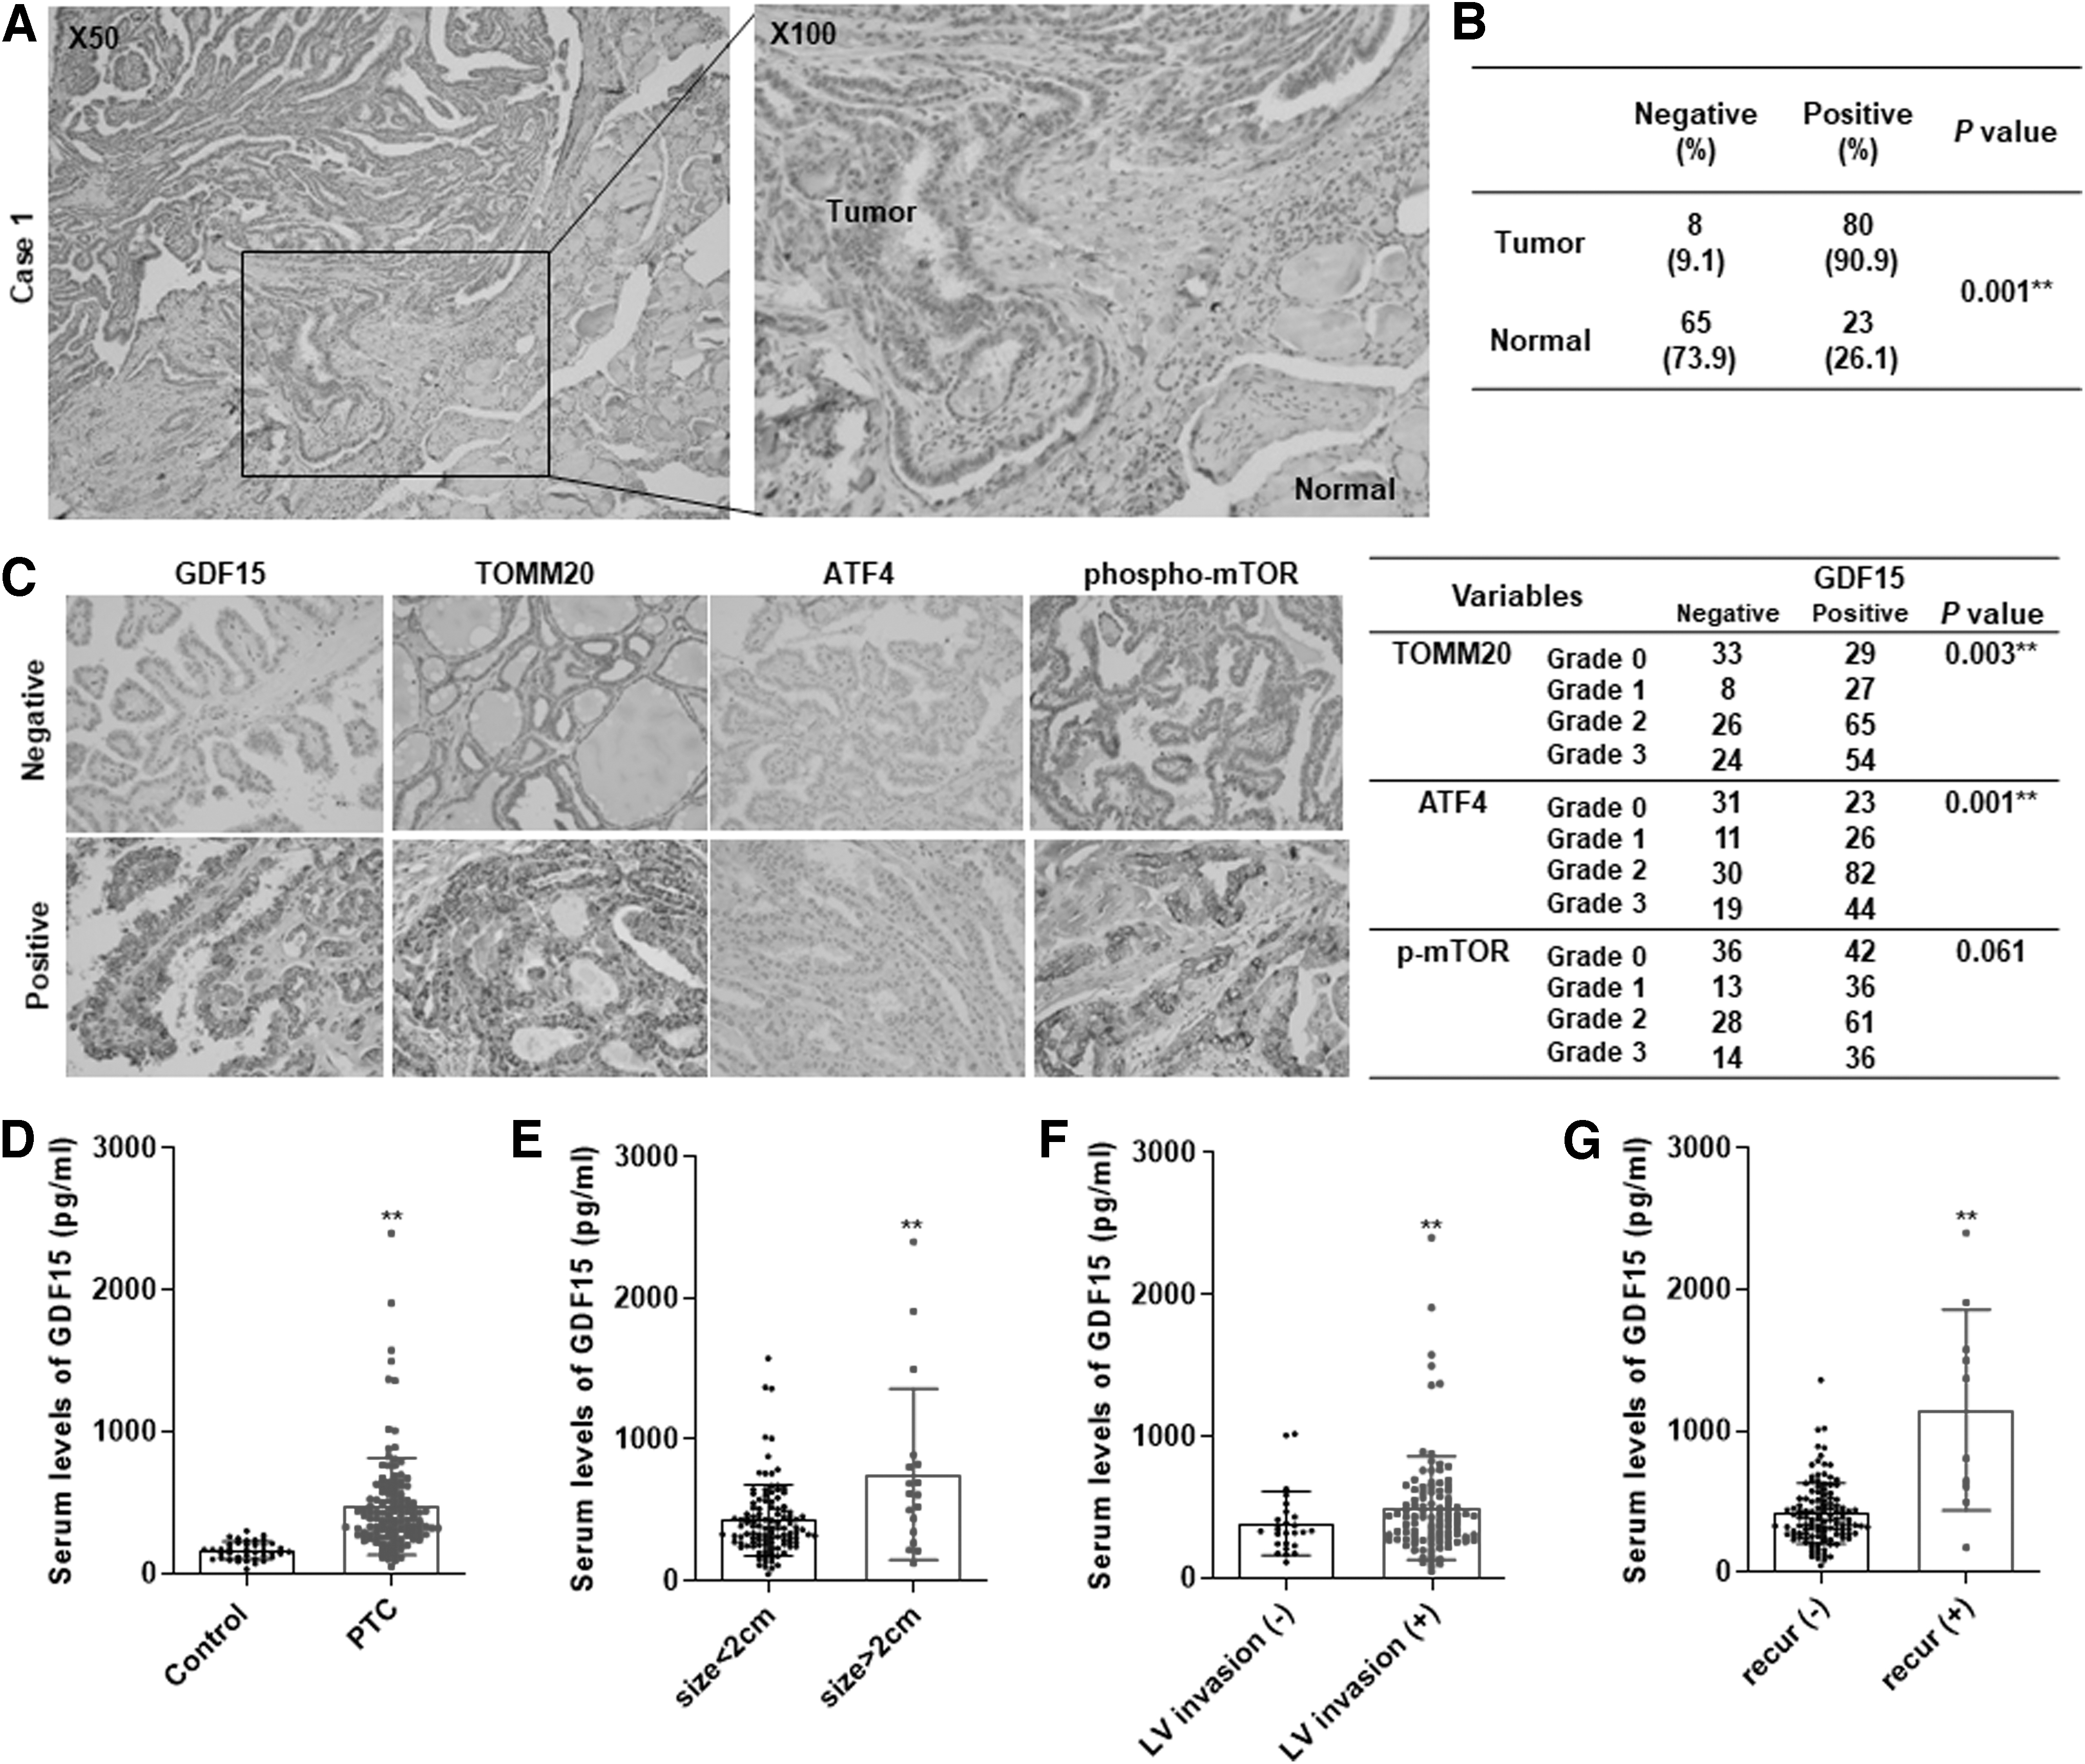
GDF15 expression in normal human thyroid tissue and thyroid cancer tissue and serum GDF15 levels in PTC patients. (
A previous study reported that GDF15 production was induced via mTORC1 activation due to a mitochondrial DNA replication defect and induction of the mitochondrial integrated stress response via ATF4 activation (27). Our in vitro data reveal abnormal mitochondrial accumulation in thyroid cancer, and we identified an association between GDF15 expression and the mitochondrial integrated stress response in human thyroid cancer. Interestingly, lesions with higher GDF15 expression showed higher levels of TOMM20, a biomarker for mitochondrial accumulation, ATF4, phospho-mechanistic target of rapamycin (mTOR), and phospho-S6 than in other samples (Fig. 2C). To explore the important relationship between GDF15 and the mitochondrial integrated stress response, we evaluated the levels of GDF15, TOMM20, ATF4, phospho-mTOR, and phospho-S6 in 266 PTC patients. GDF15 expression was significantly associated with TOMM20 (p = 0.003) and ATF4 expression (p = 0.001) (Fig. 2C). These results suggest that GDF15 expression is also associated with the mitochondrial stress response in human thyroid cancer as indicated by the abnormal mitochondrial accumulation, consistent with previous results from work with a myopathy model (27).
GDF15 expression is correlated with the clinicopathologic features of patients with differentiated thyroid carcinoma
To evaluate the relationship between GDF15 expression and clinicopathologic features, we first catalogued the clinicopathologic features associated with samples from 266 samples of PTC patient treated at CNUH from 2003 to 2010. Representative images of the GDF15 staining intensity and distribution are shown in Supplementary Figure S1B, and the clinical data for the cohort are summarized in Table 1. We analyzed the relationship between the clinicopathologic parameters and GDF15 expression in the PTC patients. The patients were divided into two groups according to their GDF15 immunoreactivity. High GDF15 expression was significantly associated with several clinicopathologic parameters, including T stage (p = 0.009 [95% confidence interval, CI, 1.452–4.222]), microscopic capsular invasion (p = 0.008 [CI 1.211–3.717]), extrathyroidal extension (p < 0.001 [CI 1.412–4.092]), lymphovascular invasion (p = 0.010 [CI 1.187–3.773]), and LN metastasis (p < 0.001 [CI 1.581–4.476]) (Table 1). To assess the usefulness of GDF15 expression as an independent predictor of aggressive phenotypes in PTC, univariate and multivariate analysis using stepwise logistic regression was conducted (Table 2). The univariate analysis using stepwise logistic regression showed that high GDF15 expression was an independent risk factor for gross extrathyroidal extension (p = 0.004, odds ratio [OR] 3.047) and the presence of LN metastasis (p = 0.002, OR 2.375). Multivariate analysis revealed that gross extrathyroidal extension and LN metastasis were independent parameter related to GDF15 expression. Thus, positive GDF15 expression was highly associated with markers of tumor aggressiveness.
Relationship Between GDF15 Expression and Clinicopathologic Factors in 266 Patients with Papillary Thyroid Cancer
p-Values from unpaired t-tests for continuous parametric variables and the Mann–Whitney U test for nonparametric variables. The chi-square test and Fisher's exact test were used to evaluate the significance of the correlations of GDF15 expression with clinical and pathological parameters. TNM classification from the AJCC seventh edition was used.
p < 0.05 between the two categories for a given variable.
AJCC, American Joint Committee on Cancer; GDF15, growth differentiation factor 15; SD, standard deviation.
Multivariate Logistic Regression Analysis of Factors Associated with GDF15 in 266 Patients with Papillary Thyroid Cancer
Cox proportional hazard regression analysis was performed to calculate HR and CI for each covariable. The final multivariate model was based on a stepwise method for clinical factors associated with GDF15 expression in univariate models.
p < 0.05 between the two categories for a given variable.
CI, 95% confidence interval; HR, hazard ratio; OR, odds ratio; SE, standard error.
The GDF15 cytokine is secreted upon metabolic stress; therefore, the serum GDF15 levels were measured in patient samples using an ELISA assay. We first compared the metabolic parameters, including body mass index, lipid profiles, and liver enzymes, between the control group and PTC patients, since previous reports suggested that GDF15 level increases due to metabolic stress (28). The mean GDF15 level was significantly higher (threefold) in the PTC group than in the controls, although there were no significant differences between metabolic parameters of the groups (Supplementary Table S3 and Fig. 2D). GDF15 levels were significantly higher in patients with tumors larger than 2 cm than in those with tumors smaller than 2 cm (Fig. 2E). Furthermore, the mean GDF15 level was also higher in the lymphovascular invasion group than in the controls (Fig. 2F). Interestingly, the patients in the recurrent group had significantly higher GDF15 serum levels than those without recurrence (Fig. 2G). We further analyzed the relationships between clinicopathologic parameters and serum GDF15 levels in PTC patients. The median GDF15 level was 389.5 pg/mL in PTC patients, and the patients were divided into high GDF15 and low GDF15 groups based on this median (Supplementary Table S4). High GDF15 levels were significantly associated with several metabolic parameters, including old age (p < 0.001), high body mass index (p = 0.010), and elevated fasting glucose (p = 0.006). In addition to the metabolic parameters, serum GDF15 levels were also significantly associated with tumor size (p = 0.046), lymphovascular invasion (p = 0.029), and lateral LN metastasis (p = 0.002) (Supplementary Table S5). GDF15 was significantly positively correlated with tumor size and age, but other metabolic parameters were not related with GDF15 levels. Additionally, we compared metabolic parameters (including age, body mass index, cholesterol, triglycerides, and fasting glucose) in relation to LN metastasis (LN meta + group vs. LN meta − group), capsular invasion group (capsular invasion group + group vs. capsular invasion − group), and primary tumor size (tumor size >2 cm group vs. tumor size ≤2 cm group). There was no significant correlation of metabolic parameters in relation to clinicopathologic parameter. Thus, correlation of GDF15 with metabolic parameters of the patients may be an epiphenomenon. To calculate the sensitivity and specificity of biomarkers, conventional receiver operating characteristic (ROC) curves were generated and the area under the curve (AUC) was calculated by MedCalc (version 19). The optimal cutoff value was determined as the point at which the Youden index was maximized by the ROC curve. The AUC for GDF15 was 0.749 (p = 0.014) based on a 587.6 pg/mL cutoff in the ROC curve for the recurrence in patients (sensitivity: 66.67, specificity: 81.51). Next, we regrouped the patients based on a ROC curve generated using the GDF15 value as the recurrence predictive value (Supplementary Table S6). The recurrence predictive GDF15 level was 587.6 pg/mL in the PTC patients, and the high GDF15 group was associated with old age (p < 0.001), tumor size (p = 0.001), lateral LN metastasis (p = 0.001), and locoregional recurrence (p < 0.001).
GDF15 level is associated with the levels of mitochondrial stress response-related genes and tumor aggressiveness based on TCGA data and CNUH cohort
Given the elevated GDF15 expression in the thyroid cancer tissue samples, we investigated the roles of GDF15 using transcriptomics analysis to compare the features of tumor samples and paired normal samples from eight PTC patients from CNUH. We mapped the read counts using TopHat analysis. The fragment counts reflect the mRNA levels, and more than 90% of the fragments fell under the mRNA category. GDF15 was among the significantly upregulated genes in the tumor samples relative to its levels in the samples from the normal CNUH cohort (Supplementary Fig. S2). GDF15 expression was significantly upregulated (fourfold) in tumor samples relative to its level in the normal samples from the CNUH cohort (Supplementary Fig. S2B, C). Based on the results of our in vitro experiments (i.e., the observed association between mitochondrial stress and GDF15 expression and the immunohistochemical results obtained from human samples), we investigated the relationship between GDF15 expression and the expression levels of mitochondrial stress response-related genes using data from TCGA database and CNUH cohort (Supplementary Fig. S3). As expected, LONP1, HSPD1, ATF4, and CHOP expression levels were significantly correlated with the GDF15 expression level (Supplementary Fig. S3B) in TCGA database, and LONP1 expression was significantly correlated with GDF15 expression in CNUH cohort (Supplementary Fig. S2D). However, other genes were not correlated, and these results may be related to the small sample size (n = 8, Supplementary Fig. S2E). Upon comparison of transcriptomics data from tumor and normal samples from PTC patients in TCGA cohort, GDF15 was also upregulated, as the CNUH cohort (Fig. 3C). mRNA expression of GDF15 was also upregulated compared with normal sample by RT-PCR (quantitative real-time reverse transcriptase–polymerase chain reaction) (Supplementary Fig. S3C). Next, we compared clinicopathologic findings with GDF15 levels using TCGA cohort (Table 3). We determined the high GDF15 group and the low GDF15 group based on the median value of GDF15 in TCGA database. High GDF15 expression was correlated with T3–T4 stage, extrathyroidal extension, LN metastasis, and BRAFV600E mutation (Table 3). Univariate and multivariate analyses using stepwise logistic regression were also conducted (Table 4). The multivariate analysis using stepwise logistic regression showed that high GDF15 expression was an independent risk factor for LN metastasis and presence of BRAFV600E mutation (Table 4).
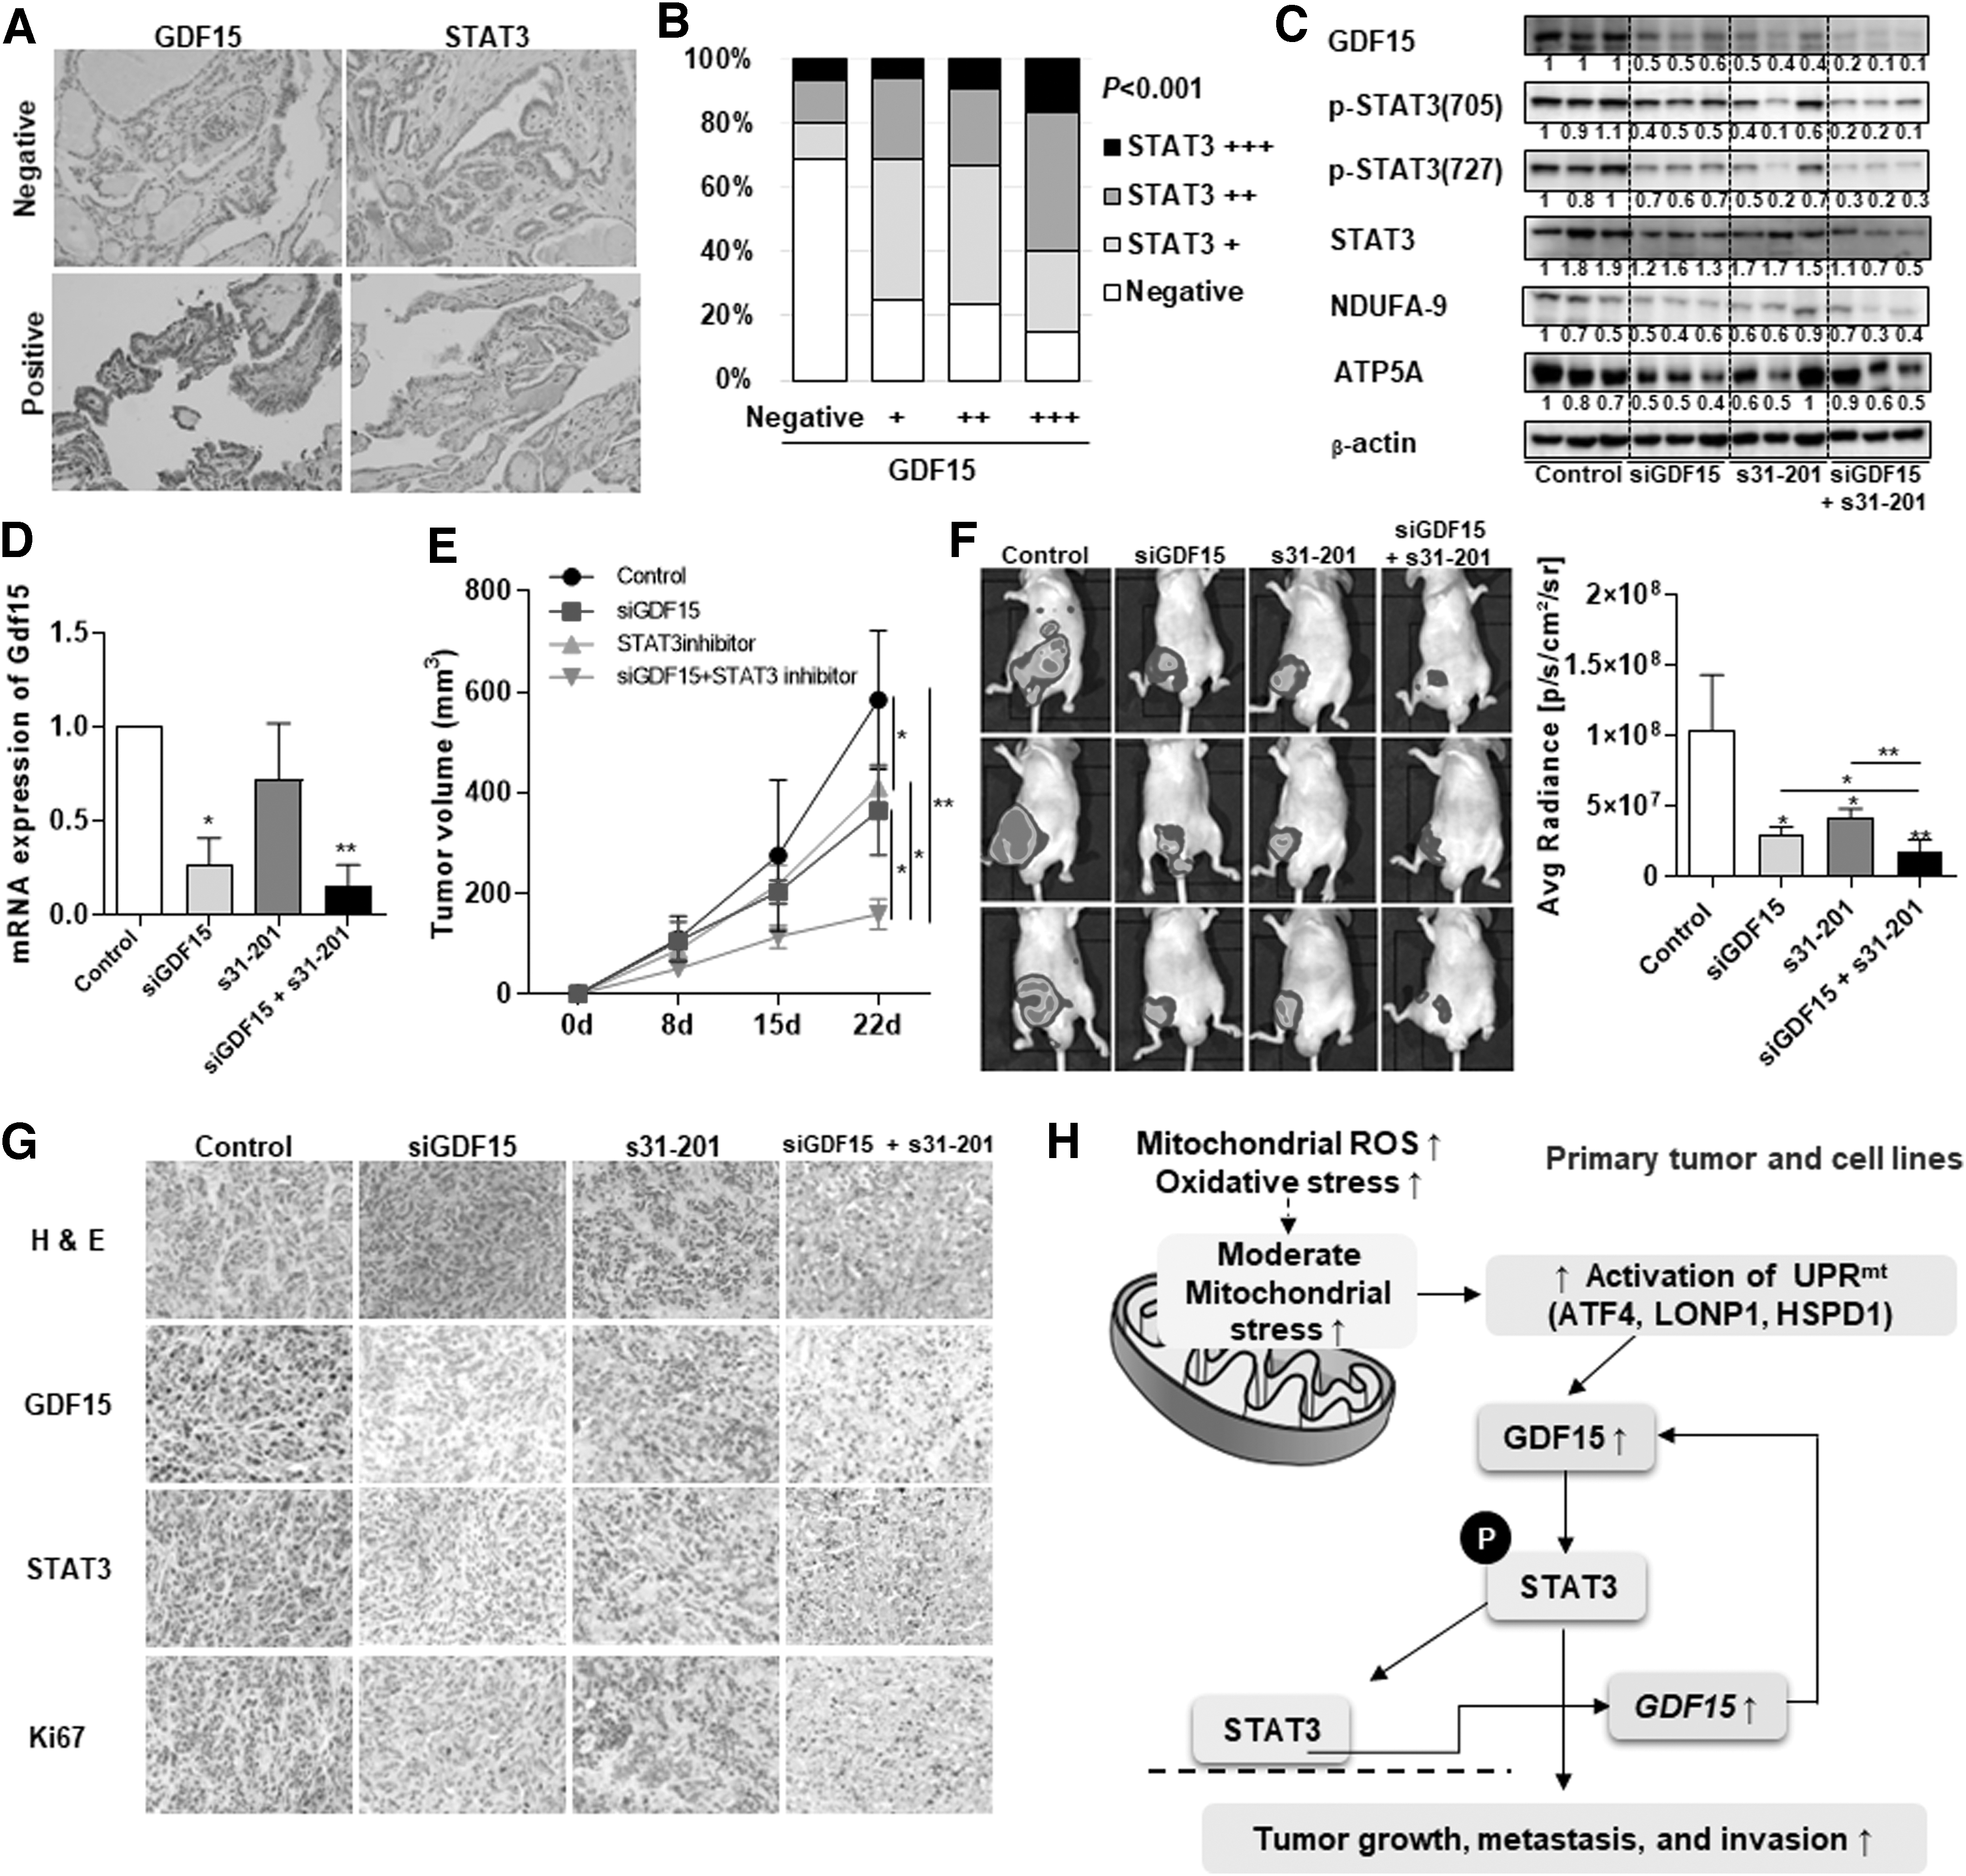
Effects of targeting the GDF15-STAT3 positive feedback loop in thyroid cancer. (
Comparison of Clinicopathologic Findings in Relation to GDF15 mRNA Expression Level in the Cancer Genome Atlas Thyroid Cancer Cohort
p-Values from unpaired t-tests for continuous parametric variables and the Mann–Whitney U test for nonparametric variables. The chi-square test and Fisher's exact test were used to evaluate the significance of the correlations of GDF15 expression with clinical and pathological parameters. TNM classification from the AJCC seventh edition was used.
p < 0.05 between the two categories for a given variable.
Multivariate Logistic Regression Analysis of Factors Associated with GDF15 in 505 Patients in The Cancer Genome Atlas Database
Cox proportional hazard regression analysis was performed to calculate HR and CI for each covariable. The final multivariate model was based on a stepwise method for clinical factors associated with GDF15 expression in univariate models.
p < 0.05 between the two categories for a given variable.
To investigate the variations in gene expression profiles based on GDF15 expression, we compared the transcriptomics data between the high GDF15 expression group and the low GDF15 expression group. Significantly upregulated genes and downregulated genes based on a ≥2-fold cutoff and FDR-adjusted p-value <0.05 were used to analyze the Gene Ontology (GO) pathway (Supplementary Fig. S3D). The GO analysis revealed upregulation of diverse pathways linked to tumor aggressiveness, including positive regulation of vascular endothelial growth factor production, acute inflammatory response, positive regulation of angiogenesis, positive regulation of vascular development, and regulation of ERK. To identify the primary transcriptional regulators of GDF15, we used ingenuity pathway analysis (IPA). The IPA revealed associations between GDF15 and ERK, p38MAPK, and SMAD4, and these factors are well known to be related to GDF15 expression (21). Importantly, we found that STAT3, EHF, and IRF5 were likely to be upstream regulators of GDF15 (Supplementary Fig S3E). GDF15, LONP1, and STAT3 were significantly increased in tumor group of CNUH and TCGA (Supplementary Fig. S3F). Furthermore, LONP1 and STAT3 were upregulated in TCGA GDF15-high group compared with TCGA GDF15-low group. These results suggest that GDF15 is associated with UPRmt and STAT3 in thyroid cancer.
GDF15 knockdown reduced thyroid tumor cell growth, migration, and invasion via an effect on STAT3 phosphorylation
Given the elevated GDF15 expression in thyroid cancer tissue samples and its higher serum levels in PTC patients, we investigated the roles of GDF15 in the viability and migration of thyroid cancer cells. Treatment with the targeting siRNA led to a significant reduction in GDF15 expression in both BCPAP and TPC-1 cells (Supplementary Fig. S4A, B). GDF15 knockdown significantly decreased the viability of BCPAP and TPC-1 cells (Supplementary Fig. S4C, D). Furthermore, GDF15 knockdown significantly decreased the migration and invasion of both cell lines relative to the effects of the scrambled siRNA control (Supplementary Fig. 4E, F).
To evaluate the functional regulatory role of GDF15 in carcinogenesis, we investigated whether GDF15 regulation affected STAT3 and ERK signaling in thyroid cancer cells. We measured the levels of STAT3, phospho-STAT3(750), phospho-STAT3(727), ERK, and phospho-ERK via Western blot analysis (Supplementary Fig. S4G, H). The levels of STAT3 and ERK phosphorylation decreased significantly in both BCPAP and TPC-1 cells with GDF15 knockdown compared with the levels in the control cells (Supplementary Fig. S4G, H). Furthermore, the levels of phosphorylated SMAD family proteins (including SMAD2 and SMAD3), which are involved in well-known signaling pathways related to GDF15, were much lower in cells transfected with GDF15 siRNA than in the control cells (Supplementary Fig. S4I, J). We also investigated the effects of GDF15 on the 8505c and FRO anaplastic thyroid cancer cell line (Supplementary Fig. S5). The effects of GDF15 knockdown in the differentiated thyroid cancer cell lines and the 8550C and FRO cell lines were similar (Supplementary Fig. S5). Since our clinical data showed that the serum GDF15 levels were higher in PTC patients than in the controls, we investigated the effects of recombinant human GDF15 (rhGDF15) on cell viability and migration in thyroid cancer cells (Supplementary Fig. S6). rhGDF15 increased cell viability and migration in both BCPAP and TPC-1 cells. Moreover, rhGDF15 increased the phosphorylation of STAT3, SMAD2, and ERK (Supplementary Fig. S6). These results demonstrate that GDF15 can activate STAT3 signaling as well as stimulate ERK phosphorylation and SMAD signaling in thyroid cancer cells.
STAT3 regulates GDF15 expression in thyroid cancer and combination treatment targeting GDF15 and STAT3 significantly reduced thyroid tumor cell growth
STAT3 is activated in response to receptor stimulation, and its activation in the nucleus regulates gene expression. Active STAT3 is associated with mitochondrial function (29). Based on the results of our IPA, we hypothesized that STAT3 may be the primary upstream regulator of GDF15. Furthermore, knockdown of STAT3 in both BCPAP and TPC-1 cells resulted in decreased levels of GDF15 mRNA (Supplementary Fig. S7A, B). TPC-1 treated with interleukin (IL)-6, the cytokine inducing STAT3 activation, induced a significant increase of GDF15 expression (Supplementary Fig. S7C). A STAT3 DNA binding site was found in the GDF15 promoter region via the UCSC genome browser. We identified the STAT3-binding site on GDF15 promoter and created point mutation of STAT3-binding site on GDF15 promoter (Supplementary Fig. S7D). We measured the luciferase activity induced by the human GDF15 promoter in TPC-1 cells transfected with hGDF15(−1739/+70)-Luc cultured with or without IL-6 (100 ng/mL) for three hours. The STAT3-response element was important for relative luciferase activity of GDF15 in IL-6-activated condition (Supplementary Fig. S7E). This observation suggests that STAT3 plays a critical role in GDF15 expression in thyroid cancer cells. The GDF15 expression levels in thyroid cancer cells treated with STAT3 inhibitor or STAT3 knockdown were significantly lower than those in the control cells (Supplementary Fig. S7F, G). Next, we examined whether the downstream BRAF and RET/PTC1 pathways, including the ERK 1/2 pathways, are regulated by STAT3 in thyroid cancer cells, as high GDF15 expression was significantly associated with the BRAFV600E mutation in PTC patients. STAT3 knockdown reduced the effects of rhGDF15 in thyroid cancer cells, as indicated by downregulation of ERK phosphorylation (Supplementary Fig. 7H). Thus, our data suggest a new regulatory mechanism of GDF15 by STAT3, which also enhanced STAT3 phosphorylation. To evaluate the effects of targeting the GDF15-STAT3 signaling axis in thyroid cancer, cell viability and migration assays were performed in BCPAP and TPC-1 cells treated with STAT3 inhibitor and siRNA targeting GDF15 and cells treated with each reagent individually (Supplementary Fig. S7I, J). Interestingly, combined treatment with STAT3 inhibitor and siGDF15 significantly decreased the viability and migration of BCPAP and TPC-1 cells compared with the effects of treatments with each reagent individually (Supplementary Fig. S7I, J). Furthermore, similar experiments with 8505C anaplastic thyroid cancer cells gave similar results (Supplementary Fig. S8).
We next evaluated the link between GDF15 and STAT3 in human thyroid cancer tissue samples, and we found that high-GDF15 tumors also had high STAT3 expression, whereas low-GDF15 tumors had low STAT3 expression (Fig. 3A). Additionally, there was a significant relationship between GDF15 expression and STAT3 expression (Fig. 3B). Finally, we tested the effects of simultaneously targeting both GDF15 and STAT3 signaling using nude mice injected with FRO-luciferase-expressing cells. Combined inhibition of both GDF15 and STAT3 decreased not only GDF15 and STAT3 phosphorylation but also NDUFA-9 expression (Fig. 3C). GDF15-knockdown adenovirus treatment of nude mice injected with FRO-luciferase-expressing cells revealed a significant decrease in GDF15 expression in the tumor tissues (Fig. 3D). Treatment with both the GDF15-knockdown adenovirus and the STAT3 inhibitor led to decreased tumor volume compared with the control group (Fig. 3E, F). In particular, combined targeting of both GDF15 and STAT3 significantly reduced tumor volume (Fig. 3E, F). In tumor tissues of xenograft mice, treatment with both the GDF15-knockdown adenovirus and the STAT3 inhibitor led to substantial decrease of GDF15, STAT3, and Ki-67 expression by immunohistochemical analysis (Fig. 3G). These findings suggest that the GDF15-STAT3 signaling axis may have a pivotal role in the regulation of tumor progression since the mitochondrial stress-induced UPRmt and GDF15 activated tumor progression via STAT3 phosphorylation and STAT3 positively regulate GDF15 expression in thyroid cancer cells (Fig. 3H).
Discussion
Recent studies have revealed that mitohormesis plays a tissue-protective role by regulating moderate mitochondrial stress in several diseases; however, few studies have explored the role of mitokine-induced mitohormesis in cancer. We found that moderate mitochondrial stress exists in thyroid cancer and that this stress can stimulate the production of the mitochondrial stress-induced cytokine (or mitokine) GDF15, which then regulates tumorigenesis.
Our data suggest that GDF15, a factor secreted in response to mitochondrial stress, acts non-cell autonomously to regulate systemic homeostasis. Furthermore, we also found the importance of the UPRmt, which is induced by moderate mitochondrial stress (10). To maintain mitohormesis, mitochondrial proteostasis is regulated by various chaperones and proteases (30). This regulation leads to increased levels of unfolded proteins and proteotoxicity, thereby activating a retrograde stress response known as the UPRmt, which is characterized by the upregulation of chaperones such as HSPD1 and the CLPP matrix protease (31). Recent evidence suggests that mitohormetically primed cancer cells are more metastatic and that mitohormesis in cancer cells results in persistent activation of UPRmt and reduced oxidative stress (14,32,33). Elevated UPRmt activation in breast cancer patients leads to significantly reduced survival, and a transcriptome analysis of UPRmt-high patients showed simultaneous activation of prometastatic programs and the global cytoprotective effects of mitohormesis (14). Recently, gene expression profiling identified GDF15 as a potential molecular marker in PTC (34). However, no studies have explored the relationship between the UPRmt and mitokines in thyroid cancer. We hypothesized that moderate mitochondrial stress exists and that it influences tumor cell viability in differentiated thyroid cancer. We found that doxycycline treatment in thyroid cancer cell lines activated the UPRmt, as reflected by elevated expression levels of HSPD1, LONP, and ATF4 and higher GDF15 secretion. Furthermore, the expression levels of UPRmt genes were significantly positively correlated with GDF15 expression in TCGA database data. Data from both TCGA database and the CNUH cohort showed that GDF15 expression was significantly related to diverse clinicopathologic features linked to tumor aggressiveness. Our results reveal that mitochondrial stress response and GDF15, a mitokine induced by mitochondrial stress, promoted tumor aggressiveness in differentiated thyroid cancer.
In cancer biology, GDF15 is reported to have important roles in diverse cellular processes, such as proliferation, migration, inflammation, metabolism, and DNA damage response (35 –37). Recent studies identified GDF15 as an abundant plasma cytokine with immunosuppressive roles in the modulation of macrophage infiltration, osteoclast differentiation, and immune surveillance in diverse disease (38 –41). GDF15 expression is tightly associated with conditions of stress or damage in tissue, highlighting its roles in tissue regeneration or healing, as documented in numerous cases, including mitochondrial disease (21,42 –44). The level of circulating GDF15 was recently suggested to be a predictive biomarker for recurrence or survival in several types of cancer; however, most human studies were observational and focused on the relationships between serum GDF15 level and several clinicopathologic parameters (45 –48).
To identify the underlying mechanism of the involvement of GDF15 in thyroid cancer, we focused on the secretion and regulation of GDF15 in tumor cells as well as on the signaling pathways regulated by GDF15. We investigated whether mitochondrial dysfunction and the unfolded protein response induce GDF15 expression, and whether its expression was associated with tumor aggressiveness. We discovered that GDF15 expression is associated with reduced mitochondrial function in thyroid cancer, and these novel findings might provide an explanation for the elevated serum GDF15 levels in cancer patients.
Our transcriptomic and immunohistochemical analyses also established that GDF15 upregulation can promote tumor cell viability, migration, and invasion via upregulation of STAT3 phosphorylation. Notably, we found that STAT3 regulates the transcriptional level of GDF15 in tumors. Combined treatment with a STAT3 inhibitor and GDF15 knockdown resulted in significantly reduced tumor formation, migration, and invasion accompanied by decreased STAT3 and ERK phosphorylation, suggesting that GDF15-STAT3 signaling plays a crucial role in mitochondrial stress-induced thyroid cancer cell progression. Although a previous study in a muscle fiber damage model also demonstrated that activated STAT3 regulates GDF15 at the transcriptional level via binding to a cis DNA element in the GDF15 promoter sequence (49), there are no previous reports of a GDF15-STAT3 positive feedback loop in tumorigenesis. Interestingly, mitochondrial STAT3 has been suggested to be a modulator of cellular metabolism, including glycolysis and mitochondrial respiration (50). Therefore, our observation of the upregulation of STAT3 signaling by GDF15 upon UPRmt activation suggests that STAT3 phosphorylation might represent a compensatory signal to maintain mitohormesis and to rescue the reduced OxPhos capacity; however, we could not validate the mitochondrial function via GDF15 treatment.
Our study has several limitations. We measured serum level of GDF15 in patients with thyroid cancer at the time of initial diagnosis. To support our concept of serum GDF15 level as a predictive biomarker in thyroid cancer, further studies that investigate the serum level of GDF15 in patients with thyroid cancer are necessary (initial diagnosis, after thyroidectomy, stable disease status, and recurrence status).
In thyroid cancer, dysfunctional mitochondria in cancer cells might lead to upregulation of the UPRmt. UPRmt results in the increase of GDF15, which might promote disease progression with increased STAT3 phosphorylation. Furthermore, STAT3 also regulates GDF15 transcription. Our data indicate that thyroid cancer cells exploit increase of UPRmt and GDF15 by stressed mitochondria to promote tumor progression in thyroid cancer.
Footnotes
Author Disclosure Statement
No competing financial interests exist.
Funding Information
This research was supported by the National Research Foundation of Korea (NRF) funded by the Ministry of Science, ICT, and Future Planning (NRF-2017R1D1A1B03027820, NRF-2019R1H1A2079938, NRF-2019R1A2C1084125, NRF-2017R1A5A2015385), the Global Research Laboratory (GRL) Program through the National Research Foundation of Korea (NRF) funded by the Ministry of Science and ICT (No. NRF-2017K1A1A2013124), and the Korea Science and Engineering Foundation (KOSEF) grant funded by the Korea government (MOST) (No. 2019M3E5D1A02068560). This work was supported by Chungnam National University Hospital Research Fund, 2015.
Supplementary Material
Supplementary Data
Supplementary Table S1
Supplementary Table S2
Supplementary Table S3
Supplementary Table S4
Supplementary Table S5
Supplementary Table S6
Supplementary Figure S1
Supplementary Figure S2
Supplementary Figure S3
Supplementary Figure S4
Supplementary Figure S5
Supplementary Figure S6
Supplementary Figure S7
Supplementary Figure S8