
Abstract
Background:
The frequency of overweight (OW) and obese (OB) children has increased worldwide, particularly in economically developed countries. No studies have been conducted to verify whether the increasing frequency of OW and obesity in schoolchildren may affect the evaluation of iodine nutritional status in populations. The aim of this study was to verify whether urinary iodine concentration (UIC), thyroid volume (TV), and thyroid hypoechoic pattern may be affected by body mass index (BMI) in schoolchildren.
Methods:
The children included in this study (aged 11–13 years) were a part of the schoolchildren recruited in the second nationwide survey (period 2015–2019) conducted in Italy to monitor by law (Atto di Intesa Stato-Regioni February 26, 2009) the nationwide iodine prophylaxis program. Specifically, 1281 schoolchildren residing in iodine-sufficient areas (IS group) and 384 children residing in a still mildly iodine-deficient area (ID group) were recruited between January and March 2015 in the first-degree secondary state schools. In all the children, spot UIC was measured, thyroid ultrasound was performed to evaluate TV, and hypoechogenicity was assessed to indirectly evaluate iodine-associated thyroid autoimmunity.
Results:
The frequency of OW, OB, and adequate weight (AW) children was similar in the IS and ID groups at any age. After adjusting for sex and age, the regression analysis showed lower UIC values in OB children than in AW children of the IS group (beta coefficient = −34.09 [95% confidence interval −65.3 to −2.8]), whereas no significant differences were observed in the ID group. In both the IS and ID groups, the distribution of TV in AW children was significantly shifted toward lower values in comparison to the distribution of OB children (p < 0.001 in the IS group; p = 0.012 in the ID group). Furthermore, the frequency of thyroid hypoechogenicity was higher in the ID group than in the IS group (10.9% vs. 6.6%, p = 0.005); however, in both groups, it was significantly lower in AW children than in OB children (p < 0.01).
Conclusions:
This study for the first time demonstrates that BMI may be a confounding factor in monitoring iodine nutritional status in schoolchildren. Since in Italy as in other Western countries the number of OW and OB children is high, BMI is a factor to consider in monitoring salt iodization programs worldwide.
Introduction
Iodine is necessary for the synthesis of thyroid hormones, which are essential for normal growth, development, and metabolism throughout life. The most damaging effect of iodine deficiency is the inadequate thyroid hormone supply to the developing brain. Even mild iodine deficiency during early pregnancy may be associated with an adverse effect on child cognitive development (1).
To eradicate iodine deficiency disorders, the World Health Organization (WHO) recommended universal salt iodization (USI) as the preferred strategy (2). Voluntary or mandatory programs of salt iodization have been implemented in many countries, and the last report of Iodine Global Network reported that iodine intake was adequate in 134 countries, inadequate in 21 countries, and excessive in 13 countries (3).
In many countries, the improvement in iodine nutrition has decreased the rates of thyroid diseases such as goiter and hypothyroidism. However, an increased rate of chronic autoimmune thyroiditis has been reported in some countries with long-lasting USI programs and in populations exposed to more than adequate (median urinary iodine concentration [UIC] 200–299 μg/L) or excessive iodine intake levels (median UIC ≥300 μg/L) (4 –6), whereas the exposure to adequate iodine intake (median UIC 100–199 μg/L) does not seem to be associated with significant thyroid autoimmunity (7 –9).
Salt iodization programs, such as any other health interventions, therefore require an effective monitoring system to ensure that the prevention program is working as planned and to prompt corrective actions in the case of inadequate or excessive iodine supply. As suggested by the WHO (10), the challenge is to apply indicators using valid and reliable methods while keeping costs to a minimum.
The median urinary iodine is the main indicator to assess current iodine status of a population (10), whereas goiter assessment by thyroid ultrasound (US) in schoolchildren is an indicator of a long-lasting iodine intake in a population. In fact, it has been demonstrated that iodine prophylaxis is able to prevent the development of goiter in children born after the implementation of iodized salt and to control thyroid enlargement in older children, although it is less effective in reducing goiter size in children exposed to iodine deficiency in the first years of life (11). However, the prevalence of goiter in monitoring iodine status in populations may be difficult to estimate because of the lack of consensus on international reference values for thyroid volume (TV) (12,13).
The assessment of thyroid hypoechogenicity on US has also been proposed as an indirect indicator of thyroid autoimmunity in epidemiological studies conducted to evaluate the iodine nutritional status in schoolchildren (8,9). Since the amount of colloid within the follicles determines the echogenicity of the thyroid parenchyma on US, the lower the amount of colloid resulting from both lymphocytic infiltration and disruption of normal tissue architecture, the more hypoechoic the thyroid will appear on US (14 –18). It is important to emphasize that hypoechogenicity is often the only finding in the initial phases of autoimmune thyroiditis and may be present even before detection of serum antithyroid autoantibodies (19). Recent studies conducted in overweight (OW) and obese (OB) children, as well as in adult subjects, have shown that OW and obesity are associated with changes in thyroid structure and function, which seem to be unrelated to thyroid autoimmunity and iodine deficiency (20 –23). Particularly, it has been demonstrated that a thyroid hypoechoic pattern on US has a poor diagnostic accuracy in OB subjects (23), whereas other studies have reported an increased TV in OB adults and children (22,24,25).
The frequency of OW and OB children has increased worldwide, particularly in economically developed countries (26). In Italy, the prevalence of childhood OW and obesity was estimated at 22.5% and 9.3%, respectively, with a strong regional North–South gradient (27,28). To the best of our knowledge, no studies have been conducted to verify whether the increasing frequency of OW and obesity in schoolchildren may affect the evaluation of iodine nutritional status in populations. The aim of this study was to verify whether UIC, TV, and hypoechoic pattern may be affected by body mass index (BMI) in schoolchildren aged 11–13 years, usually recruited to monitor the iodine prophylaxis program in our country.
Materials and Methods
Subjects
The children included in this study were a part of the schoolchildren recruited in the second nationwide survey (period 2015–2019) conducted by the Italian National Observatory for Iodine Prophylaxis (OSNAMI) to monitor by law (Atto di Intesa Stato-Regioni, February 26, 2009, at site
Study Cohort Characteristics of Children Residing in Iodine-Sufficient and Iodine-Deficient Areas
BAZ, body mass index-for-age Z-score; HAZ, height-for-age Z-score; ID, iodine deficient; IQR, interquartile range; IS, iodine sufficient; OB, obese; OW, overweight; SD, standard deviation; UIC, urinary iodine concentration; WAZ, weight-for-age Z-score.
In the group of children residing in IS areas (IS group), the median UIC value was 129 μg/L with no significant differences between rural and urban areas (128 and 133 μg/L, respectively). In the group of children residing in the ID area (ID group), the median UIC was 89 μg/L (only urban area).
Body weight (kg) and height (cm) were measured in all the children. BMI, expressed as kg/m2, was calculated with the formula: BMI = weight (kg)/height2 (m). As suggested by the Italian Society of Pediatric Endocrinology and Diabetology (ISPED), the classification of OW and obesity was performed on the thresholds identified as centiles corresponding to the 75th and 95th percentiles of ISPED 2006 charts, respectively (30). No underweight children, identified as children with BMI lower than the 5th percentile, were found in the IS and ID groups. Therefore, the recruited children were classified as adequate weight (AW), OW, or OB children. ISPED charts referring separately to Central North (for children from Liguria and Tuscany regions) and South Italy (for children from Sicily regions) were also used to calculate Z-scores (standard deviation [SD] scores) of height-for-age (HAZ), weight-for age (WAZ), and BMI-for-age (BAZ) in boys and girls (30). Z-scores were used to evaluate the anthropometric measurements of the recruited children of various ages and both sexes.
Body surface area (BSA), expressed as m2, was calculated according to the formula: weight (kg)0.425 × height (cm)0.725 × 71.84 × 10−4 (31).
An informed consent to take part in the study was obtained from all the children's parents.
Methods
Urinary iodine concentration
Morning spot urinary samples were collected in 1131 of the 1281 children recruited in the IS area, and in 334 of the 384 children recruited in the ID area. Samples were stored at −80°C until assessment. UIC was measured by using inductively coupled plasma mass spectrometry at the Chemical and Endocrinology Laboratory, Center for Mass Spectrometry of the University of Pisa (Pisa, Italy). An Agilent 7900 Inductively Coupled Plasma Mass Spectrometer was used to analyze the samples. All samples were analyzed using a 10 × dilution into a medium containing tetramethylammonium hydroxide (TMAH; ∼0.01%; Sigma–Aldrich, St. Louis, MO), Triton X-100 (∼0.001%; Sigma–Aldrich), and butanol (∼1.5%; Sigma–Aldrich). Samples were centrifuged after dilution. External validation of results was provided by inclusion of the certified reference material SRM 2670a. Results are expressed as μg/L.
Thyroid US
Thyroid US was performed with a 6–18 MHz linear transducer (LA 435). US examinations were performed by three trained physicians, one in each region. Before starting the study, the three operators participated in a calibration exercise to minimize interobserver variation.
The TV was calculated according to Brunn et al. (32). The volume of each lobe was calculated by applying the formula: TV (mL) = 0.479 × depth × width × length (cm). The total volume of thyroid gland was calculated by the sum of the volumes of both lobes (excluded isthmus) and expressed in milliliters (mL).
To determine the echogenicity of the thyroid, a visual analysis based on a gray scale was used. It consisted in comparing the parenchyma of the gland with adjacent structures and classifying them into one of the two categories: Normal echogenicity: echogenicity similar or slightly hypoechoic when compared with the submandibular gland, but hyperechoic compared with cervical muscles. Hypoechogenicity: moderately or markedly hypoechoic when compared with the submandibular gland or with similar echogenicity of the cervical muscles.
Statistical analyses
Continuous variables, including WAZ, HAZ, and BAZ, are expressed as the mean ± SD. Descriptive analyses were conducted on the collected data, and both parametric and nonparametric tests were applied for univariate data analysis (Median test, t-test). Before statistical testing, TV data were log-transformed to normalize the skewed distribution. In addition, the Spearman correlation coefficients were estimated to explore the relationship between TV and body weight, height, WAZ, HAZ, and BAZ in both the IS and ID groups. Differences in the median UIC and in thyroid echogenicity by BMI categories were evaluated by quantile regression and logistic regression, respectively, taking into account age and sex as covariates. Two-sample Kolmogorov–Smirnov test was applied to test the equality of TV distributions overall and by age and BMI categories. The 2.5th, 50th, and 97.5th percentiles, with related 95% confidence intervals [CIs], were estimated for TV overall and by the strata of age and BMI categories.
The Population Attributable Fraction (PAF) was calculated to estimate the impact of BMI on UIC, TV, and thyroid hypoechoic pattern, and the strength of associations was estimated by odds ratio (OR) with corresponding CI (33). UIC was categorized as ≥ or <100 μg/L, whereas TV was dichotomized as ≤ or > the value corresponding to the 97.5th percentile calculated in AW children at different ages in both the IS and ID groups. PAF was computed as follows: PAF = [p (RR −1)]/[1 + p (RR −1)], where p is the fraction of OW or OB children in the cohort and RR is the relative risk. RRs were replaced by ORs. ORs and PAFs were adjusted for sex when a confounding effect was identified (34).
Statistical analyses were conducted using Intercooled STATA for Windows (version 13.0; StataCorp, College Station, TX). A p-value <0.05 was considered significant.
Results
Auxological features of schoolchildren stratified by iodine nutritional status
In the IS and ID groups, boys and girls were equally distributed across the different ages (Table 1). The median height and body weight values were similar in the IS and ID groups at any age, as well as the frequency of OW and OB children (IS group: OW = 15.7%, OB = 6.2%; ID group: OW = 19.3%, OB = 8.6%) (Table 1). According to previous study (35), in both the IS and ID groups, the youngest children (aged 11 years) showed the highest frequency of OW when compared with the other age groups (IS group: OW = 21%; ID group: OW = 20.9%) (Fig. 1).
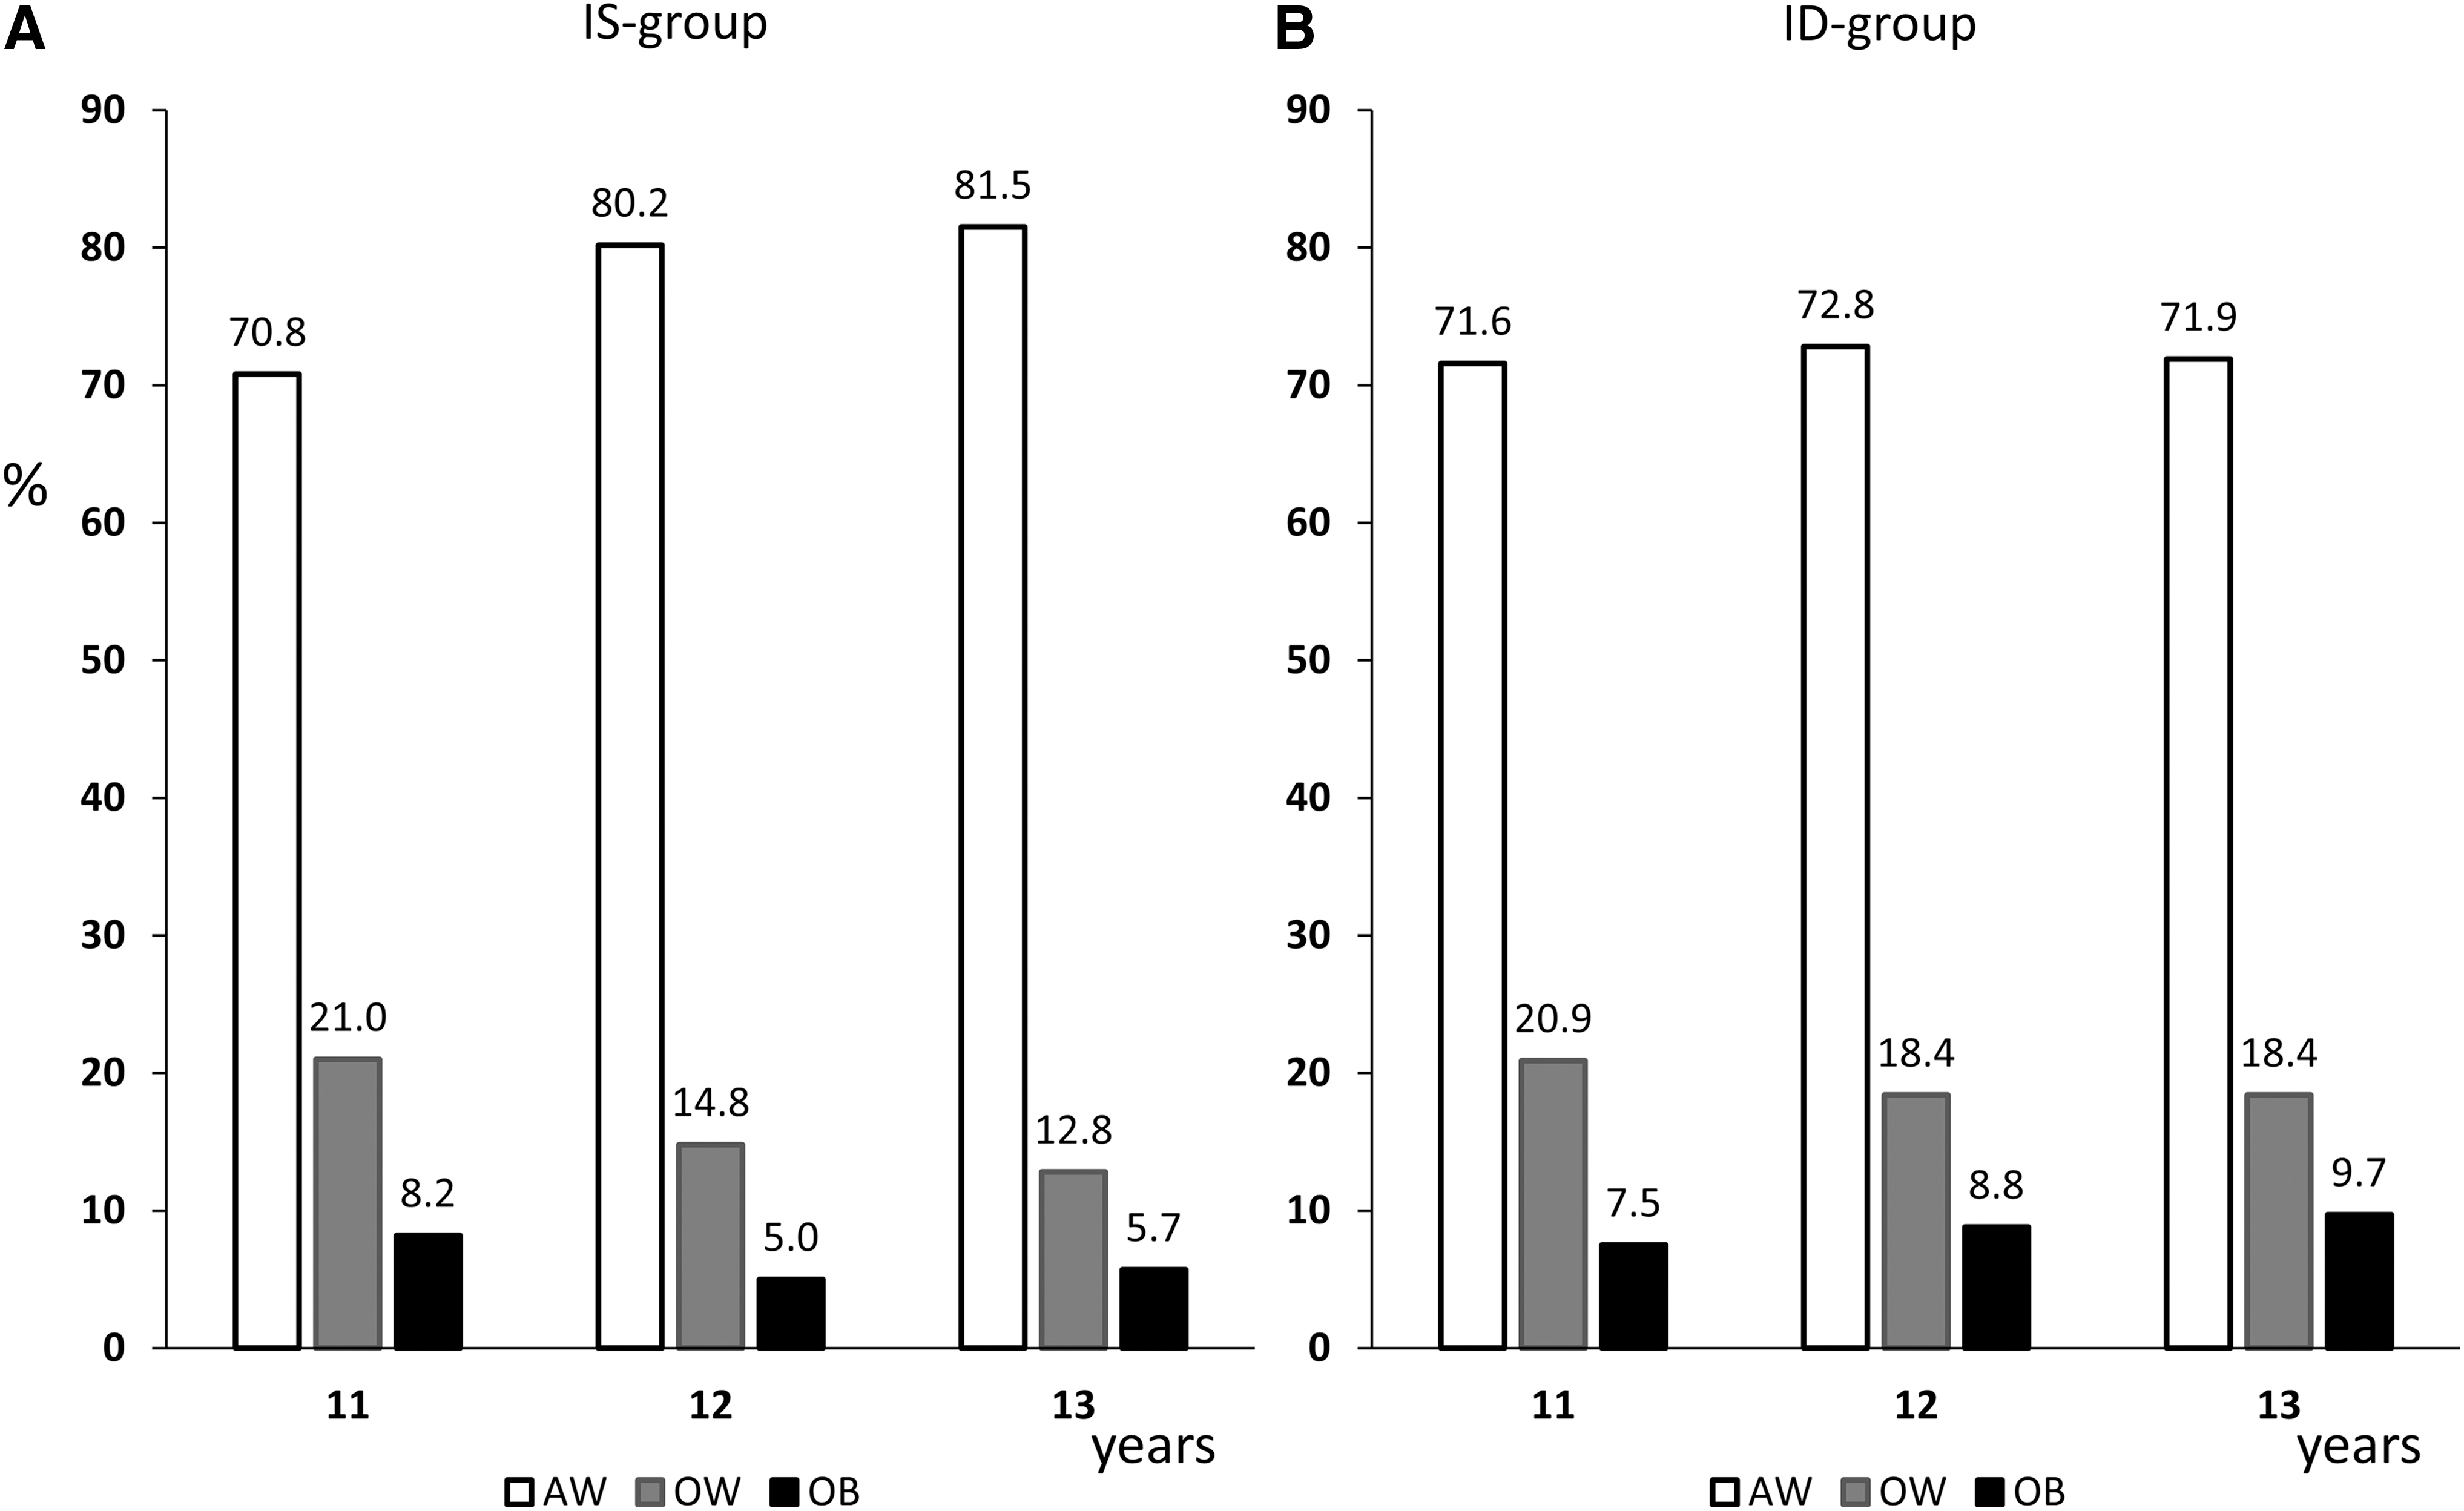
Percentages of AW, OW, and OB children stratified by age in the IS group (
BMI and UIC
Figure 2 shows the median UIC values in the IS and ID groups after stratifying by BMI categories (AW, OW, OB) and by sex. In the IS group (Fig. 2A), the median UIC was significantly lower in OB children than in AW children (102 vs. 135 μg/L, p = 0.02), whereas no significant difference was observed between OW and AW children (118 and 135 μg/L, respectively). The regression analysis after adjusting for age and sex confirmed lower UIC values in OB children than in AW children of the IS group (beta coefficient = −34.09 [CI −65.3 to −2.8]).
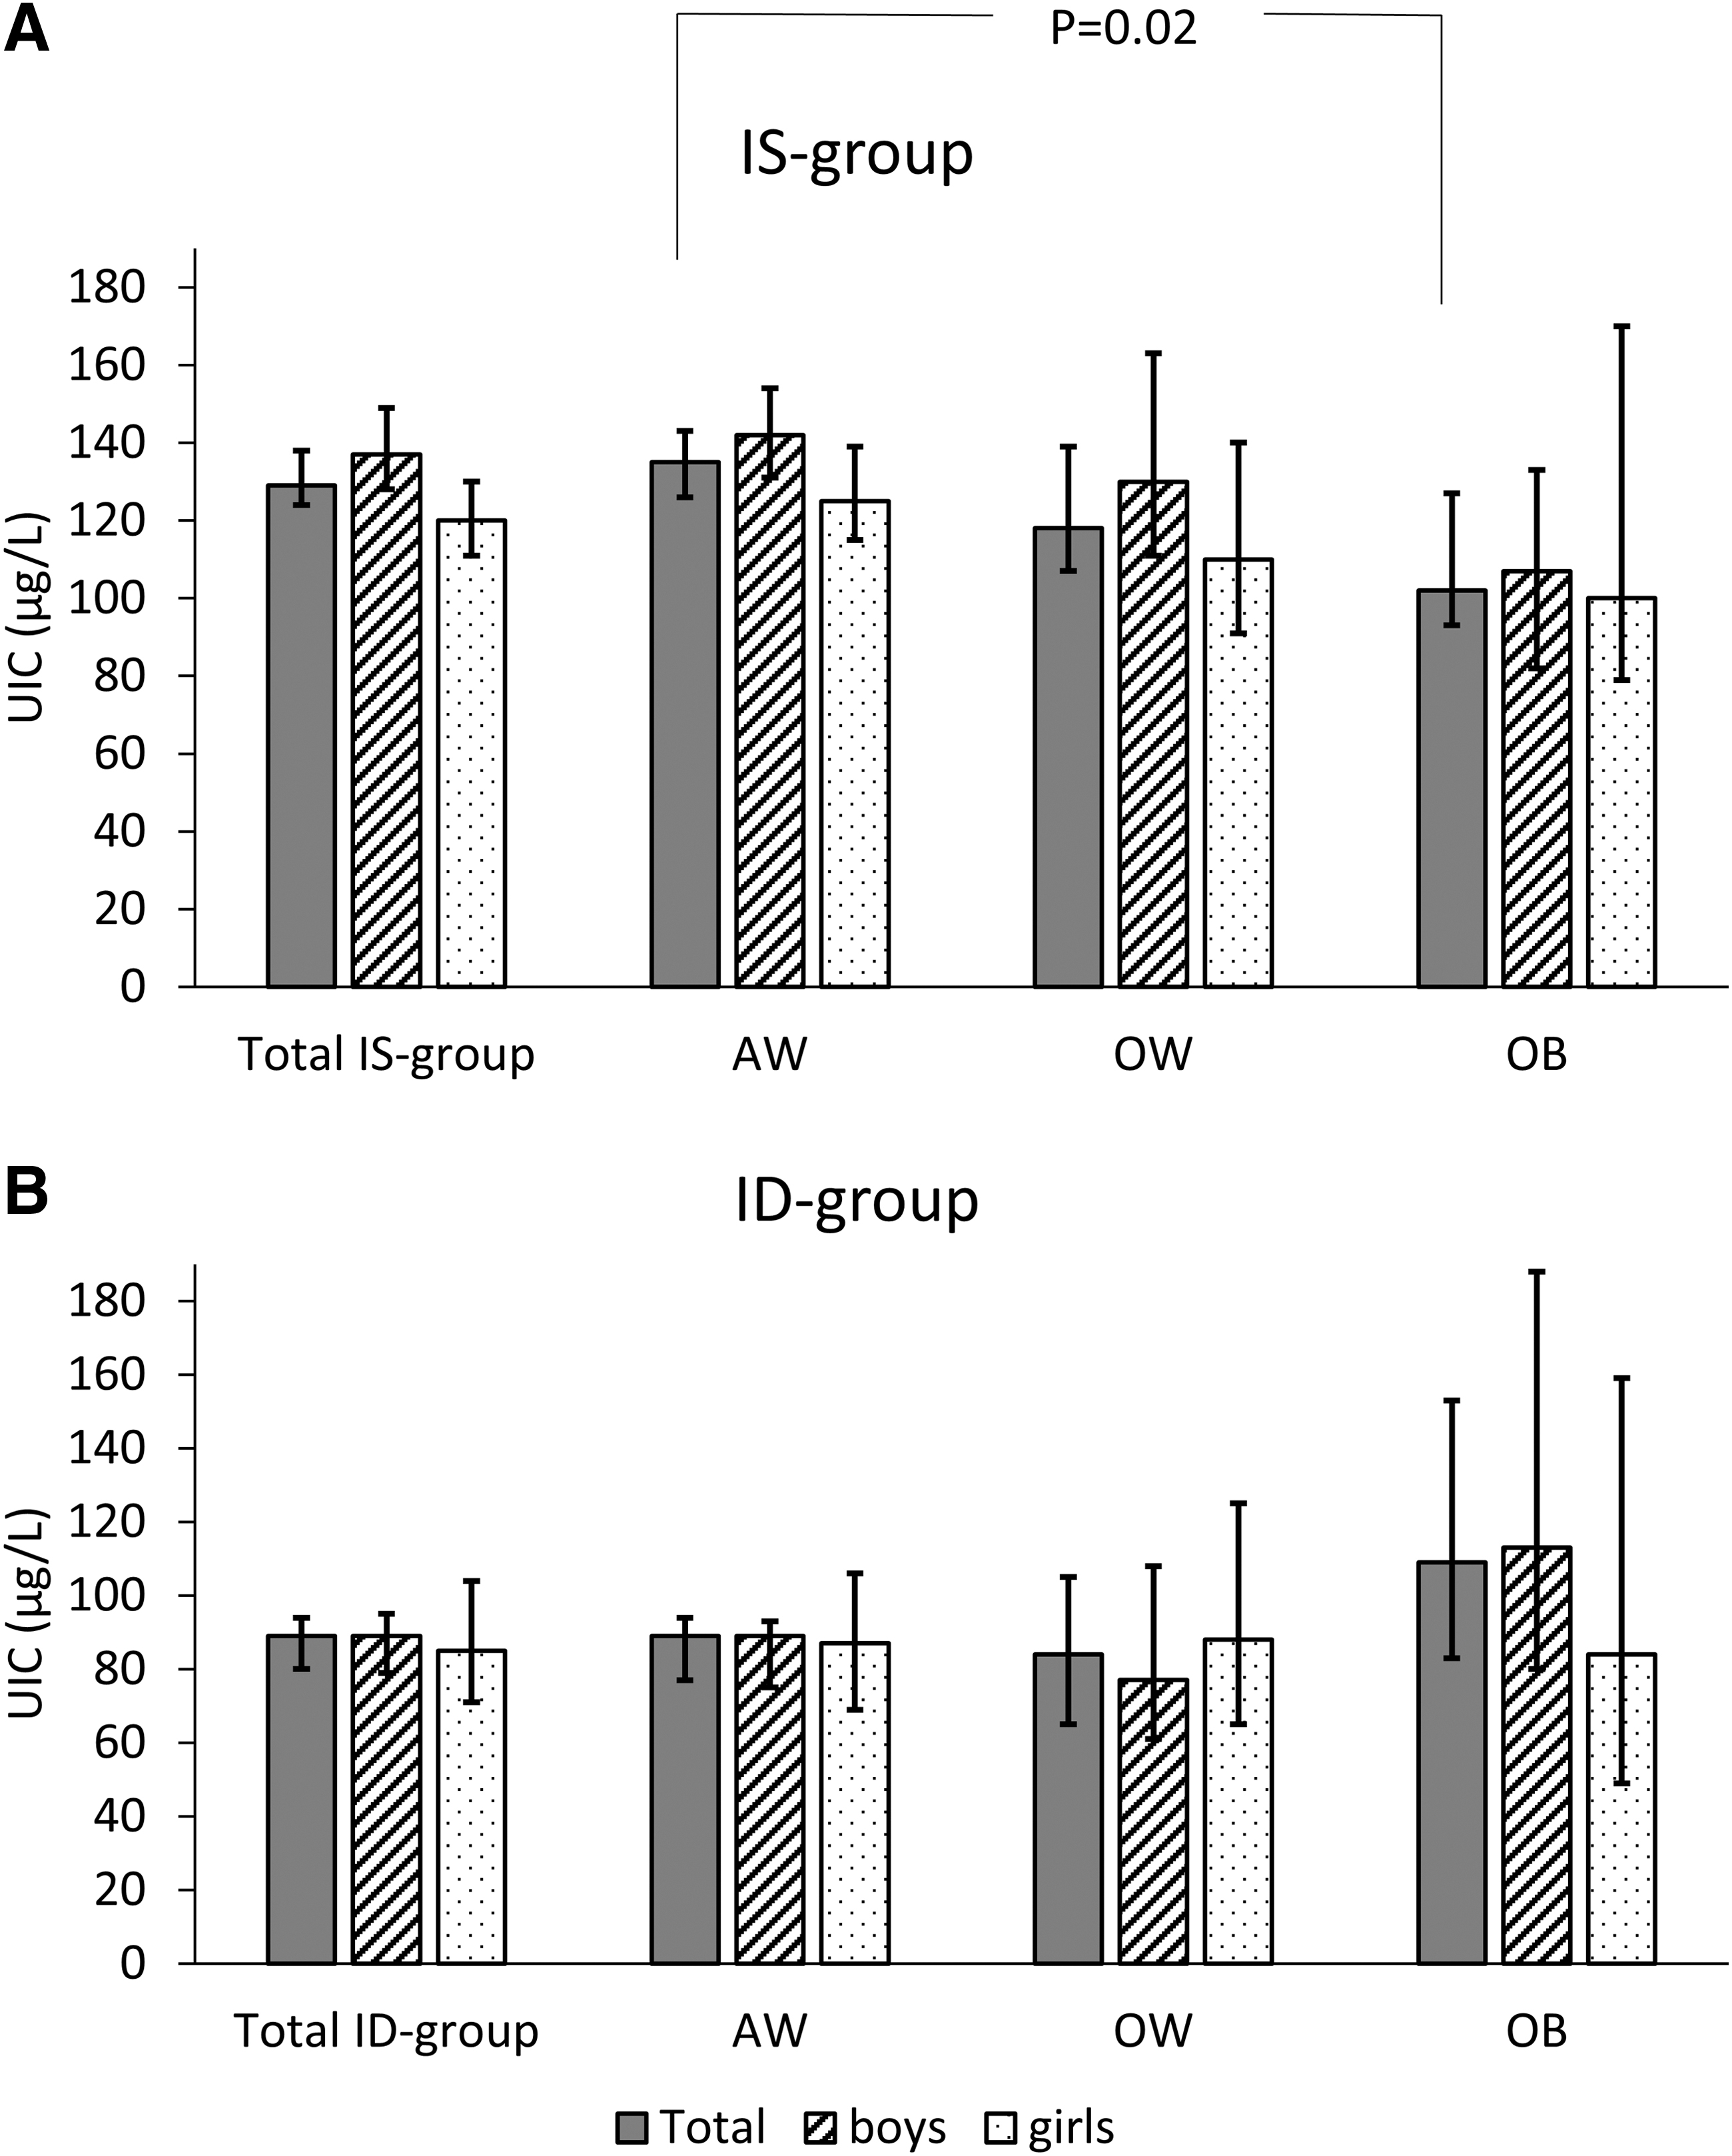
Median UIC values with 95% confidence interval error bars stratified by sex and BMI categories (AW, OW, OB) in the IS group (
In the ID group, no significant differences were observed in the median UIC values among the BMI categories and between boys and girls (Fig. 2B), although OB boys had a median UIC value indicative of iodine sufficiency (113 μg/L) and OB girls of iodine deficiency (84 μg/L).
BMI and TV
TV was positively associated (p < 0.01, Spearman correlation) with body weight, height, WAZ, HAZ, and BAZ in both the IS and ID groups. As expected, the mean TV values were significantly higher in ID children than in IS children at any age (Table 2), whereas significant differences of the mean TV values between boys and girls were observed at the age of 11 years (p < 0.05) in the IS and ID groups (Table 2). When the distributions of TV values in AW, OW, and OB children were compared, in both the IS and ID groups, the distribution of TV in AW children was significantly lower in comparison to the distribution of TV in OB children (p < 0.001 in the IS group; p = 0.012 in the ID group) (Fig. 3A, B). In the IS group, the distribution of TV in AW children was also significantly different from the distributions observed in OW children (p = 0.001) (Fig. 3A).
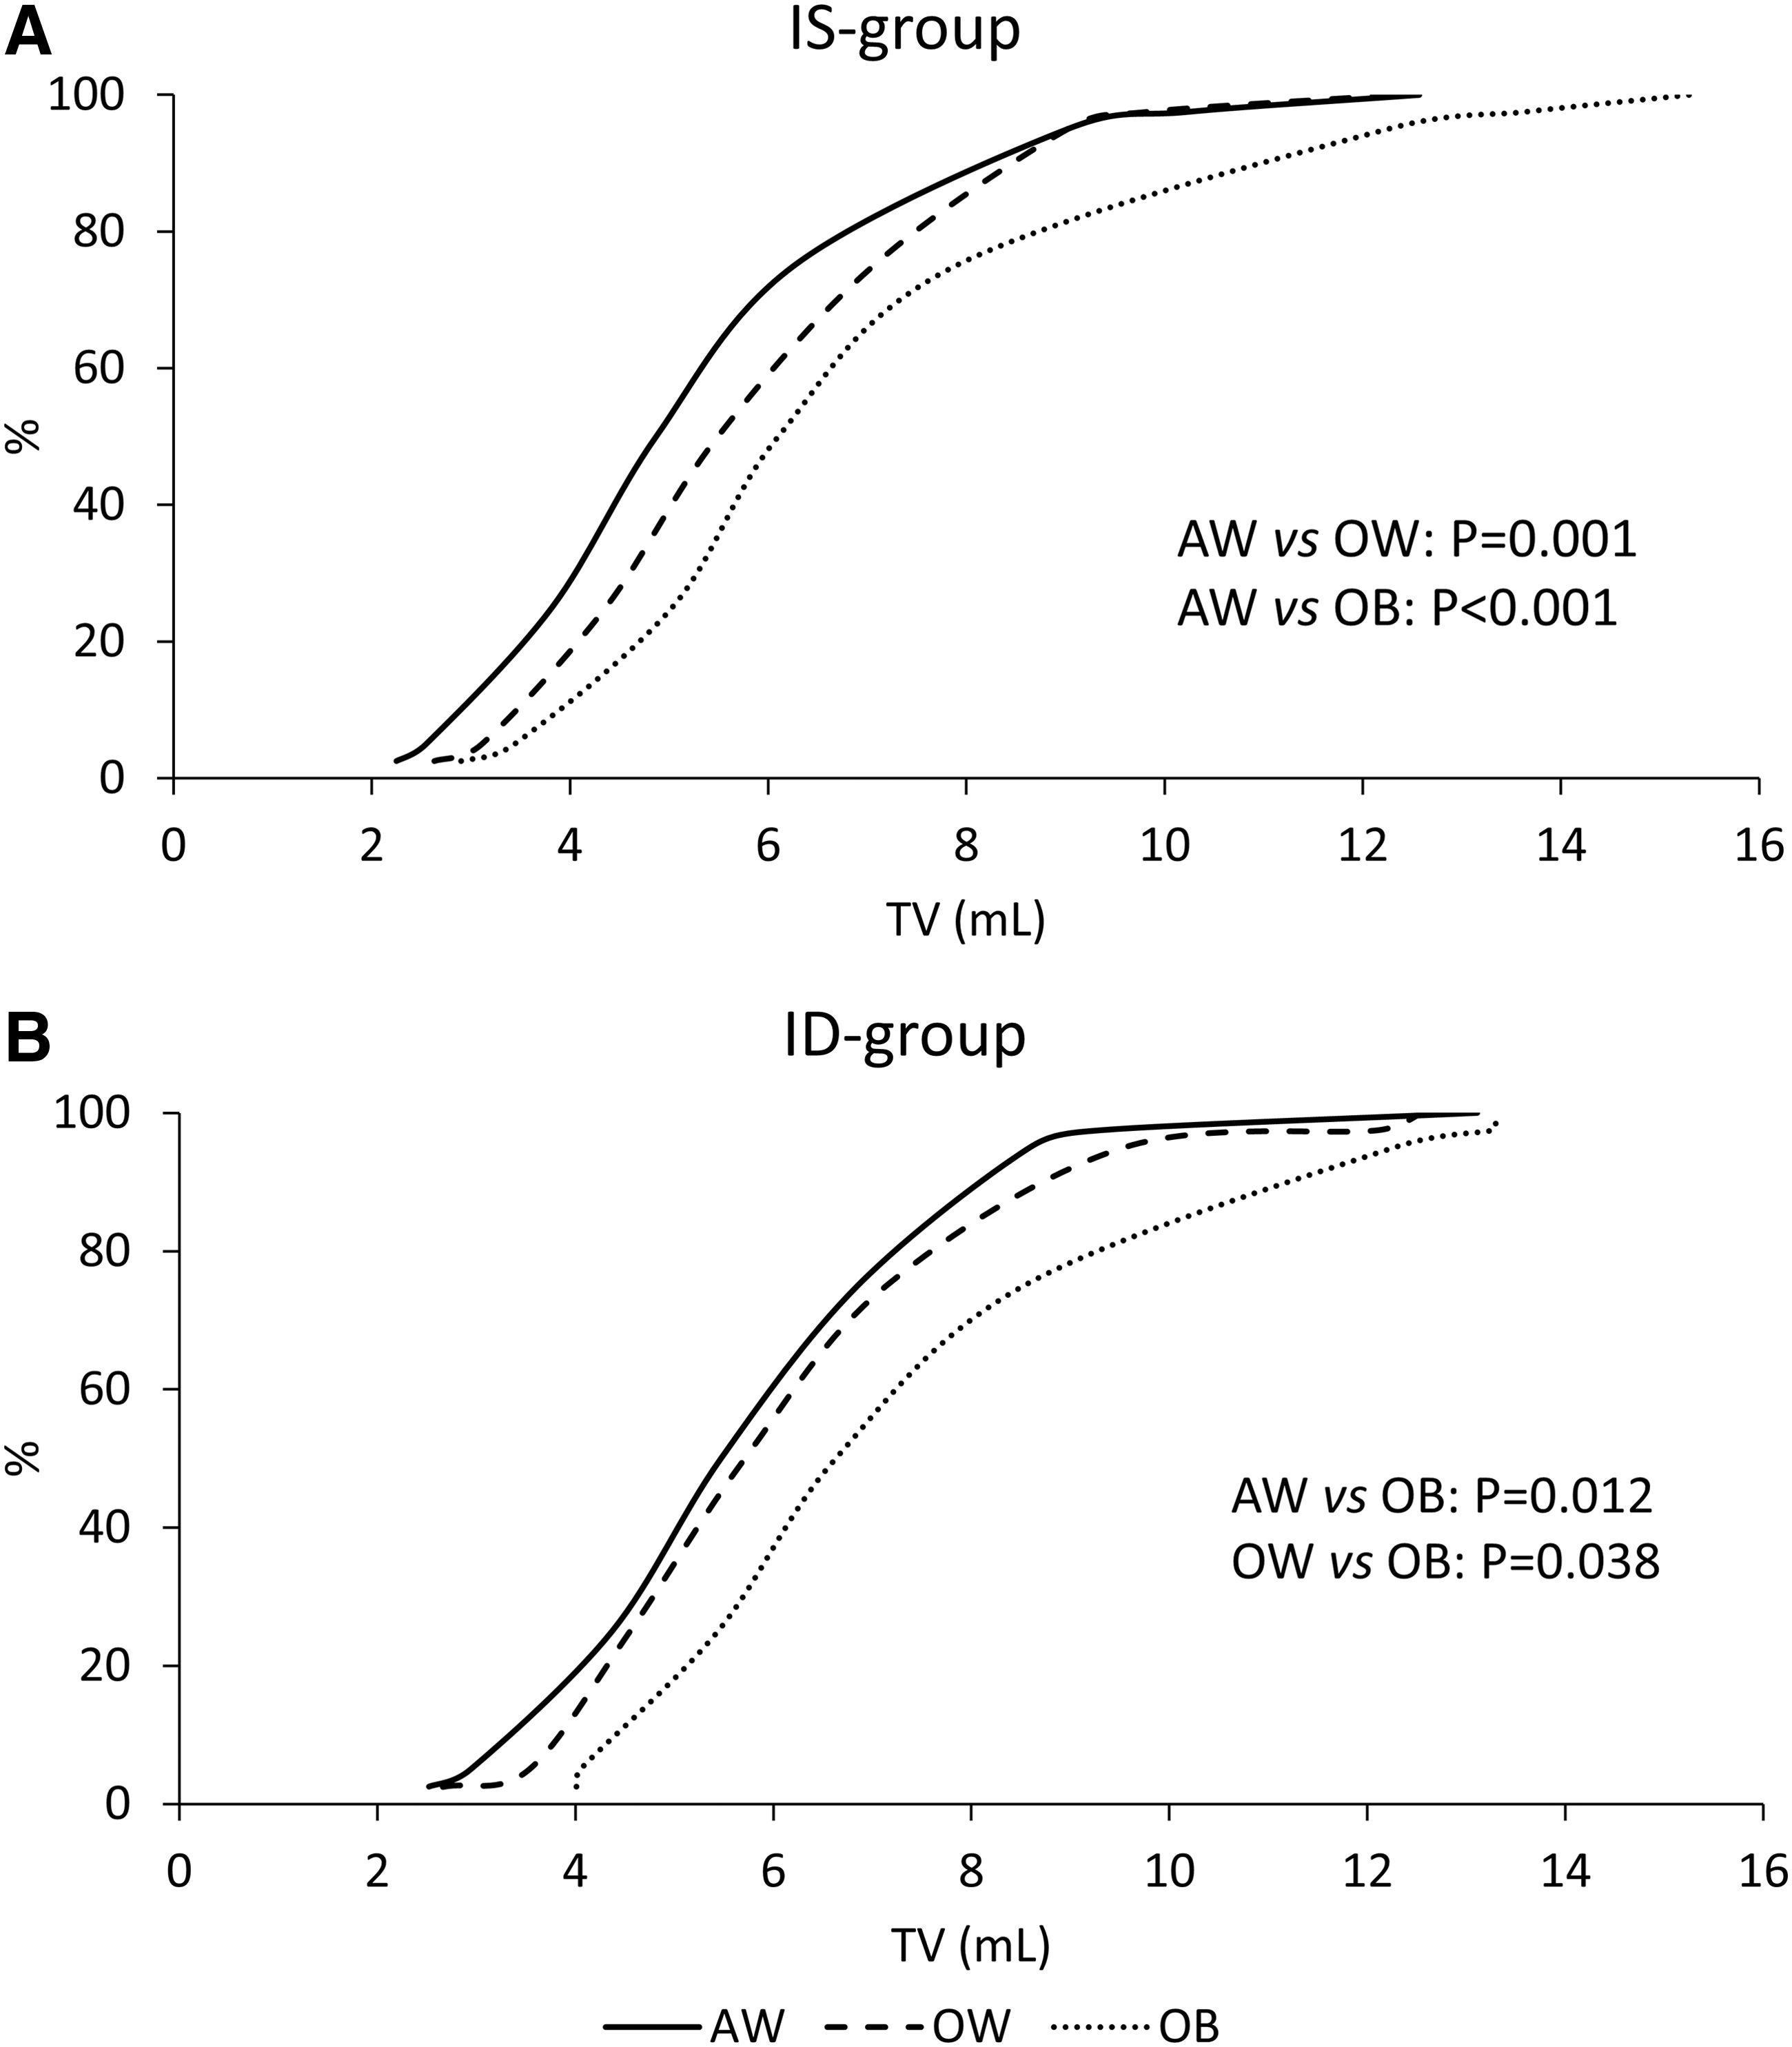
Cumulative distributions of TV in children residing in IS (
Geometric Mean [95% Confidence Intervals] of Thyroid Volume in Children Residing in Iodine-Sufficient and Iodine-Deficient Areas
Girls vs. boys: p < 0.01 in the IS group, p = 0.02 in the ID group.
CI, 95% confidence interval; TV, thyroid volume.
Table 3 shows the 2.5th, 50th, 97.5th percentiles of TV values stratified by age and BMI categories in IS children. Only values of the combined sexes are shown because no significant differences between boys and girls were observed at any age, with the exception of children aged 11 years showing a lower value in boys (97.5th percentile = 7.4 mL [CI 6.7 to 7.4]) than in girls (97.5th percentile = 9.1 mL [CI 8.7 to 9.2]). However, at all the considered ages, data analysis showed that TV values at the 97.5th percentile in OW and OB children were significantly higher than the corresponding values in AW children (Table 3).
Distributions of the 2.5th, 50th, and 97.5th Percentiles of Age-Matched Thyroid Volume Expressed in mL in Iodine-Sufficient Children (Combined Sexes) Stratified by Body Mass Index Categories (Adequate Weight, Overweight, Obese)
OW vs. AW: 11 years, p = 0.01; 12 years, p = 0.03; 13 years, p = 0.009.
OB vs. AW: 11 years, p = 0.005; 12 years, p = 0.02; 13 years, p = 0.001.
AW, adequate weight.
On the basis of these reference intervals, the prevalence of children with TV values above the 97.5th percentile at any age and BMI categories was then calculated in the ID group. The prevalence of goiter in this group was 2.9% if age-specific cutoffs were considered, whereas it decreased to 2.1% if age- and BMI-specific cutoffs were applied.
We next asked whether also the distributions of TV stratified by BSA (independent of age) showed significant differences among AW, OW, and OB children. Figure 4 shows the 97.5th percentile value of TV stratified by BSA classes in AW, OW, and OB children of the IS group (Fig. 4A) and the ID group (Fig. 4B). In the IS group, the lowest BSA classes (1.0–1.2 m2) included only AW children, the highest BSA classes (2.0–2.2 m2) included only OW and OB children, whereas AW, OW, and OB children were simultaneously included in the central BSA classes (1.4–1.9 m2). In the BSA classes ranging 1.4–1.7 m2, the TV value at the 97.5th percentile was always lower in OB children than in AW children. This was essentially due to the fact that at these BSA classes the frequency of the youngest children (aged 11 years) was higher in OB children (range: 67–43%) than in AW children (range: 23–1.7%). Similar results were obtained in the ID group for BSA classes ranging 1.7–1.9 m2 (Fig. 4B). Also in this case, the frequency of the youngest children (aged 11 years) was higher in OB children (range: 67–17%) than in AW children (range: 21–5.0%). These findings suggest that the use of BSA cutoffs of TV should be corrected for age and BMI classes (AW, OW, OB) to avoid an underestimation of goiter in the youngest OB children. In fact, if BSA-specific cutoffs calculated in IS children (97.5th percentile at each BSA class) were used to estimate the prevalence of goiter in the ID group, this prevalence would have been lower (1.3%) than that estimated by means of age- and BMI-specific cutoffs (2.1%). Age- and BMI-specific BSA cutoffs of TV were not calculated in the IS group because a larger number of children would have been necessary to obtain a representative number of subjects in each stratum.
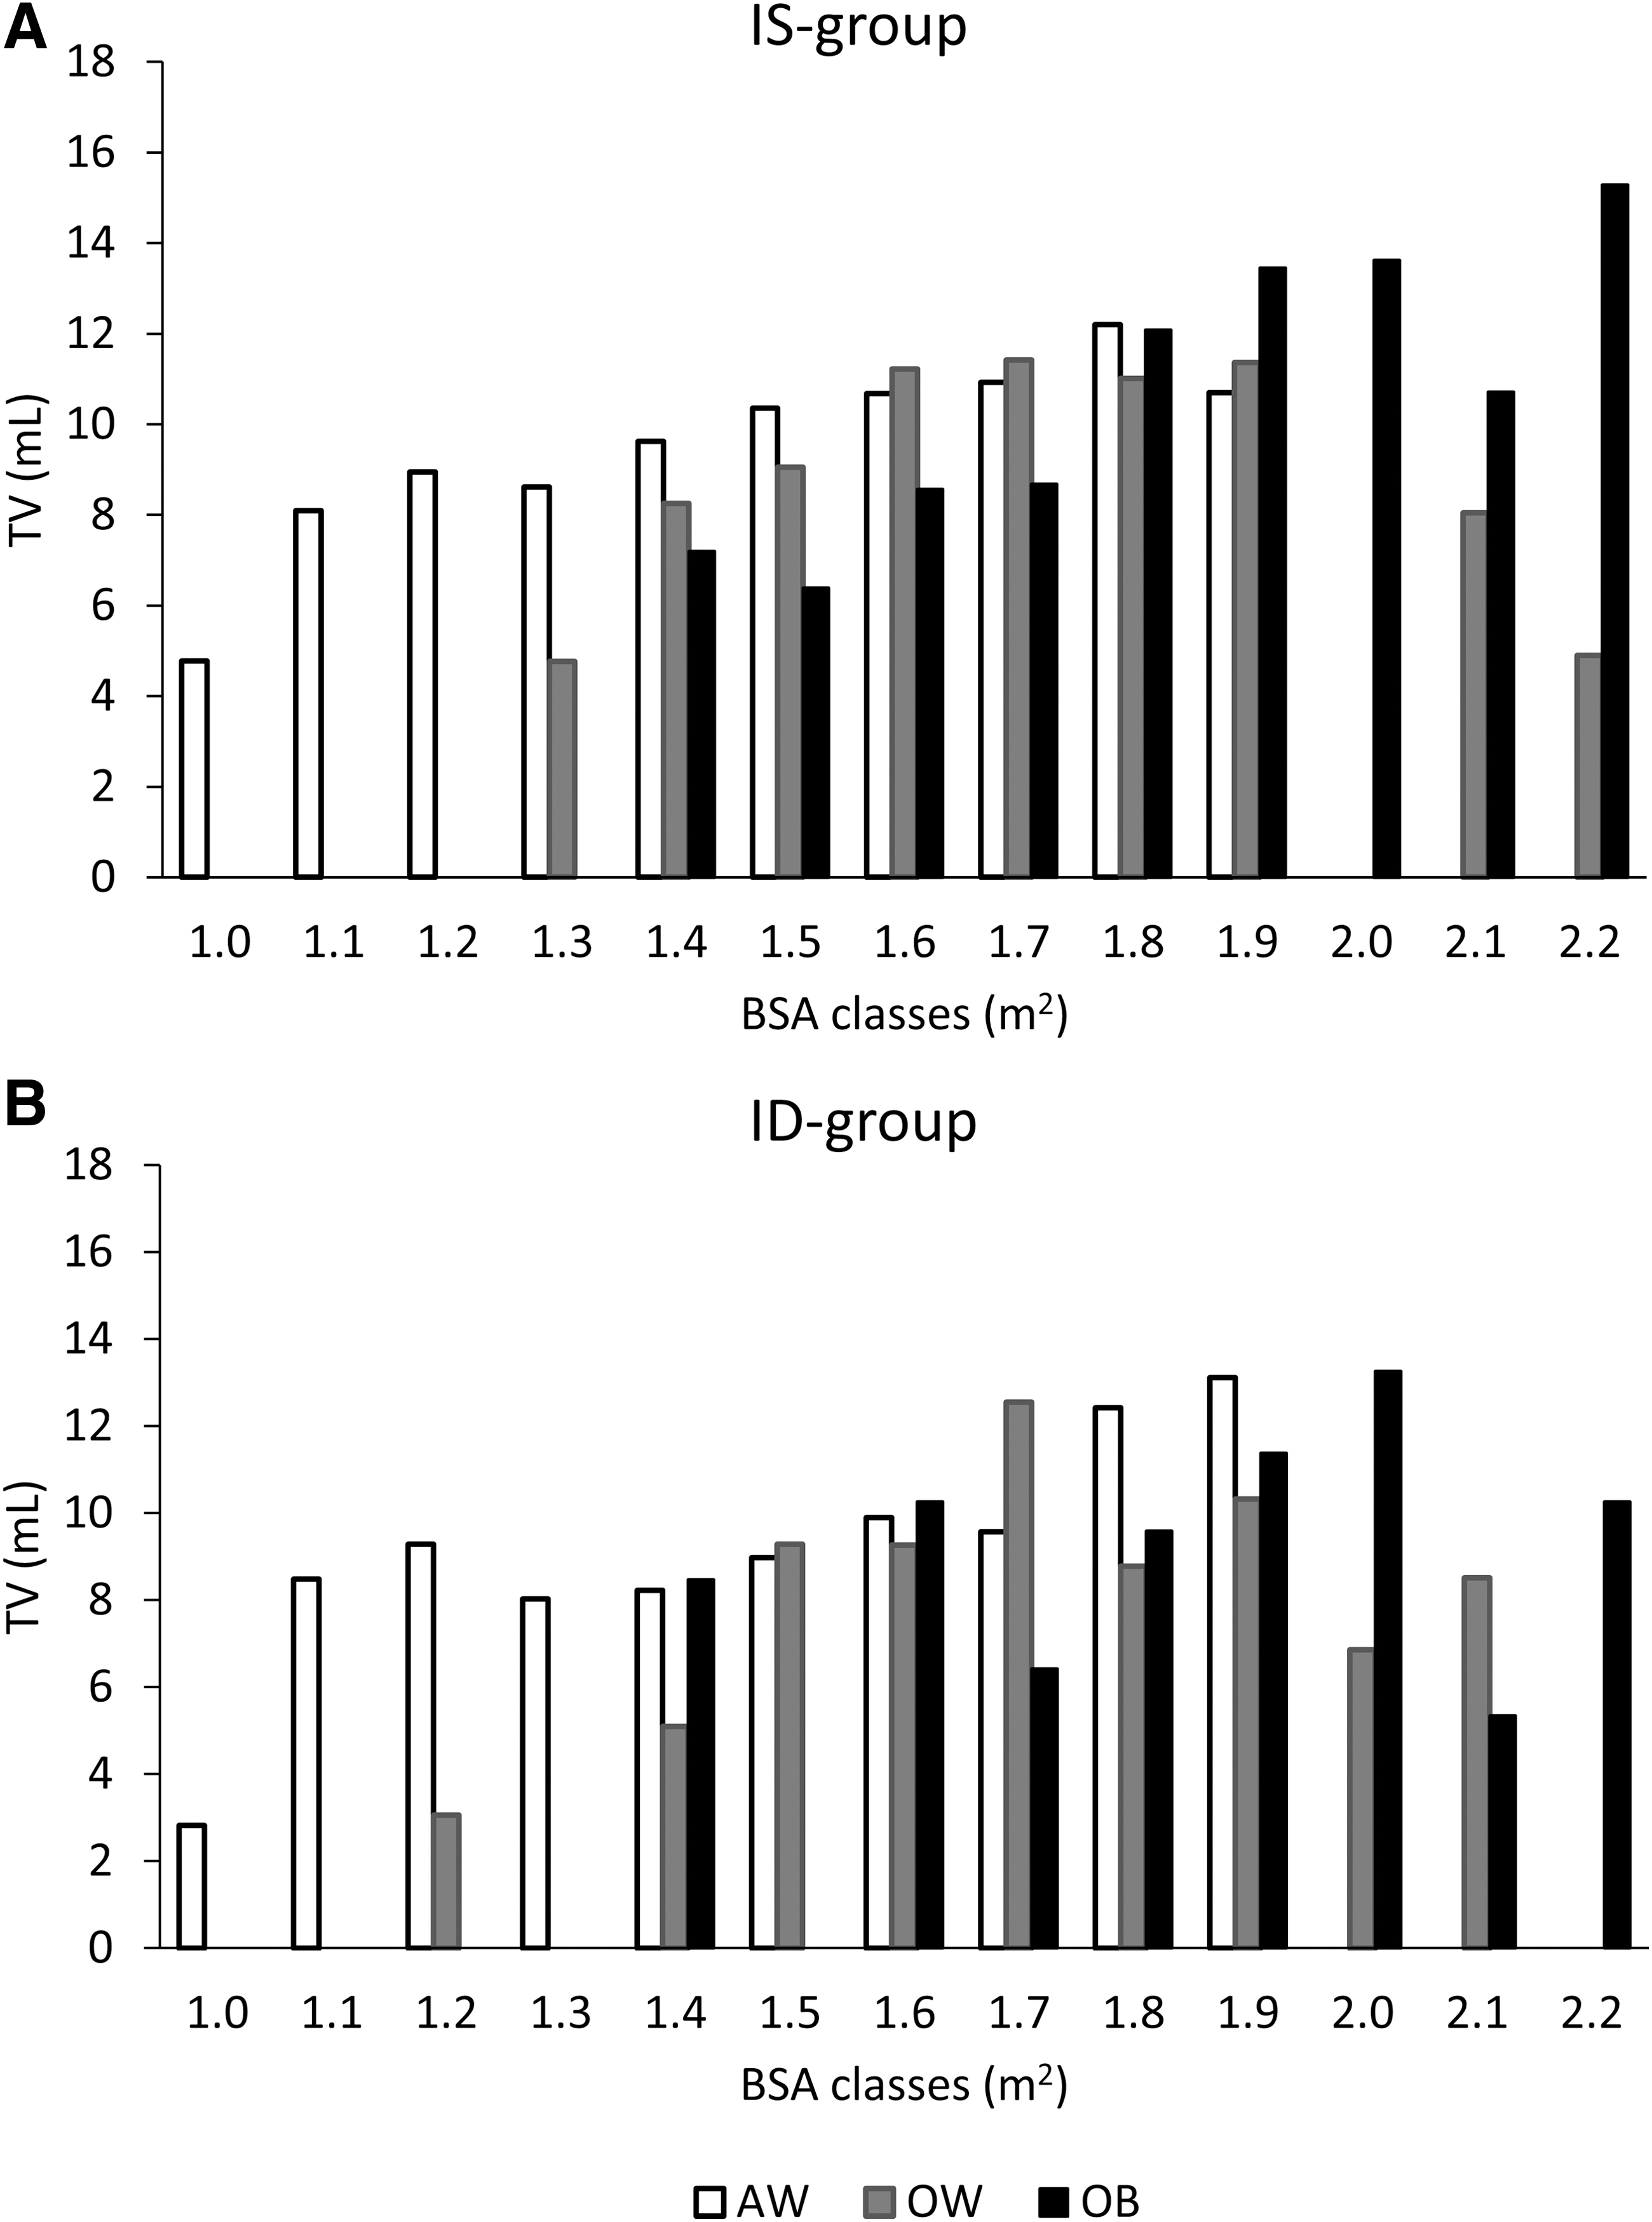
Distributions of the 97.5th percentile of TV expressed in mL in AW, OW, and OB children at the different BSA classes in the IS group (
BMI and thyroid hypoechogenicity
The frequency of thyroid hypoechogenicity on US was 6.6% in the IS group with no significant differences between boys (7.8%) and girls (5.4%). When the frequency of thyroid hypoechogenicity was calculated after stratifying IS children by BMI categories (AW, OW, OB), it was significantly (p < 0.001) lower in the AW group (4.4%) than in OW (11.0%) and OB children (24.1%), with no differences between boys and girls in any BMI categories group (Fig. 5A).
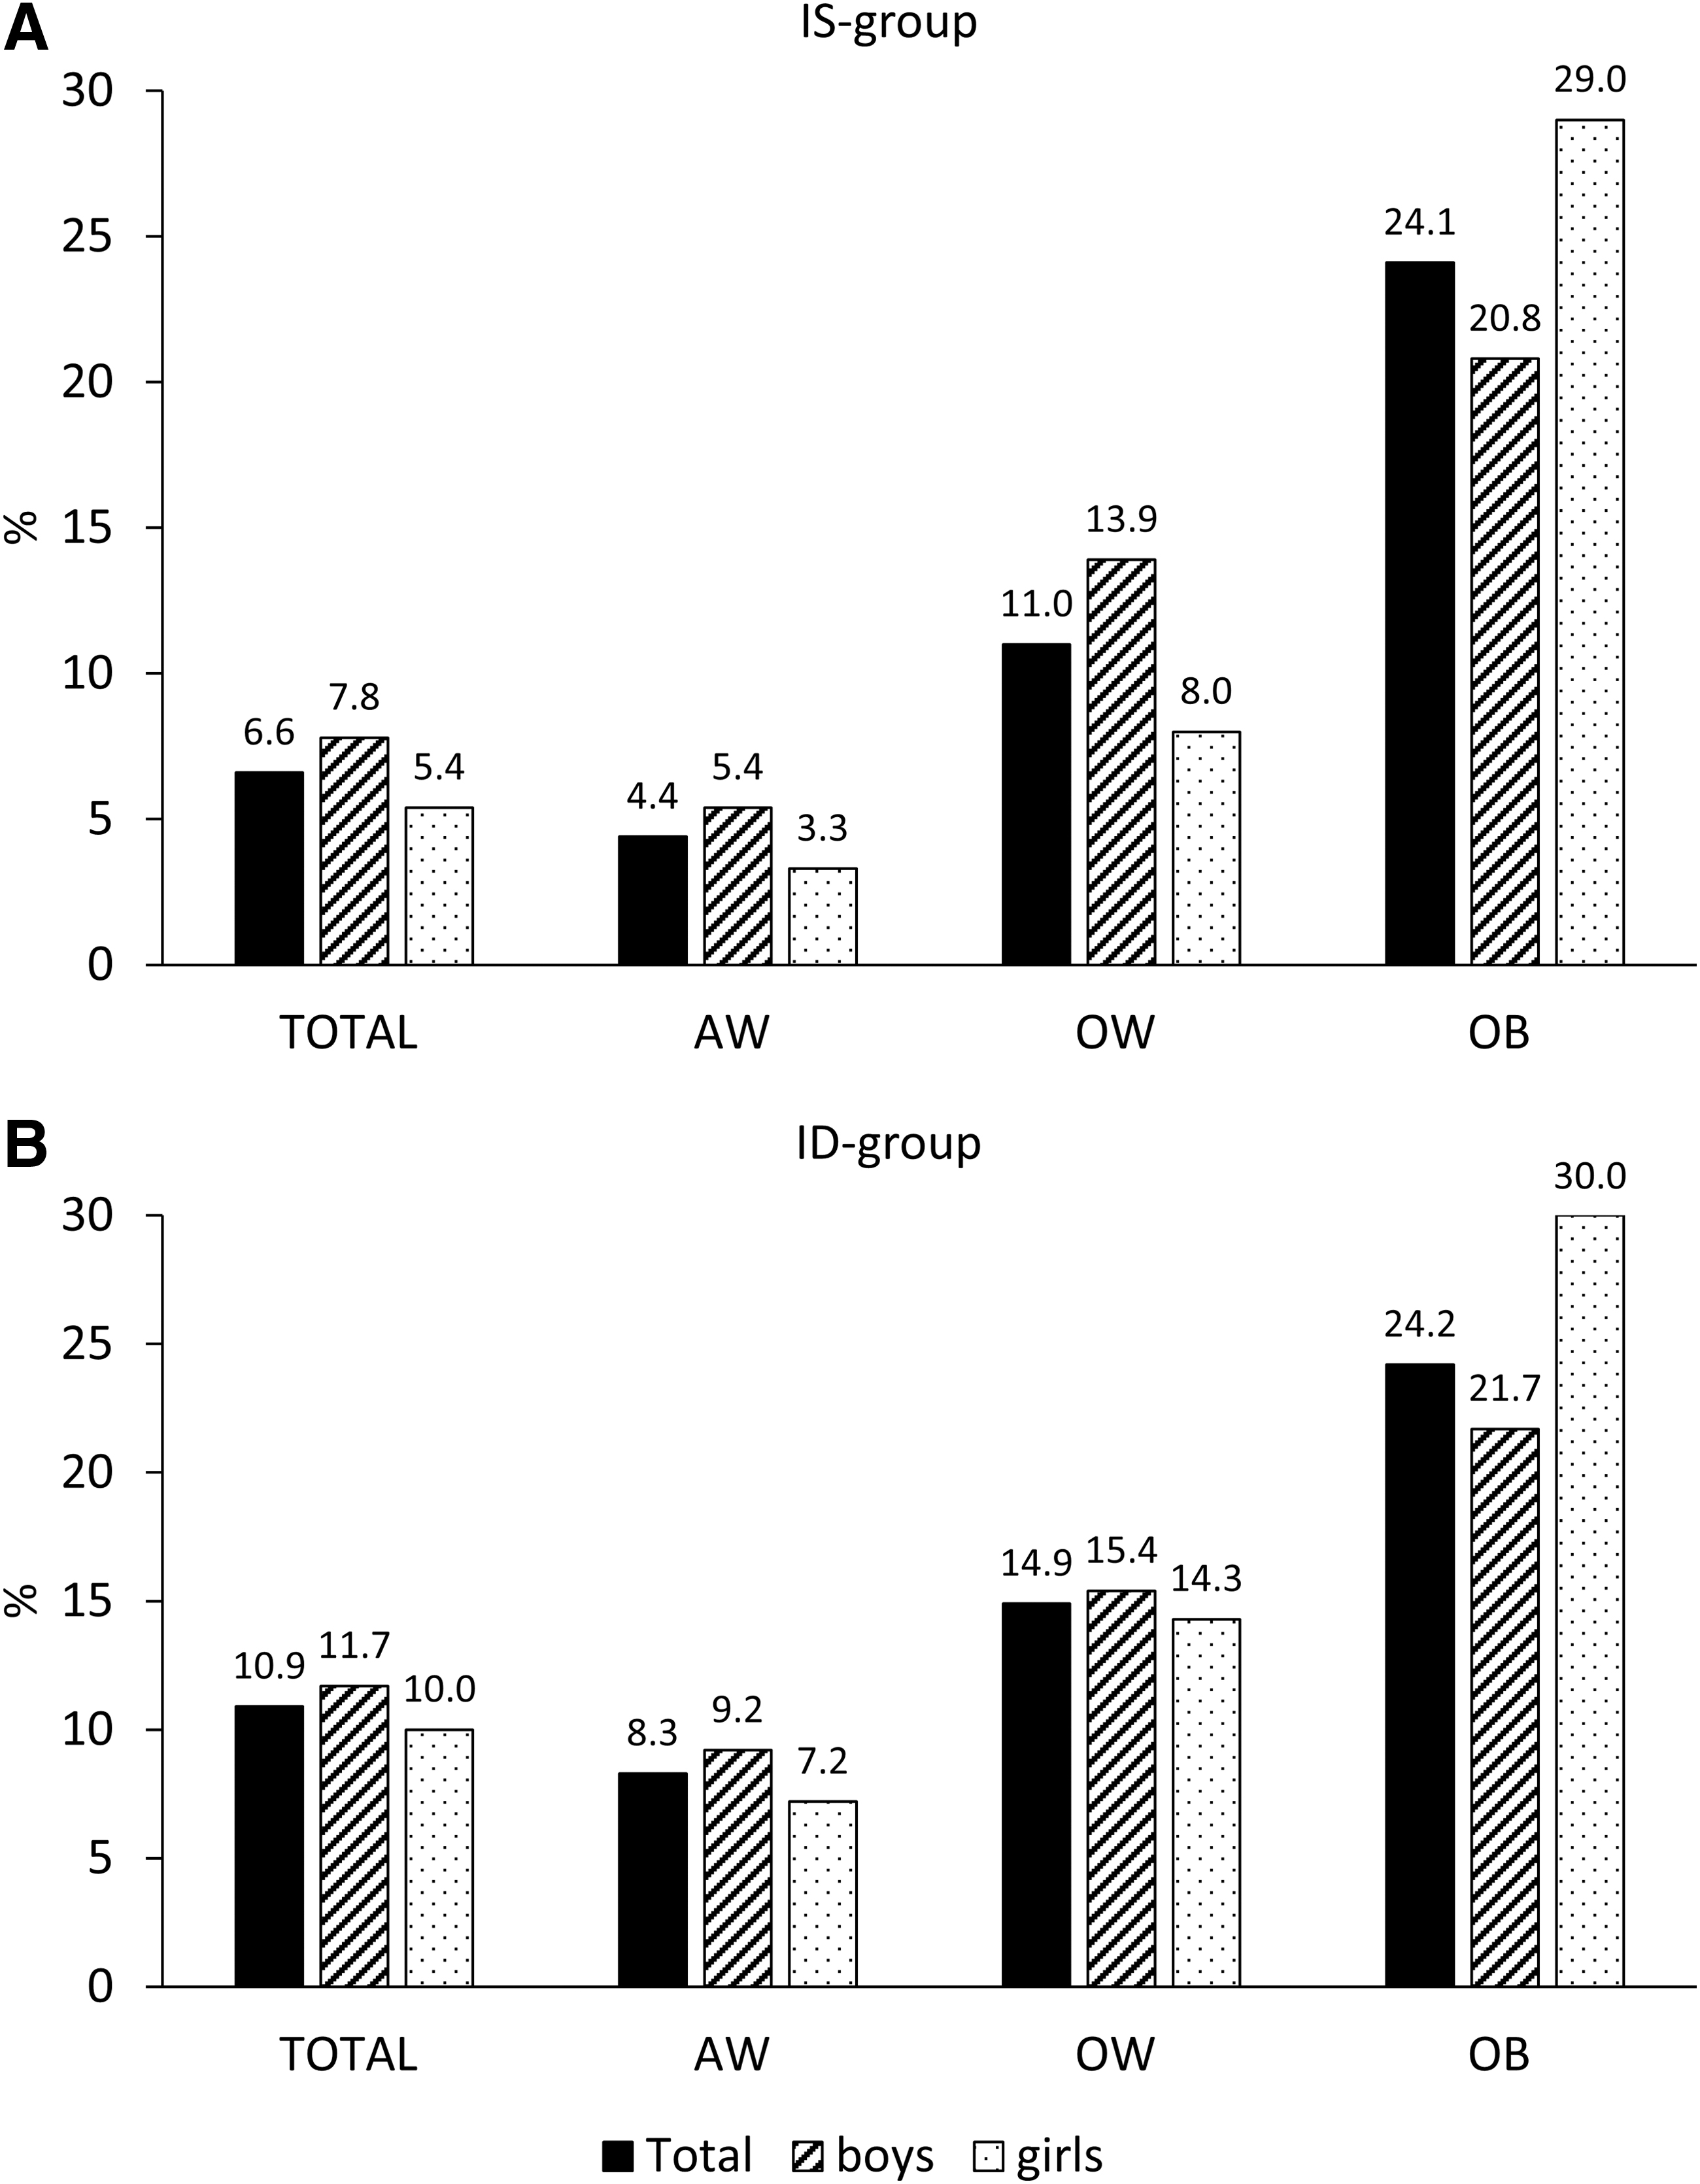
Prevalence of thyroid hypoechogenicity on ultrasound stratified by BMI categories (AW, OW, OB) and by sex. (
In the ID group (Fig. 5B), the frequency of thyroid hypoechogenicity was significantly higher than that found in IS children (10.9% vs. 6.6%, p = 0.005). However, when data were stratified by BMI categories, the frequency of thyroid hypoechogenicity was significantly (p = 0.004) lower in the AW group (8.3%) than OB children (24.2%). In addition, after adjusting for age and sex, the multivariate analysis showed a risk of hypoechoic thyroid sixfold higher in OB children than in AW children residing in IS areas (OR = 6.7 [CI 3.7 to 12.3]), and threefold higher in OB children than in AW children residing in the ID area (OR = 3.5 [CI 1.4 to 8.8]).
BMI and PAF
To further explore the association between BMI and UIC, TV, and thyroid hypoechoic pattern in both the IS and ID groups, ORs for UIC <100 μg/L, TV >97.5th percentile (calculated in AW children at different ages), and thyroid hypoechoic pattern were estimated in OW and OB children (Table 4). In addition, PAF was calculated for each studied parameter in both the IS and ID groups to estimate the fraction of cases in the population that could be ascribed to OW and OB.
Body Mass Index Categories-Specific Odds Ratios, Population Attributable Fraction, and Corresponding Confidence Intervals of Urinary Iodine Concentration <100 μg/L, Thyroid Volume >97.5th Percentile in Adequate Weight Children, and Thyroid Hypoechoic Pattern
Calculated in AW children.
OR and PAF adjusted for sex.
OR, odds ratio; PAF, population attributable fraction; THP, thyroid hypoechoic pattern.
In the IS group, the percent contribution (PAF) of OW to UIC <100 μg/L was 4%, to TV >97.5th percentile calculated in AW children was 15%, and to hypoechogenicity was 21%, whereas PAF was 4%, 31%, and 26%, respectively, when OB children were considered (Table 4).
In the ID group, the highest PAF values were found for TV >97.5th percentile calculated in AW children when both OW (38%) and OB children (49%) were compared with AW children, whereas the lowest PAF values were observed for UIC <100 μg/L (OW vs. AW = 0.5%; OB vs. AW = −4%). The PAF of cases with thyroid hypoechogenicity was 16% when OW children were compared with AW children and 19% when OB children were considered (Table 4).
Discussion
The results obtained in this study for the first time demonstrate that BMI may be a confounding factor in monitoring iodine nutritional status of populations because monitoring activity, which is mainly based on the recruitment of samples of schoolchildren, may be affected by the presence of OW and OB subjects in the samples. Specifically, in our study, OW and OB seem to have a low impact on UIC both in the IS group (PAF 4%) and in the ID group (PAF 0.5%). In addition, an apparently discordant effect of BMI on UIC was observed in the two groups. In the IS group, the median UIC was significantly lower in OB children than in AW children, whereas no significant difference was observed in the ID group. In this group, however, OB boys showed a median UIC value indicative of IS (113 μg/L) and OB girls of ID (84 μg/L). These results are difficult to explain and the question on whether these findings are due to a true low effect of BMI or to confounding factors, such as severity of obesity or social and economic factors, remains unanswered. To the best of our knowledge, only few discordant studies have addressed the issue of UIC in OB children and all have been conducted in IS areas (36 –38). A Mexican study conducted in children from primary schools found a positive correlation between UIC values and the prevalence of OW and obesity (36). The authors explained this result with a possible excessive consumption in OW and OB children of snack food rich in energy and iodized salt because in Mexico it is compulsory for food industry to employ iodized salt in their products. In another study conducted in schoolchildren residing in Brazil, a country where at the time of the study was high risk of iodine excess, the BMI category “overweight/obesity” was associated with a protective effect against excessive iodine intake (37). In another study, the level of parents' education and poverty has been demonstrated to be associated with both iodine deficiency and obesity (39). In our study, no information was collected on education and economic status of children's parents. In addition, the relatively small number of OB children did not allow us to verify whether the severity of obesity may have an effect on UIC. Therefore, we cannot exclude that both socioeconomic factors and a different degree of severity of obesity between groups may have had an effect on median UIC levels found in our OB children. Further ad hoc studies are needed to better understand the impact of BMI on UIC.
Another important result of this study is the relevant effect of OW and obesity on TV in both the IS (PAF 15% and 31%, respectively) and ID groups (PAF 38% and 49%, respectively), with OW and OB children showing higher TV values compared with AW children. A moderate increase in thyrotropin (TSH) has been reported in OB children and adults. Such an increase has been also reported to be positively correlated with BMI and frequently associated with an increase in TV and hypoechogenicity (20,40 –42). This correlation could be mediated by leptin, which is produced by adipose tissue, and is able to stimulate centrally the transcription of pro-thyrotropin-releasing hormone (TRH) and, consequently, of TRH and TSH (43,44). Another mechanism accounting for TSH rise could be the inflammatory state that characterizes obesity. It is well recognized that the adipose tissue secretes inflammatory cytokines, such as tumor necrosis factor-α (TNF-α), interleukin-1 (IL-1), and IL-6, which have been shown to inhibit sodium/iodide symporter (NIS) messenger RNA (mRNA) expression and iodide uptake (45,46), with a consequent compensatory increase in TSH in OB individuals.
Whatever the mechanism underlying elevated TSH in obesity, the consequent increase in TV implies that the effect of OW and obesity is particularly relevant when cutoff values of TV are applied to estimate the prevalence of goiter and when the frequency of thyroid hypoechogenicity is calculated to evaluate a possible effect of iodine supplementation on thyroid autoimmunity. Our findings suggest that, at least in countries where the frequency of OW and obesity is high, the prevalence of goiter can be overestimated in OB children if age-specific cutoffs of TV are not adjusted for BMI categories (AW, OW, OB). In fact, we found that the 97.5th percentile of age-specific TV in the IS group was higher in OB children than in OW and AW children at all the considered ages (Table 3). Furthermore, the use of BSA-specific cutoffs of TV did not overcome the effect of BMI with a consequent risk of underestimation of goiter in the youngest OB children (aged 11 years). This is because at least in certain classes of BSA, OB children were more frequently younger and therefore with a thyroid, which is smaller than the thyroid of older OW and AW children with the same BSA. These findings suggest that, although TV as a function of BSA is recommended in countries with a high prevalence of child growth retardation due to malnutrition (10), it may be misleading in countries with high prevalence of OW and obesity. In other words, our data indicate that BMI is a factor to consider either if age-adjusted TV or BSA cutoffs are used to estimate the prevalence of goiter in schoolchildren. In this regard, the use of local growth charts may be useful to correctly identify AW, OW, and OB children (47), especially in countries where the frequency of OW and obesity is differently distributed across the country, as it is in Italy where a North–South gradient (higher in the South) is present (28). Our results also support the idea that country-specific TV reference values can provide a more accurate estimate of goiter prevalence in schoolchildren because genetic and local factors are taken into account. International reference values of TV have been proposed to make the prevalence of goiter in schoolchildren comparable worldwide (12,13,48). Nevertheless, the limited applicability of international TV reference values to estimate the goiter prevalence in a specific country is debated. Recent studies conducted in different parts of the world (49 –53) have shown that TVs measured in schoolchildren from long-standing IS areas are larger than the current WHO reference limits. In this regard, it is worth to note that the mean BMI as well as OW and obesity trends have variably changed in the different parts of the world (26). This variability may explain why the current WHO TV reference limits are difficult to apply universally.
In our study, thyroid hypoechogenicity results were affected by BMI, with a PAF for OW ranging 16–21% and for obesity ranging 19–26%. In fact, although the frequency of thyroid hypoechoic pattern was significantly lower in the IS group than in the ID group, this difference was not observed between OB children in the IS and ID groups. This finding suggests that when the frequency of thyroid hypoechoic pattern is used as noninvasive marker to indirectly assess thyroid autoimmunity in monitoring USI programs, the risk of an overestimation of thyroid autoimmunity can be avoided if BMI is taken into account. Recent studies suggest that OB children frequently have a thyroid US pattern highly suggestive of Hashimoto's thyroiditis, even in the absence of antithyroid autoantibodies and lymphocytic infiltrate (20,40). The hypoechoic pattern in OB subjects has been linked to cytokines and other inflammatory markers produced by adipose tissue. These can increase TSH levels (increasing thyroid size) and induce vasodilatation and increased permeability of thyroid vessels, thus causing plasma exudation and changes in the thyroid parenchyma; these changes may be responsible for the hypoechogenicity seen on US.
In our study, the lack of data on serum TSH, antithyroid autoantibodies, and inflammatory markers is a limitation. Nevertheless, we believe that the strength of this study is represented by the fact that, despite numerous articles reporting the relationship between BMI and thyroid function, for the first time BMI has been demonstrated to be a confounder in monitoring effectiveness of iodine prophylaxis programs in population.
In conclusion, in Italy as in other Western countries, the number of OW and OB children is high. According to this evidence, BMI is a factor to consider in monitoring nationwide USI programs.
Footnotes
Acknowledgment
The technical assistance of Mrs. F. Latini is gratefully acknowledged.
Author Disclosure Statement
No competing financial interests exist.
Funding Information
This research was supported by a grant (Iodoprofilassi-ISS fasc. 6M69) from the General Direction of Food Safety and Nutrition, Ministry of Health, Italy.