
Abstract
Background:
Advanced thyroid cancers, including differentiated thyroid carcinoma (DTC) with distant metastasis, and anaplastic thyroid carcinoma (ATC), are associated with poor clinical outcomes and limited treatment options. This study aimed to determine the immune profiles of advanced thyroid cancers using fluorescent multiplex immunohistochemistry (F-MIHC) and multispectral imaging (MSI).
Methods:
Twenty-eight tissue samples were collected from 12 patients who had DTC with distant metastasis and from 16 with ATC. The samples were assessed using F-MIHC and MSI with antibodies against the cell surface molecules, cluster of differentiation (CD)4, CD8, programmed cell death-1 (PD-1), PD ligand 1 (PD-L1), forkhead box protein 3, and cytokeratin (CK). The expression of PD-L1 was evaluated using tumor proportion score (TPS) and combined positive score (CPS).
Results:
Significantly, more PD-L1-positive tumor cells (CK+PD-L1+) per mm2 were found in ATC samples than in DTC samples (183.5 vs. 0.03, p < 0.001). Lymphocyte infiltration was significantly increased in ATC compared with DTC, with significantly more PD-L1- or PD-1-positive lymphocytes in ATC samples than in DTC samples. The TPS and CPS for PD-L1 expression were negative in all DTC samples but positive in 81% and 94% of ATC samples, respectively.
Conclusions:
Immune profiling revealed significant differences between advanced DTC and ATC, particularly in terms of PD-L1 expression and lymphocyte infiltration. Therefore, immune profiling using F-MIHC and MSI can provide invaluable information regarding tumor microenvironments, which could help select candidates for immunotherapy.
Introduction
The prognosis of patients with differentiated thyroid carcinoma (DTC) is generally good. However, survival and treatment outcomes are poor for patients with refractory, progressive, or distant metastatic DTC or anaplastic thyroid carcinoma (ATC) (1 –4). Although many new treatment options for advanced solid cancers have recently been introduced, only two multikinase inhibitors for progressive and refractory DTC and combination of dabrafenib and trametinib for BRAFV600E -mutated ATC have been approved (2,5).
Immunotherapy has recently attracted attention among treatments for various advanced cancers (6). Cancer cells can escape immune surveillance by activating inhibitory checkpoint molecules through interactions with immune cells (6 –8). Therefore, blocking inhibitory molecules such as programmed cell death-1 (PD-1) has resulted in significant antitumor effects. However, the value of a PD-1 blockade in patients with advanced thyroid cancers has yet to be substantiated (9 –13). Evidence from clinical studies of other types of cancer has shown that a blockade of the PD-1 signaling axis is most effective in tumors that contain tumor-infiltrating lymphocytes that are suppressed by PD-1 binding to PD ligand 1 (PD-L1) (6,8,14 –16). Thus, the immune profiles and PD-1/PD-L1 expression in advanced thyroid cancers should be evaluated to predict the effectiveness of immunotherapy with PD-1 blockade (17,18). In one study, 6% of papillary thyroid carcinomas (PTC) and >20% of ATC expressed PD-L1 (19). However, only nine patients with ATC were included in that study, and half of them had stage I or stage II disease. Because immunotherapy is considered only for advanced thyroid cancers, we aimed to determine lymphocyte infiltration and PD-1/PD-L1 expression in advanced thyroid cancers, ATC and DTC, with distant metastasis.
Immune profiles of tissue samples have recently been analyzed using fluorescent multiplex immunohistochemistry (F-MIHC) and multispectral imaging (MSI) (20). These invaluable tools for tumor tissue immune profiling have the advantage of being able to evaluate the expression of multiple targets in one tissue section. Quantifying immune markers using these technologies has produced accurate and reproducible results compared with conventional immunohistochemical (IHC) staining (20 –22). Here, we applied F-MIHC and MSI to determine the immune profiles of advanced thyroid carcinomas.
Materials and Methods
Patients and tissue samples
We included 28 patients at the Asan Medical Center, Seoul, Korea, who had confirmed diagnoses of DTC with distant metastasis or ATC between 1994 and 2017. All patients provided written informed consent to participate in this study, and tissue samples were collected after excision or biopsy of primary or locoregional recurrent tumors. All specimens were reviewed by an endocrine pathologist (D.E.S.). We also retrospectively reviewed the medical records of the patients. The Institutional Review Board of the Asan Medical Center approved the study protocol.
Fluorescent multiplexed immunohistochemistry
Tumor tissues were sliced into 4 μm thick sections and transferred onto positively charged slides for F-MIHC using a Leica Bond Rx™ Automated Stainer (Leica Biosystems, Nussloch GmbH, Nussloch, Germany). The sections were baked at 60°C for 40 minutes and deparaffinized using Leica Bond Dewax Solution (Cat. No. AR9222; Leica Biosystems, Wetzlar, Germany), followed by antigen retrieval with Bond Epitope Retrieval 2 (Cat. No. AR9640; Leica Biosystems) for 30 minutes. The sections were then incubated with primary antibodies, followed by a secondary horseradish peroxidase-conjugated polymer (PerkinElmer Life and Analytical Sciences, Inc., Waltham, MA) that induces the covalent binding of different fluorophores via tyramide signal amplification (TSA). This reaction was followed by additional antigen retrieval using Bond Epitope Retrieval 1 (Cat. No. AR9961; Leica Biosystems) for 20 minutes to remove the primary and secondary antibodies. Each section was stained in six sequential rounds, then counterstained with Spectral 4′,6-diamidino-2-phenylindole and mounted with HIGHDEF® IHC fluoromount (Enzo Life Sciences, Inc., Farmingdale, NY).
The sections were stained using Opal Polaris 480 and 780 reagent kits and an Opal 7-color Automation IHC Kit (AKOYA Biosciences, Marlborough, MA). The expression of proteins of interest was evaluated as follows: cytokeratin (CK; diluted 1:300; Novus Biologicals LLC., Centennial, CO), Opal 780 TSA Plus (diluted 1:25); forkhead box protein (Foxp)3 (diluted 1:100; Abcam Plc., Cambridge, UK), Opal 690 TSA Plus (diluted 1:150); PD-L1 (diluted 1:300; Cell Signaling Technology, Danvers, MA), Opal 620 TSA Plus (diluted 1:150); PD-1 (diluted 1:500; Abcam), Opal 570 TSA Plus (diluted 1:150); cluster of differentiation (CD)8 (diluted 1:300; Bio-Rad AbD Serotec Ltd., Kidlington, UK), Opal 520 TSA Plus (diluted 1:150); CD4 (1:200; Abcam), Opal 480 TSA Plus (diluted 1:300). Supplementary Table S1 summarizes the details of the panel used.
MSI and analysis
Images of the multiplex-stained sections captured using a Vectra® Polaris Quantitative Pathology Imaging System (PerkinElmer) were spectrally unmixed and cell segmented using inForm 2.4.4 image analysis software (PerkinElmer). The data obtained using the inForm software were analyzed using the Spotfire™ software (TIBCO Software, Inc., Palo Alto, CA), and a threshold for positive or negative cells was designated for all cells. Scores indicating positivity for CD4, CD8, PD-1, PD-L1, Foxp3, and CK were >2.2, >0.6, >1.0, >0.6, >1.2, and >0.45, respectively. The threshold for each marker was based on a pathological review by an endocrine pathologist (D.E.S.) and a specialized researcher in the optical imaging core laboratory (Y.R.). Supplementary Figure S1 shows representative examples of the MSI findings in the specimens. Supplementary Figure S1A shows an MSI, and Supplementary Figure S1B shows individual cell surface markers stained with F-MIHC. Each cell surface molecule was stained with a different color to rule out risk of cross-reactivity (20).
We compared the expression of PD-L1 determined by conventional IHC and by F-MIHC with MSI to confirm whether the threshold for PD-L1 positivity obtained by MSI was appropriate and found consistent results. Supplementary Figure 1C–E shows representative images of three levels of PD-L1 expression (determined by conventional IHC) evaluated by conventional IHC (C-i, D-i, and E-i) and F-MIHC (C-ii, D-ii, and E-ii).
Definitions
We defined CK-positive cells as tumor cells and CK-negative cells that were positive for CD4, CD8, or Foxp3 as T cells. Cytotoxic and regulatory T cells were defined as CD8-positive and Foxp3-positive, respectively (21). The numbers of positive cells/mm2 for each marker were compared.
The expression of PD-L1 in other types of cancer is assessed using tumor proportion score (TPS) and combined positive score (CPS) (15). The TPS is calculated as the ratio between the number of PD-L1-positive tumor cells and the total number of viable tumor cells, and the CPS is calculated as the ratio between the number of all PD-L1-positive cells, including tumor cells, lymphocytes, and macrophages, and all tumor cells (15). We used the following formulas to determine the TPS and CPS:
The cutoff values for PD-L1-positive tumor cells and high PD-L1 expression in tumor cells were 1 and 50 for TPS (15,16) and 1 and 20 for CPS, respectively (15,23).
Genetic characterization
We investigated 50 known thyroid cancer-related genes in all the tumor samples using next-generation sequencing (24). Genomic DNA that was extracted from tissue blocks was quantified, exome capture libraries were prepared, and the final product purified from the captured DNA was quantified and analyzed. The presence of BRAFV600E and TERT promoter mutations was determined by targeted next-generation sequencing.
Statistical analysis
All data were analyzed using the R software, version 3.4.4 (R Foundation for Statistical Computing; Vienna, Austria). Continuous variables are presented as medians with ranges. Categorical variables are presented as numbers with percentages. Categorical and continuous variables were assessed using chi-squared and Mann–Whitney U-tests, respectively. All p-values were two-sided, and results with p < 0.05 were considered statistically significant.
Results
Baseline characteristics
Table 1 shows the clinical and genetic characteristics of the study cohort. Twelve and 16 patients had confirmed diagnoses of DTC with distant metastasis and ATC, respectively. The lungs were the most common site of distant metastasis in DTC (n = 9, 75%). Moreover, eight (67%) patients had radioiodine refractory disease, and three were treated with sorafenib or lenvatinib. None of the patients with DTC had any pathological evidence of coexisting Hashimoto's thyroiditis (HT). Among the 16 patients with ATC, 14 (88%) had distant metastasis, 5 (31%) had de novo ATC, and 11 (69%) had ATC associated with PTC. None had ATC associated with follicular thyroid carcinoma. Clinicopathologic factors did not significantly differ between de novo ATC and ATC associated with PTC. Two of the 16 patients with ATC had coexisting HT. Thyroid cancer (DTC, n = 4; ATC, n = 15) was the cause of death in 19 (68%) of the 28 patients.
Clinical and Genetic Characteristics of Patients with Differentiated Thyroid Carcinoma and Anaplastic Thyroid Carcinoma
Continuous and categorical variables are presented as medians (minimum to maximum range) and numbers (%), respectively.
C228T mutation was detected in 11 patients with ATC and 2 patients with DTC; C250T mutation was detected in 2 patients with DTC.
ATC, anaplastic thyroid carcinoma; DTC, differentiated thyroid carcinoma; TERT, telomerase reverse transcriptase.
Immune profiling
PD-L1-positive tumor cells
We determined the number of PD-L1-positive (CK+PD-L1+) tumor cells/mm2 according to the pathological subtype (Fig. 1). Figure 1 shows that significantly more tumor cells were PD-L1-positive in DTC than in ATC (median 183.5 [0.37–1274] vs. 0.03 [0–0.49], p < 0.001). The expression of PD-L1 did not significantly differ between ATC associated with PTC and de novo ATC (data not shown). We evaluated differences in numbers of PD-L1-positive tumor cells according to mutation status. We found BRAFV600E and TERT promoter mutations in 15 (60%) samples each. The BRAFV600E mutation was not significantly associated with the number of PD-L1-positive tumor cells (median [range] values for BRAF mutation [−] vs. [+]: 23.18 [0.03–1274] vs. 0.10 [0–380.2], p = 0.065). Supplementary Figure S2A shows that the TERT promoter mutation was significantly associated with more PD-L1-positive tumor cells (median [range] values for TERT mutation [+] vs. [−]: 64.17 [0–1274] vs. 0.06 [0–217.7], p < 0.05) However, mutation status (BRAF, TERT, or both) did not significantly differ after adjusting for cancer types (data not shown).

Comparison of numbers of tumor cells expressing PD-L1 based on pathological subtype. The y-axis is transformed into a logarithmic scale; 0 is expressed as 0.001. Bold lines, medians. *p < 0.05; Mann–Whitney U-tests. ATC, anaplastic thyroid carcinoma; DTC, differentiated thyroid carcinoma; PD-L1, programmed cell death-ligand 1.
Lymphocyte infiltration
Figure 2 shows a comparison of the numbers of total infiltrating T lymphocytes and subtypes between DTC and ATC samples. Cells were also classified according to PD-L1 and PD-1 expression. Figure 2A shows significantly more T lymphocyte infiltration in ATC than in DTC (1138 [67.15–2731] vs. 84.05 [0–300.9], p < 0.05). Figure 2B shows significantly more cytotoxic T lymphocytes in ATC than in DTC (370.7 [38.19–2327] vs. 18.97 [0.99–169.1], p < 0.05), and Figure 2C shows significantly more infiltrating regulatory T lymphocytes in ATC than in DTC (263.8 [26.9–1499] vs. 14.15 [0.34–188.0], p < 0.05). Significantly, more lymphocytes were positive for PD-L1 and PD-1 in ATC than in DTC, except for PD-1-positive cytotoxic T lymphocytes, which did not significantly differ between DTC and ATC.
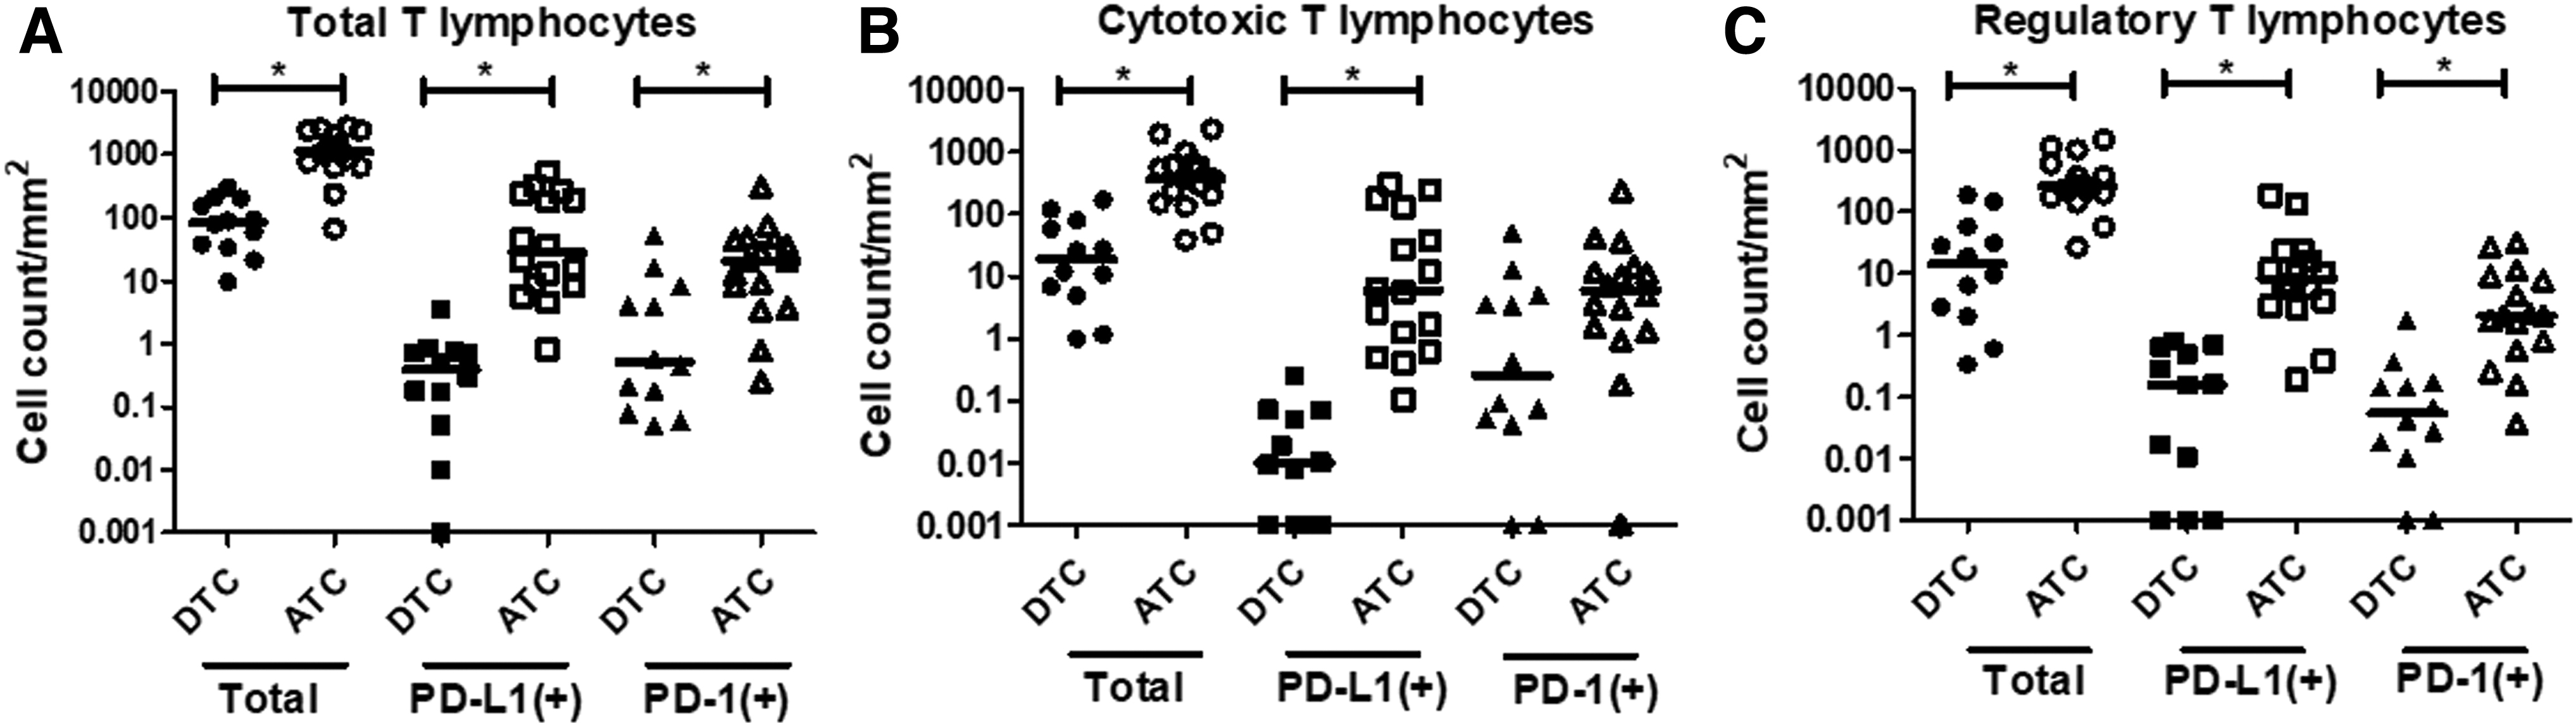
Comparison of numbers of total T lymphocytes (
TPS and CPS
We evaluated the proportions of PD-L1 expression in advanced thyroid cancers based on the TPS and CPS (Fig. 3). All DTC were negative for PD-L1 expression, whereas 81% and 94%, respectively, of ATC were positive for PD-L1 (p < 0.001). Moreover, 6% and 44% of ATC, respectively, expressed abundant PD-L1. Analysis of the TPS and CPS based on the presence of the TERT promoter mutation revealed that more patients with and without the TERT promoter mutation tested positive for PD-L1 (Supplementary Fig. S2B). The clinicopathologic factors of age, sex and co-existing HT, survival outcomes, and PD-L1 expression did not significantly differ between DTC and ATC (data not shown).
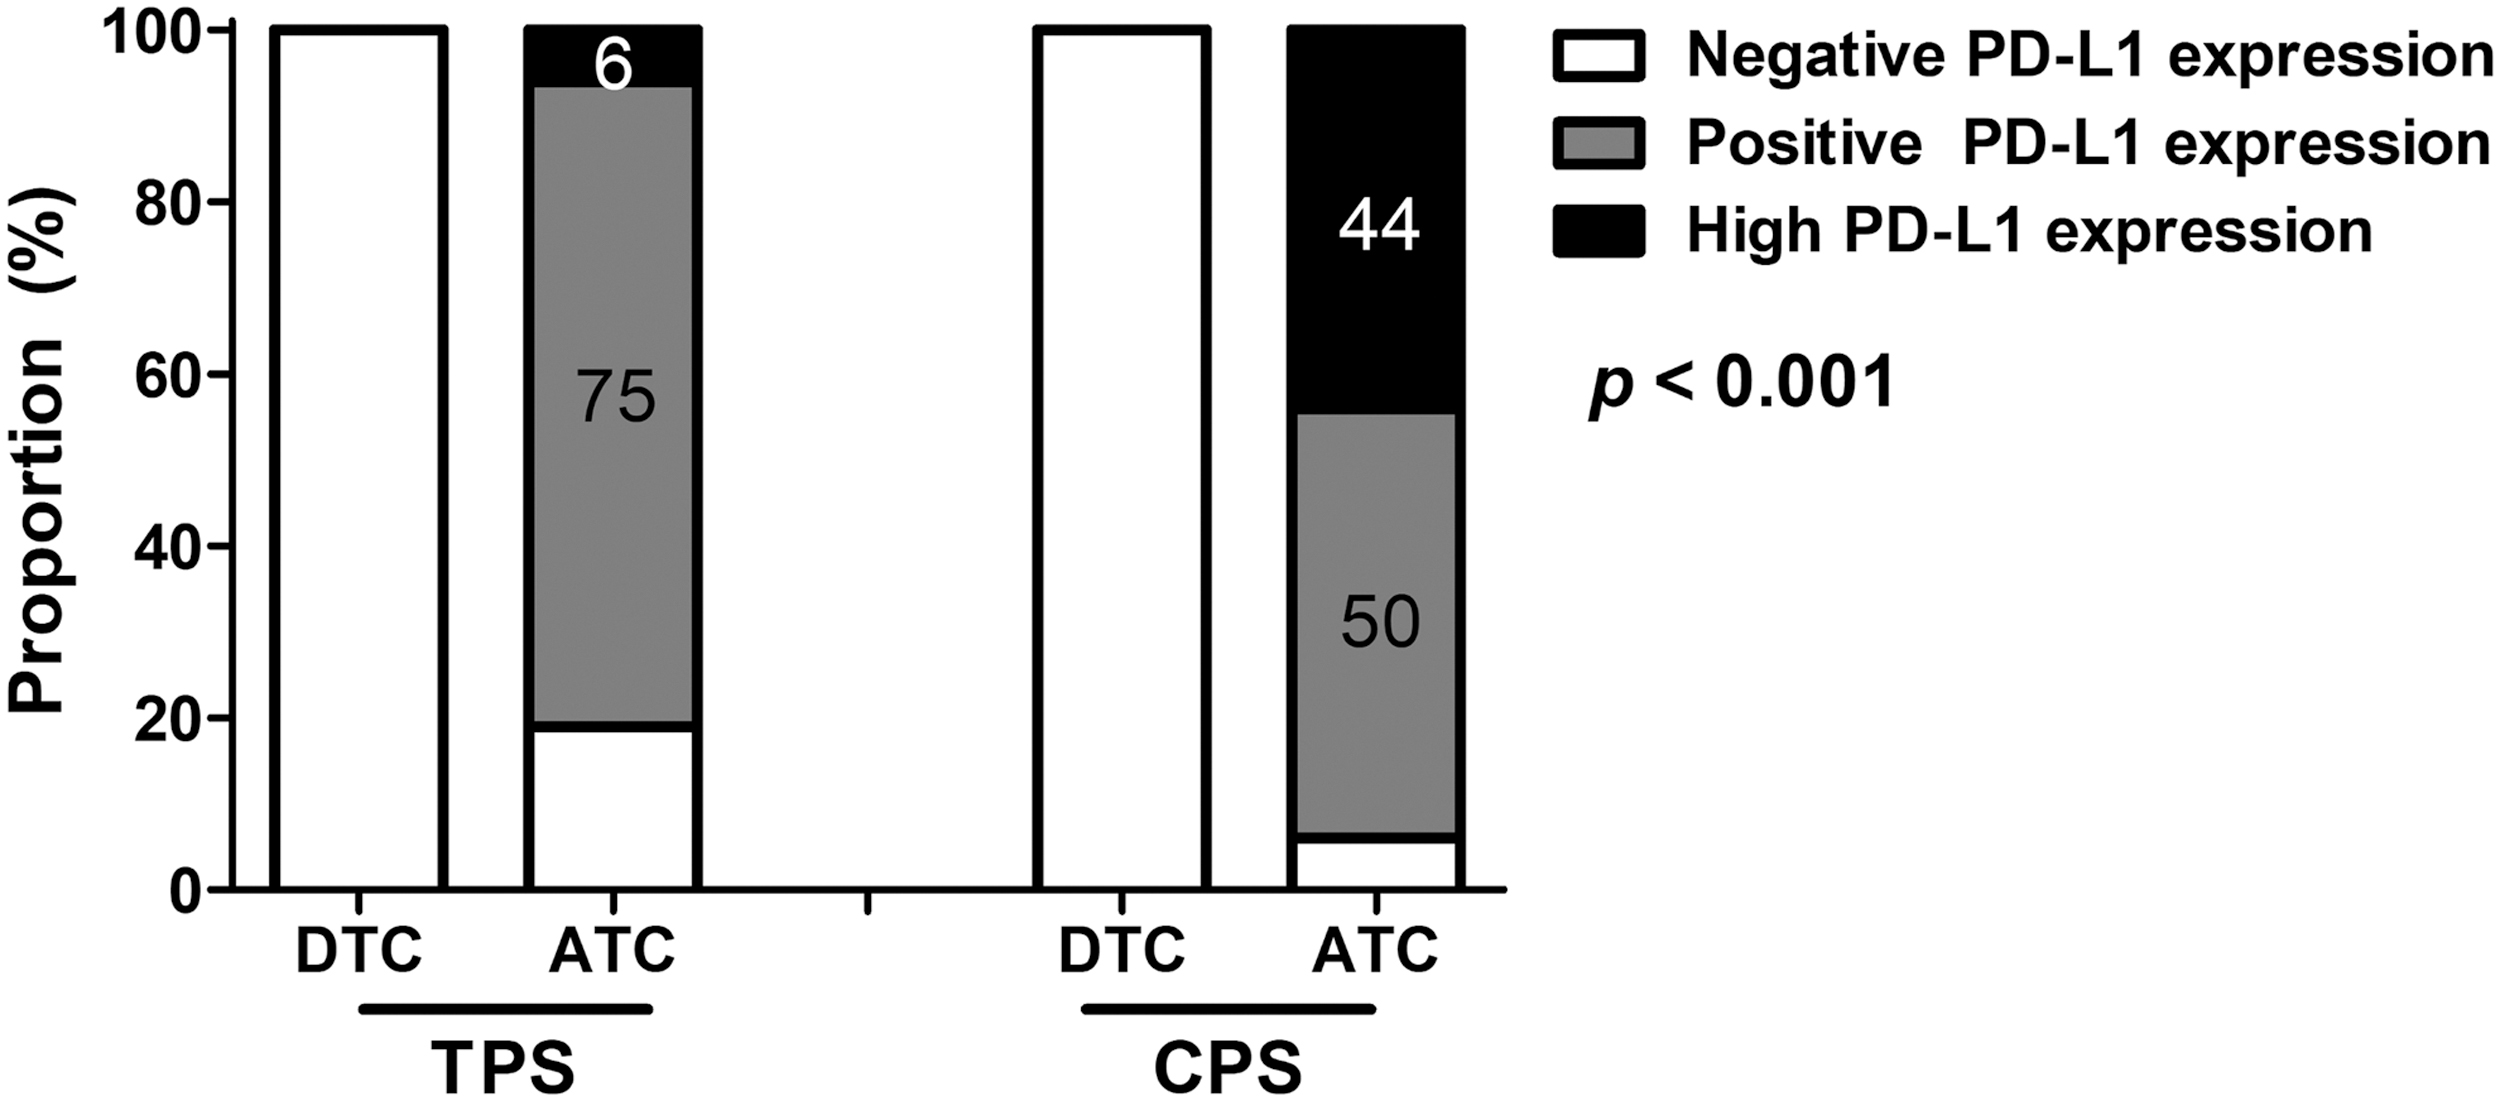
Differences in the TPS and CPS according to pathological subtype. CPS, combined positive score; TPS, tumor proportion score.
Discussion
The present study used F-MIHC and MSI to evaluate the immune profiles of advanced thyroid cancers and focused on PD-L1 expression and lymphocyte infiltration. Our results reveal a significant difference in immune profiles between DTC with distant metastasis and ATC. We found that PD-L1 was rarely expressed and that lymphocyte infiltration was insignificant in DTC. In contrast, most ATC were PD-L1-positive and had significantly more PD-1/PD-L1-positive infiltrating lymphocytes. Because PD-L1 expression is an important predictive biomarker of response to checkpoint inhibitors, our findings suggest that immunotherapy targeting PD-L1 might be an effective strategy for treating ATC.
Several studies have evaluated the PD-1/PD-L1 pathway in ATC. Chintakuntlawar et al. found higher PD-1/PD-L1 expression with poor overall survival in ATC (25). Bastman et al. evaluated immune profiles in advanced thyroid cancers using reverse transcriptase–polymerase chain reaction, flow cytometry, and IHC and found that high levels of PD-L1 are expressed in a subset of patients with ATC (18). Ahn et al. screened PD-L1 expression in 407 samples from patients with primary thyroid cancer using IHC and found that the amount of tumoral PD-L1 expression significantly differed according to the type of cancer, being 6.1–7.6% in DTC and 22.2% in ATC (p < 0.001), with the proportion of PD-L1-positive tumors being the highest in ATC (19). Giannini et al. defined the ATC-like immune phenotype as having more abundant total and T lymphocytes (26). The investigators found an increase in exhausted T lymphocytes with the overexpression of several inhibitory immune checkpoint mediators, referred to as a “hot pathway” (26). The present results indicate higher PD-L1 expression with increased T lymphocyte infiltration in ATC compared with those in DTC with distant metastasis by using F-MIHC and MSI. This methodology is more quantitative and accurate and has the potential application of digital pathology. Overall, our results suggest that immune checkpoint inhibitors that could restore T lymphocyte activities and activate the immune response might be effective as treatment for ATC.
According to both the TPS and CPS, none of the DTC samples included in this study expressed PD-L1. One study found that ∼7% of DTC expressed PD-L1 (19). This difference might have been due to the small number of DTC samples included in our study or the use of antibodies targeting different epitopes (SP142 vs. ElL3N). Furthermore, PD-L1 assays have not been standardized, thus resulting in contradictory findings for PD-L1 expression (19). Moreover, differences between F-MIHC with MSI and conventional IHC could result in inconsistencies because F-MIHC with MSI evaluates selected tissue regions with an evident immune infiltrate and uses average values, whereas conventional IHC does not (27). Although the proportions differ among studies, all have concluded that very little PD-L1 is expressed in DTC. In fact, an anti-PD-L1 inhibitor exerted only minimal antitumor activity, with a 9% overall response rate, in 22 patients with PD-L1-positive advanced DTC (12).
The effects of anti-PD-L1 inhibitors for ATC are not currently being assessed in clinical trials. However, recent studies have introduced a combination of immunotherapy and available kinase inhibitors as a treatment for ATC. A combination of BRAFV600E and anti-PD-L1/PD-1 inhibitors has exerted synergic effects in ATC in mouse models (28). Moreover, a case study has described a patient with BRAFV600E mutation-positive ATC who was successfully treated with vemurafenib followed by nivolumab (11). Iyer et al. showed a median additional gain in overall survival of 7 months by adding salvage pembrolizumab to a kinase inhibitor at the time of progression among patients with ATC (10). However, further clinical studies are needed to confirm the role of anti-PD-L1/PD-1 inhibitors in the treatment of ATC.
Because immunotherapy is being evaluated as a treatment option for thyroid cancer, candidates who are likely to benefit should be carefully selected. The proportion of cells expressing PD-1/PD-L1 in tumor tissues is an important predictive biomarker of the response and treatment outcomes of patients treated with anti-PD-L1/PD-1 inhibitors. Scoring systems have been developed, and the threshold for immunotherapy in both the TPS and CPS is 1 in other types of solid tumors (15,16,23). The TPS represents the ratio (%) of tumor cells expressing PD-L1 relative to all viable tumor cells, whereas the CPS represents the total number of PD-L1-positive tumor and immune cells/100 tumor cells (15). A clinical trial of pembrolizumab for treating non-small-cell lung cancer used TPS ≥1 or ≥50 as an eligibility criterion for patients, and overall survival was significantly longer among patients with TPS ≥50 than among those with TPS <50 (16). A clinical trial of head and neck squamous cell carcinoma treated with pembrolizumab found significantly longer progression-free survival among patients with cancer who had CPS of ≥1 or TPS of ≥50 compared with a group provided with standard treatment (29). In another clinical trial, patients with head and neck squamous cell carcinoma had the lowest hazard ratio for overall survival and the longest overall survival in patients with CPS ≥20 treated with pembrolizumab and chemotherapy (23). The present study evaluated the TPS and CPS in advanced thyroid cancer and found that all DTC had TPS and CPS of <1, whereas 81% and 94% of ATC, respectively, had TPS and CPS of ≥1. Furthermore, higher TPS (≥50) and CPS (≥20), which are associated with immunotherapeutic effectiveness, were identified in 6% and 44% of ATC, respectively.
Tumors with a higher mutational burden are more likely to respond to immunotherapy. However, the association between specific somatic mutations and responses to immunotherapies remains unclear (30 –33). Our results are consistent with a previous finding that the BRAFV600E mutation is not associated with PD-L1 expression in advanced thyroid cancer (18). For the association between PD-L1 expression and TERT promoter mutation, a previous study did not identify a significant association between PD-L1 expression in thyroid cancers and TERT promoter mutations (19), but the result of the current study shows significant association. The previous study included primary thyroid cancers at the early stages, whereas we included only patients with advanced thyroid cancer in the current study. However, the exact mechanism underlying the association between a genetic mutation and PD-L1 expression remains unclear. Since most TERT promoter mutations were identified in ATC, this mutation might be characteristic of ATC. Further studies are needed to evaluate the association between the TERT mutation and PD-L1 expression.
HT often coexists with DTC and is associated with a good prognosis in such patients (34). Two of our patients had ATC with HT. Although regions with lymphocytic thyroiditis were excluded when we selected regions for analysis, the two samples with coexisting HT had high lymphocyte infiltration and positive PD-L1 expression according to both the TPS (1.16 and 1.08) and CPS (13.0 and 1.65). Due to the small number of samples, coexisting HT was not significantly associated with PD-L1 expression. Further studies are needed to clarify relationships between coexisting HT and PD-L1 expression.
This study has several limitations. Selection bias cannot be excluded because of its retrospective nature and small sample size. We evaluated only six among many cell surface molecules that probably play important roles in the tumor microenvironment and cancer immunity. We analyzed the immune profiles of primary, and not metastatic tumors, which might differ from those at the primary site. Furthermore, the interval was quite long between primary tumor resection and the development of metachronous distant metastases in some patients with DTC, which could be associated with changes in tumor immune profiles. Nevertheless, this study characterized the immune profiles of advanced thyroid cancers and our findings suggest that immunotherapies targeting the PD-L1 pathway might be effective for treating ATC.
Analysis of the tumor microenvironment is a fundamental step in uncovering the details of tumor–host interactions that can lead to the development of novel therapies (7,8). The immunological phenotypes of cancer can be distinguished based on the presence or absence of various immune cells, and such findings have generated candidates for immunotherapy (26,35). Both F-MIHC and MSI have been validated as tools for tumor tissue immune profiling, allowing the analysis of several targets in the same tissue section (20). We applied a panel of six cell surface molecules per tissue section to evaluate immune profiles and focused on lymphocytes, especially PD-L1. Many immune cell biomarkers can be evaluated using only two or three tissue sections if the multiplex panel is applied to immune profiling. The F-MIHC detected by MSI with the panel of several cell surface molecules could become a novel method for the development of predictive biomarkers for cancer immunotherapy.
In conclusion, the immune profile obtained by using F-MIHC and MSI revealed significant differences between ATC and DTC with distant metastasis, particularly regarding lymphocyte infiltration and PD-L1 expression. Infiltrating lymphocytes were significantly more abundant, and PD-L1 expression was higher in ATC compared with DTC, suggesting that immunotherapies targeting PD-L1 might be effective against ATC. Likewise, analyzing immune profiles using F-MIHC and MSI could provide invaluable information regarding the tumor microenvironment and help select candidates for immunotherapy.
Footnotes
Author Disclosure Statement
No competing financial interests exist.
Funding Information
This study was supported by the Bumsuk Academic Research Fund in 2018.
Supplementary Material
Supplementary Figure S1
Supplementary Figure S2
Supplementary Table S1