
Abstract
Background:
The monocarboxylate transporter 8 (Mct8) protein is a primary thyroxine (T4) and triiodothyronine (T3) (thyroid hormone [TH]) transporter. Mutations of the MCT8-encoding, SLC16A2 gene alter thyroid function and TH metabolism and severely impair neurodevelopment (Allan-Herndon-Dudley syndrome [AHDS]). Mct8-deficient mice manifest thyroid alterations but lack neurological signs. It is believed that Mct8 deficiency in mice is compensated by T4 transport through the Slco1c1-encoded organic anion transporter polypeptide 1c1 (Oatp1c1). This allows local brain generation of sufficient T3 by the Dio2-encoded type 2 deiodinase, thus preventing brain hypothyroidism. The Slc16a2/Slco1c1 (MO) and Slc16a2/Dio2 (MD) double knockout (KO) mice lacking T4 and T3 transport, or T3 transport and T4 deiodination, respectively, should be appropriate models of AHDS. Our goal was to compare the cerebral hypothyroidism of systemic hypothyroidism (SH) caused by thyroid gland blockade with that present in the double KO mice.
Methods:
We performed RNA sequencing by using RNA from the cerebral cortex and striatum of SH mice and the double KO mice on postnatal days 21–23. Real-time polymerase chain reaction was used to confirm RNA-Seq results in replicate biological samples. Cell type involvement was assessed from cell type-enriched genes. Functional genomic differences were analyzed by functional node activity based on a probabilistic graphical model.
Results:
Each of the three conditions gave a different pattern of gene expression, with partial overlaps. SH gave a wider and highest variation of gene expression than MD or MO. This was partially due to secondary gene responses to hypothyroidism. The set of primary transcriptional T3 targets showed a tighter overlap, but quantitative gene responses indicated that the gene responses in SH were more severe than in MD or MO. Examination of cell type-enriched genes indicated cellular differences between the three conditions.
Conclusions:
The results indicate that the neurological impairment of AHDS is too severe to be fully explained by TH deprivation only.
Introduction
The permeability of the cellular plasma membrane to thyroid hormones (TH: the prohormone thyroxine [T4], and the active hormone triiodothyronine [T3]) is facilitated by integral membrane proteins (1,2). Two of these proteins are primary TH transporters, the monocarboxylate transporter 8 (MCT8, encoded by SLC16A2) and the organic anion transporting polypeptide 1C1 (OATP1C1, encoded by SLCO1C1).
MCT8 transports T4 and T3, and in the brain is present in neural cells, microvessels' endothelial cells, and choroid plexus (3). MCT8 is crucial for TH transport through the blood–brain barrier (BBB) (4,5). SLC16A2 mutations cause X-linked Allan-Herndon-Dudley syndrome (AHDS) (6 –9). AHDS is characterized by severe neurological impairment starting at an early age, and by characteristic changes of circulating TH. The histopathology of affected individuals shows signs of fetal-onset cerebral hypothyroidism (10).
OATP1C1 has high affinity for T4 and rT3, with negligible transporter activity for T3 (11,12). OATP1C1 is also present in the microvessels' endothelial cells, choroid plexus, and some neural cells, including radial glia and astrocytes (13,14). OATP1C1 appears involved in the influx of T4 to glial cells, facilitating the type 2 deiodinase (DIO2)-dependent generation of T3. A neural degeneration syndrome due to SLCO1C1 mutation has recently been described (15).
Slc16a2 knockout (KO) mice present alterations of TH metabolism as in AHDS without neurological impairment. In these mice exogenous T4, but not T3 is active in the brain, and T4 activity is suppressed by Dio2 inactivation (4). Mct8 deficiency is compensated by Dio2 activity, since gene expression in the Mct8-deficient brain falls into the hypothyroid range when Dio2 is inactivated (16). The compensating role of Oatp1c1, by preserving T4 transport, has been demonstrated by showing that double Slc16a2/Slco1c1 KO mice have profound brain hypothyroidism (17).
A difference between human and mice is that OATP1C1 concentration in the human BBB is much lower than in mice BBB (3,18). The Slc16a2/Slco1c1 KO, lacking T4 and T3 transport through the BBB is a more faithful model of AHDS than the single Slc16a2 KO, as is the double Slc16a2/Dio2 KO (19) lacking T3 transport and DIO2 activity.
In this article, we compared gene expression profile in hypothyroidism restricted to the brain with that caused by systemic hypothyroidism (SH). Brain hypothyroidism was induced by knocking out Slc16a2/Dio2 (abbreviated as MD) (16,19,20) or Slc16a2/Slco1c1 (abbreviated as MO) (17). SH was induced by thyroid blockade. The results show unexpected differences between the three mouse models and raise novel questions on the pathophysiology of TH transport and deiodination in the brain.
Methods
Animals
Animal procedures were approved by the local animal welfare authorities (permit #SAF2017-86342-R, Consejo Superior de Investigaciones Cientificas, Spain, and permit ID: 84-02.05.40.14.139; LANUV, Recklinghausen, Germany). Animals were housed in temperature (22°C ± 2°C) and light (12-hour light, 12-hour dark cycle)-controlled conditions with food and water ad libitum. All experiments were performed with male mice.
Slc16a2y/−Dio2−/− (MD) mouse model
Slc16a2 +/− mice (MGI: 3687950) (21) were crossed with Dio2 −/− mice (MGI: 2182450) (22), and Slc16a2 +/− Dio2 −/− female mice were mated with Dio2 −/− male animals to produce Slc16a2 −/y Dio2 −/− male offspring. Wild type (WT) animals generated by heterozygous Slc16a2 +/− breeding pairs served as controls. Genotyping was conducted as previously described (16). The MD mice show reduced T3 in the cortex and striatum, with normal T4 concentrations in both regions (19).
Slc16a2−/yOatp1c1−/− (MO) mouse model
Slc16a2 +/− mice (MGI: 5308446) (23) were crossed with Slco1c1 −/− mice (MGI: 3710233) (24), and Slc16a2 +/− Slco1c1 −/− female mice were mated with Slco1c1 −/− male animals to produce Slc16a2 −/y Slco1c1 −/− male offspring. WT animals generated by heterozygous Slco1c1 +/− breeding pairs served as controls. Genotyping was conducted as previously described (17). T3 and T4 content in forebrain homogenates of three-week-old MO mice was reduced to ∼10% of WT values (17).
SH was induced in WT male mice of the C57BL/6J strain by the administration of 0.02% 1-methyl-2-mercapto-imidazole (MMI, Sigma Chemical Co., St. Louis, MO) plus 1% KClO4 in the drinking water ad libitum during pregnancy and lactation starting from E9. This treatment caused an 80% reduction of cortical T3 from 16 pg/mg protein in the WT to 3.4 pg/mg protein in the SH, and extremely low levels of liver Dio1 expression.
Transcriptomic procedures
We used the whole cortex and striatum of seven P21 MD mice, seven P21 SH mice, and six P22–P23 MO mice. For MD and SH mice, we used different WT mice (WT1, seven P21mice), than for MO (WT2, five P23 mice) as the MO were of a different background than the MD and SH. The pups were euthanatized by decapitation. The cerebral cortex and striatum were rapidly dissected out, frozen on dry ice, and kept at −80°C. RNA-Seq was performed at the facilities of Centro Nacional de Investigaciones Cardiovasculares (CNIC, Instituto de Salud Carlos III, Madrid, Spain), as previously described (25,26). The RNA-Seq data have been deposited in the NCBI Gene Expression Omnibus (GEO) and are accessible through GEO Series accession number GSE155185,
Real-time polymerase chain reaction (PCR) was performed on TaqMan® low-density arrays (Applied Biosystems) format 48a (P/N 4342253), as previously described (26). Gene expression values were normalized by using as reference genes Slc25a3, Hnrnpu, Psap, Tspan7, and Kif5a. These genes were selected by using the NorMean method, which allows selecting the best set of housekeeping genes for different experimental conditions (27). Then, a normalization factor was calculated by using the geometric mean of the expression values of the genes selected.
The dataset of T3 transcriptional targets was from previous studies, identifying genes responsive to T3 in the presence of cycloheximide in primary neural cell cultures (26,28). The dataset of cell type-enriched genes used was from the study by Zhang et al. (29).
Probabilistic graphical models and functional node activities
Functional node analysis was used to detect functional differences between the conditions. This analysis uses a probabilistic graphical model (PGM) (30). From the 16,261 cortex transcripts and 16,058 striatal transcripts, with 15,637 overlapping genes, we identified a limited set of 2000 genes with the highest variability combining all experimental groups. A PGM was built by using the Rv3.2.5 and grapHD package (31), and expression data without a priori information (Supplementary Fig. S1). The resulting network was split into several branches, and gene ontology analysis was performed by using the DAVID web tool selecting Mus musculus as background, and GO TERM, KEGG and Biocarta categories (32). Functional node activities were calculated as the mean expression of the node genes related to the main function assigned to the node. Comparisons between node activities were done by the nonparametric Kruskal Wallis test and Mann Whitney test using GraphPad Prism 7 (San Diego, CA).
Results
Gene expression patterns in cerebral hypothyroidism
In a preliminary analysis, we selected all the differentially expressed (DE) genes with false discovery rate (FDR) <0.05 and log2FC >0.4 or < −0.4 (±34% change, Supplementary Data S1). SH changed the expression of 2688 genes in the cortex and 2702 in the striatum (Fig. 1A). MD and MO showed partial overlap with SH. This might be due to a mice strain-related effect, but comparisons between WT1 (control for SH and MD) and WT2 (control for MO) showed no differences in 90% striatal and 93% cortical SH-related genes.

DE genes in the cortex and striatum. (
Assuming that SH caused the strongest degree of cerebral hypothyroidism, the DE genes in MD or MO not overlapping with SH were not related to TH action. They might represent nonspecific effects of genetic manipulations on early embryonic development. Comparing the cerebral hypothyroidism in the three conditions was better accomplished while analyzing the effects of MD, and MO on the expression of all SH genes. Of the 2688 genes sensitive to SH in the cortex, 799 genes were exclusive to SH. The rest were also sensitive to MO and MD (FDR <0.05), with an overlap of 1146 genes in both conditions (Fig. 1B). Similar results were obtained for the striatum. Figure 1C shows the distribution of DE genes in the cortex or striatum (gray columns), and common to both regions (dark columns). The lack of complete overlap between the two regions may be due to their different cellular composition.
These results were confirmed by real-time PCR assays using different groups of animals (Fig. 2A–D). In panel A, the set responding to all conditions includes known T3 targets: Hr, Sema7a, Pvalb, Gadd45a, Kcnc1, Cirbp, or Nov. In panel B, genes with altered expression in SH and MO but unchanged in MD, such as Aldh1a1, are shown (16,17). In panel C, genes with unchanged expression in MO and altered expression in SH and MD are shown. Panel D shows genes with altered expression in SH and unchanged in MD or MO.
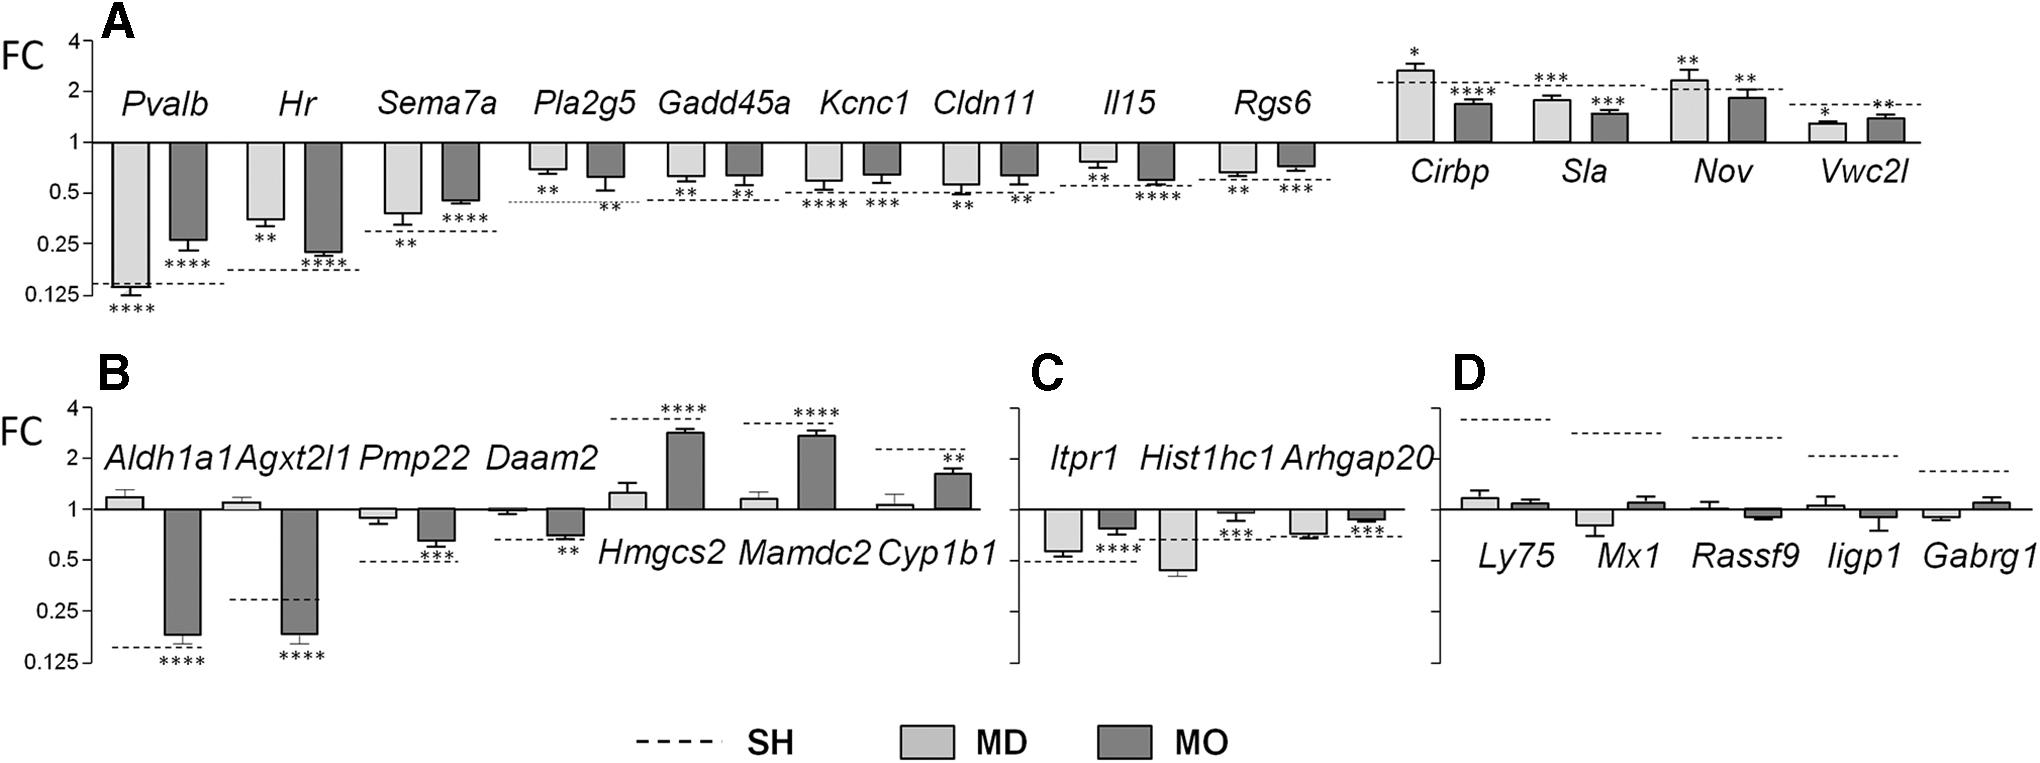
Different patterns of gene expression confirmed by real-time PCR in biological replicates, that is, different groups of mice than used for RNA-Seq. (
The results show differences between the cerebral hypothyroidism of each condition. In particular, DE genes restricted to SH might represent indirect effects of whole-body hypothyroidism. This is supported by the effects of each condition on a set of primary targets of T3 (26,28). Of all the genes DE in SH, 169 genes in the cortex and 175 genes in the striatum are transcriptional targets (Fig. 1D and Supplementary Data S2). Most were present in the set of genes overlapping with MO and MD (71% in the cortex and 65% in the striatum). Further, of the 74 genes common to both regions, 85% were present in this set.
This common set of 74 genes allowed regional comparisons of the effects of each condition (Fig. 3, upper panel). In the SH cortex, 42 genes had a fold change (FC) <1, representing genes upregulated by T3. Eleven genes had an FC >1, representing genes downregulated by T3. Most genes were either positive or negative in the two regions and all conditions. One exception was Cyp26b1, which was positive in the cortex and negative in the striatum, in the SH and MD groups.

Expression of transcriptional targets of T3 in the cortex and striatum. The upper panel shows the correlation of genes common to the cortex (red dots) and striatum (black squares) in each of the conditions. The Pearson correlation coefficients were 0.763 for SH, 0.825 for MD, and 0.793 for MO. Cyp26b1 is shown, because it is a downregulated gene in the striatum in SH and MD but an upregulated gene in the cortex. Dio3 shows a strong downregulation in MO in the striatum. The lower panel shows the expression of all transcriptional genes in the cortex and the striatum. SH (black dots), MD (blue squares), and MO (red triangles). Given the different mouse strains, we used a distinct cohort of WT mice for SH and MD, and another cohort of WT animals for MO. First, we selected the genes DE in SH with FDR <0.05 and log2FC >0.6 or < −0.6. Then, we plotted the expression of these genes in SH, MD, and MO.
The lower panel of Figure 3 shows the comparison of all the transcriptionally-regulated genes in the cortex and the striatum in the three conditions. The genes were ordered in the graph by increasing the value of expression in the SH group. In general, the distribution of individual genes in the MD and MO conditions indicated that SH induced a stronger effect on gene expression than MD or MO.
Cellular and functional differences in different forms of hypothyroidism
The previous observations indicate that the brain hypothyroidism caused by transporter deficiency may not be equivalent to that caused by thyroid gland blockade. Differences in gene expression may be translated into cellular and/or functional differences.
To analyze cellular differences, we examined the distribution cell type-enriched genes in each condition. The starting set was the top 500 genes most enriched in endothelial cells, microglia, neurons, astrocytes, and oligodendrocytes (29). We looked for the presence of these genes in the SH only set, and the MD, MO, and MD+MO sets overlapping with SH (Fig. 4 and Supplementary Data S3).
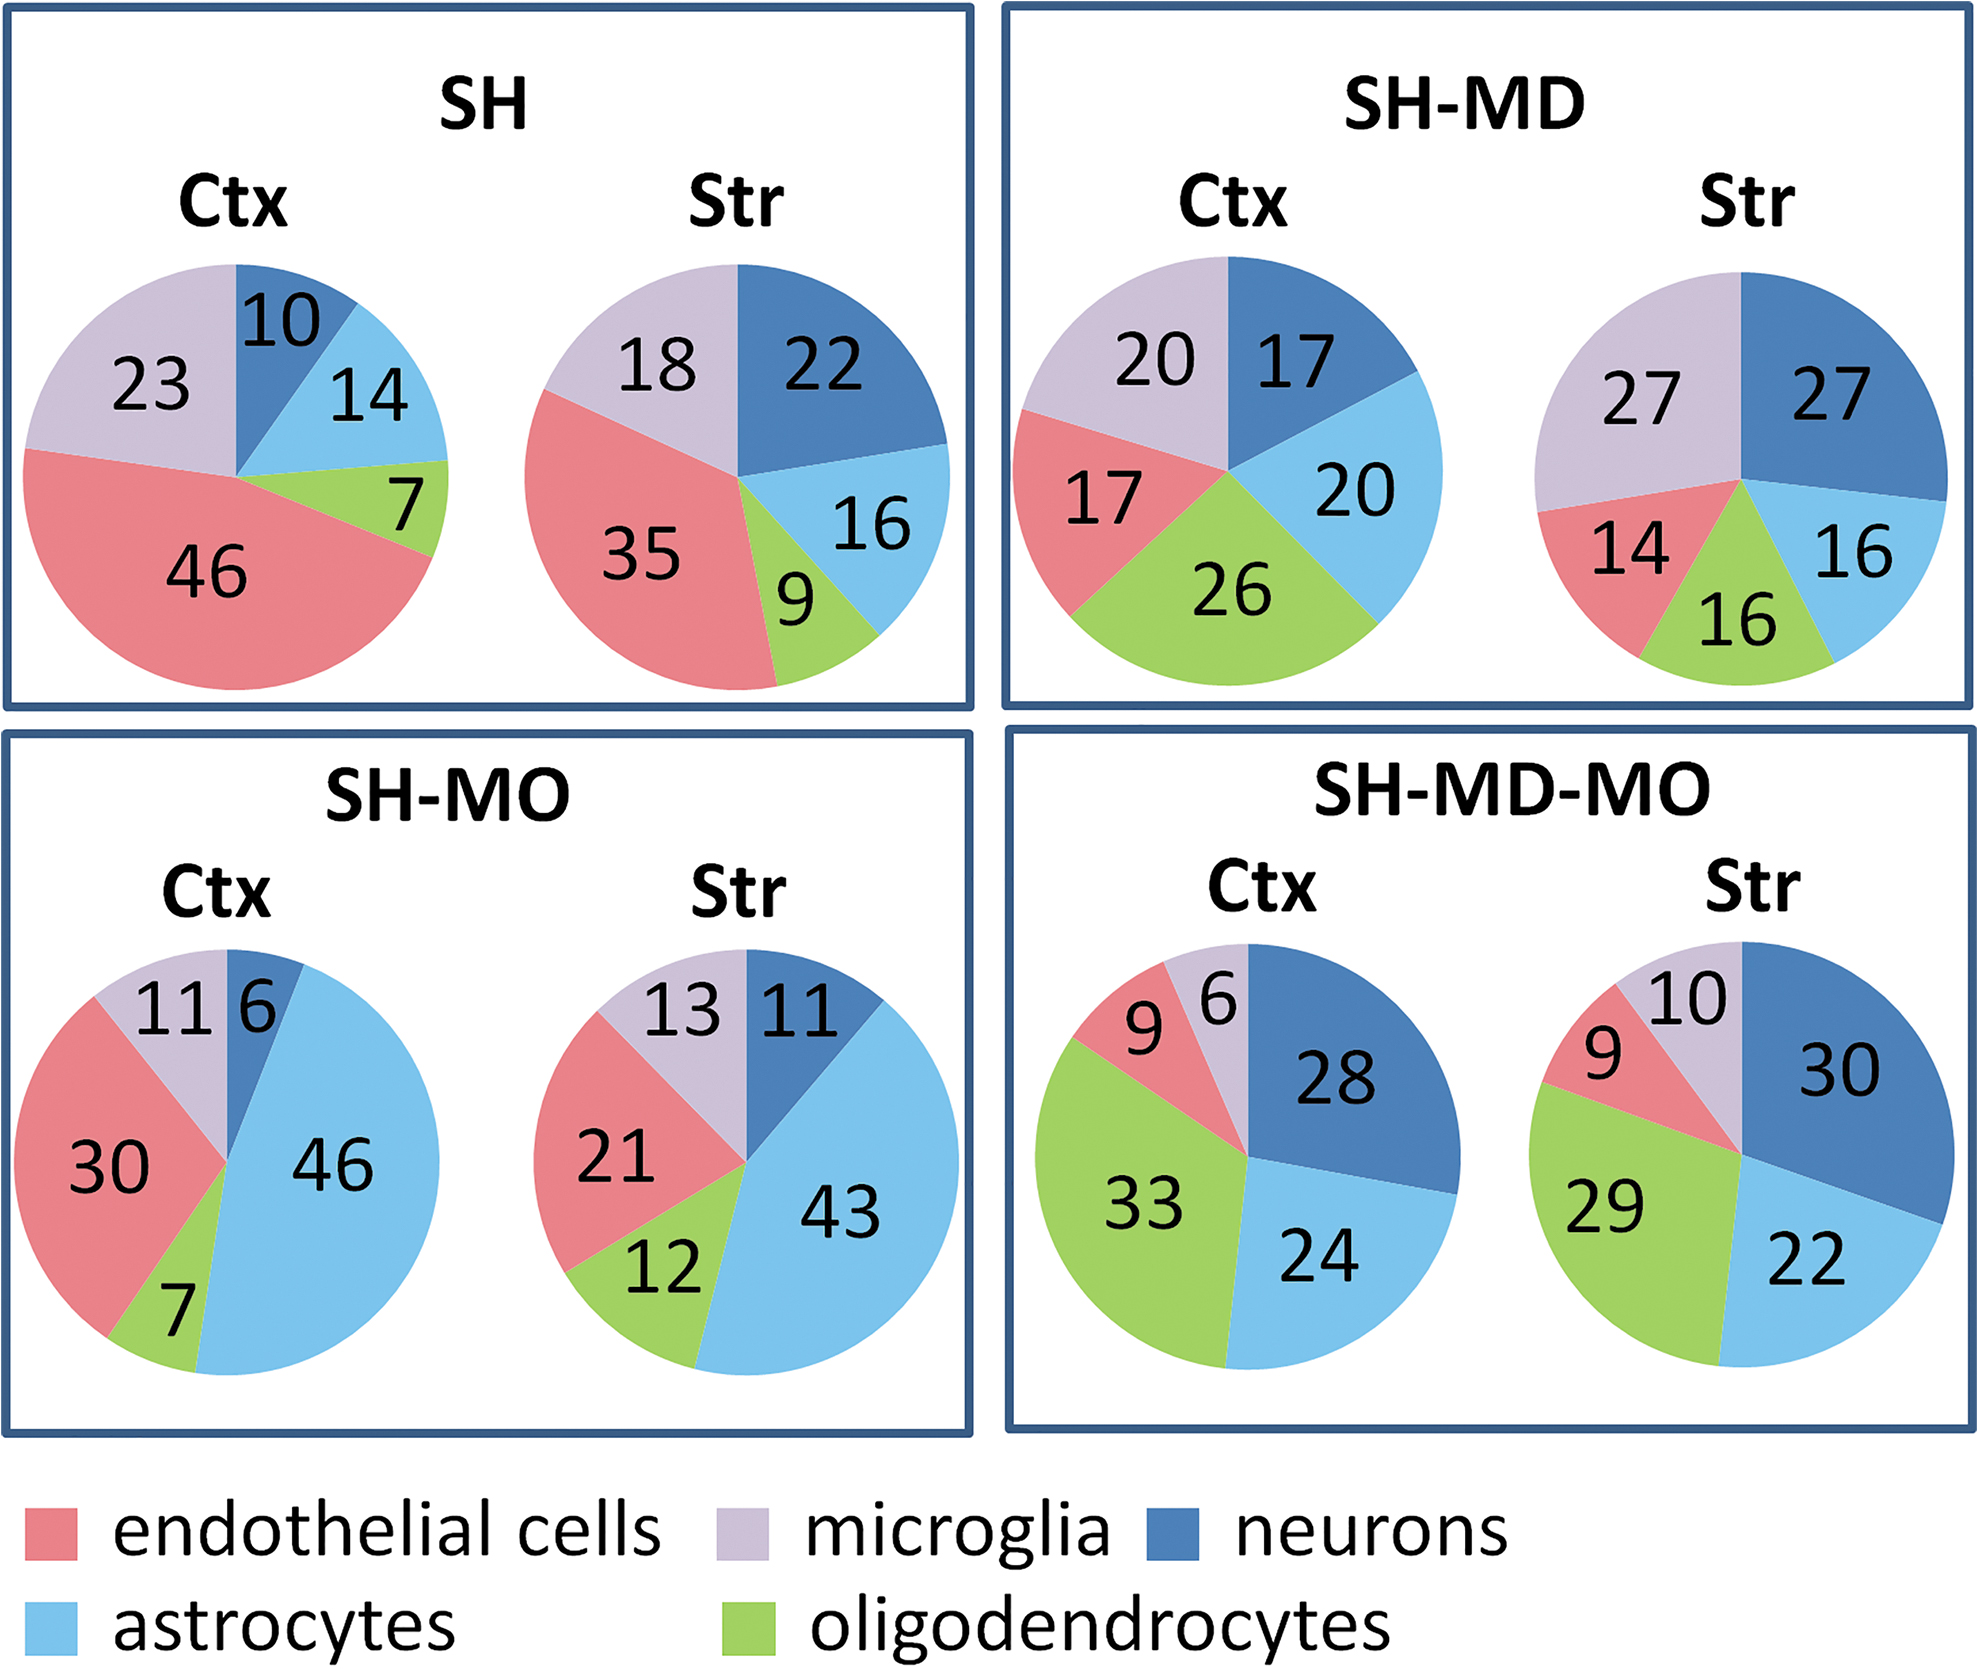
Proportion of genes enriched in specific cell types that were DE. SH: genes affected by systemic hypothyroidism only. MD: genes affected by Mct8 and Dio2 deficiency from the set of SH-dysregulated genes. MO: genes affected by Mct8 and Oatp1c1 deficiency from the set of SH-dysregulated genes. Cell type-enriched genes were those genes present in the list of the top 500 genes enriched in specific cell types. Shown are the proportions of each cell type from the enriched genes.
In SH only, the endothelial cells were the largest compartment (46% in the cortex and 35% in the striatum), in MO the astrocyte-enriched genes (46% in the cortex and 43% in the striatum), in MD all cellular components were similarly affected (25–20%), and in MD+MO, the neuronal, astrocyte, and oligodendrocyte components accounted for 80% of the cells.
To analyze functional differences, we used functional node analysis. This revealed that the 2000 most variable genes were grouped into 7 functional nodes (Fig. 5 and Supplementary Fig. S1): (i) Membrane, (ii) MAPK, (iii) synapse, (iv) ion transport, (v) cytoskeleton and cell cycle, (vi) immune, and (vii) myelin. For each condition, the activity of each node is calculated as the mean expression of the genes present in the node.
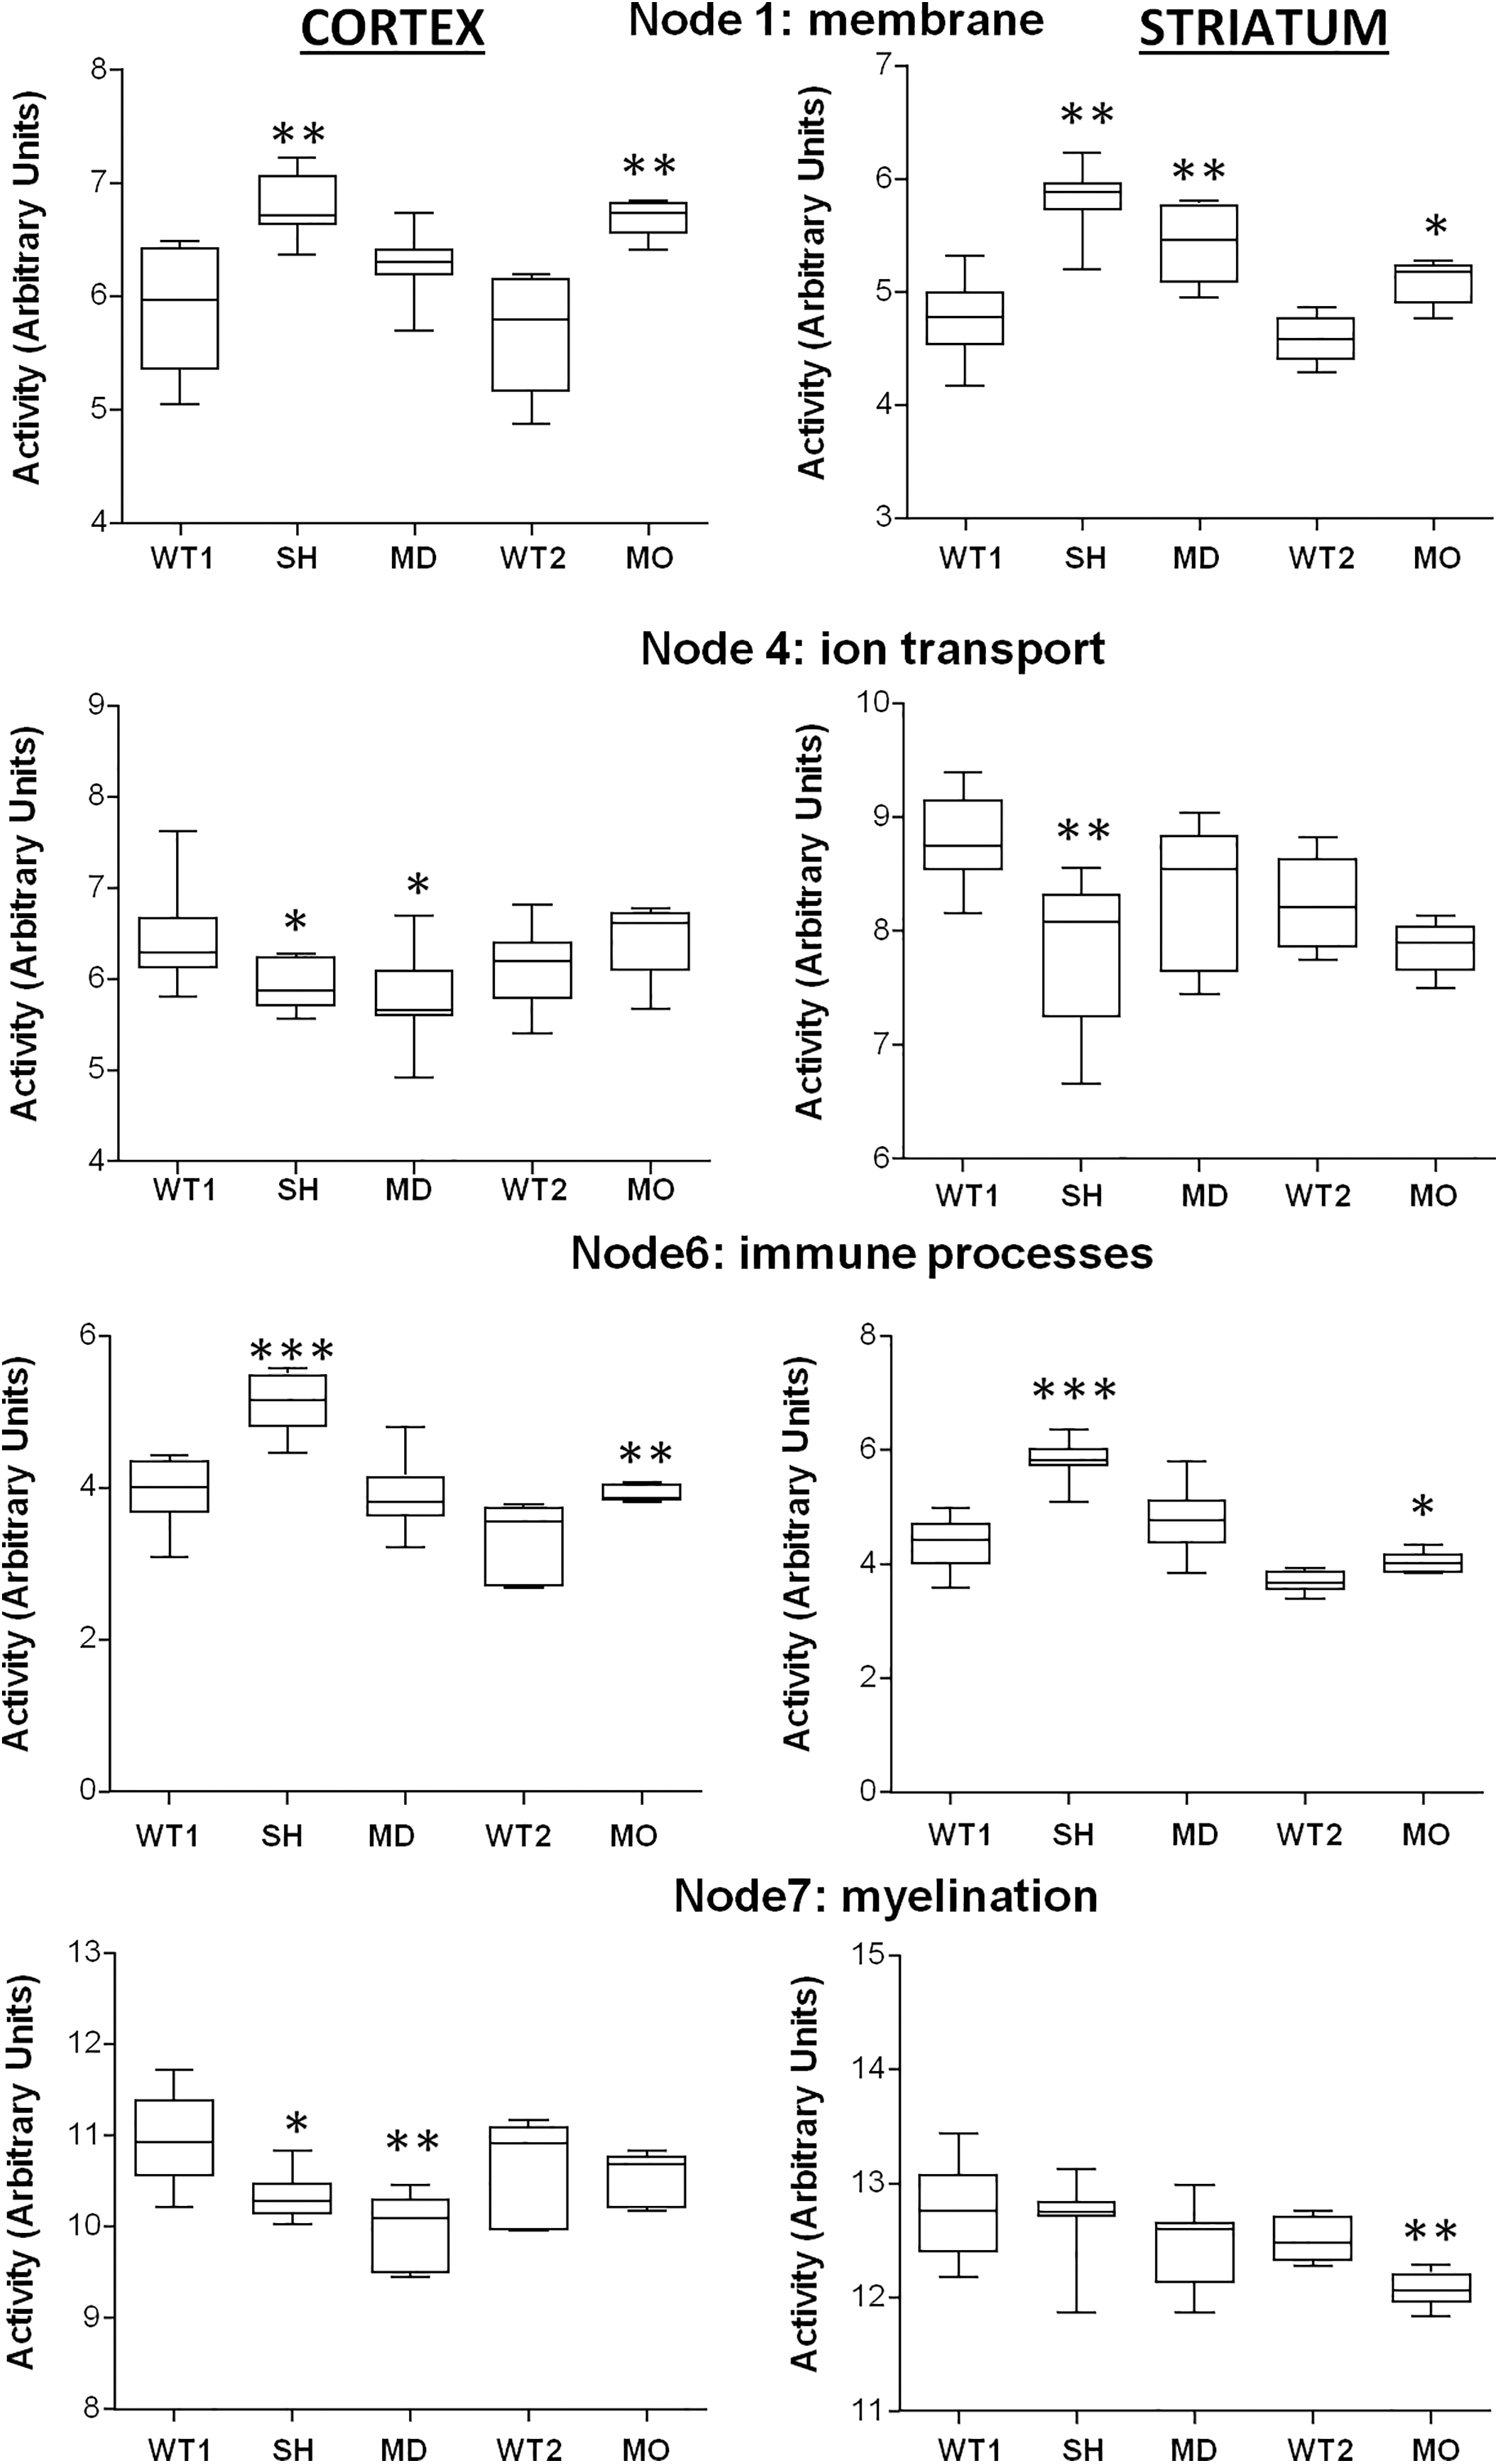
Probabilistic graphical node analysis. Comparisons of functional node activity in all conditions: SH; MD; MO; WT1: control wild type mice for SH and MD; WT2: control wild type mice for MO. Nodes 2 (MAPK), 3 (synapse), and 5 (Cytoskeleton and Cell Cycle) did not show differences among the conditions and are not represented. Node activity was calculated for each condition as the mean expression of the genes present in the node. SH and MD were compared with WT1 and MO with WT2. Box-and-whisker plots are Tukey boxplots. All p-values were two-sided, and p < 0.05 was considered statistically significant. *p < 0.05; **p < 0.01; ***p < 0.001.
This analysis shows differences in the direction of change of node activity. One condition may alter the expression of genes to upregulate or downregulate them. The resulting node activity depends on the balance between up- and downregulation. Therefore, the lack of statistical differences of one given node between a condition and the WT does not necessarily mean that the specific process represented by the node is not influenced by that condition. It means that the balance between up- and downregulation has been maintained at a similar value.
The strongest changes in node activity were induced by SH, affecting nodes 1, 4, and 6 in the cortex and striatum, and node 7 in the cortex. MD and MO also changed some of these nodes but were often limited to one of the regions. Node 1 (membrane) activity was increased in the cortex and striatum by SH and by MO. MD also showed increased activity of this node but only in the striatum. Node 4 (ion transport) was also decreased by SH in the cortex and striatum. MD also showed a decrease but only in the cortex, and MO did not show differences. Node 6 (immune processes) increased in SH and MO in the cortex and striatum, and MD showed no changes. Node 7 (myelin) was decreased in the cortex of SH and MD and in the striatum by MO.
Discussion
The pathogenesis of the neural manifestations of AHDS is unclear. Given the critical role of MCT8 for the transfer of T4 and T3 through the BBB (3 –5,21,22), MCT8 deficiency should lead to generalized brain hypothyroidism. Pathological findings in a GW30 AHDS fetus are, indeed, compatible with this hypothesis (10). Nonetheless, it is unclear whether the cerebral hypothyroidism is so severe as to cause the profound neurological impairment of AHDS. In fact, the half normal concentrations of T4 and T3 found in the brain of the fetus indicate that the block of TH transport is not complete. Recent studies in human fetuses show that OATP1C1 is low in the BBB but abundant in other brain barriers such as the choroid plexus, leptomeningeal cells, and vessels of the subarachnoid space (13). In the absence of MCT8, T4 may have access to the brain through these alternative routes.
In mice, the single inactivation of Mct8 is not sufficient to cause cerebral hypothyroidism and neurological impairment, due to increased production of local brain T3 (20,21,23). The double inactivation of Mct8 and Dio2 (MD mice), or Mct8 and Oatp1c1 (MO mice) disrupts these compensating mechanisms (16,17,20). In either case, limited gene expression analysis indicated that T3-dependent gene expression becomes similar to that of hypothyroid mice (16,17). Thus, the double KO may be considered as mouse models of AHDS.
The question we asked was to what extent the MD and MO mice have similar brain hypothyroidism, and how they compare with SH. Gene expression analysis showed no overlap between the three conditions. We found changes of gene expression in MD and MO not present in SH. These should be TH-independent, possibly due to nonspecific effects of knocking down from early embryonic development, and were not investigated further.
To focus on TH-related effects, we performed an analysis using the MO and MD genes that significantly changed within the whole set of SH genes. Still, there was no complete overlap between the three conditions. It was surprising that up to 30% of the genes with expression changes in SH were insensitive to MD or MO.
One possible explanation is that the MMI used to induce SH was able by itself to induce changes in brain gene expression unrelated to hypothyroidism. To address this question, a study would require gene expression analysis on mice rendered hypothyroid with different protocols.
However, the more likely explanation is that the unique effects of SH on brain gene expression represent indirect effects of hypothyroidism. This is supported by the distribution of the transcriptional T3 targets, which were largely present in the MD and MO gene sets. One first conclusion that might be drawn from these observations is that Mct8 and Oatp1c1 appear to account for most of brain T4 and T3 transport (33), at least at the brain barriers.
Comparing the relative quantitative effects of SH, and MO or MD on the transcriptional genes common to the three conditions, the cerebral hypothyroidism in SH was more severe than in MD or MO. In line with this, the functional node analysis showed that SH had more extensive alterations than MD or MO. These results indicate that the neurological impairment of MCT8 deficiency is due to additional factors on top of cerebral hypothyroidism. These factors may be related to the cells primarily affected as targets of TH and/or to the route of entry and distribution of T4 and T3 into the brain.
Examination of the cells involved in the cerebral hypothyroidism caused by the three conditions revealed important features. In SH-only, there is predominant involvement of endothelial cells, in agreement with the role of TH in vessel development (34), and of microglia, in agreement with the immunity node activity, which suggests neuroinflammation. In MO, nearly 50% of cell involvement is astrocytic, at least twice than that in MD or MD+MO, which could be related to the block of T4 transport from the circulation to the astrocytes. In MD, this pathway is intact and T4 may presumably accumulate in the astrocytes in the absence of Dio2 activity. Should T4 have intrinsic genomic activity (35 –37), its increased concentration in the astrocytes could maintain normal expression of astrocyte-enriched genes, such as Aldh1a1, Daam2, Mamdc2, Abcd2, Baalc, Gli2, Sorl1, and Megf10. This was previously observed (16) and was confirmed in the current study (Fig. 2).
These observations suggest to us that the neurological impairment in MCT8 deficiency is due not only to cerebral hypothyroidism but also due to other factors dependent on species differences in cortex development and architecture (38). In MCT8 deficiency, low SLCO1C1 expression in the BBB likely alters the T4 route to reach the DIO2-expressing cells (13), especially the radial glia, a primary progenitor of neural stem cells (39). This could lead to disruption of the delicate balance regulating the timing of T3 action on different cellular targets during a critical period of neurogenesis.
Footnotes
Acknowledgments
The authors acknowledge Drs. Valerie Anne Galton and Samuel Refetoff for providing the Dio2 and Slc16a2 knockout mice, respectively. The authors confirm that the research described in this article meets the ethics guidelines and adheres to the legal requirements of Spain and Germany.
Authors' Contributions
B.M.: Contributed to experimental strategy, performed all bioinformatics studies, raised funds, and contributed to the writing of the article.
P.G.-I.: Performed animal manipulations, tissue dissection, and all general laboratory procedures.
H.H.: Generated the Mct8/Oatp1c1 KO mice, raised funds, and contributed to the writing of the article.
J.B.: Conceived and designed the study, raised funds, supervised BM and PG-I, and wrote the article.
Author Disclosure Statement
No competing financial interests exist.
Funding Information
This work was supported by the Center for Biomedical Research on Rare Diseases, Instituto de Salud Carlos III, as well as the BMBF under the framework of E-Rare-2, the ERA-Net for Research on Rare Diseases (project acronym THYRONERVE). It was also supported by grant #SAF2017-86342-R (Programa Estatal de Investigacion, Desarrollo e Innovación Orientada a los Retos de la Sociedad) and by Fundación Inocente, Inocente. The cost of this publication has been paid in part by FEDER funds.
Supplementary Material
Supplementary Data S1
Supplementary Data S2
Supplementary Data S3
Supplementary Figure S1