
Abstract
Background:
Thyroid dysfunctions have been reported after Severe Acute Respiratory Syndrome Coronavirus 2 (SARS-CoV-2) infection. However, the biological mechanisms behind these conditions remain unexplored. Herein, we report on changes of the immune transcriptome in autoptic thyroid tissues of people who have died from coronavirus disease 2019 (COVID-19).
Methods:
Twenty-five autoptic thyroid specimens of subjects dying from COVID-19 were investigated. Eleven autoptic thyroid specimens of subjects dying from causes other than infectious conditions served as controls. RNA transcripts of 770 immune-related genes together with RNA genomes of multiple coronavirus types were measured by the nCounter system. Reverse transcription–polymerase chain reaction for two SARS-CoV-2 genes was used to assess virus positivity. Results were validated by immunohistochemistry.
Results:
The SARS-CoV-2 genome and antigens were detected in 9 of 25 (36%) thyroid specimens from the COVID-19 cohort. Virus-negative thyroid tissues from COVID-19 subject did not show changes of gene transcription nor significant numbers of infiltrating immune cells. Conversely, SARS-CoV-2-positive thyroid specimens showed marked upregulation of immune genes, especially those proper of the type I and type II interferon (IFN) pathways. In infected tissues, infiltrates of innate immune cells (macrophages and polymorphonuclear neutrophils) were prevalent.
Conclusions:
The thyroid gland can be directly infected by the SARS-CoV-2. Infection strongly activates IFN pathways. The direct viral insult combined with an intense immune response may trigger or worsen thyroid conditions in predisposed individuals.
Introduction
At the end of 2019, cases of pneumonitis of unknown etiology were reported in Wuhan, China (1). In a few months, the coronavirus disease 2019 (COVID-19) was spreading worldwide (2). The disease typically involves the lungs, but recent findings report that COVID-19 is also a condition associated with endothelial damage (3). As a consequence, the Severe Acute Respiratory Syndrome Coronavirus 2 (SARS-CoV-2) may affect multiple organs, including endocrine glands. Different endocrine tissues, in fact, have been shown to express the angiotensin-converting enzyme 2 (ACE2) and the transmembrane serine protease 2 (TMPRSS2), two surface proteins acting as host cell entry factors for SARS-CoV-2 (4,5). Accordingly, endocrine dysfunctions especially of the thyroid have been reported. However, the spectrum of thyroid disorders linked to SARS-CoV-2 infection is rather broad. The first reports of altered thyroid functions were classified under three different conditions: nonthyroidal illness syndrome (NTIS), thyrotoxicosis, and subacute thyroiditis (SAT) (6 –9). Although NTIS and thyrotoxicosis are not necessarily associated with the direct virus infection of thyroid cells (9), SAT is a likely consequence of virus replication within thyroid follicular cells (10). In addition, the possible thyroid tropism of SARS-CoV-2 (11 –13) is suggested by the observation that COVID-19 may precede the onset of Graves' disease (GD), an immune-mediated condition linked to both genetic and environmental factors (14,15). In a recent study (16), we showed that a low-level enterovirus infection may be associated with GD. The persistent enteroviral infection does lead to reduced transcription of type I interferon (IFN) and cytokine pathways and the concurrent activation of NFKB1/RELA, IFNAR1, JAK1/STAT1, CCL2 chemokine, and IL18 genes that play pathogenic roles in autoimmune conditions (17,18). An autopsy report from our group (19) shows that—in patients dying from COVID-19—the SARS-CoV-2 genome and proteins can be detected in cells of thyroid, testis, and the subcutaneous adipose tissue. With regard to thyroid, it will be important to understand whether preexisting disorders may affect COVID-19 prognosis and whether thyroid disorders develop in survivors of SARS-CoV-2 infection (20,21). The present study investigates viral markers, inflammatory infiltrates, and the immune transcriptome in the thyroid gland of COVID-19 fatal cases.
Materials and Methods
Study population
COVID-19 autopsy cases were investigated in parallel with control autopsy cases without evidence for infectious conditions. Twenty-five thyroid samples were obtained from individuals dying from COVID-19. Each case had a premortem nasopharyngeal swab and a postmortem lung specimen positive for SARS-CoV-2 genome. In addition, in all cases, pathological examination showed alterations of lung parenchyma consistent with moderate-to-severe COVID-19 (Supplementary Fig. S1). Eleven thyroid samples were obtained from control subjects dying for causes other than infectious conditions. Control cases had both nasopharyngeal swab and lung specimen negative for the presence of the virus. None of the cases had clinical or laboratory evidence for thyroid disorders. The study was approved by the local Ethics Committee (Comitato Etico Area Vasta Nord-Ovest, Italy No. 17327, 2020-05-14).
Detection of SARS-CoV-2 genome by quantitative reverse transcription–polymerase chain reaction
Total RNA was extracted from four 10 μm-thick formalin-fixed paraffin-embedded (FFPE) sections using the RNeasy FFPE Kit (Qiagen, Hilden, Germany) and quantified by spectrophotometry (Trinean, Gentbrugge, Belgium). About 250 ng of RNA was used for each reverse transcription–polymerase chain reaction (RT-PCR) test.
The Easy® SARS-CoV-2 WE kit (Diatech Pharmacogenetics, Jesi, Italy) was used as a quantitative RT-PCR assay to detect the SARS-CoV-2 genome. The assay detects the nucleocapsid (N) and the RNA-dependent RNA polymerase (RdRp) genes. Detection is based on fluorescent probes: FAM (green channel) for the N gene and ROX (orange channel) for the RdRp gene. An endogenous internal control (IC, marked with HEX, yellow channel) allows to check the amplification process and avoid false negative results. The assay was performed as follows: first, RT was performed for 10 minutes at 50°C, followed by the activation of the Taq polymerase at 95°C for 5 minutes, and then, PCR was run for 40 cycles (denaturation at 95°C for 5 seconds, annealing and elongation at 58°C for 30 seconds). A Rotor-Gene Q (Qiagen) instrument was used, and the threshold was set to 0.01. After the assessment of positive control amplification in the absence of negative control amplification, a sample was deemed positive when the N gene signal was detected below the 36 ct and/or the RdRp gene signal appeared below the 38 ct. All samples were run in duplicate. Borderline cases were repeated.
Analysis of mRNA transcripts
Gene expression analysis was performed using the nCounter technology (NanoString Technologies, Seattle, WA), which is based on the direct hybridization of specific probes to the target molecules (mRNA, miRNA) without amplification steps. Two probes of about 50 nucleotides per target are designed, namely the reporter and the capture probe. The reporter probe carries six fluorescent molecules of four different types; their sequence is specific for each target, thus allowing the analysis of up to 800 targets simultaneously. The capture probe carries a molecule of biotin, which is necessary to bind the target-probes complex to a solid substrate (i.e., the cartridge). The assay consists of three parts: hybridization, purification, and digital counting. In the hybridization phase, probes, RNA, and a hybridization buffer are mixed and incubated at 65°C for 16 hours. Then, the target-probes complexes are purified by a magnetic beads system, bounded to the cartridge, and aligned by application of an electric field. The alignment avoids an incorrect counting of targets. The purification procedures are automatically performed by the Prep Station instrument. Finally, a Digital Analyzer counts the target molecules. In particular, each well is divided into fields of view. In this study, the maximum sensitivity was set to 555 fields of view. Two panels were used: (a) the Host Immune Response panel investigating 770 immune-related genes; (b) the Coronavirus panel plus contains probes targeting the N and S ORFs of HCoV-229E, HCoV-HKU1, HCoV-NL63, HCoV-OC43, SARS-CoV, and the ACE2 virus receptor (Supplementary Table S1). Probes for the SARS-CoV-2 virus were designed to the reference sequence, Wuhan-Hu-1 (NC_045512).
Immunohistochemistry
Immunohistochemistry (IHC) was performed in all cases for viral proteins, and in 18/36 cases for markers of immune cells. Three-micrometer-thick sections were stained with antibodies to SARS-CoV-2: rabbit anti-SARS nucleocapsid protein antibody (NB100-56683; Novus Biologicals, Centennial, CO) and a mouse monoclonal antibody to SARS-CoV-2 spike glycoprotein (GTX632304; GeneTex). Antibodies to immune cell markers included: CONFIRM anti-CD3 (2GV6, T cell marker) Rabbit Monoclonal Primary Antibody, CONFIRM anti-CD20 (L26, B cell marker) Mouse Monoclonal Primary Antibody, CONFIRM anti-CD45, LCA (RP2/18, pan-leukocyte marker) Mouse Monoclonal Primary Antibody, CONFIRM anti-CD68 (KP-1, macrophage marker) Mouse Monoclonal Primary Antibody, anti-CD57 (NK1, natural killer [NK] cell marker) Mouse Monoclonal Primary Antibody, and CONFIRM anti-CD15 (MMA, granulocyte marker) Mouse Monoclonal Primary Antibody (Roche Diagnostics, Ventana Medical Systems). Staining procedures were performed with an automated staining system (BenchMark ULTRA; Ventana Medical Systems, Oro Valley, AZ). Antibody binding was revealed with the OptiView DAB IHC Detection Kit (Ventana Medical Systems). Slides were counterstained with Hematoxylin II and Bluing Reagent (Ventana Medical Systems). Inflammatory cell counts were performed independently by two pathologists (A.P. and F.B). Ten randomly selected fields were scanned at 20 × magnification, and cell counts are presented as mean numbers per square millimeter.
Data analysis
Raw data were normalized using the Advanced Analysis module of the nSolver v.4.0 (NanoString Technologies). Low count genes defined as those with raw expression level as low as 20 counts were omitted. Normalized gene expression levels were log2 transformed for further analysis. The principal component analysis (PCA) was performed by the procedures of the PCAtools Bioconductor package v.3.12 after removing 10% of genes with the lowest variance. Differentially expressed genes (DEG) were computed by a linear model using the Advanced Analysis module of nSolver. In detail, control cases were used as baseline and three comparisons were performed: all COVID-19 cases versus baseline, COVID-19 cases with SARS-CoV-2 detected in thyroid tissue versus baseline, and COVID-19 cases with no virus detected in thyroid tissue versus baseline.
Single sample Gene Set Enrichment Analysis (ssGSEA) was run using the procedures of the GSVA Bioconductor package v.1.38.2. In detail, the method described by Barbie et al. (22) was used, and a minimum of 10 genes was set as gene set size cutoff. Then, gene sets were manually filtered, and only those concerning immune processes or generic biological functions belonging to Reactome (23) and Kyoto Encyclopedia of Genes and Genomes (KEGG) (24) databases were selected. ssGSEA scores were compared by the moderated t-statistics following the procedures of the limma Bioconductor package v.3.12. The same contrasts of DEG analyses were performed. Gene Set Enrichment Analysis (GSEA) was run using the ranked gene list of differential expression analyses and following the procedures of clusterProfiler Bioconductor package v.3.18.1. For the analyses, 10 was used as minimum gene set size cutoff, and the Hallmark collection of the Molecular Signatures Database (MSigDB) v.7.4 was used as reference (25).
Immune cell scores were computed following the method described by Middleton et al. (26). Only immune cell sets with at least two genes were used for further analyses. Immune cell scores were compared using a pairwise Dunn test. For all analyses, false discovery rate (FDR) below 0.05 was deemed significant. Analyses and plots were generated in the R environment (v.4.1.0) unless otherwise specified.
Results
Detection of SARS-CoV-2 in thyroid tissue
The demographic and clinical data of the investigated autopsy cases are shown in Table 1. With regard to age and comorbidities, COVID-19 cases were not different from control cases dying from causes other than infectious conditions. By RT-PCR, the SARS-CoV-2 genome was detected in 9/25 (36%) thyroid specimens of COVID-19 patients. Immune detection of the viral nucleocapsid protein in thyroid cells confirmed virus positivity in the nine cases. In agreement with previous observations (27), virus antigens are seen as coarse granular dots in the cytoplasm of thyroid cells (Fig. 1). As expected, the nucleocapsid virus antigen was not found in thyroid tissue of controls nor in virus-negative thyroid of COVID-19 patients. A mouse monoclonal antibody to the SARS-CoV-2 spike glycoprotein produced only diffused staining and did not allow the precise localization of this viral antigen (data not shown). The nCounter system (a nonamplified assay with probes specific for a broad range of coronaviruses) could detect the virus genome in only 4/25 (16%) thyroid specimens. In the four cases, hybridization occurred with probes targeting SARS-CoV-2 but not with probes specific for common cold and SARS coronaviruses (HCoV-229E, HCoV-HKU1, HCoV-NL63, HCoV-OC43, and SARS-CoV).
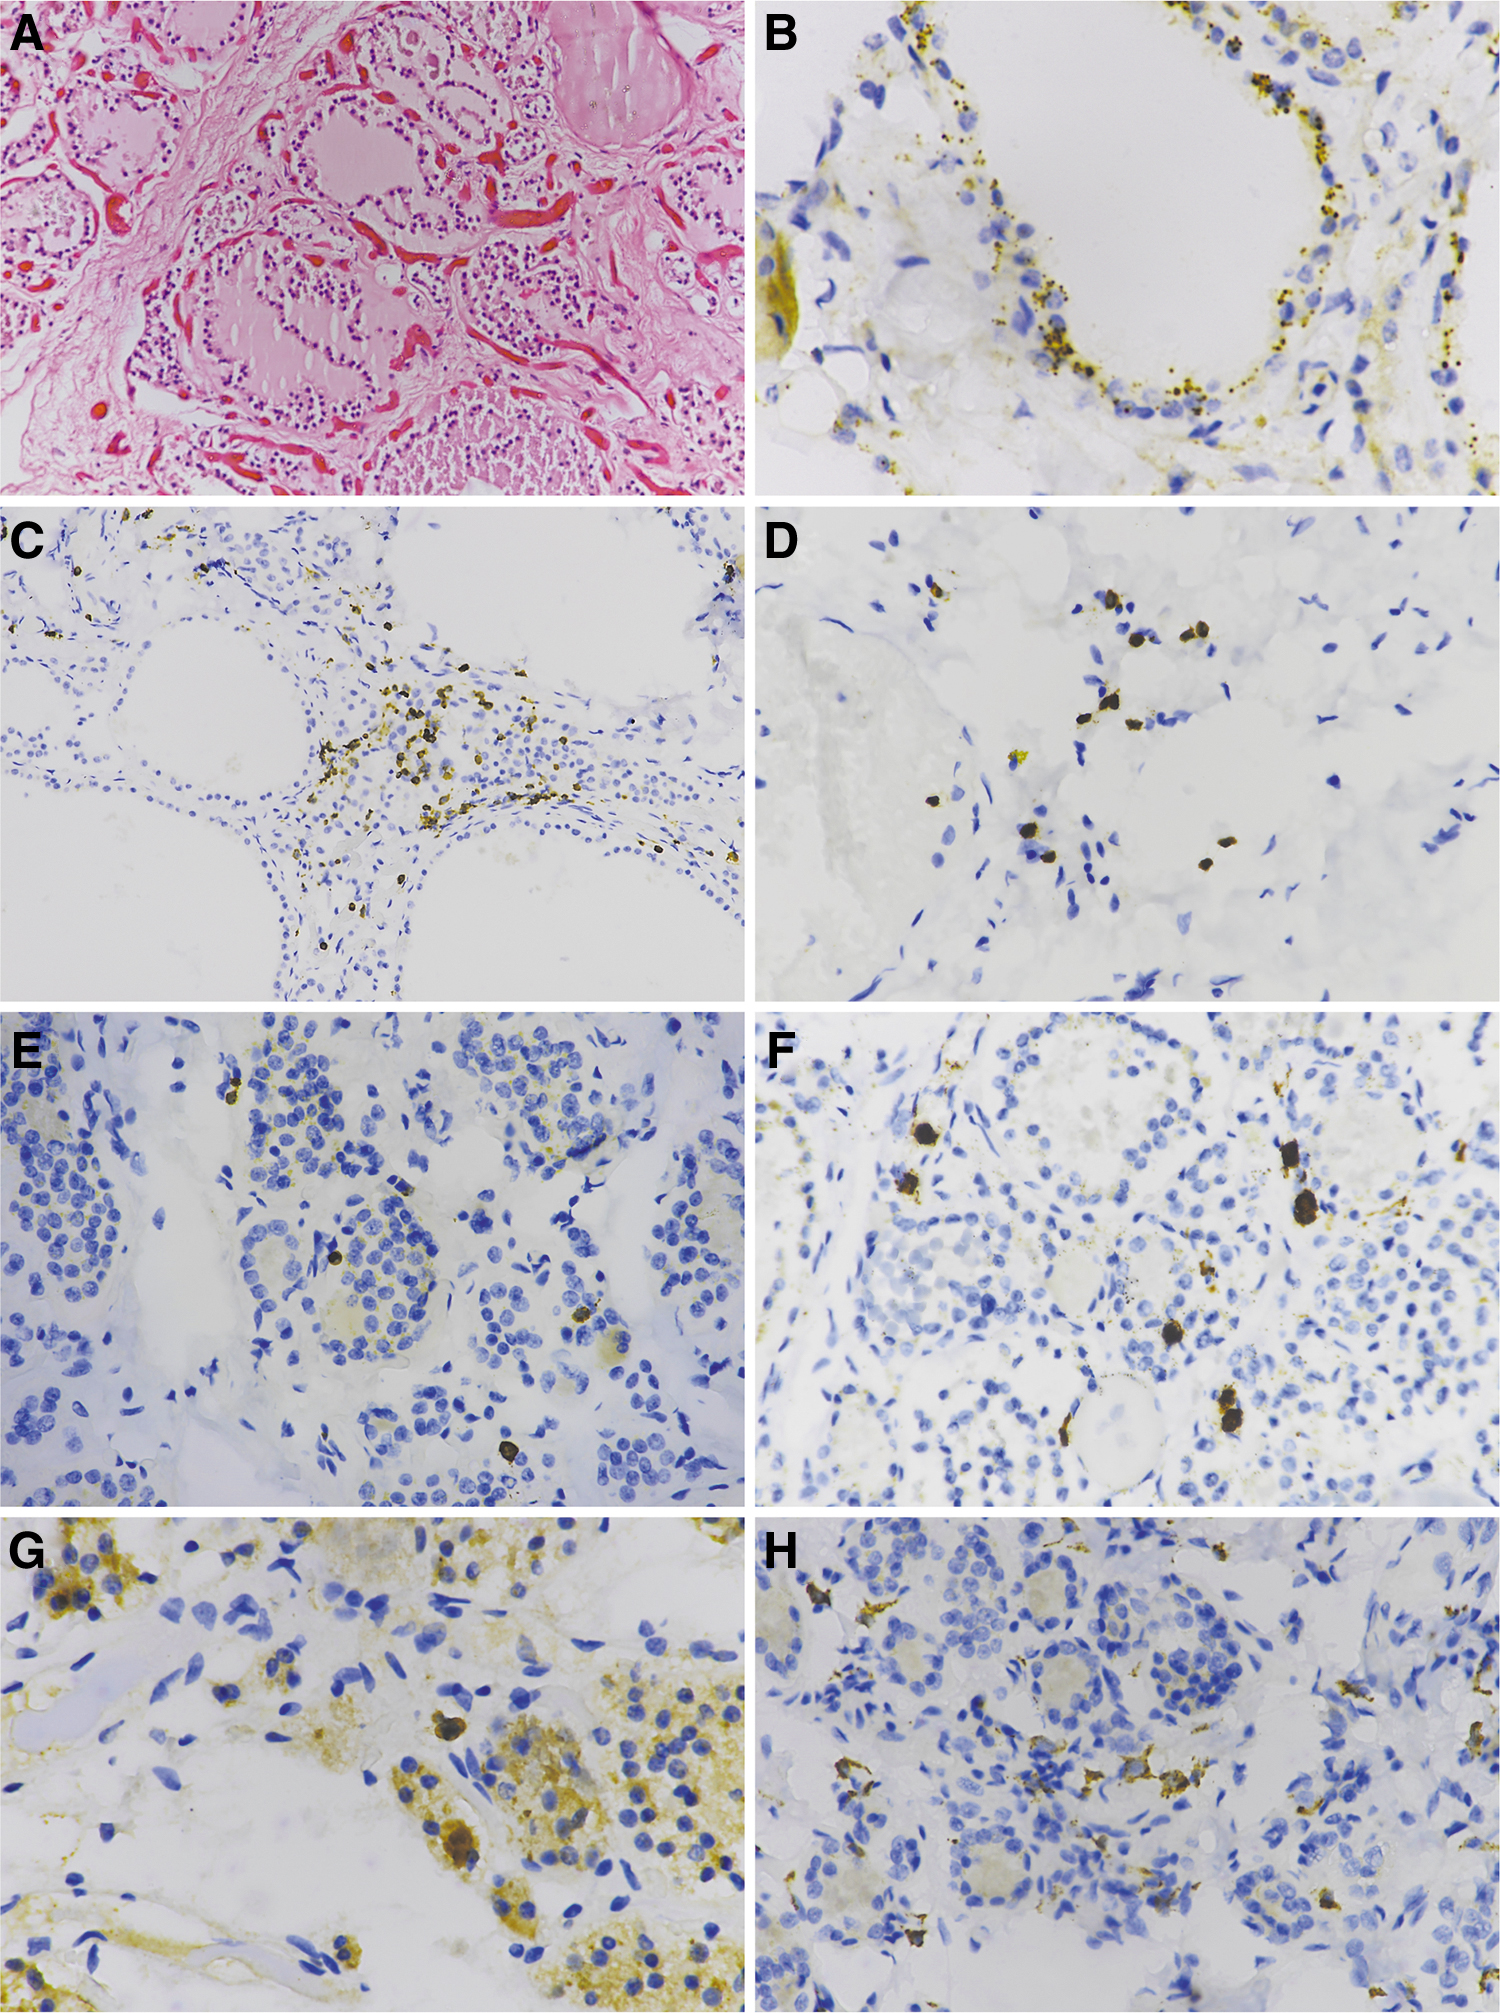
Immunohistochemistry of thyroid tissue of COVID-19 autopsy cases. (
Demographic and Clinical Data of COVID-19 and Control Autopsy Cases
All cases had no clinical signs or laboratory evidence for thyroiditis.
COVID-19, coronavirus disease 2019; SD, standard deviation.
As expected, RT-PCR and hybridization failed to detect SARS-CoV-2 in thyroid tissues of control autopsy cases. For further analyses, the nine thyroid specimens positive for SARS-CoV-2 were treated as a single group.
Transcription of immune genes in thyroid tissue that had been proven positive for SARS-CoV-2
The PCA showed a partial overlap between COVID-19 cases and controls. However, virus-positive thyroid samples had a different expression pattern compared with virus-negative COVID-19 cases and controls (Fig. 2A). When all COVID-19 cases were compared with controls, a trend toward upregulation of immune genes was apparent but no single gene was differentially expressed (Fig. 2B). Alternatively, when virus-positive (n = 9) and virus-negative (n = 16) thyroid samples were compared with autopsy controls, virus-negative samples were not significantly different with almost all genes flattened on an FDR of 1 (Fig. 2C). Conversely, comparison of virus-positive cases with control autopsy cases revealed that 32 genes were differentially expressed (Fig. 2D). The majority of these were upregulated (n = 28), including IL2RA, XAF1, OAS1, OAS3, and IFI6. Only four genes were downregulated in cases positive for virus in thyroid, namely KPNB1, IRF3, LCN2, and SMAD4. Of note, two genes (IL2RA and CD209/L-SIGN) whose polymorphism has been associated to severe COVID-19 are also upregulated (28,29). Supplementary Table S2 lists the complete results of differential expression analysis (DEG).
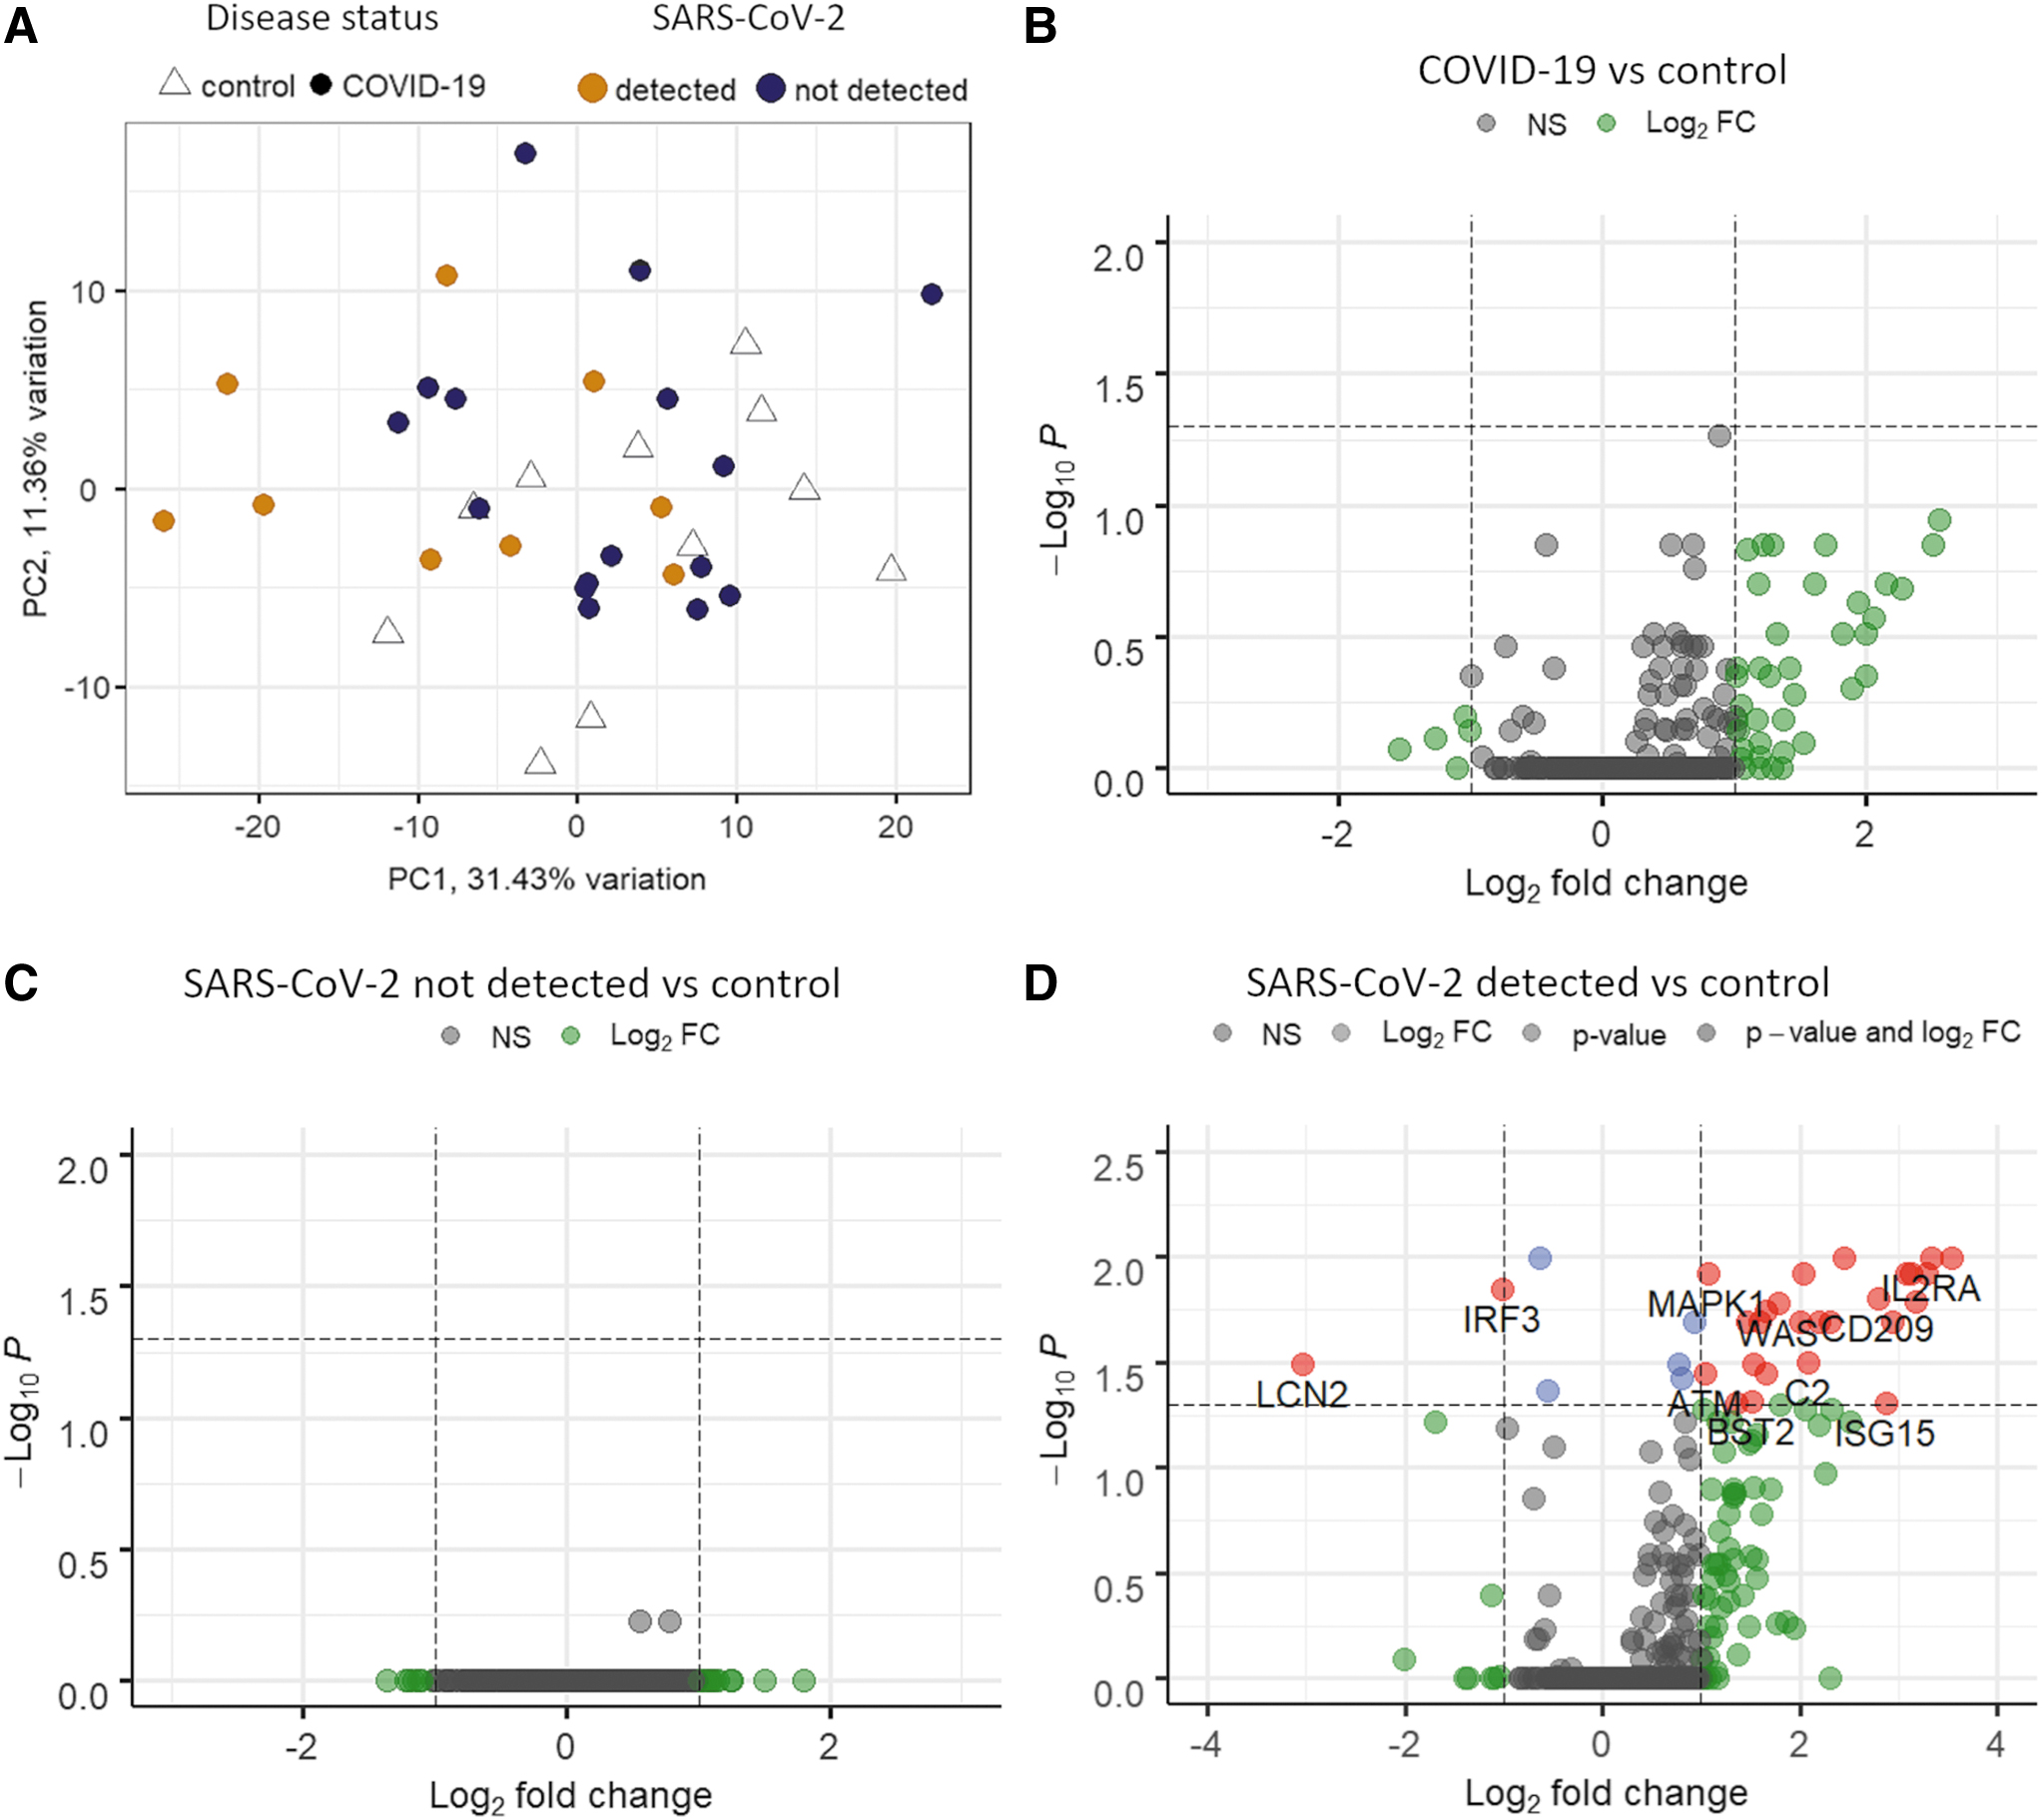
Gene expression results. (
In thyroid tissue, SARS-CoV-2 positivity is linked with activation of type I and type II IFNs
Using the criteria reported for ssGSEA, scores were computed for 591 gene sets. Among them, 94 gene sets related to immune processes or generic biological functions were analyzed in more detail. Comparing SARS-CoV-2-negative samples with control autopsy cases, no gene sets were differentially transcribed. The analysis showed, however, that in virus-positive thyroid samples nine gene sets were significantly altered. Specifically, four gene sets were downregulated: two related to TLR4 signaling, one of the Myd88 cascade, and one related to insulin signaling. Conversely, five gene sets were upregulated: one involved in the leptin response, one in tumor necrosis factor alpha (TNFα) signaling, and three related to IFN pathways. Since changes in IFN signaling were highly significant, IFN signatures were gathered and plotted. As shown in the heat map (Fig. 3A), IFN genes are generally inactive in controls and in virus-negative samples, whereas the same genes are activated in samples positive for SARS-CoV-2. A classical GSEA showed that the gene sets of both type I and type II IFNs were significantly activated in virus-positive thyroid specimens (Fig. 3B, C). Table 2 shows the significantly activated immune genes belonging to IFN pathways along with their functions. In particular, the three genes coding for the 2′-5′ oligoadenylate synthetase (OAS1-2-3) that are central in activating RNAse-L—a key enzyme in antiviral resistance—are strongly activated. Of interest is also that transcription of the ACE2 virus receptor was upregulated in virus-positive thyroid specimens, possibly as a consequence of IFN activation.

Gene set analyses. (
Gene Transcription Changes in Type I and Type II Interferon Pathways
FC, fold change; FDR, false discovery rate; IFN, interferon; IRF, interferon regulatory factor; SE, standard error.
Innate immune cells are well represented in SARS-CoV-2-positive thyroid tissue
Immune cell infiltrates were compared among COVID-19 cases (positive or negative for SARS-CoV-2 in thyroid tissue) and in control autopsy cases. In the absence of virus in thyroid, COVID-19 cases were not significantly different from controls. In contrast, thyroid tissue positive for SARS-CoV-2 had higher scores for macrophages, polymorphonuclear neutrophils, and chemokine neutrophils compared with both virus-free COVID-19 thyroids and controls (Fig. 4). IHC confirmed the results. COVID-19 cases positive for virus in thyroid had higher levels of granulocytes (CD15) and macrophages (CD68) compared with COVID-19 cases negative for virus in thyroid and controls. Compared with controls, infiltrating T cells (CD3) were more abundant in COVID-19 cases, especially those positive for virus (Figs. 1 and 5).
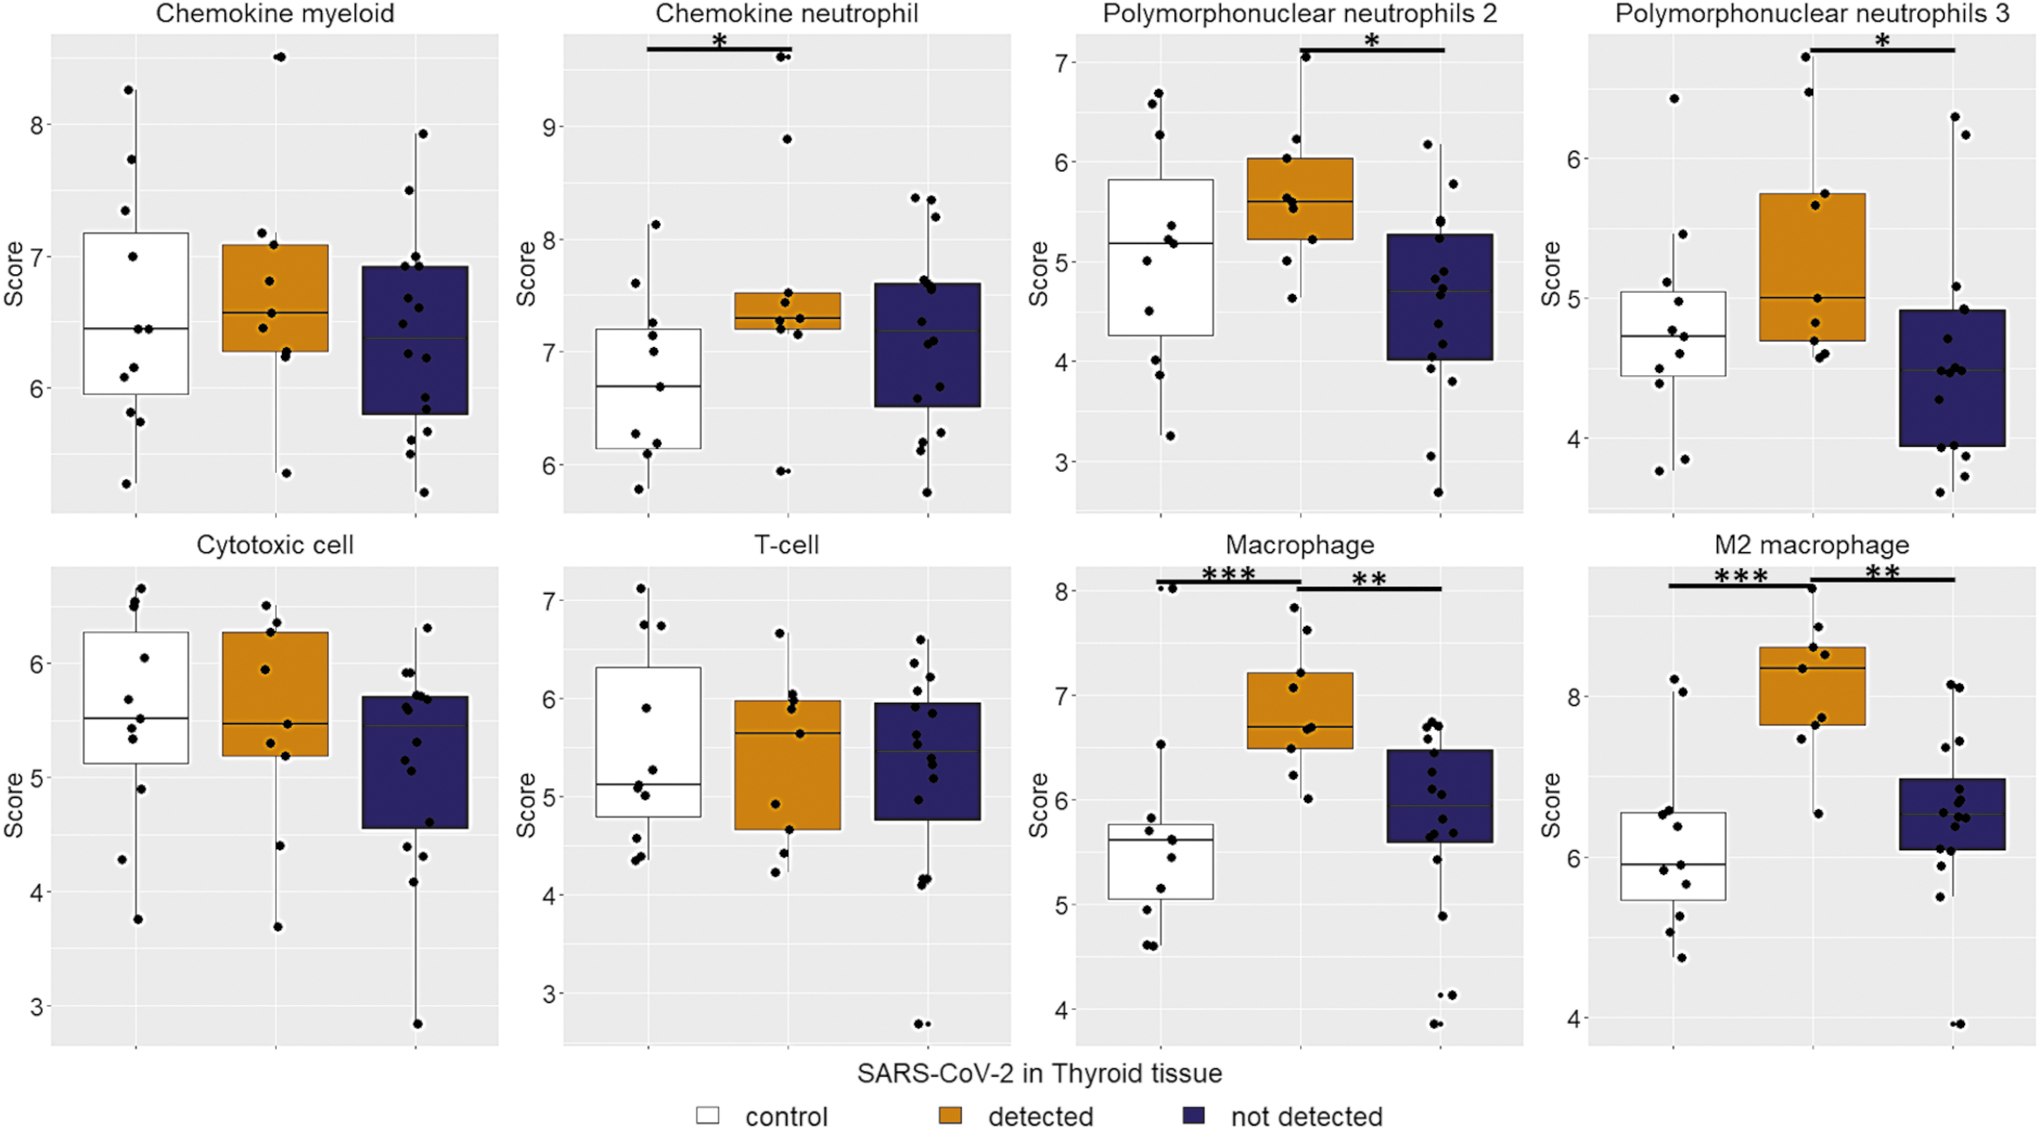
Immune cell abundance. COVID-19 cases with virus presence in thyroid tissue have a higher abundance of chemokine neutrophil, polymorphonuclear neutrophil, macrophage, and M2 macrophage scores. *P < 0.05; **P < 0.01; ***P < 0.001. Color images are available online.

Leukocyte abundance estimated by immunohistochemistry. Counts refers to mean leukocytes per square millimeter. COVID-19 cases with virus infection of thyroid tissue (red dots) have higher levels of T cells (CD3), granulocytes (CD15), and macrophages (CD68) than thyroid-negative COVID-19 cases and controls. B cell and NK cell abundance is negligible in all cases. *P < 0.05. Color images are available online.
Discussion
At present, thyroid dysfunction following COVID-19 seems not to be frequent. The majority of disorders are NTIS and thyrotoxicosis—both possibly linked to a cytokine storm (9). Cases of SAT and GD after SARS-CoV-2 infection strongly suggest that the virus can infect thyroid endocrine cells (6,8,11 –13). The results show that the SARS-CoV-2 genome can be found in thyroid tissue of 9/25 subjects dying from COVID-19 and that, in these same cases, virus proteins are expressed in the cytoplasm of thyroid cells.
Interestingly, compared with the control autopsy group, virus-free thyroid tissues of subject with COVID-19 do not show alterations of immune genes transcription. Conversely, detection of SARS-CoV-2 in the thyroid gland is associated with an intense activation of the innate immune response likely consequential to upregulation of both type I (i.e., IFN-alpha) and type II (i.e., IFN-gamma) pathways. Innate lymphoid cells and NK cells are an important source of IFN-gamma (30,31). IFN-gamma links the innate response with the adaptive response and primes macrophages inducing the release of nitric oxide (30). Accordingly, innate immune cells, including macrophages, were overrepresented in SARS-CoV-2-positive thyroid specimens. The exacerbation of the macrophage activity could promote tissue damage and a diffuse inflammatory state of thyroid parenchyma consistent with the SAT condition (10,32,33). Although both IFN-alpha and IFN-gamma promote antiviral resistance (30,34,35), a prolonged and intense stimulation may have detrimental effects (30), including triggering autoimmune thyroiditis and exacerbating preexisting autoimmune conditions (30,36,37). Currently, thyroid dysfunction or de novo appearance of thyroid autoantibodies do not seem frequent in the follow-up of patients who recovered from COVID-19 (20,21,38). In the present study, the frequent detection of SARS-CoV-2 in thyroid tissue may indicate that thyroid infection does occur in patients with more severe fatal forms of the disease. None of the investigated COVID-19 cases had clinical or laboratory evidence for previous thyroid conditions; hence, it is unclear whether preexisting thyroid disorders could favor the viral infection of the gland.
Further autopsy studies of COVID-19 cases (and possibly biopsy specimens from living patients) will define the real incidence of coronavirus detection in thyroid.
Multiple observations show that the thyroid gland may be hit by a broad range of different viruses, including human herpesvirus 6 (39,40), hepatitis C virus (41), parvovirus B19 (42), Ebola virus (43), and enteroviruses (16). Since thyroid follicular cells express ACE2 (44), the main receptor of SARS-CoV-2, the virus may reach endocrine cells and replicate within them in at least some individuals. Of interest is that, coincidentally with virus-induced IFN activation, the expression of ACE2 is enhanced in the thyroid gland.
To conclude, the findings indicate that, in thyroid, COVID-19 associates with transcriptional changes of immune genes once the virus is replicating in endocrine cells. Infection appears to activate type I and type II IFN pathways that, in turn, boost innate immunity. Likely, the confluence of infectious and immune stimuli may trigger or exacerbate thyroid autoimmunity in predisposed individuals. Thus, thyroid disorders still need to be monitored in prolonged follow-up of COVID-19 cases.
Footnotes
Acknowledgments
The study has been conducted in collaboration with the Centro Linceo Beniamino Segre, Accademia dei Lincei, Rome, Italy, and the Global Virus Network (GVN), Baltimore, MD.
Authors' Contributions
Conceptualization: A.M.P., D.B., F.B., A.T., and F.S. Methodology: A.M.P., A.B., D.B., A.P., E.M., C.U., L.T., G.A., and P.V. Formal analysis: A.M.P., R.G., A.T., and F.B. Writing—original draft preparation: A.M.P., A.T., and F.B. Writing—review and editing: all authors. Supervision: F.B., A.T., and F.S. Funding acquisition: F.B. and A.T.
Author Disclosure Statement
No competing financial interests exist.
Funding Information
This research was funded by University of Pisa (no specific grant to F.B.), the Juvenile Diabetes Research Foundation (JDRF) and nPOD-V (JDRF grant 25-2012-770 to A.T.), and the Italian Ministry of Health (grant PE-2013-02357094 to A.T.).
Supplementary Material
Supplementary Figure S1
Supplementary Table S1
Supplementary Table S2