
Abstract
Background:
It is unclear whether levels of hypothyroid symptoms in pregnant women with (sub)clinical thyroid dysfunction differ from euthyroid controls and whether free thyroxine (fT4)/thyrotropin (TSH) changes throughout pregnancy affect hypothyroid symptom levels. The objective was twofold: (1) To compare hypothyroid symptom levels between thyroid dysfunction subgroups and a carefully defined reference group; (2) to assess the association between fT4/TSH changes throughout pregnancy and hypothyroid symptom levels adjusted for depressive symptoms.
Methods:
The current study was a longitudinal prospective cohort study in 1800 healthy pregnant women. At each trimester of pregnancy, hypothyroid symptoms were assessed with a 12-item symptom hypothyroidism checklist and depressive symptoms with the Edinburgh Depression Scale. Thyroid dysfunction was defined using the 2.5–97.5th fT4/TSH percentile of thyroid peroxidase antibodies-negative women. Euthyroid controls consisted of women with appropriate fT4 levels within the 10–90th percentile and with a normal TSH level. Hypothyroid symptom mean scores were compared between controls and several thyroid dysfunction subgroups. Growth mixture modeling was performed to evaluate possible longitudinal trajectories of hypothyroid and depressive symptoms. The association between hypothyroid symptom trajectories (adjusted for depression) and fT4/TSH changes was assessed with multivariate logistic regression analysis.
Results:
Women with overt hypothyroidism (fT4 < 2.5th, TSH >97.5th) and hypothyroxinemia (fT4 < 2.5th, TSH: 2.5–97.5th) showed higher hypothyroid symptom levels compared with the euthyroid controls and women with subclinical hypothyroidism (SCH, fT4: 2.5–97.5th, TSH >97.5th), because 82% of these SCH women had fT4 levels in the euthyroid range. Two groups of hypothyroid and depressive symptoms were defined: a persistently low and persistently high symptom group. fT4 decreased in 98% of the women from the first to third trimester and per unit pmol/L fT4 decrease (not TSH increase), the likelihood to present persistently high hypothyroid symptoms increased with 46%, adjusted for depression.
Conclusions:
A properly defined euthyroid control group distinguishes women with hypothyroid symptoms. An fT4 decrease toward end term is associated with persistently high hypothyroid symptom levels. Clinicians should be aware of the importance of fT4 stratification in SCH women.
Introduction
It is still uncertain whether pregnant women with (sub)clinical thyroid dysfunction report different levels of hypothyroid symptoms compared with euthyroid women, most likely because most research has several methodological inconsistencies. First, there is the dispute of the conceptual question whether amounts of free thyroxine (fT4) that are too small result in hypothyroid symptoms rather than an abnormal (high) thyrotropin (TSH). 1 Second, the definition of several subgroups of thyroid dysfunction and most importantly the normal reference group, is subject to discussion. 2 Is it reasonable, for example, to compare clinical symptoms of a subject with an fT4 < 2.5th percentile (inadequate level) with that of a subject with an fT4 at the 3rd or 5th percentile (adequate level)? 3 Also, comparing symptoms of women with subclinical hypothyroidism (SCH) with the remaining “euthyroid” group is questionable, when the SCH women may still show adequate fT4 levels.
Third, the definition of another category, namely that of “isolated” hypothyroxinemia (women with low fT4 but normal TSH levels) varies across the literature, with definitions of fT4 levels at the <2.5th, <5th, or even <10th percentile. 4 Fourth, there is limited literature on the logical counterpart of this “hypothyroxinemia syndrome”: “isolated” hyperthyroxinemia. Fifth, most research used a cross-sectional design when examining the association between thyroid hormone values and clinical symptoms at different time points during pregnancy, ignoring the natural variability of symptoms over time, which is similar to shortcomings in research on perinatal depressive symptoms. 5,6
A statistical method that can take into account individual differences in symptom trajectories over time is growth mixture modeling. Growth mixture modeling classifies women into different symptom trajectories based on similarities in the course of symptoms over time. 7,8 This approach was previously applied in a Dutch prospective pregnancy cohort to examine changes of fT4 and TSH throughout gestation resulting in different patterns of thyroid hormone changes. 9
The possible effect of fT4 and TSH changes on clinical symptoms throughout pregnancy has not yet been investigated. In general, maternal fT4 levels decrease during pregnancy, partly because of a substantial decrease in (initially high) human chorionic gonadotrophin (hCG), which has a similar effect to TSH. High hCG concentration during early gestation will result in high fT4 levels. 10 Another reason for this decrease is the increasing demands of the fetus on the maternal thyroid to enable adequate fetal growth and development. 4 Inversely, TSH levels are relatively low during early gestation and tend to increase toward end term. Finally, it is important to mention that when assessing a possible association between abnormal thyroid hormone concentrations and clinical symptoms, it is important to adjust for depressive symptoms because of the overlap with hypothyroid symptoms (low mood, fatigue, poor concentration, sleeping problems). 11
Therefore, the primary aim of the current study was to assess hypothyroid symptoms across subgroups of women with thyroid dysfunction compared with a carefully defined reference group, at a cross-sectional level. The secondary aim was to investigate possible trajectories of hypothyroid symptoms throughout pregnancy and to evaluate whether changes of fT4/TSH concentrations throughout gestation were associated with hypothyroid symptoms, adjusted for patterns of depressive symptoms.
We hypothesized: (1) that women with low fT4 will report higher hypothyroid symptoms compared with a carefully defined reference group with adequate fT4 levels: not too low and not too high; (2) that different trajectories of hypothyroid symptoms can be distinguished throughout pregnancy; (3) that changes of fT4 and/or TSH concentration toward end gestation will be related to trajectories of hypothyroid symptoms.
Materials and Methods
The current study is part of the longitudinal prospective HAPPY (Holistic Approach to Pregnancy and the first Postpartum Year) study, of which details have been described elsewhere, and which was performed in the South-East part of the Netherlands, an iodine sufficient area. 12 –14
Participants and procedure
Pregnant women were invited to participate in the HAPPY study at their first antenatal appointment. Figure 1 shows the flow chart of the participating women in the current study.

Flow chart of the participating women in the current study.
Dutch-speaking pregnant women (n = 3475) were invited to participate at the first antenatal appointment (8–12 weeks) and the NHANES exclusion criteria were used. 15 This resulted in 3159 eligible women of which 2275 signed a written informed consent (response rate of 72%). First trimester thyroid hormone data were not available in 77 of these women. Of the remaining 2198 women, the window of completing the questionnaire to assess hypothyroid symptoms was set at +/− 4 weeks of 12, 22, and 32 weeks. A total of 398 women did not meet these strict criteria, resulting in a final sample of 1800 women that was used for data analyses. The characteristics of these women are shown in Table 1. The HAPPY study was approved by the Medical Ethics Committee of the Máxima Medical Center, Veldhoven and by the Ethics Committee of Tilburg University (Protocol No. EV-2012.25).
Baseline Characteristics of 1800 Women at 12 Weeks of Gestation
High level of education, Bachelor's degree or higher; BMI, body mass index; fT4, free thyroxine; SD, standard deviation; TPO-Ab, thyroid peroxidase antibodies; TSH, thyrotropin.
Assessments
Figure 2 shows the flow chart of assessments in the HAPPY study. Women completed a questionnaire at 12 weeks for assessment of demographic characteristics, obstetric factors, and lifestyle habits.
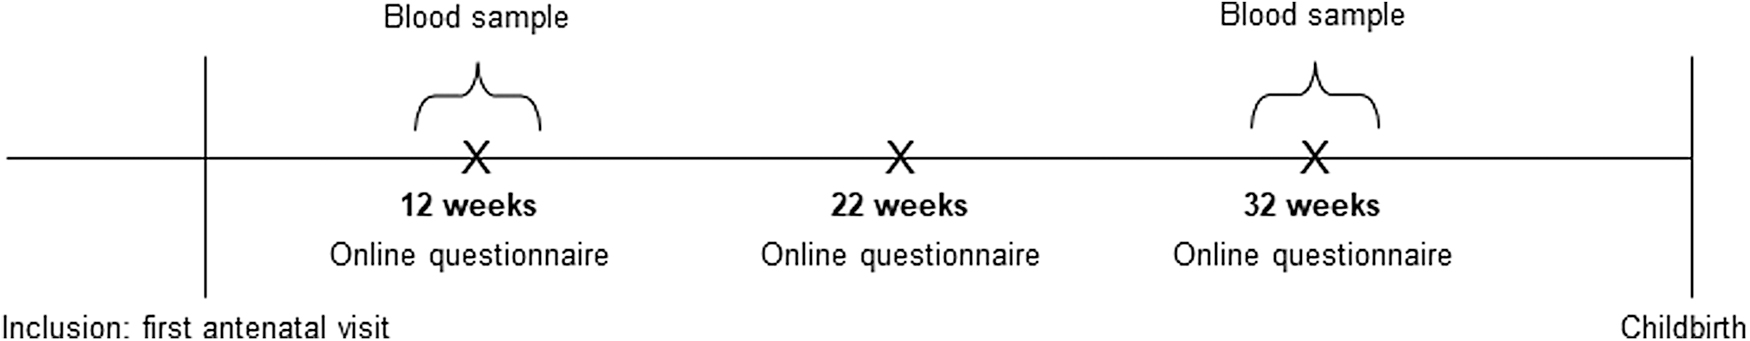
Flow chart of assessments in the HAPPY study. HAPPY, Holistic Approach to Pregnancy and the first Postpartum Year.
The most recent guidelines of the International Federation of Clinical Chemistry (IFCC) for defining adequate cutoffs in the clinical laboratory advocate, when applying single cutoffs (e.g., a low hemoglobin or high C-reactive protein) that the 5th or the 95th percentile can be used to define the lower or the higher reference limit, respectively. 16 When applying two cutoffs referring to a lower and upper normal reference limit (which is the case in hypo- and hyperthyroidism but also in hypo- and hyperthyroxinemia), the 2.5th and 97.5th percentile should be used. 16 However, with regard to hypothyroxinemia, several studies reported poor obstetric outcome or poor neurodevelopment in the offspring of mothers with hypothyroxinemia using a cutoff <2.5th and <5th percentile of fT4, with no differences anymore when applying a cutoff of <10th percentile. 4
On the other hand, there is growing evidence that the other side of the spectrum, hyperthyroxinemia, might also be related with poor obstetric outcome. 4 Therefore, we used two approaches in the current study with regard to “normal” fT4 levels: first, we defined the 10–90th percentile as the reference range: these women are most likely having not too low or too high concentrations of fT4. Second, we first performed the calculation defining hypo- and hyperthyroxinemia using the 2.5th and 97.5th percentile cutoffs, respectively. Subsequently, we repeated the analyses using the 5th and 95th percentile cutoffs to define hypo- and hyperthyroxinemia.
Thyroid function
At 12 and 32 weeks, TSH, fT4, and thyroid peroxidase antibodies (TPO-Ab) concentrations were determined in lithium heparin plasma using electrochemoluminescence assays (Elecsys, Cobas® e 601 platform; Roche Diagnostics, Mannheim, Germany). The nonpregnant reference ranges given by the manufacturer are 0.27–4.20 mIU/L for TSH and 12.0–22.0 pmol/L for fT4. A TPO-Ab titer >35 IU/mL was defined as TPO-Ab positive. We defined the reference ranges of TSH and fT4 during pregnancy in TPO-Ab-negative women, using the 2.5th and 97.5th percentile to define the lower and upper limit of normal thyroid function. 3
The following subgroups of thyroid (dys)function were defined (1) overt thyroid dysfunction (TSH and fT4 not within reference limits), (2) subclinical thyroid dysfunction (TSH not within reference limit with normal fT4), (3) hypothyroxinemia (fT4 < 5th percentile with normal TSH), and (4) hyperthyroxinemia (fT4 > 95th percentile with normal TSH). To allow comparisons with a reference group we defined euthyroid controls (adequate fT4) as women with fT4 between 10th and 90th percentile and TSH within the reference limit (2.5–97.5th percentile).
Hypothyroid symptoms
At 12, 22, and 32 weeks, a 12-item symptom checklist containing most of the classical symptoms of hypothyroidism was completed. Details on psychometric properties have been described elsewhere. 17 Women rated whether they had experienced the symptoms during the previous trimester of pregnancy on a 5-point Likert-type scale (item range 0–4). Higher scores reflect a higher intensity of symptoms with a range from 0 to 48. The Cronbach's alpha of the scale was 0.74, 0.77, and 0.78 at 12, 22, and 32 weeks, respectively.
Depressive symptoms
We assessed depressive symptoms over the past seven days using the Dutch version of the 10-item Edinburgh (Postnatal) Depression Scale [E(P)DS], 18,19 the most widely used depressive symptom questionnaire in perinatal research. 20 Women completed the E(P)DS at each trimester of pregnancy. The scores range from 0 to 30, with higher scores indicating higher levels of depressive symptoms.
Statistics
At 32 weeks, 321 women did not participate in the second thyroid hormone assessment. The missing fT4, TSH, and TPO values at 32 weeks were obtained using multiple imputation with 10 iterations, including the variables parity, prepregnancy body mass index, fT4, TSH, and TPO-Ab parameters at 12 and 32 weeks. Statistical analyses were performed in this imputed final sample of 1800 women with 11 missing values at 32 weeks due to preterm birth before 32 weeks of gestation.
R (version 3.6.3) was used for analyses. Mean hypothyroid symptom scores between thyroid (dys)function subgroups at 12 weeks were compared using two sample t-tests. Nonparametric testing (Mann–Whitney U, Kruskal–Wallis) was used to compare differences of TSH and fT4 between subgroups.
We performed growth mixture modeling in Mplus version 8.521 to determine different longitudinal trajectories (classes) of hypothyroid symptoms during pregnancy considering the Bayesian Information Criterion, Lo–Mendell–Rubin Likelihood Ratio Test, Bootstrapped Likelihood Ratio Test, and entropy. 7,22 The final model variable was subsequently entered in R and a multivariate logistic regression was performed with hypothyroid symptom trajectories as the dependent variable, fT4/TSH changes throughout gestation as the independent variable, adjusted for depressive symptoms, and baseline fT4.
Results
Cross-sectional data at 12 weeks gestation
At 12 weeks, the mean (standard deviation, SD) hypothyroid symptom score of the total group was 8.7 (4.0) with a range from 0 to 32, showing a normal distribution. Table 1 shows that 64.3% of the women were highly educated, almost all women were living with a partner, employed, white, and 156 (8.7%) had elevated TPO-Ab titers. Table 2 shows the different subgroups of thyroid (dys)function with their TPO-Ab status and the mean hypothyroid symptom scores.
Different Subgroups of Thyroid (Dys)Function of 1800 Women at 12 Weeks Gestation, with Corresponding Thyroid Peroxidase Antibodies Status and Mean (Standard Deviation) Hypothyroid Symptoms
Reference range of fT4 and TSH (2.5–97.5th percentile) assessed in 1644 TPO-Ab-negative women: fT4: 11.65–18.0 pmol/L; TSH: 0.23–4.01 mIU/L.
1. Reference group: fT4 between 10th and 90th percentile (12.55–16.76 pmol/L) with normal TSH (2.5–97.5th percentile).
2. Clinical (overt) hypothyroidism: fT4 below reference limit with TSH above reference limit.
3. Clinical (overt) hyperthyroidism: fT4 above reference limit with TSH below reference limit.
4. Subclinical hypothyroidism: fT4 in reference range with TSH above upper reference limit.
5. Subclinical hyperthyroidism: fT4 in reference range with TSH below the lower reference limit.
6. Isolated hypothyroxinemia: fT4 < 2.5th percentile (<11.65 pmol/L) with normal TSH.
7. Isolated hyperthyroxinemia: fT4 > 97.5th percentile (>18.0 pmol/L) with normal TSH.
8. Low rest group: fT4 between 2.5th and 10th percentile with normal TSH.
9. High rest group: fT4 between 90th and 97.5th percentile with normal TSH.
Group 2: significantly higher mean scores compared with reference group 1, T(1369) = 2.2, p = 0.028.
Group 6: significantly higher mean scores compared with reference group 1, T(1402) = 3.4, p < 0.001.
All women with overt hypothyroidism and none with overt hyperthyroidism had elevated TPO-Ab. Also, up to one-third of the women with SCH showed elevated TPO-Ab titers at 12 weeks. In women with hypo- and hyperthyroxinemia, 16.7% had elevated TPO-Ab titers while in the euthyroid reference group this was 6.6%. The highest mean symptom scores were found in group 2 (clinical hypothyroidism) and group 6 (hypothyroxinemia). Mean scores were significantly different from the reference group 1 [group 1 vs. group 2: T(1369) = 2.2, p = 0.028; group 1 vs. group 6: T(1402) = 3.4, p < 0.001]. The lowest mean symptom scores were found in group 5 (clinical hyperthyroidism) and group 7 (hyperthyroxinemia), but not significantly different from the reference group 1 (p = 0.65 and p = 0.38, respectively). When we combined at 12 weeks, the 42 hypothyroxinemic women with the 9 women with overt hypothyroidism (they all had fT4 < 2.5th percentile), these 51 women had significantly higher hypothyroid symptoms [mean (SD) compared with the 1362 women of the reference group: 11.56 (4.8) vs. 8.84 (4.7): T(1411) = 4.1, p < 0.001].
The 62 women with SCH (group 4) had rather similar scores as the reference group 1. Of these 62 women, there were 51 (82%) women with an fT4 between the 10th and 90th percentile, 9 (15%) with an fT4 between the 2.5th and 10th percentile, and 2 (3%) with an fT4 > 90th percentile, which indicates that vast majority of these women had adequate fT4 levels. SCH women with “sufficient” fT4 levels (n = 51) had lower (but not significantly) hypothyroid symptom levels [mean (SD) = 8.3 (3.4)] compared with the nine with lower (between 2.5th and 10th percentile) fT4 levels [mean (SD) = 8.6 (4.0)]: T(58) = 0.22, p = 0.90. In this subgroup of 62 SCH women, there was a negative (nonsignificant) correlation between the fT4 and hypothyroid symptom scores (r = 0.07, p = 0.61).
Interestingly, there was a significant difference between the TSH of the group with “sufficient” fT4 [TSH: median (range) = 4.85 (4.02–9.83)] and the TSH of those with low normal fT4 [TSH: median (range) = 6.07 (4.06–12.88); Mann–Whitney U: Z = 2.4, p = 0.024]. Also, of the 51 SCH women with “sufficient” fT4 levels, 14 (27.4%) had elevated TPO-Ab titers compared with 6 (66.6%) of the 9 SCH women with lower fT4 (Fisher's exact, p = 0.049).
We subsequently repeated the analyses using another cutoff to define hypo- and hyperthyroxinemia: <5th and >95th percentile, respectively, but still using the 10–90th percentile to define the reference group. The number of women with hypo- and hyperthyroxinemia increased to 70 women in both groups, whereas the “low rest group” decreased to 130 and the “high rest group” to 58 women. Similar results were found as shown in Supplementary Table S1.
Longitudinal data: trajectories of hypothyroid symptoms during pregnancy
The three-class model was chosen as optimal model representing three different longitudinal trajectories of hypothyroid symptoms during pregnancy (Supplementary Tables S2 and S3). These three hypothyroid symptom classes are shown in Figure 3. Class 1 (n = 1602, 89.0%) was labeled “Low stable” and showed a low and stable pattern of hypothyroid symptoms during pregnancy (mean 8.1–11.0).
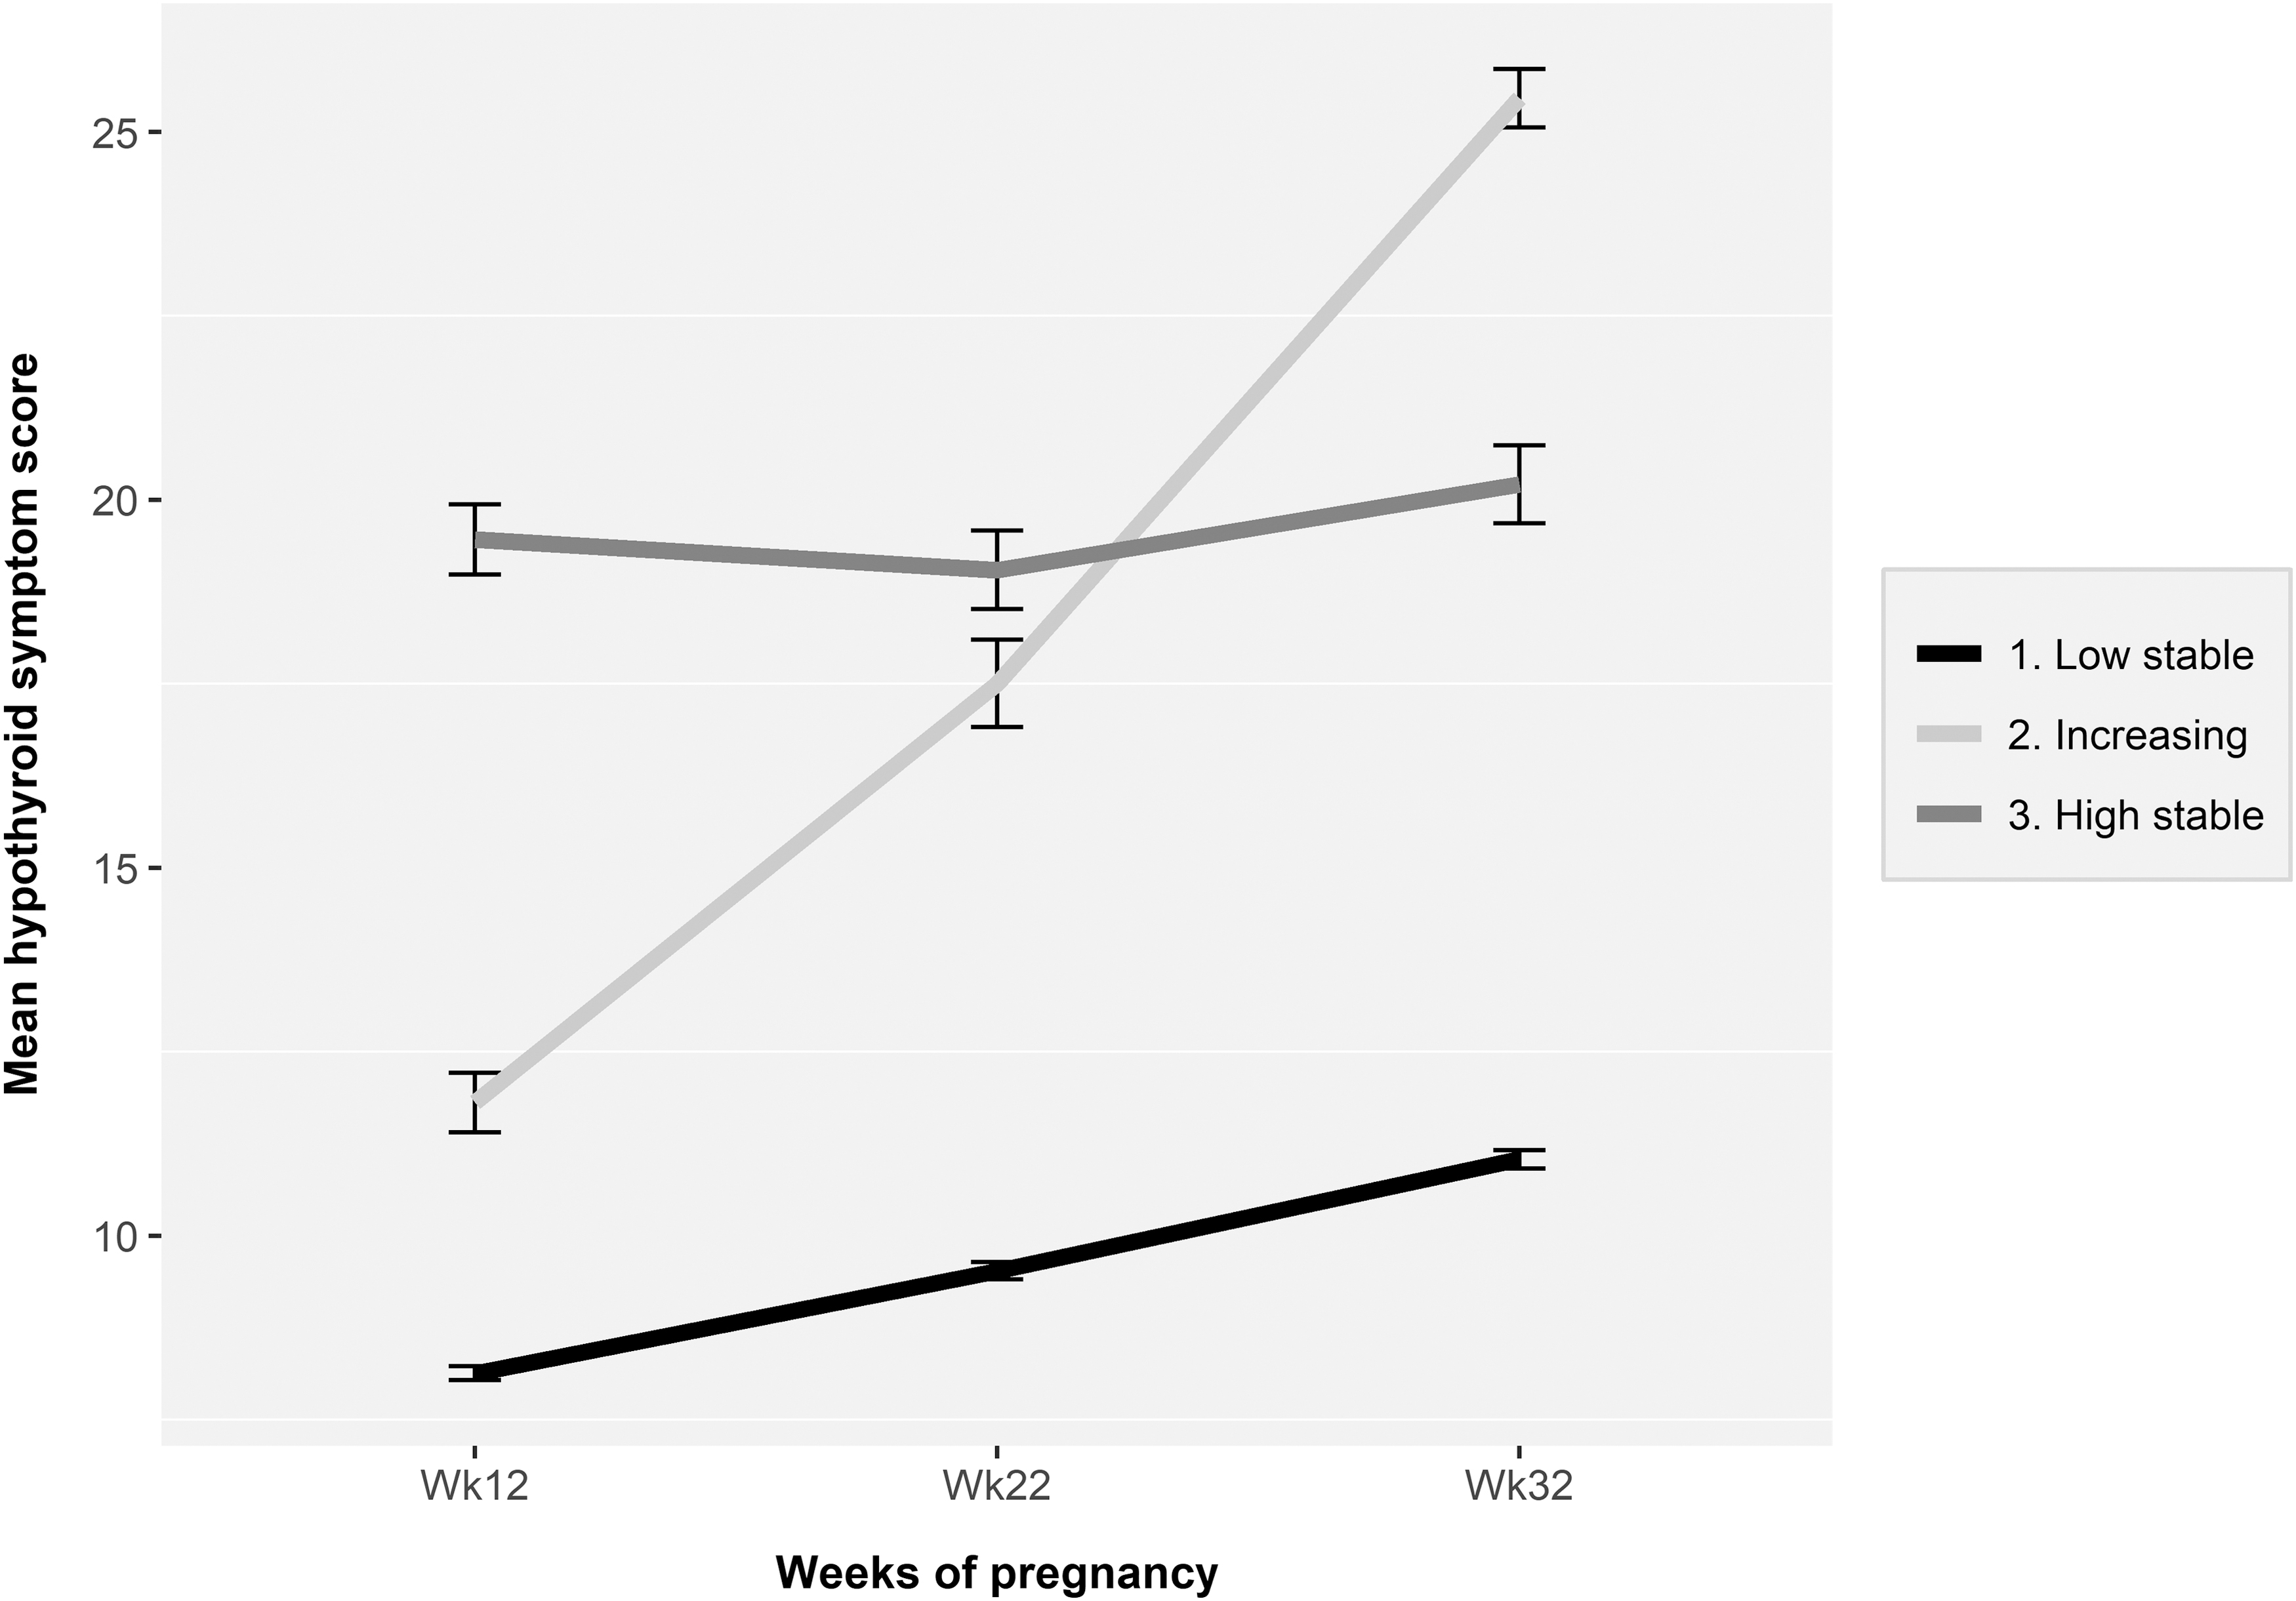
Longitudinal trajectories (classes) of hypothyroid symptoms during pregnancy (n = 1800). Mean (SD) hypothyroid symptom scores per trimester in the low stable class (1) were: 8.1 (3.7), 9.5 (4.5), and 11.0 (4.7). Mean (SD) hypothyroid symptom scores per trimester in the increasing class (2) were: 11.8 (3.8), 17.5 (5.6), and 25.4 (3.7). Mean (SD) hypothyroid symptom scores per trimester in the high stable class (3) were: 19.5 (4.9), 19.1 (5.2), and 20.2 (5.0). Mean hypothyroid symptom scores of classes 2 and 3 were at each trimester significantly higher compared with those of the reference class 1 [ANOVA: F(2, 1660 to 1797) = 294.2 to 508.2, all p < 0.001; post hoc Tukey: all p < 0.001, large effect sizes]. SD, standard deviation.
Class 1 represented the reference category. Class 2 (n = 90, 5.0%) was labeled “Increasing” and showed a significant increase in hypothyroid symptoms throughout pregnancy, with mean scores ranging from 11.8 to 25.4 throughout pregnancy [RM ANOVA; F(1.64) = 414.30, p < 0.001, η2 G = 0.62, large effect size]. Class 3 (n = 108, 6.0%) was labeled “High stable” and showed a high and relatively stable pattern of hypothyroid symptoms during pregnancy, with mean scores ranging from 19.5 to 20.2 throughout pregnancy.
The mean hypothyroid symptom scores of these three classes, presented in the legend of Figure 3, showed that at all trimesters the mean hypothyroid symptom scores of the increasing and high stable classes were significantly higher compared with all trimester scores of the reference class. Therefore, we decided to merge classes 2 and 3 into one group resulting in a new variable consisting of women with persistently low (n = 1602) and women with persistently high (n = 198) hypothyroid symptoms.
Trajectories of depressive symptoms
The EDS scores correlated significantly with hypothyroid symptoms at all trimesters of pregnancy (r = 0.50–0.55, p < 0.001, medium effect size). Growth mixture modeling showed a similar three trajectory solution for depressive symptoms as described in detail elsewhere. 23 This also resulted in two groups after merging the two classes with significantly higher mean EDS scores compared with the reference class. The two groups were (1) the reference group with persistently low mean EDS scores (n = 1492) and (2) a group with persistently high mean EDS scores (n = 308).
Change of thyroid hormones from 12 to 32 weeks of gestation
Because 11 women gave birth before 32 weeks of gestation and the 9 women with clinical hypothyroidism and 2 with a TSH >10 at 12 weeks all received thyroxine (T4) substitution therapy, these 22 women were excluded from subsequent analyses. In the remaining 1778 women (who gave birth at term and without T4 substitution), we evaluated the change of fT4 and TSH concentrations from 12 to 32 weeks of gestation. Because at a cross-sectional level (Table 2), hypothyroid symptom scores were predominantly related to fT4 concentrations, we focused on fT4 changes. Three different subgroups of fT4 changes are shown in Table 3, namely, group 1 in which the fT4 decreased (n = 1748, 98.2%); group 2 in which the fT4 did not change (n = 12, 0.7%); group 3 in which the fT4 increased (n = 18, 1%).
Different Subgroups of Women According to Free Thyroxine Changes Between 12 and 32 Weeks Gestation (n = 1778)
At 32 weeks, the 9 women with overt hypothyroidism at 12 weeks (who all received T4 treatment) and 11 women who delivered before 32 weeks gestation were excluded from the original 1800 women at 12 weeks gestation.
TPO-Ab+, TPO-Ab >35 IU/mL; T4, thyroxine.
At 12 weeks, women in group 3 had significantly lower fT4 compared with the other two groups (Kruskal–Wallis: H = 23.3, p < 0.001), whereas TSH was not significantly different between these three groups (Kruskal–Wallis: H = 0.64, p = 0.73). Similarly, at 32 weeks the fT4 differed significantly between all three groups (Kruskal–Wallis: H = 41.0, p < 0.001) with no significant differences for TSH (Kruskal–Wallis: H = 0.87, p = 0.65). Also, in group 3 (increasing), up to 22.2% of the women showed elevated TPO-Ab at both 12 and 32 weeks, which was different from the two other groups [χ 2 (2) = 4.9, p = 0.084 at 12 weeks, χ 2 (2) = 7.2, p = 0.027] at 32 weeks.
A closer look at the thyroid function at 12 weeks gestation of these three subgroups showed that of group 1, 76% was euthyroid, which was 66.7% in group 2 and 52.6% in group 3. At 12 weeks gestation in group 1, 2.3% of the women had SCH, while this was 1% in group 2, and 10.5% in group 3. Thus, women who showed an increasing fT4 pattern toward end gestation had significantly more often SCH at 12 weeks gestation of whom one-third had elevated TPO-Ab. This explains the high percentage of TPO-Ab in group 3.
Because the majority (>98%) showed a decreasing fT4 pattern, we calculated a delta fT4 in group 1 (n = 1748) by subtracting fT4 at 32 weeks from that of 12 weeks for each woman. The median delta fT4 was 2.80 pmol/L with a range from 0.01 to 13. Similarly, in this group, the delta TSH was calculated by subtracting the TSH at 12 weeks from that of 32 weeks of gestation for each woman. The median delta TSH was 0.24 IU/L with a range from −6.7 to 2.9 IU/L. These two delta variables were entered as the independent variables into a multivariate logistic regression analysis (Table 4) with persistently low/high hypothyroid symptoms as the dependent variable, adjusted for persistently low/high depressive symptoms, baseline fT4, and other confounders (Table 4). Persistently high levels of hypothyroid symptoms were significantly related to the delta fT4, but not to delta TSH. Per unit pmol/L fT4 decrease from 12 to 32 weeks of gestation, the likelihood to present persistently high hypothyroid symptoms increased with 46%. Persistently high hypothyroid symptom scores were also significantly related to high depressive symptoms (OR = 7.1 [CI 5.11–9.92]).
Independent Association Between Persistently Low/High Levels of Hypothyroid Symptoms Throughout Pregnancy and the Change of Free Thyroxine/Thyrotropin from First to Third Trimester, Adjusted for Persistently Low/High Levels of Depressive Symptoms Throughout Pregnancy and Other Confounders (Multivariate Logistic Regression, n = 1748)
Delta fT4, fT4 12 weeks minus fT4 32 weeks.
Delta TSH, TSH 32 weeks minus TSH 12 weeks.
[CI], confidence interval; OR, odds ratio.
Discussion
The current study shows that at 12 weeks gestation, women with fT4 below the 2.5th percentile with TSH >97.5 cutoff (clinical hypothyroidism) or with normal TSH (between 2.5th and 97.5th percentile, isolated hypothyroxinemia) showed significantly higher hypothyroid symptoms compared with a carefully defined reference group with adequate fT4 values between the 10th and 90th percentile with normal TSH (between 2.5th and 97.5th percentile). Women with SCH did not report higher hypothyroid symptoms. Throughout pregnancy, three different patterns of hypothyroid symptoms were distinguished, a large reference group with persistently low scores and two smaller groups with persistently high scores of thyroid symptoms. A higher decrease of fT4 (but not of TSH) from 12 to 32 weeks of gestation, after adjustment for covariates, was independently related to persistently high symptoms throughout pregnancy.
Although there is a general consensus that possible signs and symptoms related to thyroid dysfunction are mainly caused by fT4 rather than TSH, 1 we feel that the interpretation of plasma fT4 and TSH concentrations should be subject to discussion. First, and most importantly, when comparing “cases” with “controls”, it is crucial to have an appropriate definition of the “controls.” This should preferentially refer to women who do not have too little nor too much fT4. It is questionable whether there is a relevance to comparing symptom scores of women in a “case” group (using the commonly used lowest cutoff of fT4 < 2.5th percentile), to symptom scores to a group of “controls” that may contain women with fT4 levels between the 2.5th and 5th percentile. 3,24 In a previous study from the same cohort, we were unable to show differences between the different thyroid dysfunction subgroups using these strict cutoff criteria. 17 Second, it remains questionable whether comparing symptom scores of women with SCH (a definition mainly based on elevated TSH levels) without further stratifying for fT4 in this subgroup is relevant. 25
As shown in the current study, the vast majority of these SCH women in fact had adequate fT4 levels between 10th and 90th percentile. This means that when comparing symptoms between “euthyroid” women and those with SCH, the variability of fT4 in these women should be considered. Regarding the definition of isolated hypothyroxinemia (and hyperthyroxinemia) a similar discussion can be conducted. Applying a cutoff of <2.5th percentile suggests that all women with fT4 levels above this cutoff (e.g., at 5th percentile) show “normal” fT4 concentrations, which seems rather arbitrary. 3,4
From a prospective point of view, the current study is among the first to evaluate trajectories of hypothyroid symptoms throughout gestation and showed three different classes, which after merging resulted in a group with persistently low and one with persistently high symptom scores. The finding that the decrease of fT4 in 98% of the women (and not the increase of TSH) during pregnancy was independently associated with persistently high hypothyroid symptom scores (adjusted for depressive symptoms) is important additional evidence that clinical symptoms commonly reported in thyroid dysfunction are predominantly related to fT4 and not to TSH. Up to 98% of the women showed an fT4 decline. Thus, this decline should be regarded as a physiological phenomenon due to hemodilution, the increasing fetal demands of maternal T4 supply with increasing term and a hCG effect. 4 The hCG declines during pregnancy and it is reasonable to suggest that lower hCG levels throughout end gestation will result in lower fT4 levels.
Low maternal fT4 concentrations during early pregnancy have been associated with poor obstetric outcome. 4 Future research should focus on the possible association between the fT4 decline and obstetric complications such as pregnancy-induced hypertension or preterm birth. However, in this case the fT4 decline should be extrapolated to the first trimester fT4 concentration: it is obvious that a decline of, for example, 3 pmol/L in a woman with a 12 weeks fT4 of 12 pmol/L (the 5th percentile in the current study) might be less favorable with regard to obstetric outcome compared with a similar decline of a woman with a 12 weeks fT4 of 16 pmol/L (the 90th percentile in the current study).
The current study has strengths and limitations. First, a major strength was the prospective follow-up of a large sample in which hypothyroid symptoms were assessed at all trimesters of gestation, allowing for the use of growth mixture modeling. A second major strength was that applying a carefully defined reference group—suggestive for adequate fT4 levels—resulted in comprehensive different symptom scores according to different levels of fT4 in the expected direction. Third, introducing a change (decrease) of fT4 concentrations into a prospective design further allowed to link lower fT4 concentrations to higher levels of hypothyroid symptoms, after adjustment for important confounders of hypothyroid symptoms.
Fourth, we adjusted for depressive symptoms but fT4 change remained significantly associated with persistently low hypothyroid symptoms. Also, the women with SCH at 12 weeks in the current study were not treated, except two women with TSH >10 IU/mL. Together with those women with overt hypothyroidism, they received T4 substitution and were excluded from the follow-up analyses. Therefore, possible T4 intervention could not interfere with hypothyroid and/or depression symptom scores during follow-up.
A limitation of the study is that participants were predominantly white, had a partner, and were relatively highly educated, which is significantly different compared with the demographic characteristics of the Dutch general pregnant population. 26,27 Also, women with severe psychiatric diseases were excluded as well as women with pre-existing known autoimmune disorders. This hampers the generalizability of the findings. Another limitation is that the subgroups of women with thyroid dysfunction are relatively small. Therefore, even larger samples should be followed to further stratify on fT4 within these groups. Iodine status was not assessed but the area where the study was conducted is a proven iodine sufficient area. 12
A limitation is also that we did not adjust for anemia while during pregnancy iron-deficient anemia related to inadequate iron intake is very common due to physiological volume expansion and fetal iron demands. 28 Significant anemia affects up to 26% of the pregnant women, which—especially in more developed countries—predominantly is related to iron deficiency. 28 There is an important association between iron and thyroid hormone metabolism: iron deficiency impairs thyroid metabolism because TPO is a heme enzyme that becomes active only after binding heme. 29 On the other hand, it is known that autoimmune thyroid disease patients have frequently comorbid autoimmune gastritis, which reduces iron absorption. 29 Future research should adjust for iron status when evaluating hypothyroid symptoms.
The outcome of the current study could be very relevant for the consistently reported “paradox” in perinatal thyroid research. There is clear evidence that SCH is associated with severe poor obstetric outcome, but most, if not all, RCTs with T4 substitution so far have shown negative results. 30 –32 However, these RCTs did not report a stratification of fT4 in the group of women with SCH (those with low fT4 levels compared with those with high normal fT4 levels). There are several reports of SCH patients in the general population for whom T4 therapy does not improve quality of life in the intervention group compared with controls, but again no stratification for fT4 levels before intervention have been reported. 24,33,34 It would be interesting to evaluate in future research whether the association between obstetric complications and SCH is related to the fT4 status in these women.
A strategy of fT4 stratification in SCH women as outcome of the current study could imply the following. As explained by the ATA guidelines, a trimester-specific reference range should be defined in TPO-Ab-negative women with the commonly used cutoffs of 2.5th and 97.5th percentile of TSH and fT4. 3 To evaluate women with SCH who might have clinically relevant low fT4 levels, it is important to stratify for fT4 within this group. This stratification should focus on women with definitely sufficient fT4 and those with possibly more problematic fT4 levels. In the current study, we used the 10th percentile fT4 as cutoff, above which it might be assumed that there is sufficient fT4. Using this cutoff, up to 80% of the SCH women showed adequate fT4 levels. It is obvious that other cutoffs could also be advocated, for example, the lowest quartile cutoff to define a threshold, above which it is reasonable to accept that women have sufficient fT4 levels. In the current study, 35 of the 62 women (56%) with SCH showed fT4 levels above the lowest quartile of the total TPO-Ab-negative group (>13.36 pmol/L).
Future studies—or re-evaluation of previous studies—should focus on the association between SCH and poor obstetric outcome (or impaired neurodevelopment of the offspring) taking fT4 levels into account: are especially SCH women with lower fT4 levels at risk? Also, it would be interesting to repeat these analyses in SCH pregnant women from proven iodine-deficient areas. It might be hypothesized that in this case, the number of SCH women who also have fT4 levels in the lower range (between 2.5th and 10th percentile) would be higher compared with the current study, which was performed in a definitely proven iodine sufficient area. 13,14
In conclusion, the current study shows that a careful definition of a control group of pregnant women with appropriate fT4 concentrations might distinguish women with high hypothyroid symptom scores. The association between decreasing fT4 concentrations (but not with increasing TSH) throughout pregnancy suggests that it is rather the fT4 than TSH that is responsible for reporting symptoms, which should make clinicians aware that in the large category of women with SCH, it is important to stratify for fT4.
Footnotes
Authors' Contributions
V.J.P.: Conceptualization, Methodology, Investigation, Formal analysis, Writing—Original draft, and Supervision. L.P.H.: Methodology, Validation, Formal analysis, Writing—Review and editing, and Visualization. M.G.B.M.B.: Writing—Review and editing. M.A.C.B.: Writing—Review and editing. J.G.K.: Writing—Review and editing. W.M.W.: Conceptualization, Validation, Writing—Review and editing, and Supervision.
Ethics Approval
All procedures performed in studies involving human participants were in accordance with the ethical standards of the Institutional and/or National Research Committee (Psychology Ethics Committee at Tilburg University EC-2012.25) and with the 1964 Helsinki Declaration and its later amendments or comparable ethical standards.
Data Availability Statement
Datasets may be made available on reasonable request from the corresponding author.
Acknowledgments
The authors would like to thank all participating mothers and the 17 participating midwifery practices for their contribution to the HAPPY study.
Author Disclosure Statement
No competing financial interests exist.
Funding Information
No funding was received for this article.
Supplementary Material
Supplementary Table S1
Supplementary Table S2
Supplementary Table S3