
Abstract
Background:
Various models have been proposed to predict frailty, including those based on clinical criteria and phenotypes. However, a simple biomarker associated with frailty has been not yet identified. The aim of this study is to evaluate the relationship between free triiodothyronine (fT3)/free thyroxine (fT4) ratio value and the degree of frailty among three different cohorts of older individuals: (1) acutely ill hospitalized patients, (2) nursing-home (NH) residents, and (3) home-dwelling centenarians.
Methods:
We performed a secondary analysis of de-identified patient-level data from two prospective observational studies on acutely hospitalized older patients (Geriatric Acute Unit [GAU]), and home-dwelling centenarians (CENT), and a retrospective-prospective observational study on older NH residents. Demographic characteristics, along with a 30-items Frailty Index (FI) and serum thyrotropin, fT3 and fT4 measurements were obtained.
Results:
Six hundred fifteen individuals (aged 86.4 ± 8.9 years; 55.1% females) were included in the study, including 298 (48.5%) GAU, 250 (40.6%) NH, and 67 (10.9%) CENT. A significant inverse relationship between fT3/fT4 ratio and FI values was observed (ρs = −0.17 [confidence interval; CI: −0.092 to 0.252], p < 0.001), and this was confirmed by logistic multivariate analysis (β = −0.44, odds ratio [OR]: 0.64 [CI: 0.47–0.87], p < 0.001) (after adjustment for age, sex, and cohorts). Moreover, a progressively decreased mortality risk was associated with rising fT3/fT4 ratio (OR 0.60 [CI: 0.44–0.80] β = −0.51, p < 0.001].
Conclusions:
The fT3/fT4 ratio value was inversely correlated with frailty degree and mortality risk in a large cohort of older individuals, including centenarians, regardless of their sex and clinical condition. fT3/fT4 ratio value could represent an easily measured independent biochemical marker of frailty degree in older people.
Introduction
Advancing age is associated with a progressive increase in the prevalence of frailty. 1 Frailty is characterized by reduced resistance to stressful events, stemming from a functional decline of multiple physiological systems. 2 Several studies have shown that frail individuals are at higher risk for rehospitalization and reduced survival 3,4 compared with nonfrail individuals. Various models have been proposed to predict frailty, mainly based on clinical features, either as analogue scores or digital algorithm. 1,5 However, a simple biochemical marker of frailty has been not identified.
In older frail subjects, several physiological systems are dysregulated, such as the musculoskeletal, the immune and the endocrine systems, leading to progressive function impairment. 6 We recently reported that in a large cohort of hospitalized older patients, free triiodothyronine (fT3)/free thyroxine (fT4) ratio value was associated with the degree of frailty. 7 Across the entire cohort, the reduction of fT3/fT4 ratio value was significantly associated with worsening of all the clinical parameters explored by multidimensional geriatric assessment (MGA) and the MPI (Multi Prognostic Index), 8 resulting a reliable marker of overall mortality.
Yet these results from older patients hospitalized for acute diseases may not be directly generalizable to other older individuals. 9 Arosio et al 10 recently reported that, among all thyroid function parameters, the fT3/fT4 ratio value represented the best independent marker of frailty degree in home-dwelling centenarians. Therefore, we sought to confirm the relationship between fT3/fT4 ratio value and the degree of frailty in three different cohorts of older individuals, including (1) acutely ill hospitalized patients, (2) nursing-home (NH) residents, and (3) home-dwelling centenarians. We also explored for a potential association of fT3/fT4 ratio with overall mortality.
Patients and Methods
Study design and participant
We performed a secondary analysis using de-identified patient-level data from two prospective observational studies on acutely hospitalized older patients (admitted to a university hospital in central Italy) and home-dwelling centenarians (living in northern Italy) 8,10 along with a retrospective-prospective observational study on older residents of two nursing homes in southern Italy. The NH participants were included in the study if they were submitted to MGA as well as full thyroid function evaluation at admission. We excluded from the analysis patients diagnosed with known thyroid disease and/or receiving chronic treatment with drugs known to affect thyroid function (i.e., thyroid hormone preparations, amiodarone, methimazole, and propylthiouracil), and participants with incomplete items of the Frailty Index (FI). Subjects with serum thyrotropin (TSH) and free thyroid hormone values outside the normal reference range were also excluded.
The MGA included the following geriatric scales: Cumulative Illness Rating Scale (CIRS), 11 Basal (BADL) 12 and Instrumental (IADL) 13 Activities of Daily Living, Mini Nutritional Assessment (MNA) 14 (categorized in dichotomous variables [malnutrition or risk of malnutrition and normal]), and Mini Mental State Examination (MMSE) 15 (categorized as follows: severe cognitive impairment [MMSE ≤18], moderate cognitive impairment [MMSE 19–24], mild cognitive impairment for [MMSE 25–27], and no cognitive impairment [MMSE ≥28]).
We calculated a baseline 30-items FI in each subject, based on data from medical records and MGA, as described by Searle et al 16 (which incorporated a wide range of signs, symptoms, and disabilities). Each item of the FI was scored as “0” (absence) or “1” (presence) of the deficit. The FI score was estimated as the ratio of the number of health deficits of the individual, divided by the total number of health deficits considered for its computation (n = 30). FI severity was categorized as follows: >0.3 frail; 0.08–0.3 prefrail; and <0.08 robust (see Supplementary Table S1).
The study participants in respective cohorts were followed for one year after the following respective events: hospital discharge (Geriatric Acute Unit [GAU] group), after NH admission (NH group) and primary care visit (home-dwelling centenarians). The one-year survival rate was assessed by the Regional Health Archives and phone interviews. Each patient provided written informed consent to participate to the study; in case of patients temporarily or permanently without capacity informed consent was provided by the legally authorized delegate.
The study protocols were approved by each local Ethical Committee: Pisa University Hospital (Approval No. 881/2016) for the acutely ill hospitalized patients, Fondazione IRCSS Ca′ Granda Ospedale Maggiore Policlinico, Mlan (Approval No. 2035/2011) for the home-dwelling centenarians, and Regione Calabria, Area Centro (Approval No. 18/2018) for the NH residents. We reported this study in accordance with the STROBE (Strengthening the Reporting of Observational Studies in Epidemiology) reporting guideline. 17
Laboratory measurements
Free thyroid hormones (fT3 and fT4) and TSH were measured according to standard procedures of the three participating study centers. These were as follows: hospitalized patients—immunometric technique (Ortho-Clinical Diagnostics, Amersham, United Kingdom); home-dwelling centenarians—ElectroChemiLuminescence ImmunoAssay (ECLIA), Cobas Roche Diagnostics GmbH, NH residents-ChemiLuminescence ImmunoAssay, Immulite 2000, Diagnostic Products Corporation.
In the GAU cohort, blood samples were drawn the day after hospitalization, at 8:00 am after an overnight fast; similarly, in the NH cohort overnight fasting blood samples were collected the day after admission, whereas in the CENT cohort blood samples were collected the day of the ambulatory visit, in the morning.
Normal values (95% confidence limits as determined by internal laboratory validation) for TSH, fT4, and fT3 were as follows: 0.4–4.0 mIU/L, 0.7–1.7 ng/dL, and 2.7–5.7 pg/mL, respectively, for acutely hospitalized patients; 0.27–4.2, 0.9–1.7, and 2.0–4.4, respectively, for home-dwelling centenarians; and 0.4–4.0, 0.9–1.7, and 2.3–4.9, respectively, for NH residents.
Statistical analysis
We performed statistical analysis of baseline variables as the mean and standard deviation for continuous variables and proportion (%) for categorical variables. Shapiro's test was used for assessing the normality of distribution for each variable. Wilcoxon sum rank test and Kruskall–Wallis test were performed for baseline nonparametric variables comparisons, as appropriate. p-Values <0.05 were considered statistically significant, with confidence intervals (CIs). Two different linear regression models were performed, which examined baseline frailty status (FI >0.30) as the dependent variable and fT3/fT4 ratio value as the regressor: (1) a crude (unadjusted) model; (2) a model adjusted for age, sex, and study subgroups as confounders.
In a sensitivity analysis, we explored the relationship between fT3/fT4 ratio value and one-year overall mortality both using the exposure as a continuous variable and after dividing fT3/fT4 into tertiles. In the first case, we performed a logistic multivariate analysis, estimating the odds ratio (OR) and CI, adjusted for age, sex, and study subgroups. Second, after verifying the proportional hazards assumption using Schöenfeld residuals, the hazard ratio (HR) and CI of mortality was estimated using the three tertiles of fT3/fT4, first as a crude analysis and then for the aforementioned confounders. Finally, a secondary analysis was carried out to explore the correlation between fT3, fT4, and FI by calculating the Spearman coefficient in the pooled population and across each of the three cohorts.
Statistical analyses were performed using RStudio software, Version 1.2.5001 (RStudio, Inc., Boston, MA, USA). A p-value of <0.05 was used to define statistical significance.
Results
We included a total of 615 older individuals (55.1% females, mean age 86.4 ± 8.9 years); of these, 298 (48.5%) were hospitalized in the GAU, 250 (40.6%) were NH residents, and 67 (10.9%) home-dwelling centenarians (CENT) (flow diagram in Supplementary Fig. S1). According to the FI score, 411 patients (66.8%) were categorized as frail, 93 (15.1%) prefrail, and 112 (18.2%) robust.
As shown in Table 1, women were significantly less prevalent in the population admitted to the GAU (42.2%) compared with the other cohorts (66.4% [NH] and 70.1% [CENT], p < 0.001). Moreover, GAU patients were significantly less disabled than NH residents and home-dwelling centenarians in terms of median scores of both ADL (4 [IQR 5] vs. 1 [IQR 1] and 2 [IQR 4], respectively; p < 0.001) and IADL (2.5 [IQR 5] vs. 1 [IQR 2] and 1 [IQR 2], respectively; p < 0.001). The prevalence of moderate to severe cognitive impairment was also significantly lower in the GAU cohort as compared with the NH and CENT cohorts (p < 0.001).
Study Population Characteristics as a Whole and According to Health Care Setting
ADL, activities of daily living; CIRS, Cumulative Illness Rating Scale; FI, Frailty Index; fT3, free triiodothyronine; fT4, free thyroxine; GAU, Geriatric Acute Unit; IADL, Instrumental Activities of Daily Living; IQR, interquartile range; NH, nursing-home; SD, standard deviation; TSH, thyrotropin.
The burden of comorbidity of the whole cohort, as assessed by CIRS-c, was 5 (IQR 4), significantly higher among centenarians (8 [IQR 6]) as compared with GAU and NH individuals (6 [IQR3] and 4 [IQR3], respectively; p < 0.001). Moreover, the prevalence of frailty was almost twice in both NH and CENT subjects than in GAU patients (90.4% and 82.1% vs. 42.4%, respectively; p < 0.001); while the overall mortality rate was almost twice in CENT as compared with GAU and NH individuals (94% vs. 49.6% and 37.2%, respectively; p < 0.01).
Serum TSH levels were not significantly different among individuals of the three cohorts, while GAU patients showed significantly higher serum free thyroid hormone values as compared with NH and CENT subjects (fT3: 2.57 ± 0.66 ng/L vs. 2.39 ± 0.75 ng/L and 2.47 ± 0.44 ng/L, respectively; fT4: 1.35 ± 0.39 ng/L vs. 1.28 ± 0.27 ng/L and 1.19 ± 2.28 ng/L, respectively; p < 0.01 for both). However, fT3/fT4 ratio values resulted not statistically different in the participants of the three subcohorts, although slightly higher in CENT (NH: 1.96 ± 0.81; GAU: 2.03 ± 0.67; CENT: 2.15 ± 0.63, p = 0.17).
In dividing the entire cohort by fT3/fT4 ratio tertiles, individuals in the third tertile (T3) were significantly older than those in the first (T1) and second tertile (T2) (87.4 ± 10.1 years vs. 86.2 ± 8.8 years and 85.8 ± 7.3 years, respectively; p = 0.005). However, differences in sex distribution did not reach the statistical significance (36.9% vs. 33.1% and 29.9% of women, respectively; p = 0.07). The prevalence of frail subjects progressively increased from T3 to T2 and T1 (29.8% vs. 31.1% and 39.1%, respectively; p < 0.0001). A similar trend across fT3/fT4 ratio tertiles was observed regarding the degree of disability: median ADL: 3 (IQR = 2 vs. 2 [IQR = 2] and 1 [IQR = 2]), respectively; p < 0.001 (Table 2). The prevalence of subjects without cognitive impairment was almost one-half in the T1 cohort compared with both T2 and T3 cohorts (p < 0.003). Finally, one-year overall mortality rate progressively increased coming from the third to the first fT3/fT4 ratio tertile (20.5% vs. 35.7% and 43.8%, respectively; p < 0.001).
Study Population Characteristics According to Free Triiodothyronine/Free Thyroxine Tertiles
By analyzing the variation of frailty prevalence across the fT3/fT4 ratio tertiles in each subcohort of participants, we found a superimposable significant rising trend from T3 to T1 (GAU: 32.2%, 37.8% and 53.9%, for T3, T2, and T1, respectively; p = 0.015; NH: 80.8%, 90.7%, and 97.1%, respectively; p = 0.005; CENT: 61.5%, 93.3% and 95.2%, respectively; p = 0.005).
Correlation analyses
A significant inverse relationship between the value of fT3/fT4 ratio and the degree of frailty was observed, both in the entire cohort (ρ s = −0.17 [CI: −0.092 to 0.252], p < 0.001) and in each subcohort (GAU: ρ s = −0.20 [CI: −0.08 to 0.32], p = 0.001; NH: ρ s = −0.15 [CI: −0.027 to 0.270], p = 0.017; CENT: ρ s = −0.38 [CI: −0.140 to 0.572], p = 0.003). The significant relationship between decreasing values of fT3/fT4 ratio and the degree of frailty was confirmed by logistic multivariate analysis (β = −0.44, OR: 0.64 [CI: 0.47–0.87], p < 0.001) (Fig. 1 and Supplementary Table S2).
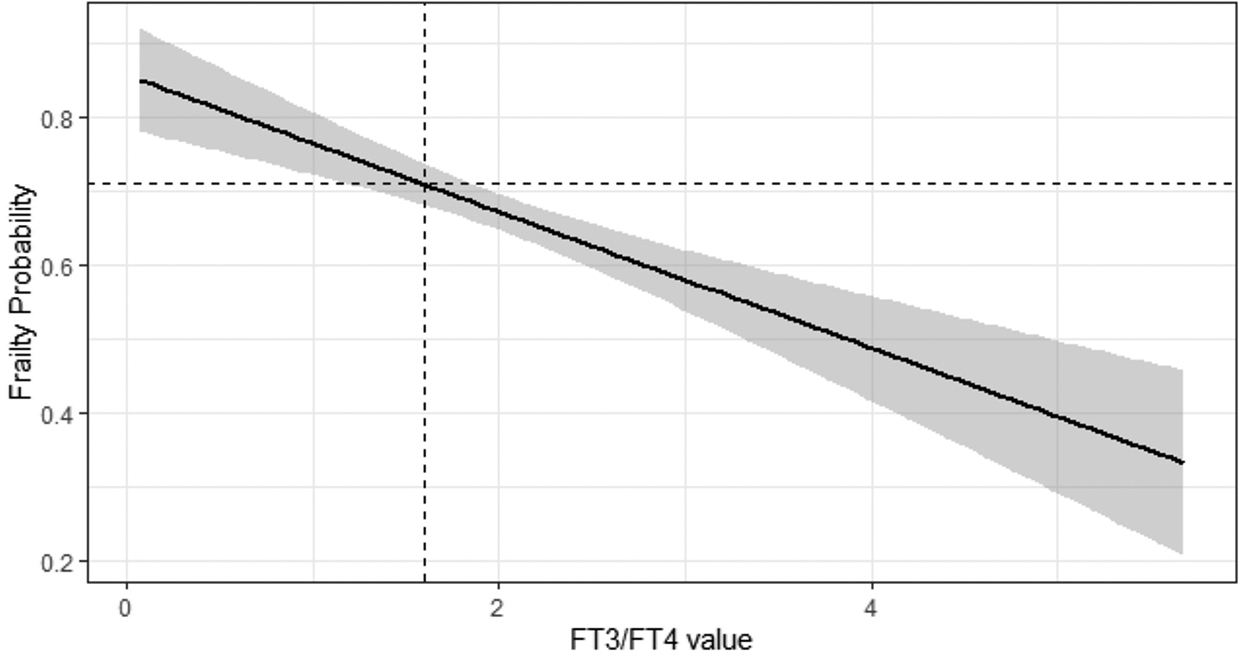
Regression analysis inferential plot. Relationship between fT3/fT4 ratio values and odds of being frail (defined by a 30-items FI, with FI severity categorized as follows: >0.3 frail; 0.08–0.3 prefrail; and <0.08 robust). The dashed line represents fT3/fT4 values lower than 1.7 (first tertile of fT3/fT4 ratio) and the corresponding probability of being frail. FI, Frailty Index; fT3, free triiodothyronine; fT4, free thyroxine.
Moreover, logistic regression analysis of the entire cohort showed a progressive decrease in mortality risk with increasing fT3/fT4 ratio values (OR 0.61 [CI: 0.47–0.76] β = −0.50, p < 0.001) even after adjustment for age, sex, and subgroups (OR 0.60 [CI: 0.44–0.80] β = −0.51, p < 0.001) (Fig. 2). Finally, the significant progressive variation of overall mortality rate across the fT3/fT4 ratio tertiles was confirmed by Cox regression analysis of either the whole cohort (HR 1.62 [CI 1.20–2.17], p < 0.001) or each subcohort (GAU: HR 3.50 [CI 2.07–5.94], p < 0.001; NH: HR 2.63 [CI 1.86–3.7], p < 0.001; CENT: HR 1.92 [CI: 1.12–3.75], p = 0.003) (Fig. 3).
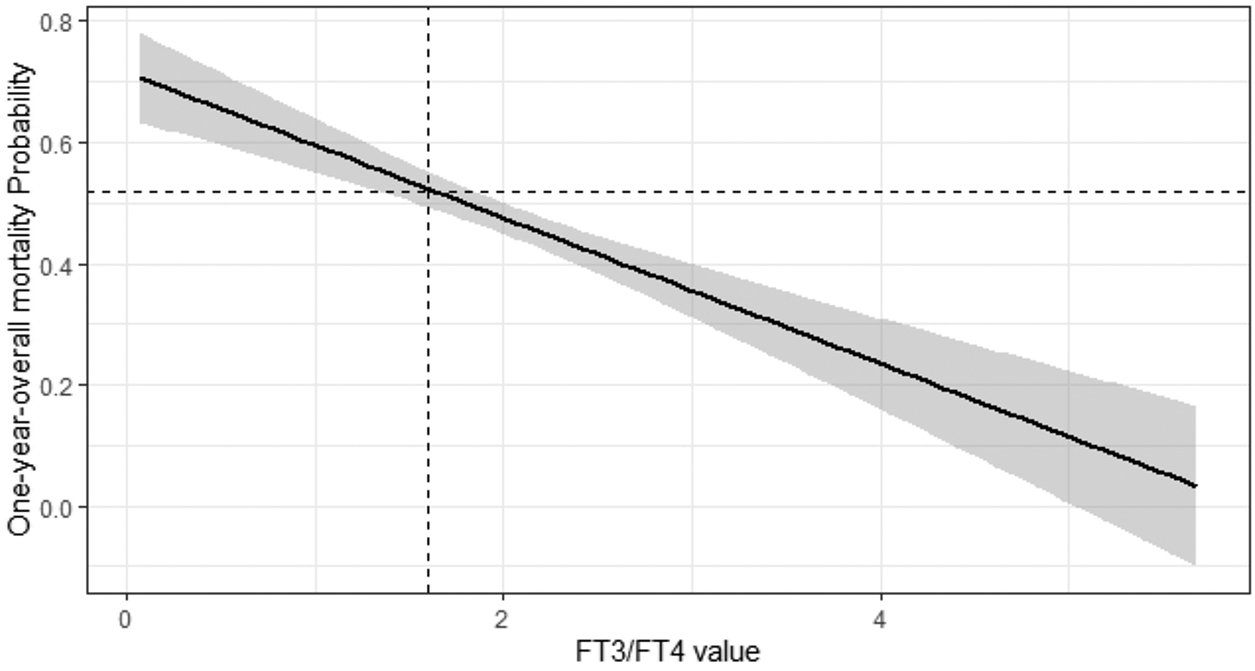
Regression analysis inferential plot. Relationship between fT3/fT4 values and odds of death. The dashed line represents fT3/fT4 values lower than 1.7 (first tertile of fT3/fT4 ratio) and the corresponding 1-year mortality risk.
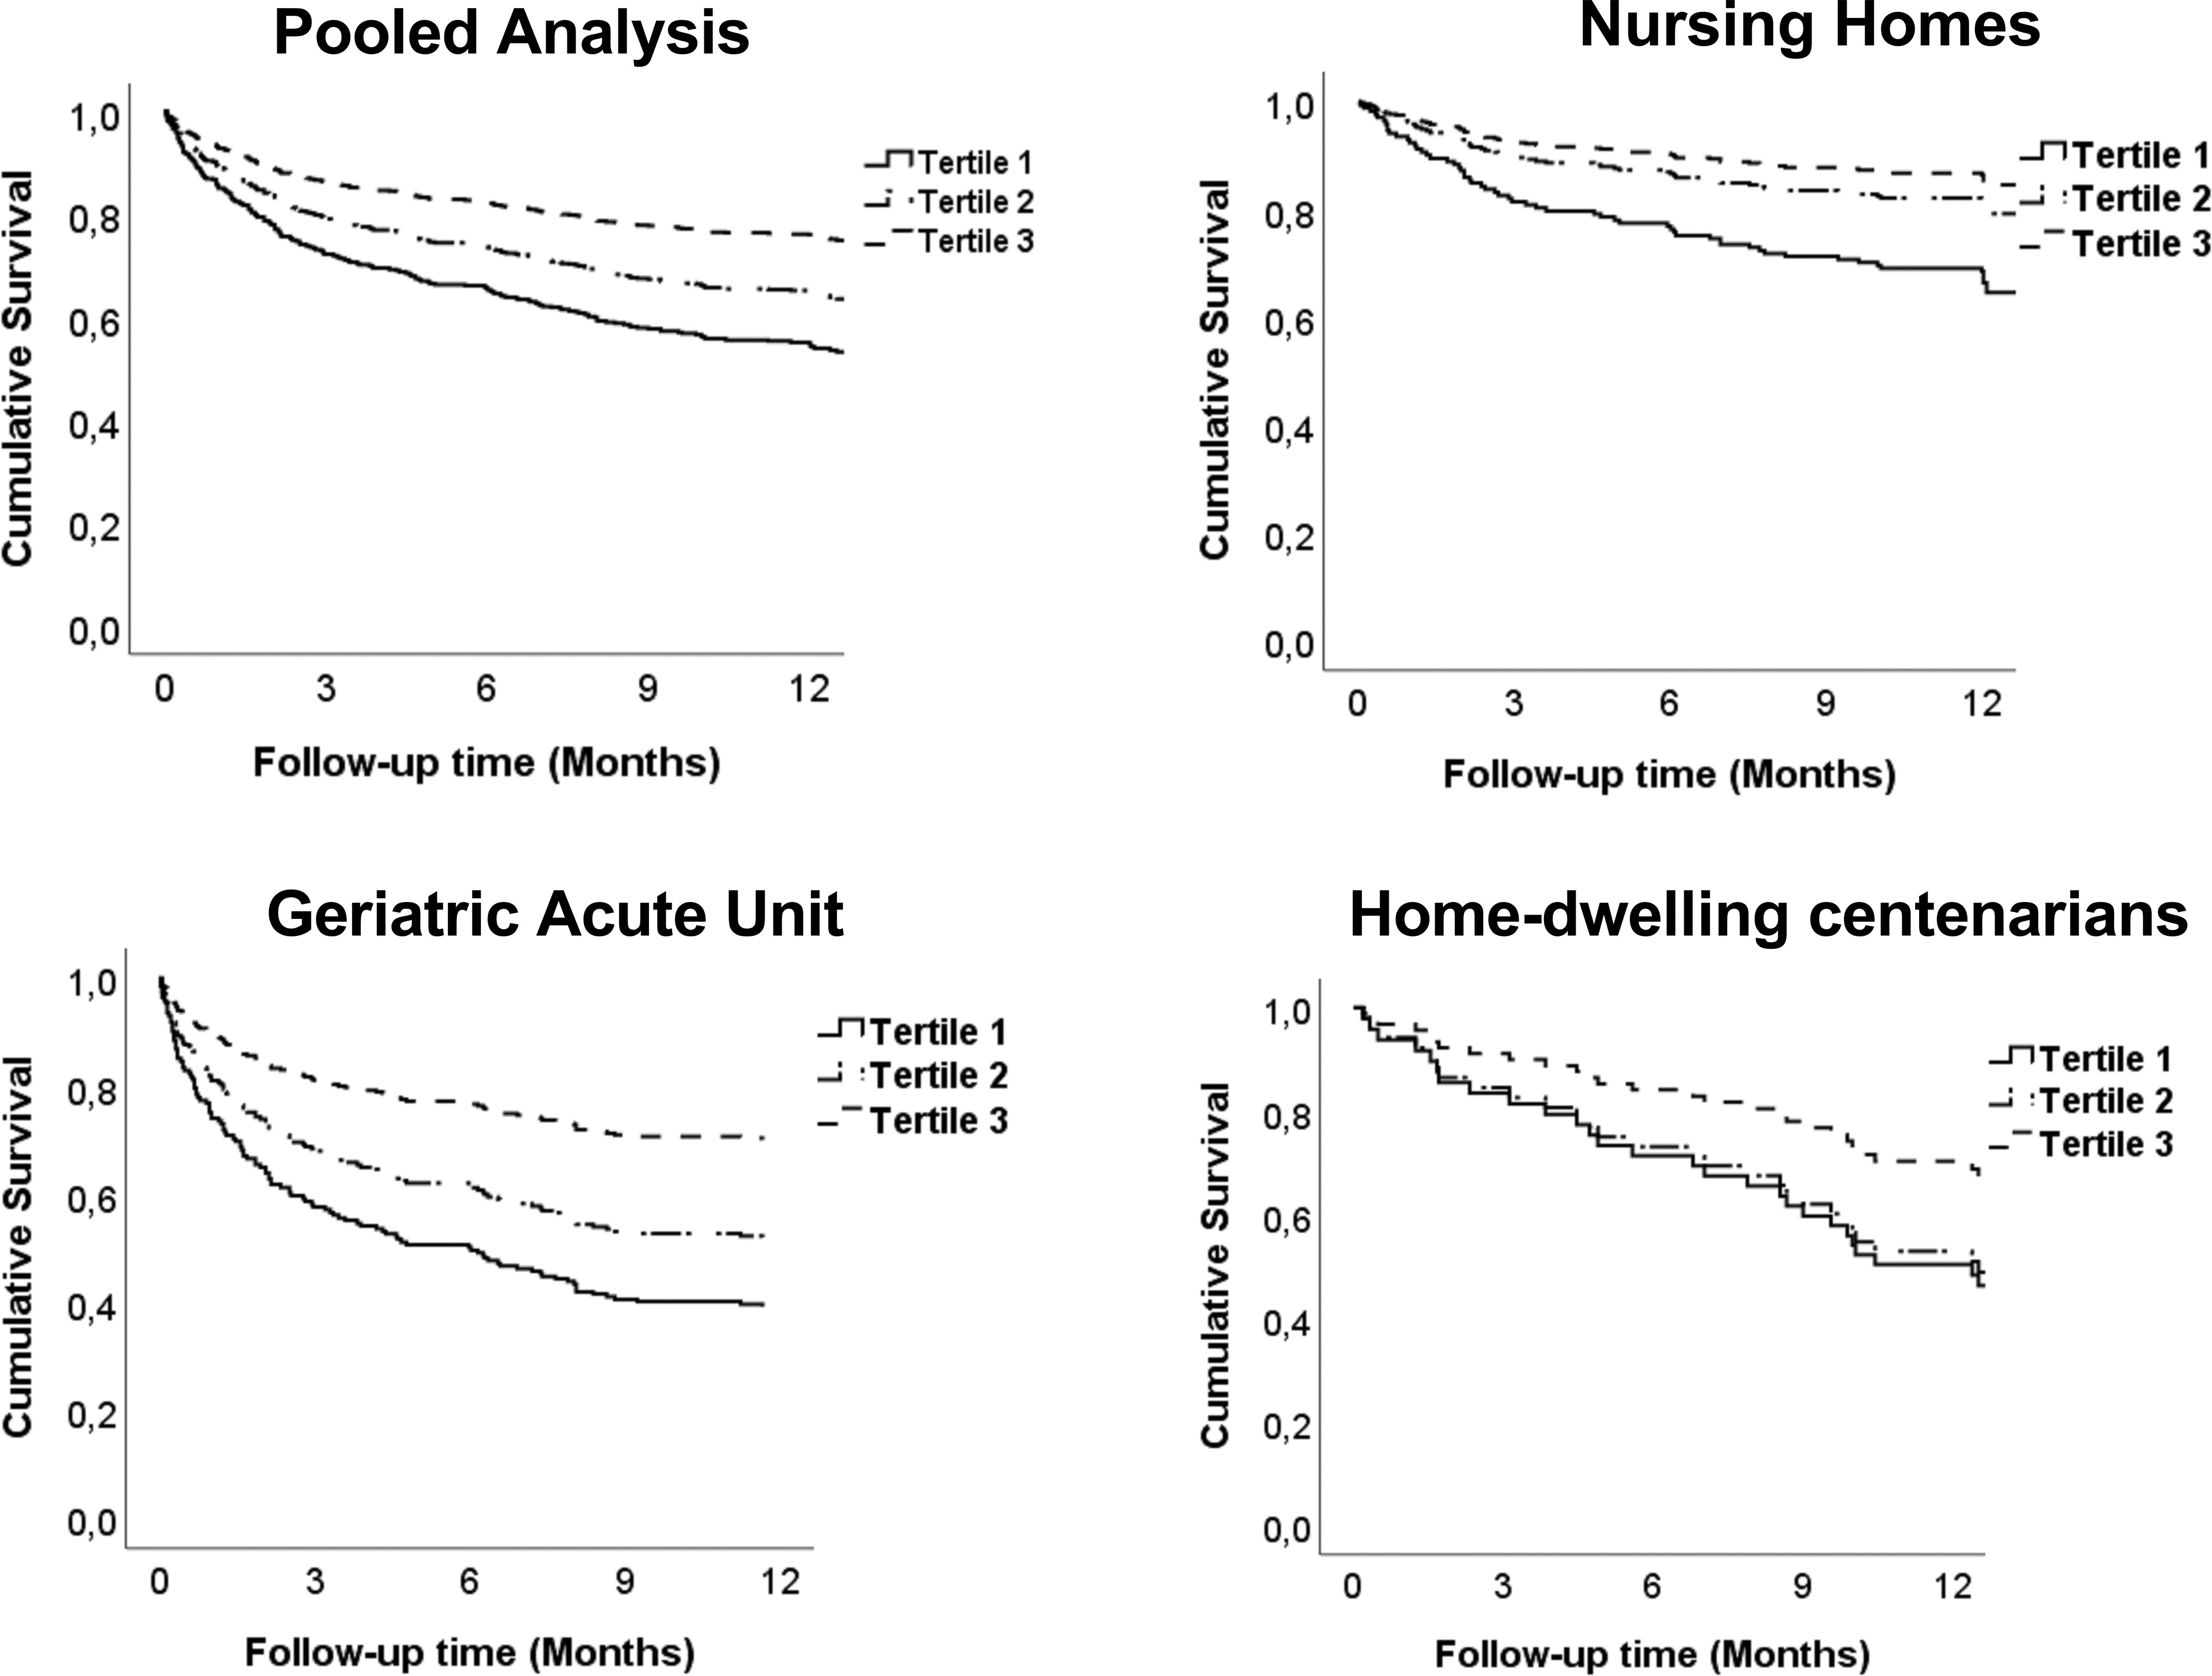
One-year survival analysis in the whole cohort and in each subcohort: Kaplan–Meier curves.
Secondary analysis
To evaluate the robustness of our hypothesis, we further evaluated the correlation between fT3, fT4, and FI in the pooled population and in subgroups. As shown in Supplementary Table S3, we observed an inverse relationship between fT3 and frailty in GAU and CENT cohorts but not in NH cohort. Only fT4 was correlated with frailty degree in the NH residents.
Discussion
The thyroid plays a crucial role in the homeostasis of the organism at multiple levels as well as in the aging process and in several age-related diseases. 18,19 The current multicenter multisetting investigation on older euthyroid individuals, including centenarians, demonstrates a significant association between the value of fT3/fT4 ratio and the degree of frailty as well as one-year overall mortality rate, after adjustment for potential confounders. Moreover, despite the differences in terms of mean age, women prevalence, functional status, cognitive performance, and burden of comorbidity a significant correlation between fT3/fT4 ratio value, degree of frailty, and overall survival was confirmed in each subcohort of study participants. Hence, fT3/fT4 ratio may be an easily measured biochemical marker of frailty and long-term survival in older individuals.
Peripheral T4 deiodination is performed by three isoforms of the deiodinase enzyme (D1, D2, and D3), leading to the activation of T4 into T3 or inactivation into reverse-T3. While the specific contribution of the different deiodinase isoforms is still debated, it is widely recognized that the expression of D1 correlates with liver function, 20 whereas D2 is mostly expressed in muscle cells. 21
Increased inflammation impairs the conversion of T4 in T3, decreasing T3 bioavailability, turning the thyroid hormone-dependent signaling pathway from a classical, nuclear pathway to an alternative, nongenomic pathway. 22 Interestingly, the nongenomic thyroid hormone-dependent signaling pathway seems to be related to stress-induced MAPKs, leading to the activation of the NLRP3 inflammasome, and further augmenting the so-called “inflammaging” phenomenon in oldest patients. 23,24
In addition, various factors often present in the frailty syndrome, such as starvation, chronic inflammation, impaired liver function as well as sarcopenia, may play a role in the impairment of peripheral T4 deiodination. However, in Italy, the 2015 report on iodine nutritional status reported no regional differences in the populations involved in this study (urinary iodine excretion ranging between 100 and 160 mcg/L). 25 Low fT3 levels are associated with poor outcome in the so-called low T3 syndrome or non-thyroidal illness syndrome (NTIS), typically affecting older patients with chronic and/or acute diseases. 26 –28
However, the dichotomization between NTIS and non-NTIS individuals may not be able to fully describe the complex biomolecular mechanisms that underlines a progressive impairment of peripheral thyroxin deiodination. Previous studies suggested the association between high/normal fT4 values and poor outcomes (frailty and mortality) in the elderly as a possible consequence of reduction in the conversion of fT4 to fT3. 29 –31 This study confirms that TSH levels is not a good predictor of frailty in euthyroid older individuals. It is noteworthy that in our cohort only euthyroid very old subjects (mean age of 86 years) were included with a high proportion of frail and prefrail individuals (82%), thus reinforcing the significance of our results.
Interestingly, a combination of the fT3/fT4 ratio and serum albumin improved the prognostic performance of the original Charlson Comorbidity Index in short-term mortality. 32 Given that serum albumin reflects both liver function and nutrition state, a model implementation of fT3/fT4 with albumin could effectively increase the predictive performance of the biomarkers; thus, other multicenter studies on the oldest old patients with such implementation are warranted.
The current investigation confirms and extends the prognostic significance of thyroid hormone values and specifically of fT3/fT4 ratio in older individuals in various settings, regardless of the burden of comorbidity and the presence of acute diseases. 7,29 Moreover, in acutely ill patients, blood was always drawn the day after hospitalization at 8:00 am, after an overnight fast, to minimize time-related modifications of thyroid hormone profile in different phases of acute distress.
We observed that the odds of dying within 1 year from study enrolment decreased by a factor of 0.4 for every 1 U increase of the fT3/fT4 ratio value, suggesting a clinically important relationship. This is a crucial finding of our investigation, showing that the progressive impairment of peripheral thyroxine deiodination correlates with an increasingly poorer clinical outcome. Of course, the finding of an association between fT3/fT4 ratio and frailty in an observational study is not sufficient to ascertain causality. Nonetheless, the possibility that fT3/fT4 ratio and frailty are not causally related but share common pathogenetic pathways should not be overlooked.
In this setting, the possibility that in older men, high-normal fT4 in the absence of overt or subclinical thyrotoxicosis contributes to frailty, with muscle weakness and catabolic effects has been previously hypothesized. 30 However, it is reasonable that frailty affects thyroid hormone metabolism rather than the inverse, although the pathophysiological process by which this might occur is not completely understood. Previous studies reported that fT3/fT4 ratio reduction was a continuous marker of progressive alteration of peripheral T4 deiodination, related to the degree of specific tissue impairment. 25 –27
Specifically, the progressive reduction of fT3/fT4 ratio value emerged as an independent predictor of mortality in older patients with acute myocardial injury 33 and advanced metastatic colorectal cancer 34 as well as a predictor of therapeutic response in patients with inflammatory bowel disease. 35 Moreover, in a previous report by Ostan et al, 36 fT3/fT4 ratio value was associated with patients' physical capability. Accordingly, the current data demonstrate an inverse correlation between fT3/fT4 ratio value and the degree of frailty of older people, even after adjustment for potential confounders, including the burden of comorbidity and the presence or not of acute diseases.
Postponing or reducing frailty might be fruitful to reduce health care costs, and its timely recognition has been related to better outcomes and reduced mortality. In our opinion, our results are of particular interest for the clinicians, since the evaluation of frailty typically requires an accurate MGA, which is time consuming and entails geriatric expertise. Conversely, the value of fT3/fT4 ratio represents an easy-to-obtain, valuable biochemical marker of frailty degree in several health care settings, regardless of the availability of geriatricians.
In this setting, Kameda et al 37 recently demonstrated the association of 15 biomarkers with frailty through a comprehensive metabolomic; however, the sample size was relatively small without matching factors as confounders. Moreover, a major weakness of that study is the poor feasibility of metabolomic analysis, which requires advanced laboratory facilities and specific knowledge, whereas the measurement of circulating free thyroid hormone levels is widely assessed in basic clinical laboratories.
Our study is subject to several limitations. First, we did not specifically assess the relationship between sarcopenia and the fT3/fT4 ratio. Second, we observed correlation coefficients lower than 0.5, a well-recognized cutoff. 38 The clinical importance of the observed correlations may be questioned for this reason; however, these results were superimposable 36 with previous studies, underlying the reliability of the present findings. The study was conducted in Italy and it is not known if the findings are directly generalizable to other older populations.
In conclusion, this is the largest study so far reporting the relationship between peripheral T4 deiodination impairment, frailty degree, and overall mortality. This combination of findings suggests that the fT3/fT4 ratio may be useful as a biochemical marker for prediction of frailty in older individuals. The prognostic value of fT3/fT4 ratio in predicting frailty and mortality of older individuals should be confirmed in studies from other countries.
Footnotes
Authors' Contributions
Conceptualization (supporting), formal analysis (lead), methodology (equal), writing—original draft (lead), and visualization (lead) by C.O. Conceptualization (equal), data curation (equal), supervision (equal), and writing—review and editing (equal) by B.A. Conceptualization (equal), data curation (equal), methodology (equal), and writing—original draft (lead) by V.C. Data curation (equal), investigation (equal), and methodology (equal) by S.C. and L.P. Data curation (equal) and formal analysis (equal) by R.F. Data curation (equal) and methodology (equal) by S.R. Conceptualization (equal), supervision (equal), and writing—review and editing (lead) by M.C. Methodology (supporting), supervision (equal), and validation (supporting) by D.M. Conceptualization (lead), data curation (lead), supervision (lead), writing—review and editing (equal), and project administration (lead) by G.V. Data curation (lead), project administration (lead), supervision (lead), and writing—review and editing (equal) by A.M. Conceptualization (lead), data curation (lead), supervision (lead), writing—original draft (lead), and methodology (equal) by F.M.
Author Disclosure Statement
No competing financial interests exist.
Funding Information
This study was supported by the Italian Ministry of Health: RCR-2021-23671216 (Ricerca Corrente Reti 2021).
Supplementary Material
Supplementary Figure S1
Supplementary Table S1
Supplementary Table S2
Supplementary Table S3