
Abstract
Background:
Abnormal platelet counts are frequently observed in patients with thyroid dysfunction; however, the direct impact of thyroid hormones on thrombopoiesis remains largely undefined.
Methods:
This study elucidates the dose–response effect of the thyroid hormone triiodothyronine (T3) on megakaryocyte (MK) development and thrombopoiesis using both a murine model of hyperthyroidism/hypothyroidism and in vitro cultures of human cord blood CD34+ cell-derived MKs. After the application of inhibitors to MKs, the examination of total and phosphorylated protein levels of the phosphoinositide 3-kinase (PI3K)/AKT pathway was utilized to assess the specific mechanisms of T3 action. The use of autophagy dual-staining lentivirus and transmission electron microscopy was employed to evaluate the impact of T3 on the autophagy flux in MKs. Mouse whole-body irradiation and bone marrow transplantation models are applied to assess the influence of T3 on the recovery of MKs/platelets in vivo.
Results:
We found that physiological or slightly elevated thyroid hormone levels are essential for sustaining MK development and thrombopoiesis, primarily through the TRα-PI3K/AKT signaling pathway. In contrast, supraphysiological thyroid hormone concentrations induce MK apoptosis via excessive autophagy, thereby reducing platelet production.
Conclusions:
Here, we present evidence that the thyroid hormone influences MK development and platelet production in a concentration-dependent manner, exhibiting a dualistic role. Our discoveries shed new light on the intricate relationship between thyroid hormones and platelet formation, offering novel perspectives on the pathophysiological consequences of thyroid disorders.
Introduction
Platelets, released from megakaryocyte (MK) lysis, play essential roles in hemostasis and inflammation. 1 –3 The interplay between the endocrine system and megakaryopoiesis can effectively assist platelet production. The main cytokine promoting platelet production is thrombopoietin (TPO), which binds to receptors to activate downstream intracellular pathways. Meanwhile, several endocrine hormones can also support platelet homeostasis through complementary pathways, 4,5 which provides a protective mechanism of the organism and may also account for the fluctuations in platelet counts often associated with endocrine disorders. Thyroid hormone imbalance is a prevalent condition, encompassing hyperthyroidism and hypothyroidism. 6 Thyroid hormone abnormalities may have a particular impact in patients with concomitant abnormalities in platelet counts or function by causing delayed development of hematopoietic cells and aberrant signal transduction. 7 –9
Thyroid hormone receptors TRα and TRβ are widely distributed, and their activation can trigger a series of signaling pathways that promote cell growth, proliferation, and energy metabolism regulation. 10 The non-genomic effects of triiodothyronine (T3) are highly regarded for their extensive influence, engaging with TRα and p85α, a regulatory subunit of phosphoinositide 3-kinase (PI3K). 11,12 This activation leads to increased cell proliferation. In contrast, thyroid hormone activation enhances lysosomal activity and induces autophagy under metabolic stress. 13,14 Therefore, excessive thyroid hormones can induce cell apoptosis or excessive autophagy, indicating their broad and dose-dependent effects. While the involvement of thyroid hormones in erythropoiesis is well-established, 15,16 their effects on MK development and thrombopoiesis are not fully known.
This study revealed that the thyroid hormone exerts a bidirectional effect on MK development and thrombopoiesis, directly related to its concentration. These findings elucidate the effects of thyroid hormone on thrombopoiesis and provide new insights into the physiopathological implications of thyroid dysfunction.
Methods
Mice and treatment
Mature (8–14 weeks) male wild-type C57BL/6J mice were used. The mice were maintained at a controlled temperature (22 ± 2°C) and a 12-h light/dark period, with ad libitum access to water and food. Animal experiments were approved by the Animal Care and Use Committee of the Army Medical University (No. AMUWEC20230409) and conducted according to the institutional guidelines.
MK induction and culture
MKs from mice and humans were both induced and cultured as previously reported. 17 Briefly, human cord blood was used to separate CD34+ cells, followed by culturing in serum-free medium (StemSpan SFEM; STEMCELL) supplemented with 20 ng/mL recombinant human TPO (PeproTech) to induce human MKs. Mouse c-kit+ cells were sorted and seeded in the same medium in the presence of 50 ng/mL recombinant mouse TPO (PeproTech), 30 ng/mL recombinant mouse stem cell factor (PeproTech), and 10 ng/mL recombinant mouse interleukin 3 (PeproTech). A one-step BSA gradient was used to enrich mature MKs, which were then cultured for future use.
Flow cytometry assay
Bone marrow cells from femora were flushed by certification at 12,000 rpm for 30 seconds and homogenized. After lysis of red blood cells, cells were washed twice with PBS and then resuspended in PBS for further use. For analysis of MK differentiation, the MKs were stained with CD41-APC and CD42b-PE antibodies. For quantification of ploidy, the MKs were stained with CD41-APC antibody and then treated with PI/RNase Staining Buffer (BD Pharmingen) for fixation and staining. For apoptosis analysis, cells were labeled with annexin V and 7-AAD. Analysis was performed using flow cytometry (ID7000; Sony Biotechnology Inc., Japan) and data were analyzed by FlowJo software (Tree Star Inc., USA).
ELISA
Mouse pericardial blood was collected and left at room temperature for 30 minutes, followed by centrifugation at 400 g for 15 minutes to take the supernatant serum. The serum total T3 (DNOV053, NovaTec Immundiagnostica GmbH, Germany), total T4 (thyroxine; EIA-1781, DRG Diagnostics, Germany), thyrotropin (KE1295, Immunoway, USA), and TPO (EMTHPO, ThermoFisher Scientific Inc., USA) were quantified following the manufacturer’s instructions.
Statistical analysis
The results were presented as means ± standard deviation, and p < 0.05 indicates statistical significance. GraphPad Prism was used for analyses, applying Student’s t-test for two-group comparisons or one-way ANOVA with Tukey’s test for multiple groups.
Result
Thyroid hormone disorders result in low platelet counts in vivo
To investigate the T3 effect on thrombopoiesis, mice were treated with T3 (10 μg/100 g body weight) or propylthiouracil (PTU)/low iodine diet (LID) for 10 days at room temperature to induce models of hyperthyroidism and hypothyroidism (Fig. 1A, B). 18 Lower platelet counts in the peripheral blood were observed in both hyperthyroidism and hypothyroidism mice compared with the control group (Fig. 1C, D). Platelet volume transiently increased 7 days after T3 and PTU/LID treatment (Supplementary Fig. S1A, B).
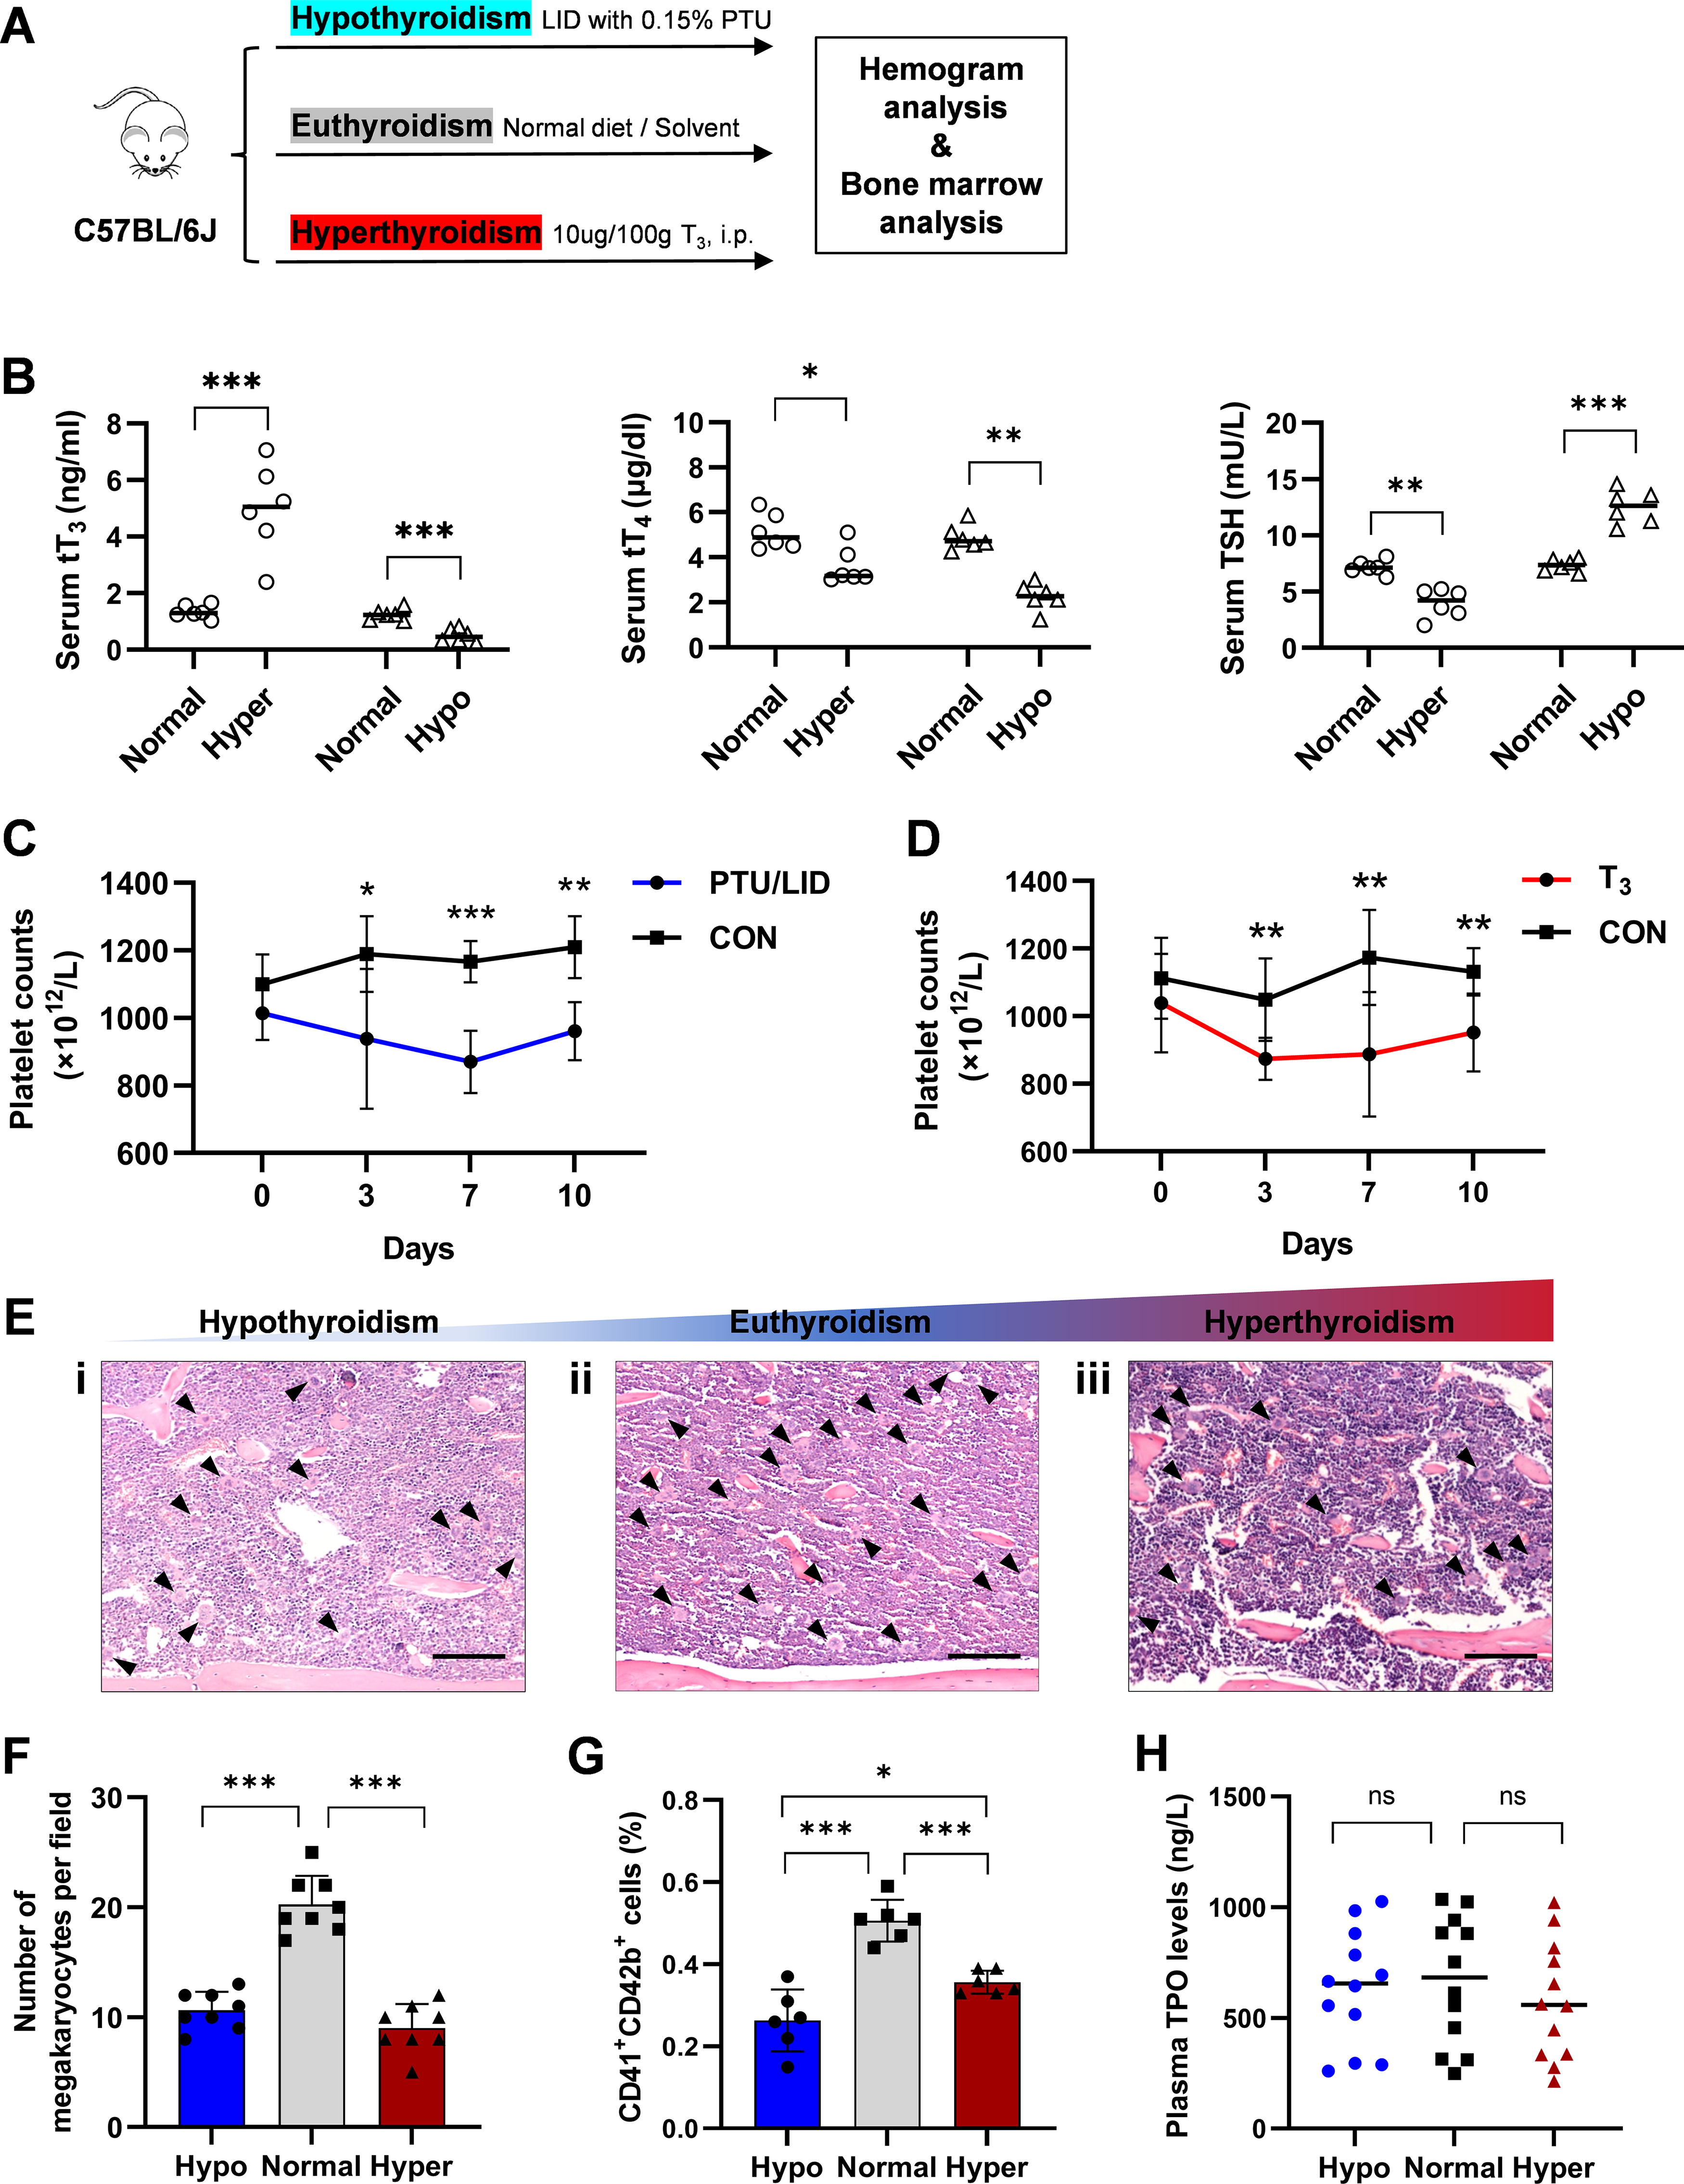
Thyroid disorders are reflected as abnormal platelet counts.
Further study of bone marrow sections from these model mice revealed a significant reduction in mature MKs (Fig. 1E, F). Flow cytometry analysis was utilized to determine the growth of bone marrow MK. The percentage and quantity of bone marrow MK progenitors (MKPs) in the hypothyroidism model mice declined slightly. However, hyperthyroidism did not affect MKP levels (Supplementary Fig. S1C, D). Without effect of plasma TPO levels, mature MK proportions and quantities in the bone marrow were lower in hyperthyroidism and hypothyroidism model mice compared with the control group (Fig. 1G, H). Polyploid MKs (with DNA content >4 N) are recognized as mature forms, exhibiting an enhanced capacity for platelet production. The hypothyroidism state decreased the proportion and quantity of >4 N polyploids (Supplementary Fig. S1E). These results suggest that thyroid hormone imbalances suppress MK in the bone marrow, reducing platelet counts in peripheral blood.
Biphasic dose-effect of thyroid hormone on thrombopoiesis
To assess the T3 effect on MKs, CD34+ cells sourced from human peripheral blood were cultured across a range of T3 concentrations (0–1000 nM). The expression of megakaryocytic lineage markers CD41, CD42b, and CD61 was quantified using flow cytometry. T3 at low concentrations (≤1 nM) enhanced MK proliferation, whereas higher concentrations (10–100 nM) suppressed MK generation (Fig. 2A). The proportions of MKs expressing CD41, CD42b, and CD61 were measured on day 12 for groups treated with 0.1 and 10 nM T3. The CD42b+ and CD61+ MK percentages were significantly higher in the 0.1 nM T3 group compared with the control group, but were reduced in the 10 nM T3 group (Figs. 2B–D). Moreover, mature MKs, characterized by CD41 and CD42b co-expression, exhibited semiresponses to 0.5 and 50 nM T3 treatments (Fig. 2E). The polyploidy distribution analysis revealed that 0.5 nM T3 increased the proportion of MKs with a ploidy of >4 N, whereas 50 nM T3 reduced the proportion of >4 N MKs (Fig. 2F). Note that 0.5 nM T3 significantly increased the production of cultured platelets compared with both the control group and the 50 nM T3 group (Fig. 2G). There were no variations in MKP percentages between the control group, the group treated with 0.5 nM T3, and the group treated with 50 nM T3 (Supplementary Fig. S2A). The data suggest that T3 has a dual influence on MK differentiation and maturation.

The effect of thyroid hormone on MK differentiation and maturation in vitro.
To evaluate the T3 toxicity, the MK cell viability was observed at different time points in all treatment groups. After 12-day incubation, the number of MK cells in the control group increased from 1 × 10⁵ to 1.98 × 10⁶. MK counts were comparable among all groups during the initial 3–7 days of culture (Supplementary Fig. S2B). By day 12, the MK count in the 0.5 nM T3 group significantly exceeded that of the control group, while the 50 nM T3 group showed similar levels to the control group (Supplementary Fig. S2B). The percentage of CD61+ Ki-67+ MKs showed no significant variation between the control, 0.5 nM T3, and 50 nM T3 groups on both day 7 and day 10 (Supplementary Fig. S2C). These findings suggest that the suppressive effect of 50 nM T3 on MKs is not due to toxicity.
Thyroid hormone promotes THRA-PI3K axis connection in MKs
To determine whether genes associated with thyroid hormones change expression at critical phases during MK development, the expression of major thyroid hormone transporters 19 (LAT1, LAT2, MCT8, MCT10, and SLCO1C1) and thyroid hormone metabolism enzymes 20 iodothyronine deiodinase type 1 (DIO1), DIO2, and DIO3 in MKs at 7 days (development phase), 21 10 days (maturation phase), and 14 days (platelet-producting phase), were analyzed (Fig. 3A, B; Supplementary Fig. S3A, B). Results indicate a notable upregulation in the expression of transporter genes, particularly during the maturation of MKs. Meanwhile, there is an elevation in the expression and activity of DIOs at maturation and terminal platelet-producting phase (Fig. 3C–E).
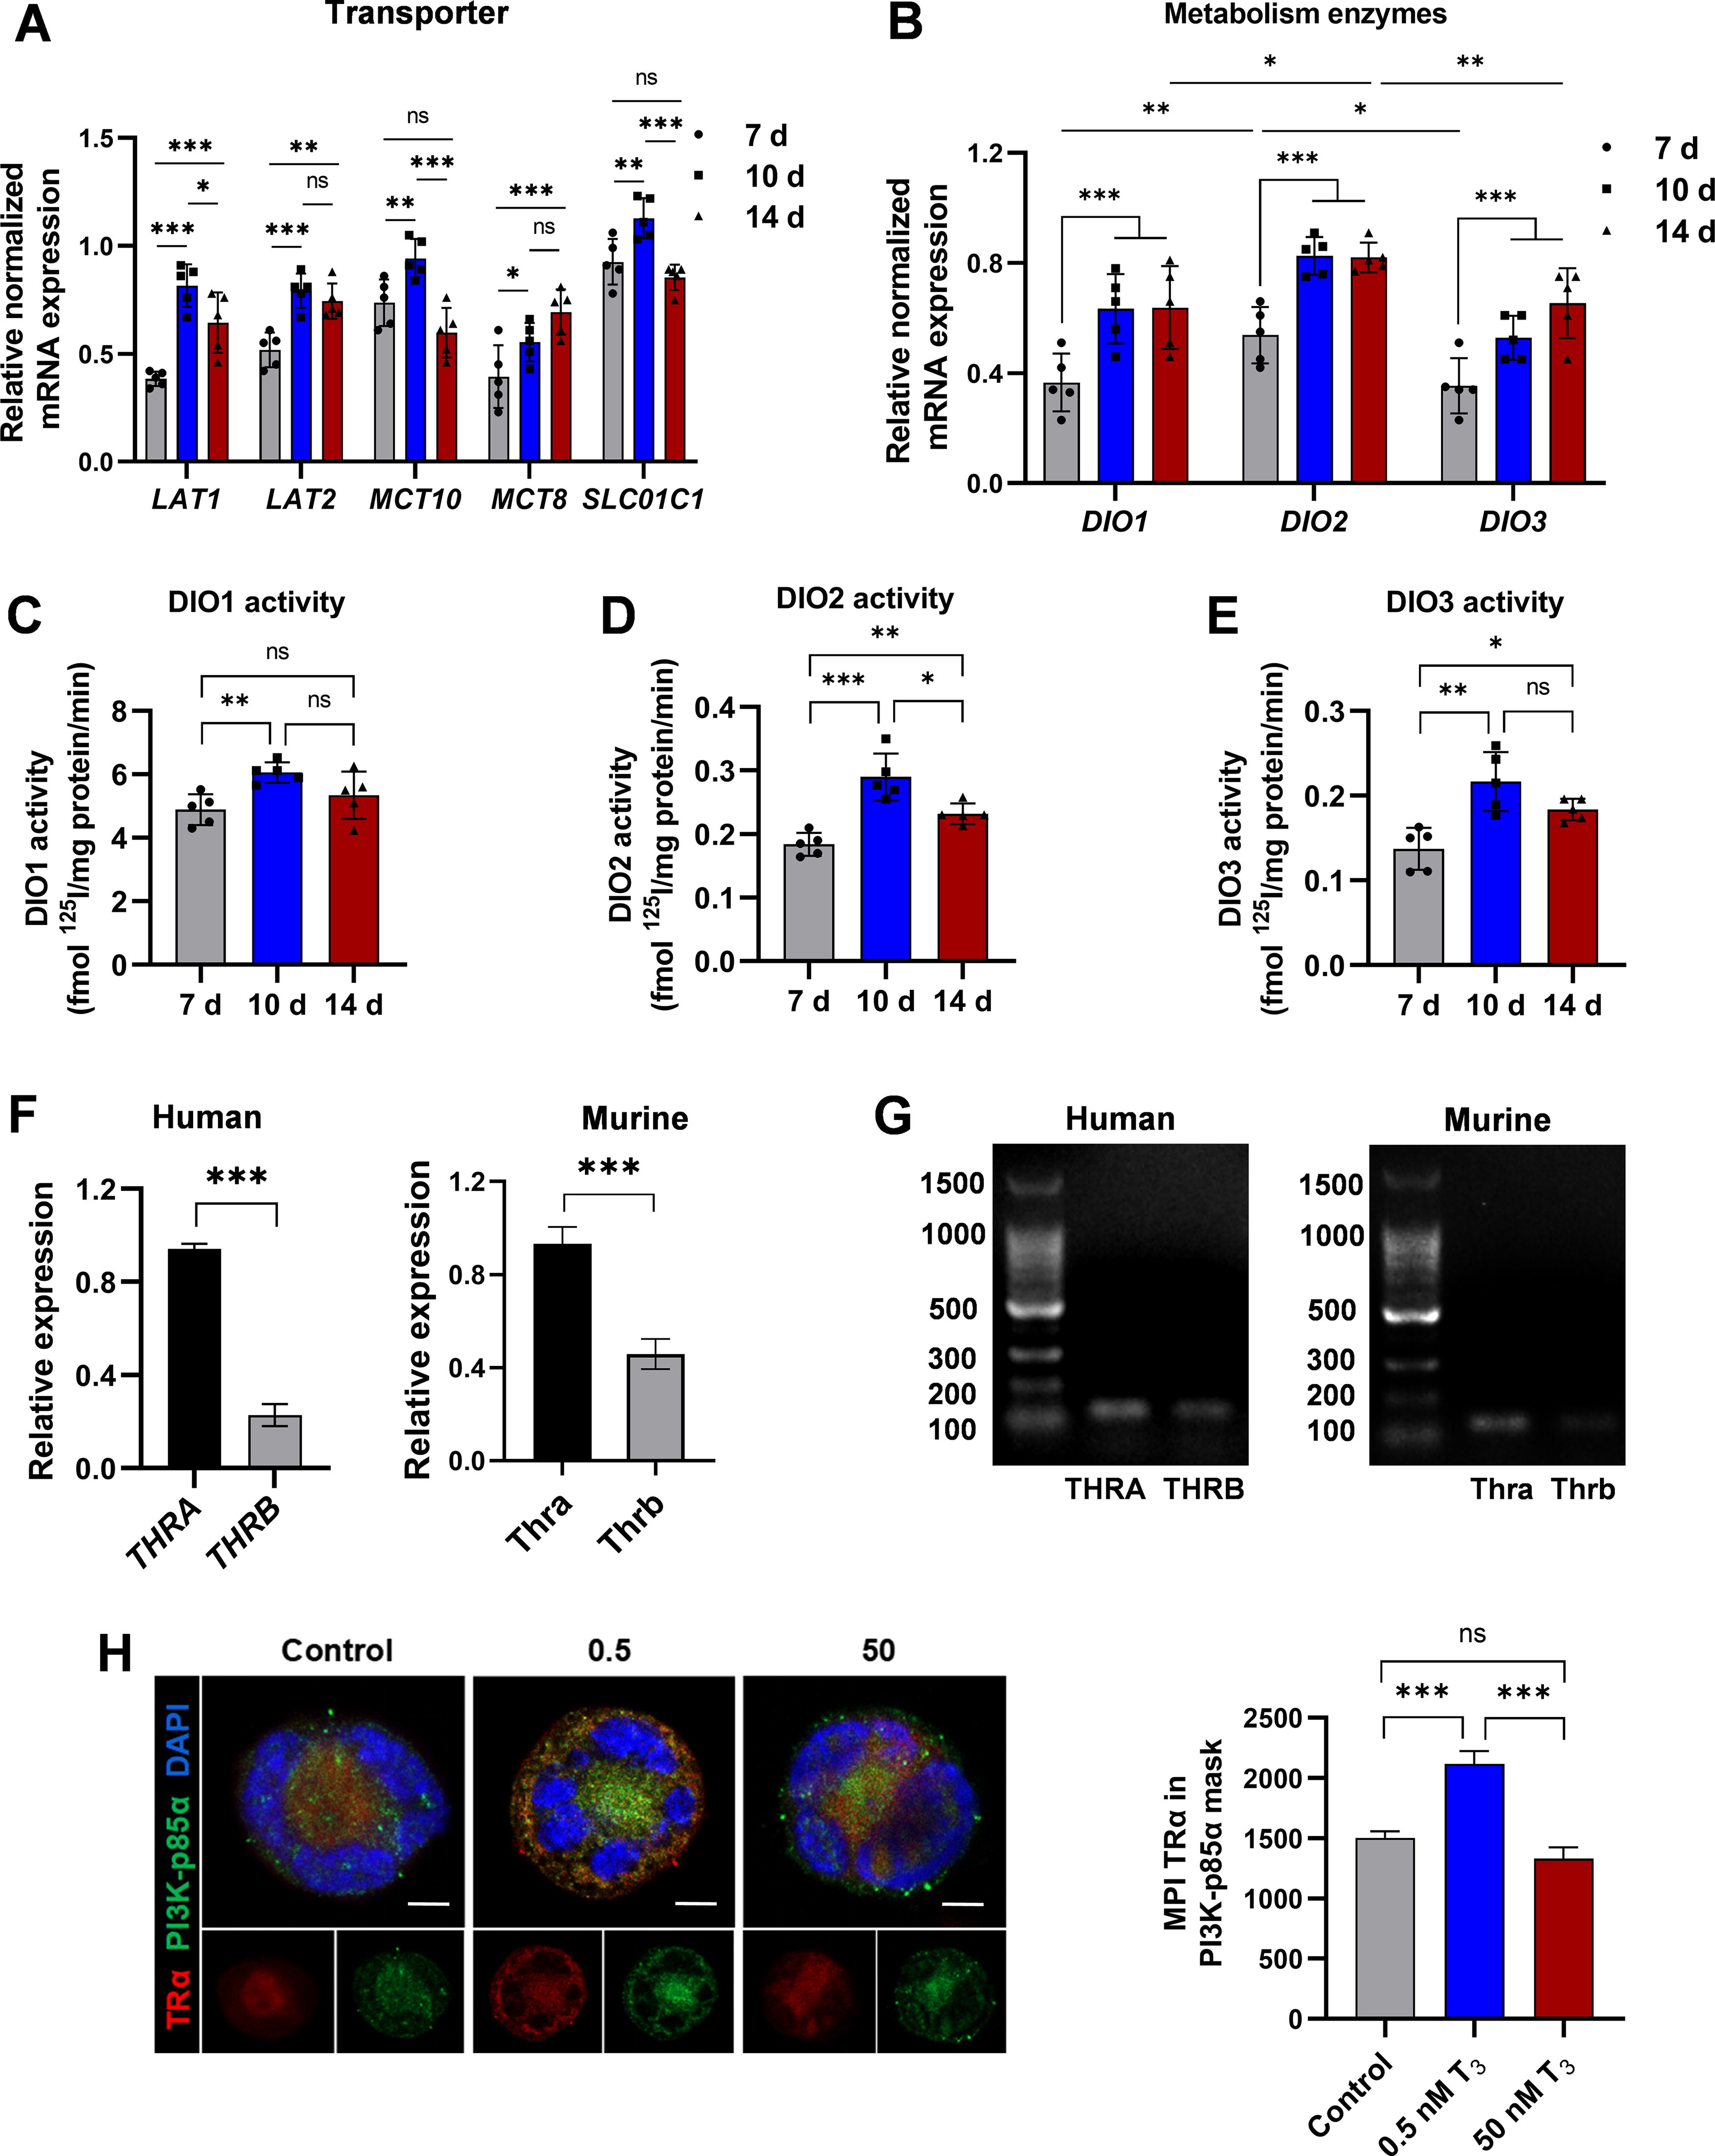
MKs have a basis for responding to thyroid hormone stimulation.
In humans, the genes THRA and THRB encode three distinct thyroid hormone-binding receptor isoforms: α1, β1, and β2. 22 PCR data show that THRA (Thra) expression is significantly higher than THRB (Thrb), consistent with predictions from the GEXC database (Fig. 3F, G; Supplementary Fig. S3C, D). These indicated the necessity and significance of T3 in MK development.
Thyroid hormone can activate the PI3K/AKT pathway, 23 crucial for MK terminal differentiation and platelet production. 24,25 TRα, when bound to T3, physically interacts with PI3K-p85α, promoting its phosphorylation and activating downstream pathways. 11 MKs were stimulated with 0.5 and 50 nM T3 for 24 hours, and the co-localization of TRα and PI3K-p85α was observed through immunofluorescence staining. Results showed that 0.5 nM T3 stimulation increased the co-localization of TRα and PI3K-p85α compared with the control and 50 nM groups (Fig. 3H). The results indicate that TRα is the primary thyroid hormone receptor in MK/platelet and that optimal T3 levels improve TRα-PI3K interactions in MKs.
A low concentration of thyroid hormone facilitates thrombopoiesis through the PI3K/AKT-CDC42-cofilin axis
We then focused on how T3 activates the PI3K/AKT signaling pathway, crucial for MK growth and development. MKs were exposed to several doses (0–1000 nM) of T3 to evaluate the activation of the PI3K/AKT pathway. Results indicated that T3 within the concentration range of 0.1–1 nM significantly increased the expression of phosphorylated PI3K (pPI3K) and phosphorylated AKT (pAKT). In contrast, concentrations above 10 nM inhibited the activation of the PI3K/AKT pathway (Fig. 4A–C, Supplementary Fig. S4A). Furthermore, MKs were treated with various combinations of TRα inhibitors, PI3K inhibitors, and AKT inhibitors. The findings revealed that the TRα inhibitor (SR35021) and the PI3K inhibitor (LY294002) blocked the expression of pPI3K and pAKT induced by 0.5 nM T3. The AKT inhibitor (MK2206) only blocked the expression of pAKT (Fig. 4D–F). This indicates that T3 promotes MK development through the TRα-PI3K/AKT pathway.
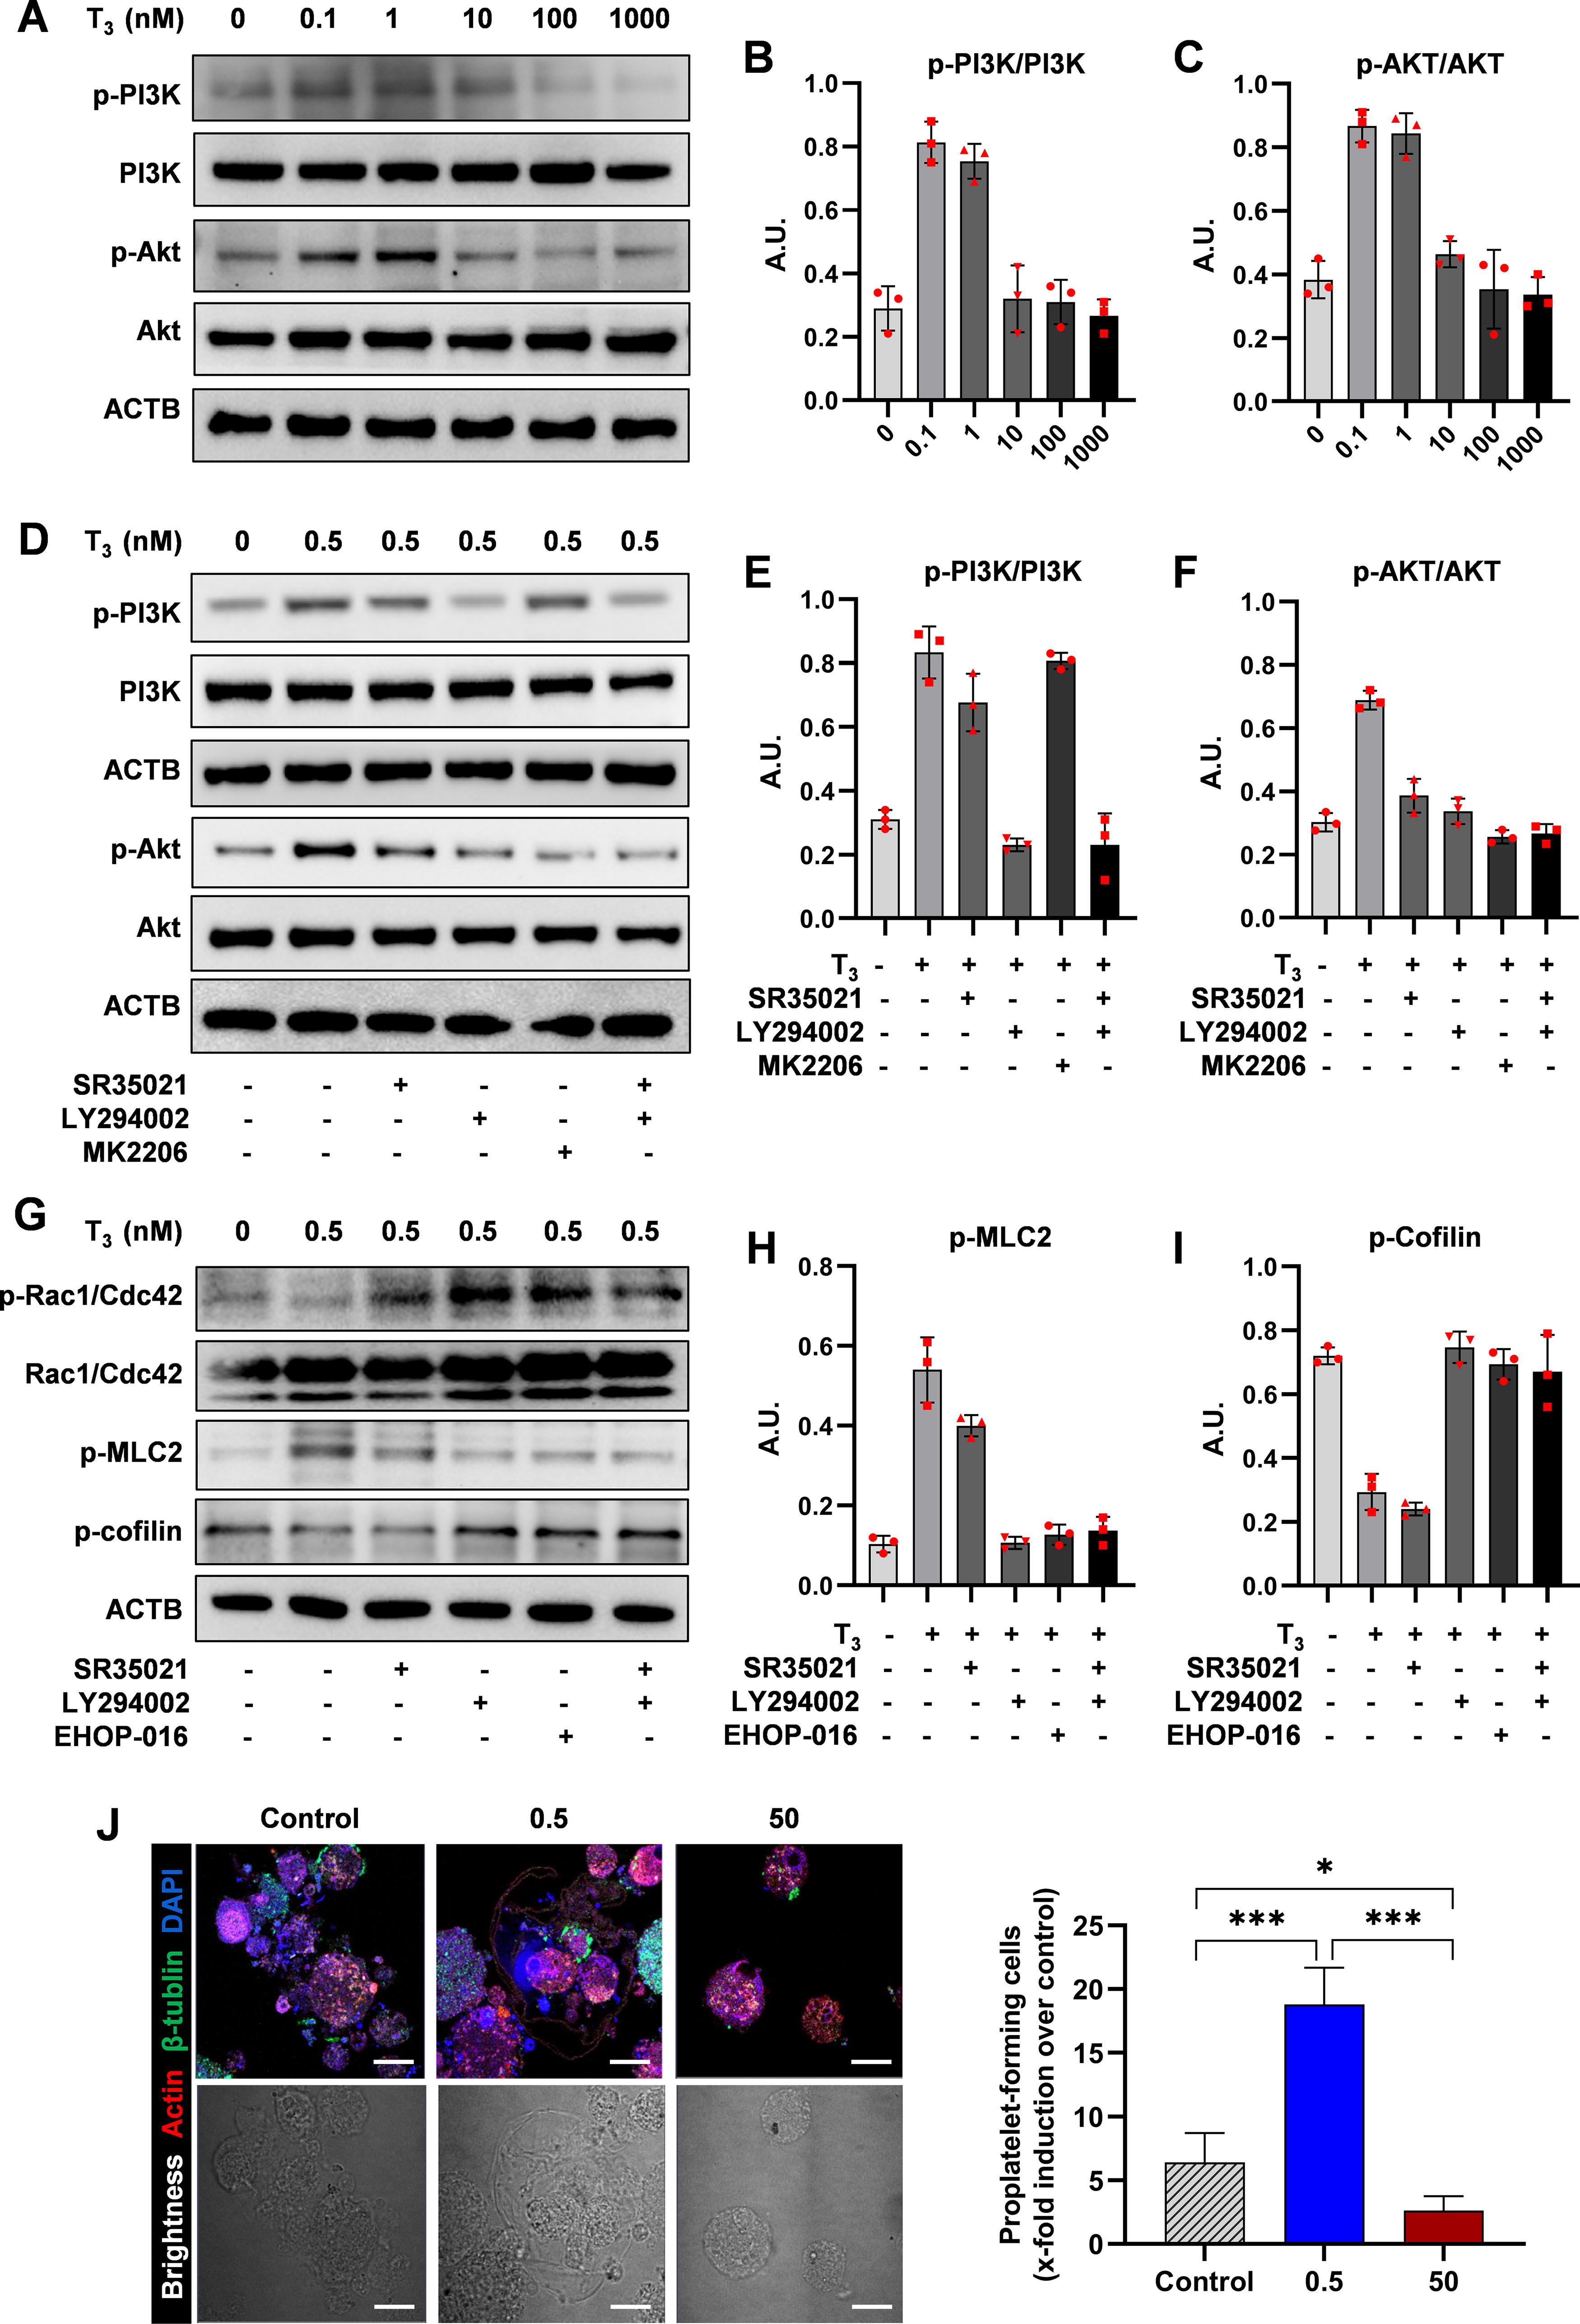
The role of PI3K/AKT in thyroid hormone promotion of thrombopoiesis.
Proplatelet formation and shedding depend on the coordinated cytoskeletal rearrangement of tubulin and actin for mechanical force. 26 The small GTPases of the Rho family, such as Cdc42 and Rac1, along with their effector proteins, control the dynamics of the cytoskeleton. 27 This signaling pathway regulates key proteins such as cofilin, an actin-depolymerizing factor, and myosin light chain 2, which modulate the actin cytoskeleton. 28,29 Western blot analysis showed that the TRα inhibitor (SR35021) and the PI3K inhibitor (LY294002) both effectively blocked the activation of the Cdc42/Rac1-cofilin signaling pathway induced by 0.5 nM T3, similar to the inhibition of Rac1 (EHOP-016) (Fig. 4G–1). Confocal pictures of MKs generating proplatelets showed that, regarding platelet precursor formation, MKs treated with 0.5 nM T3 exceeded those treated with 50 nM and the control group (Fig. 4J). These results suggest that T3 when bound to TRα, promotes MK development and platelet precursor formation through the PI3K/AKT-CDC42-cofilin signaling axis.
A high concentration of thyroid hormone induces autophagy through the AMPK-ULK1-mTOR pathway
Studies suggest that thyroid hormones can stimulate autophagy in cells, and excessive autophagy could impede cell growth and trigger cell death. 13,30 To determine the effect of T3 on autophagy in MKs, MKs from hyperthyroid mice treated with T3 at 10 μg/100 g body weight for 10 days were analyzed. Elevated levels of lipidated MAP1LC3B/LC3B (MAP1LC3B-II) and decreased SQSTM1/p62 were detected, indicating enhanced autophagic flux (Fig. 5A, B). Consistently, electron microscopy revealed an increase in autophagic vesicles in these MKs (Fig. 5C).
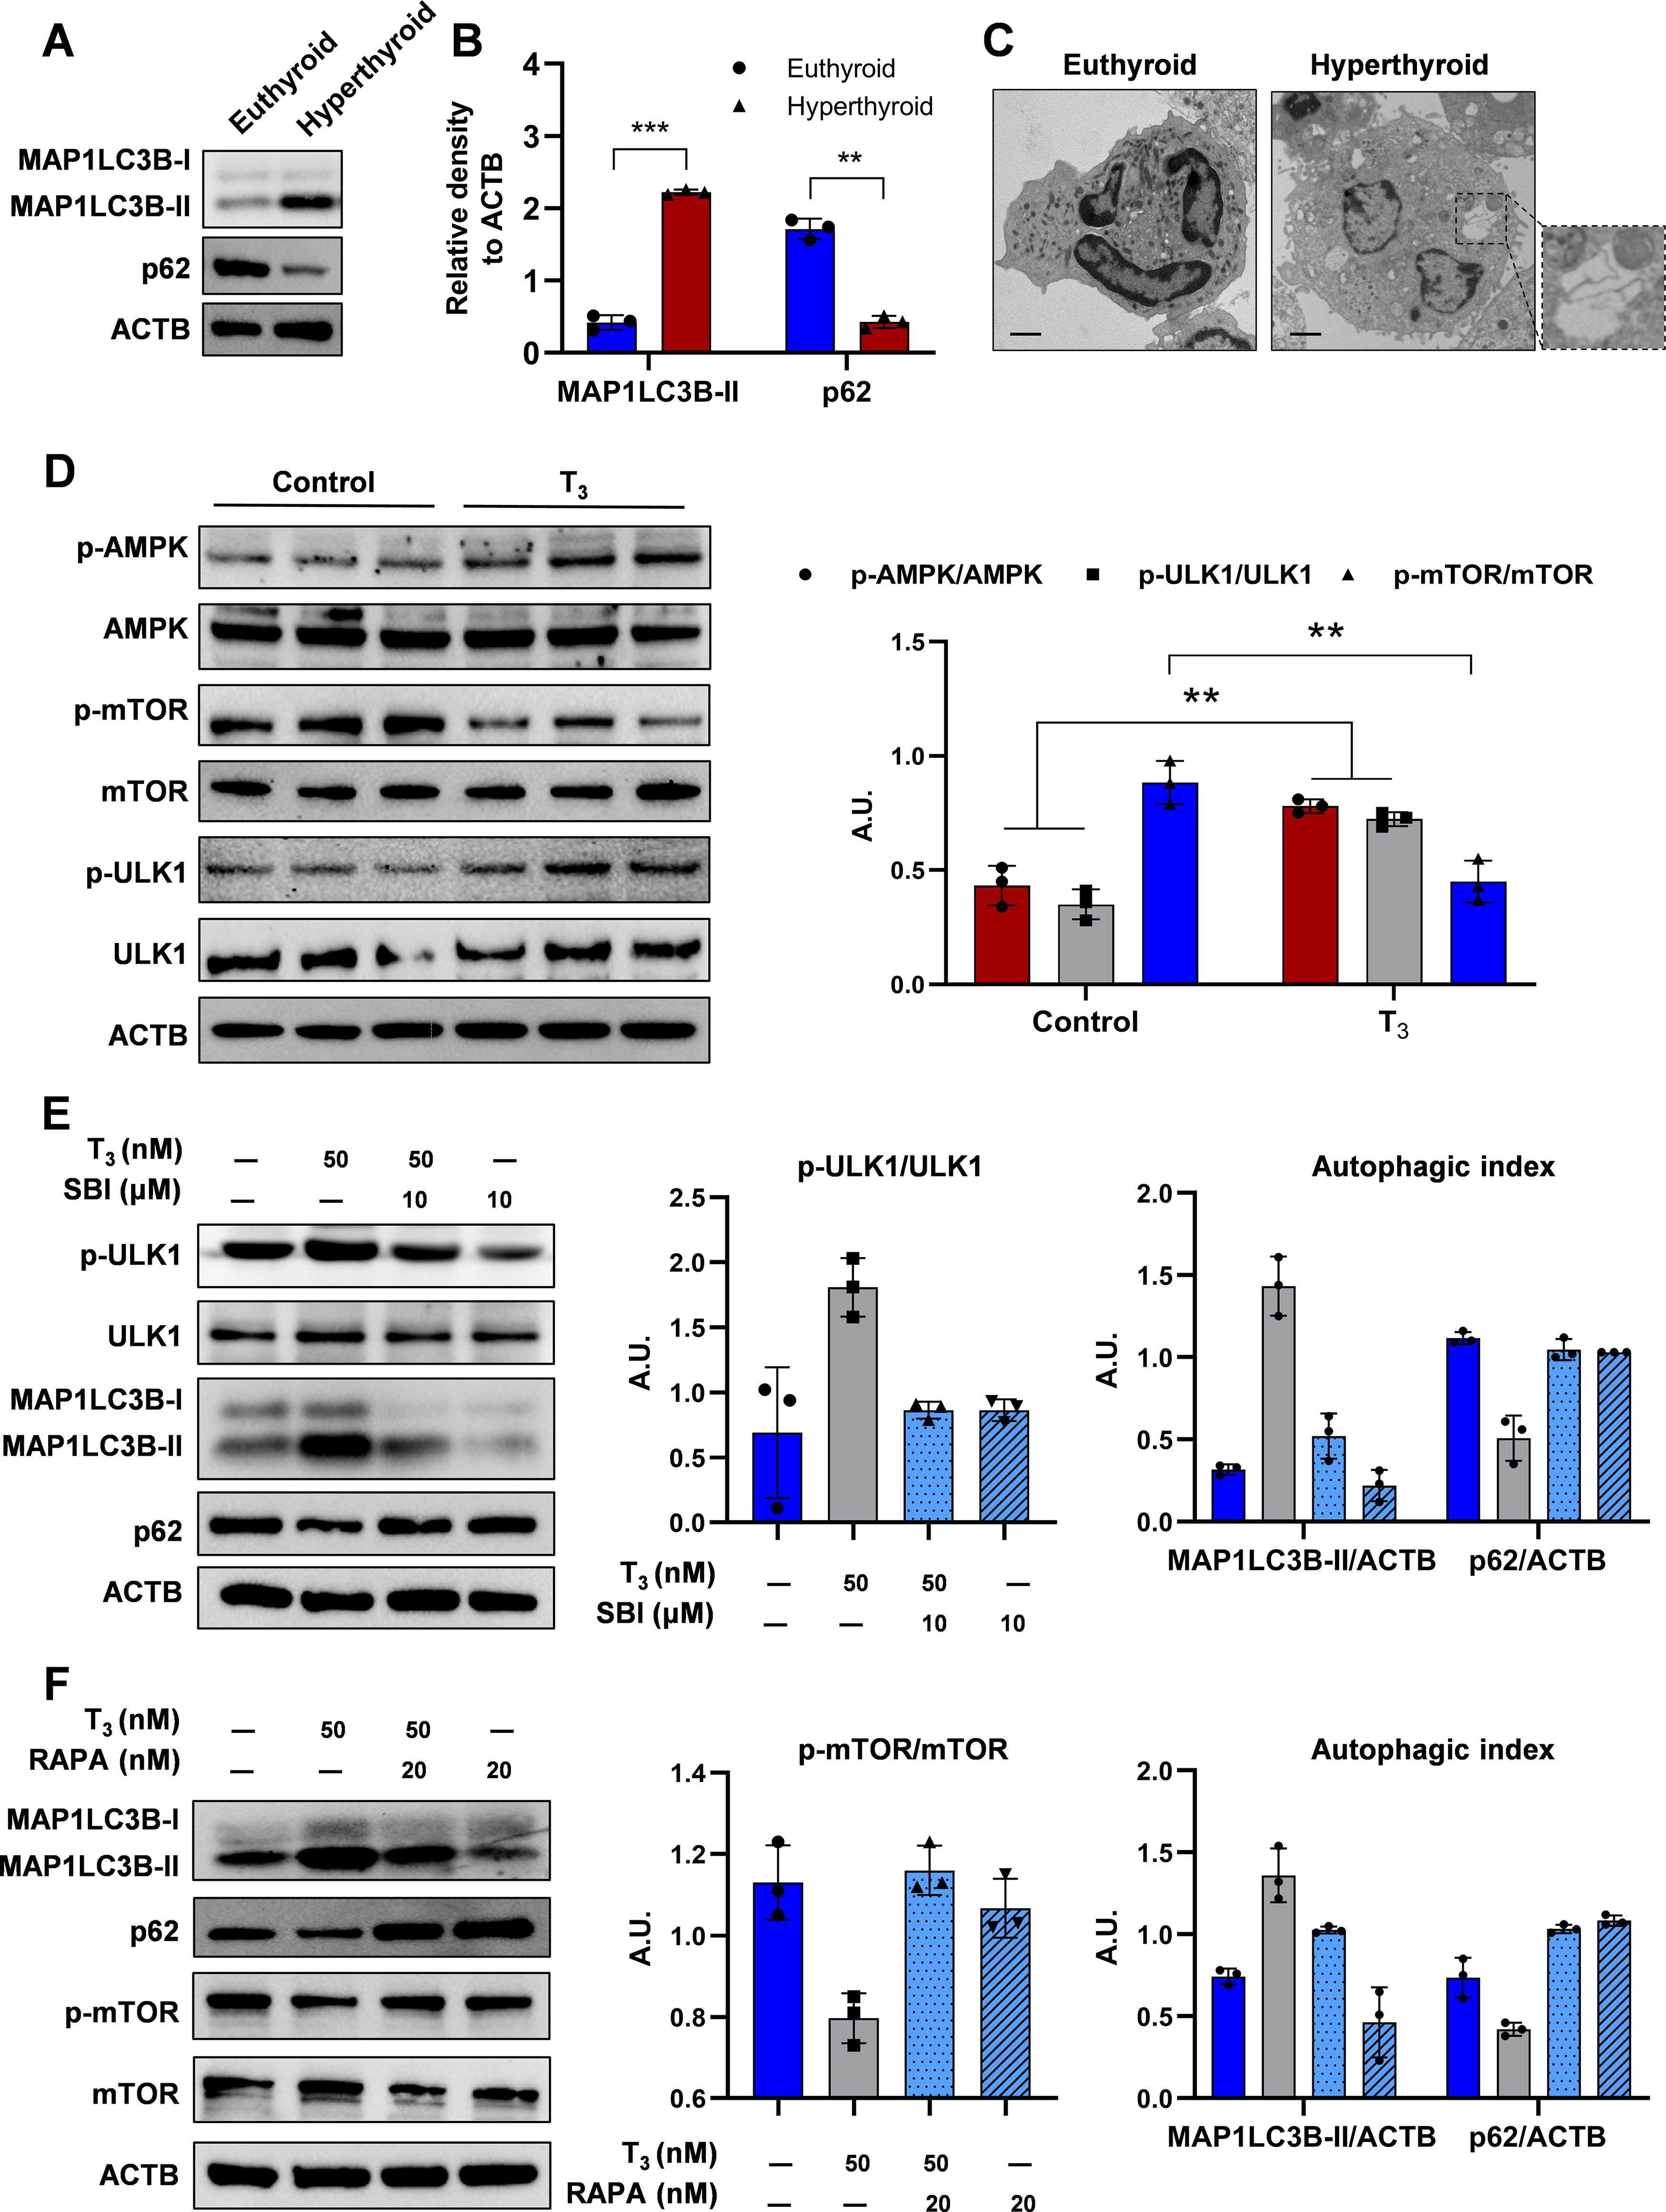
Excessive thyroid hormones cause MK autophagy.
Previous studies have established AMPK as a pivotal regulator of autophagy. 31 –33 High T3 concentrations induced AMPK and ULK1 phosphorylation while reducing mTOR phosphorylation in MKs (Fig. 5D). AMPK inhibition reversed the T3-triggered increase in pULK1 levels; however, it did not significantly alter T3-induced pmTOR expression in MKs (Supplementary Fig. S4B). Furthermore, ULK1 inhibition by SBI-0206965 (SBI) significantly controlled T3-induced autophagy (Fig. 5E). Similarly, T3 reduced the levels of pmTOR, and the mTOR inhibitor rapamycin significantly influenced T3-induced LC3B conversion and p62 degradation, suggesting that T3-induced autophagy activation is mTOR-dependent in MKs (Fig. 5F). This effect likely originates from the high concentration of T3 inhibiting the PI3K/AKT pathway. Thus, the AMPK-ULK1-mTOR pathway is essential for T3-induced autophagy and MKs death.
Excessive autophagy caused by high concentrations of thyroid hormone resulting in MK apoptosis
T3 elevated MAP1LC3B-II levels in MKs in a time-dependent manner (Fig. 6A–C). Bafilomycin A1 (Baf), an inhibitor of vacuolar H+ATPase/lysosomal acidification, caused MAP1LC3B-II accumulation in MKs. Adding Baf to T3 treatment increased MAP1LC3B-II levels more than T3 treatment alone, indicating that T3 enhances autophagosome synthesis and improves autophagic flux (Fig. 6D–F).
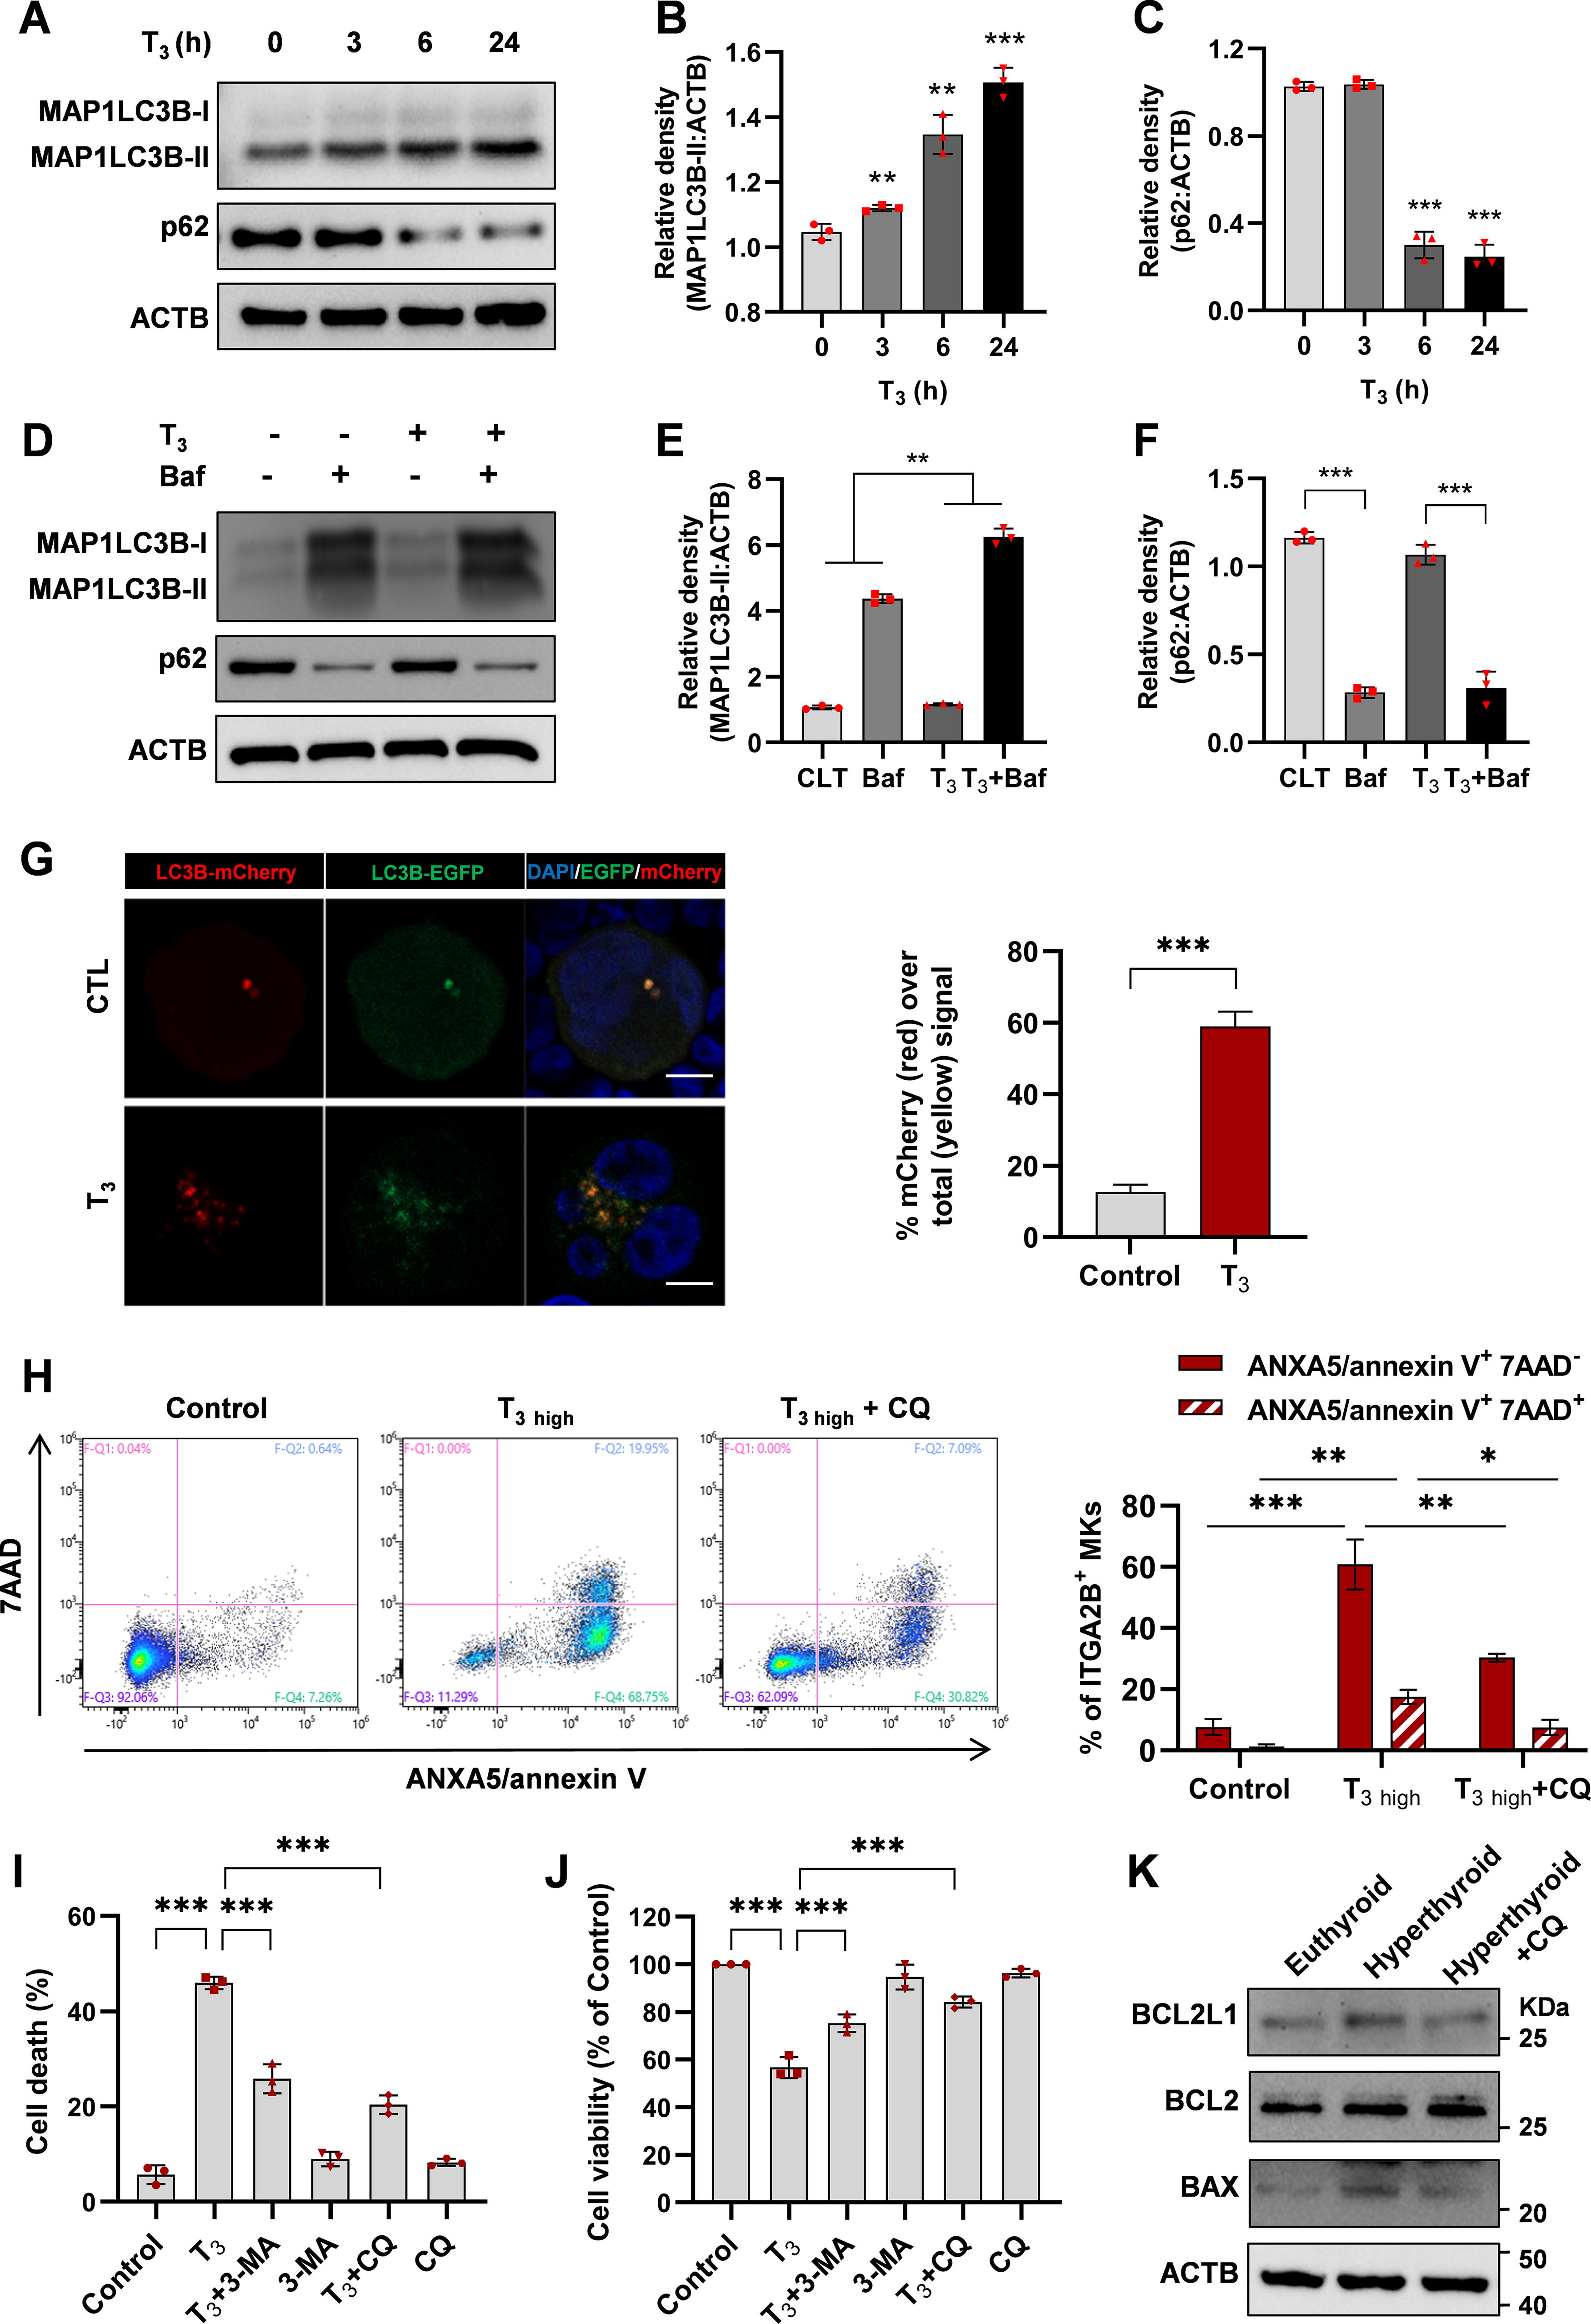
Thyroid hormone-mediated MK death in an autophagy-dependent manner.
In order to construct an autophagy-monitoring MKs, we transfected the mature MK cell line derived from humans, Meg-01 (human megakaryoblastic leukemia cells), with an adenovirus carrying tandem fluorescent MAP1LC3B (mCherry-eGFP-MAP1LC3B) plasmid. This construct encodes MAP1LC3B with both green and red fluorescent tags. The strength of the red signal corresponds to the rate at which autophagy occurs. Confocal microscopy analysis of T3-treated MKs showed an augmentation in the number of red puncta and a greater red-to-yellow signal ratio (Fig. 6G), indicating an enhanced autophagic flux.
The crosstalk between autophagy triggered by higher T3 concentrations and MK apoptosis was investigated. MKs were treated with 50 nM T3, and a control group with autophagy inhibited by chloroquine (CQ) was established. The 50 nM T3 treatment caused a significant increase in the number of early and late apoptotic MKs compared with the control group. However, inhibition of autophagy by CQ effectively alleviated T3-induced MK apoptosis (Fig. 6H). To investigate the role of autophagy in MK cell death caused by 50 nM T3, 3-methyladenine (3-MA) and CQ were employed, which block the initial and final phases of autophagy. Figure 6I demonstrates that administering 3-MA and CQ improved the survival of MK cells exposed to 50 nM T3. Moreover, 3-MA and CQ had no significant effects on MK viability (Fig. 6J). In vivo experiments also confirmed the protective effect of autophagy inhibition on MK apoptosis in hyperthyroidism (Fig. 6K). These results indicate that autophagy contributes to the cytotoxicity of high concentrations of T3 in MKs.
Influence of thyroid hormone on MK reconstitution and platelet counts in mice radiation thrombocytopenia
The decrease in platelet count and the difficulty in MK reconstitution are significant characteristics of radiation-induced bone marrow injury. 17,34 The radiation model also examines the parameters that influence the development of MK and thrombopoiesis. The mice were subjected to whole-body γ-ray irradiation at a dose of 6.5 Gy and then underwent bone marrow transplantation. The mice were administered different T3 concentrations daily from 5 to 10 days after the transplant (Fig. 7A). The low-concentration group exhibited improved restoration of white blood cells, hemoglobin, and platelet counts compared with the high-concentration and control groups (Fig. 7B–D).
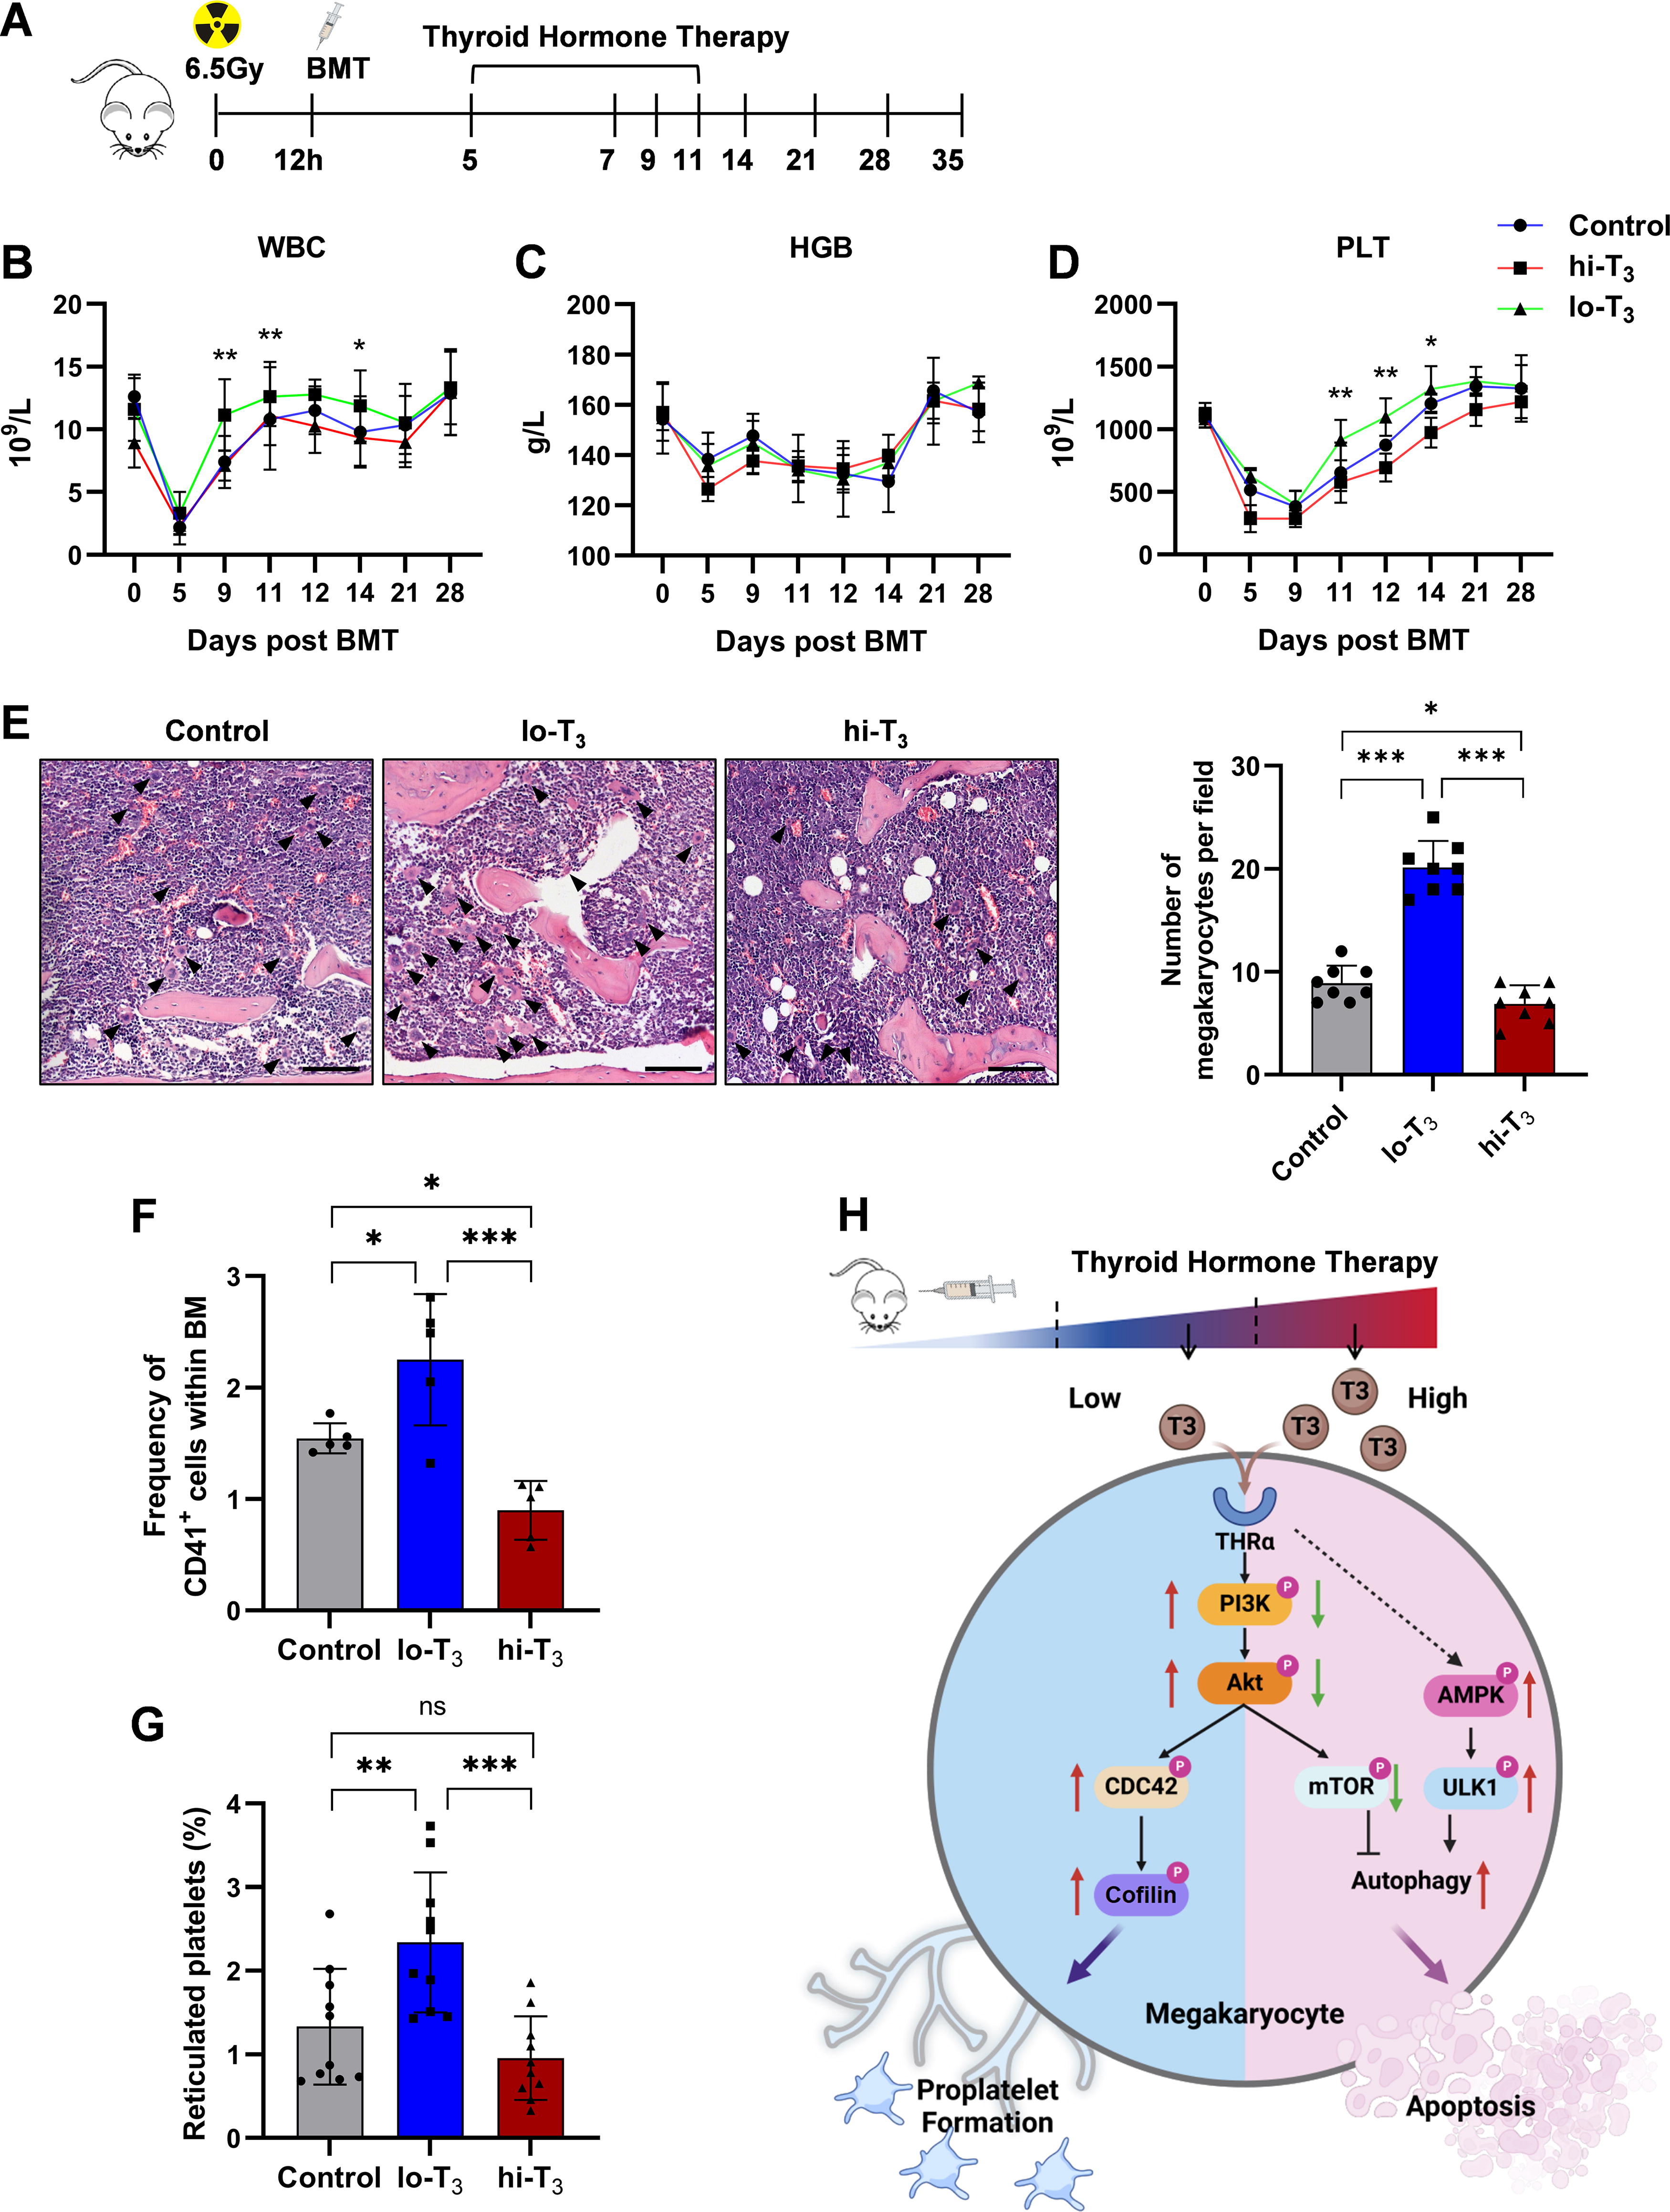
Thyroid hormone significantly influences platelet reconstitution in mice after BMT in vivo.
Further analysis focused on MKs and platelet recovery. In bone marrow sections, the number and proportion of mature MKs per unit area in the lo-T3 group were higher than in the hi-T3 and control groups (Fig. 7E). Flow cytometry results also confirmed the pro-megakaryopoiesis effect of low thyroid hormone concentrations (Fig. 7F). Furthermore, peripheral platelets in the lo-T3 group exhibited a higher thiazole orange staining rate, indicating a higher number of newly formed platelets (Fig. 7G). Low thyroid hormone concentrations have been shown to help bone marrow MKs recover and may even be utilized to treat radiation-induced thrombocytopenia.
Discussion
Investigating thyroid hormone effects on platelet production is important for understanding endocrine failures and their effects on hematological diseases and body system interactions. 35 In this study, a commonly used mouse model of hyperthyroidism and hypothyroidism was established through in vitro administration of thyroid hormone or PTU. Hemogram and bone marrow analyses revealed that abnormal thyroid hormone levels in vivo significantly reduce platelet production and counts. This indicates that the effects of thyroid hormone on MK formation and thrombopoiesis are dose-dependent, with high and low thyroid hormone levels being harmful. This finding is consistent with the aberrant platelet counts found in hypothyroidism and hyperthyroidism patients, as well as research on hematopoietic suppression in hyperthyroidism patients. 7,36
Studies have shown that TRα can interact with PI3K-p85α and promote the phosphorylation of PI3K and the activation of subsequent signaling pathways. 23 The activation of the PI3K/AKT pathway occurred following stimulation with an appropriate dose of thyroid hormone, consistent with previous reports. The PI3K/AKT pathway is involved in MK proliferation and pre-platelet formation. 25 Multiple pathway inhibitors further established the role of the TRα-PI3K/AKT-CDC42/cofilin axis in promoting thrombopoiesis (Fig. 7H). Thyroid hormones affect cellular energy regulation and promote autophagy. 14,37 The AMPK/ULK1/mTOR pathway was examined to know how thyroid hormones trigger autophagy. This pathway is consistent with the thyroid hormones’ previously documented role in regulating cellular energy. These findings showed that stimulated cells had significant upregulation of the AMPK/ULK1/mTOR pathway, with reduced mTOR phosphorylation due to high thyroid hormone suppressing the PI3K-AKT pathway (Fig. 7H). 38
The dose–response effect of thyroid hormones deserves further attention. According to our clinical data, the normal total T3 (tT3) levels are in the range of 0.52–3.40 nM, while hyperthyroid patients have an average serum tT3 of 10.31 ± 3.312 nM, with the range in hypothyroid patients being 0.37 ± 0.947 nM. Published clinical studies show that patients with thyrotoxicosis have an average serum tT3 level of 8.20 ± 3.415 nM, while the level in those with hypothyroidism is 0.42 ± 0.984 nM. 39 –42 In vitro studies on mammalian cells typically use T3 doses in the 0–100 nM range. 43 –46 Nevertheless, we acknowledge that the 50 nM T3 concentration used in some of our in vitro experiments is much higher than the physiological levels, and the inhibitory effects observed at such high concentrations may also have questionable clinical relevance, as such high T3 concentrations are rare in clinical practice.
This study highlights thyroid hormone’s important role in platelet production and hematopoietic system maintenance, providing further evidence of endocrine–hematopoietic system crosstalk. This study provides insights in understanding blood abnormalities in thyroid patients and may have potential future treatment implications.
Footnotes
Acknowledgment
Authors’ Contributions
J.W., B.X., and X.Y. designed and performed the experiments. B.X. and X.Y. performed electron microscopy on megakaryocytes. S.C. provided guidance on the CD34+ cell differentiation. J.W. and B.X. formulated the research idea and designed the study. J.W. supervised the study. B.X., X.Y., Z.W., J.C., Y.X., M.C., and M.S. analyzed the data and drafted the first version of the article, which was read and commented on by all authors. There were no AI tools used during the writing of the article.
Data Sharing Statement
Reasonable requests to view the original data will be considered on receipt of an email by Junping Wang (
Author Disclosure Statement
The authors declare no competing interests.
Funding Information
This work was supported by the National Natural Science Foundation of China (No. 82222060, 82430103, 82473572, 82073487, 81930090), Science Foundation of State Key Laboratory of Trauma and Chemical Poisoning (2024K004), and High-level Talent Program of Third Military Medical University (2022XRC02).
Supplementary Material
Supplementary Data
Supplementary Figure S1
Supplementary Figure S2
Supplementary Figure S3
Supplementary Figure S4
Supplementary Figure S5