
Abstract
Tick-borne diseases are an important cause of human morbidity in North Carolina. This study evaluated the use of routinely collected veterinary hospital and human hospital emergency department (ED) data for earlier signal detection compared with routine reporting of tick-borne diseases to the North Carolina Division of Public Health in 2006 and 2007. The Early Aberration Reporting System was used to detect the earliest indication of an increase in number of dogs infested with ticks that were brought to veterinary hospitals and in number of people presenting to EDs with a tick-related chief complaint or who had an ED International Classification of Diseases diagnosis code of tick-borne disease. Results indicate that systematic monitoring of veterinary hospital and human ED data can detect increases in tick activity 4 weeks earlier than the current surveillance method, which would facilitate timely initiation of tick prevention and increased clinical awareness among veterinarians and physicians.
Introduction
Tick activity in the environment is typically evaluated by a combination of dragging a white cloth through tick habitat, small mammal trapping with examination for ticks, and public health surveillance data from physicians and laboratories for reportable tick-borne diseases sent to local and state health departments. Field dragging and animal trapping are the most common methods used to determine species of ticks in the environment, but they are labor intensive and only reflect tick activity in relatively small geographic areas. The appropriate sequence of serologic tests to confirm clinical diagnoses of human tick-related infections is infrequently done. Therefore, many human cases of tick-borne disease may not meet the case definition criteria for surveillance. In addition, confirmed and probable cases that are reported may not provide timely information, since there can be a lengthy delay between disease onset and reporting.
The present study evaluated the use of routinely collected veterinary hospital and human hospital emergency department (ED) data to monitor tick activity in central North Carolina. The specific hypothesis tested was that a significant increase in the frequency of dogs with tick infestation presenting to veterinary hospitals or an increase in the frequency of ED visits of persons with a tick-related chief complaint or a tick-related International Classification of Diseases, 9th Revision, Clinical Modification (ICD-9-CM) diagnosis code occurs before a significant increase in the report of human tick-related illnesses to the NC DPH.
Methods
Data sources
The first data set consisted of information on tick infestation of dogs, which was obtained using the electronic medical records of Banfield The Pet Hospital (Portland, OR). Banfield has 747 veterinary hospitals located in 43 states in the United States and is the largest single provider of healthcare to companion animals. In 2006, there were 29 Banfield veterinary hospitals operating in North Carolina that recorded a total of >220,000 dog visits for both routine care and clinical problems. In 2007, there were 30 Banfield veterinary hospitals that recorded >240,000 dog visits. Banfield veterinary hospitals use proprietary software (PetWare) to create an electronic medical record for each patient visit that includes owner demographic information, pet signalment, physical examination findings, laboratory test results, diagnoses, and treatments (Glickman et al. 2006). All records were identified in which one or more ticks were discovered on a dog during a physical examination (tick infestation). There were 1542 and 1757 dog visits in which ticks were discovered in 2006 and 2007, respectively (Fig. 1).
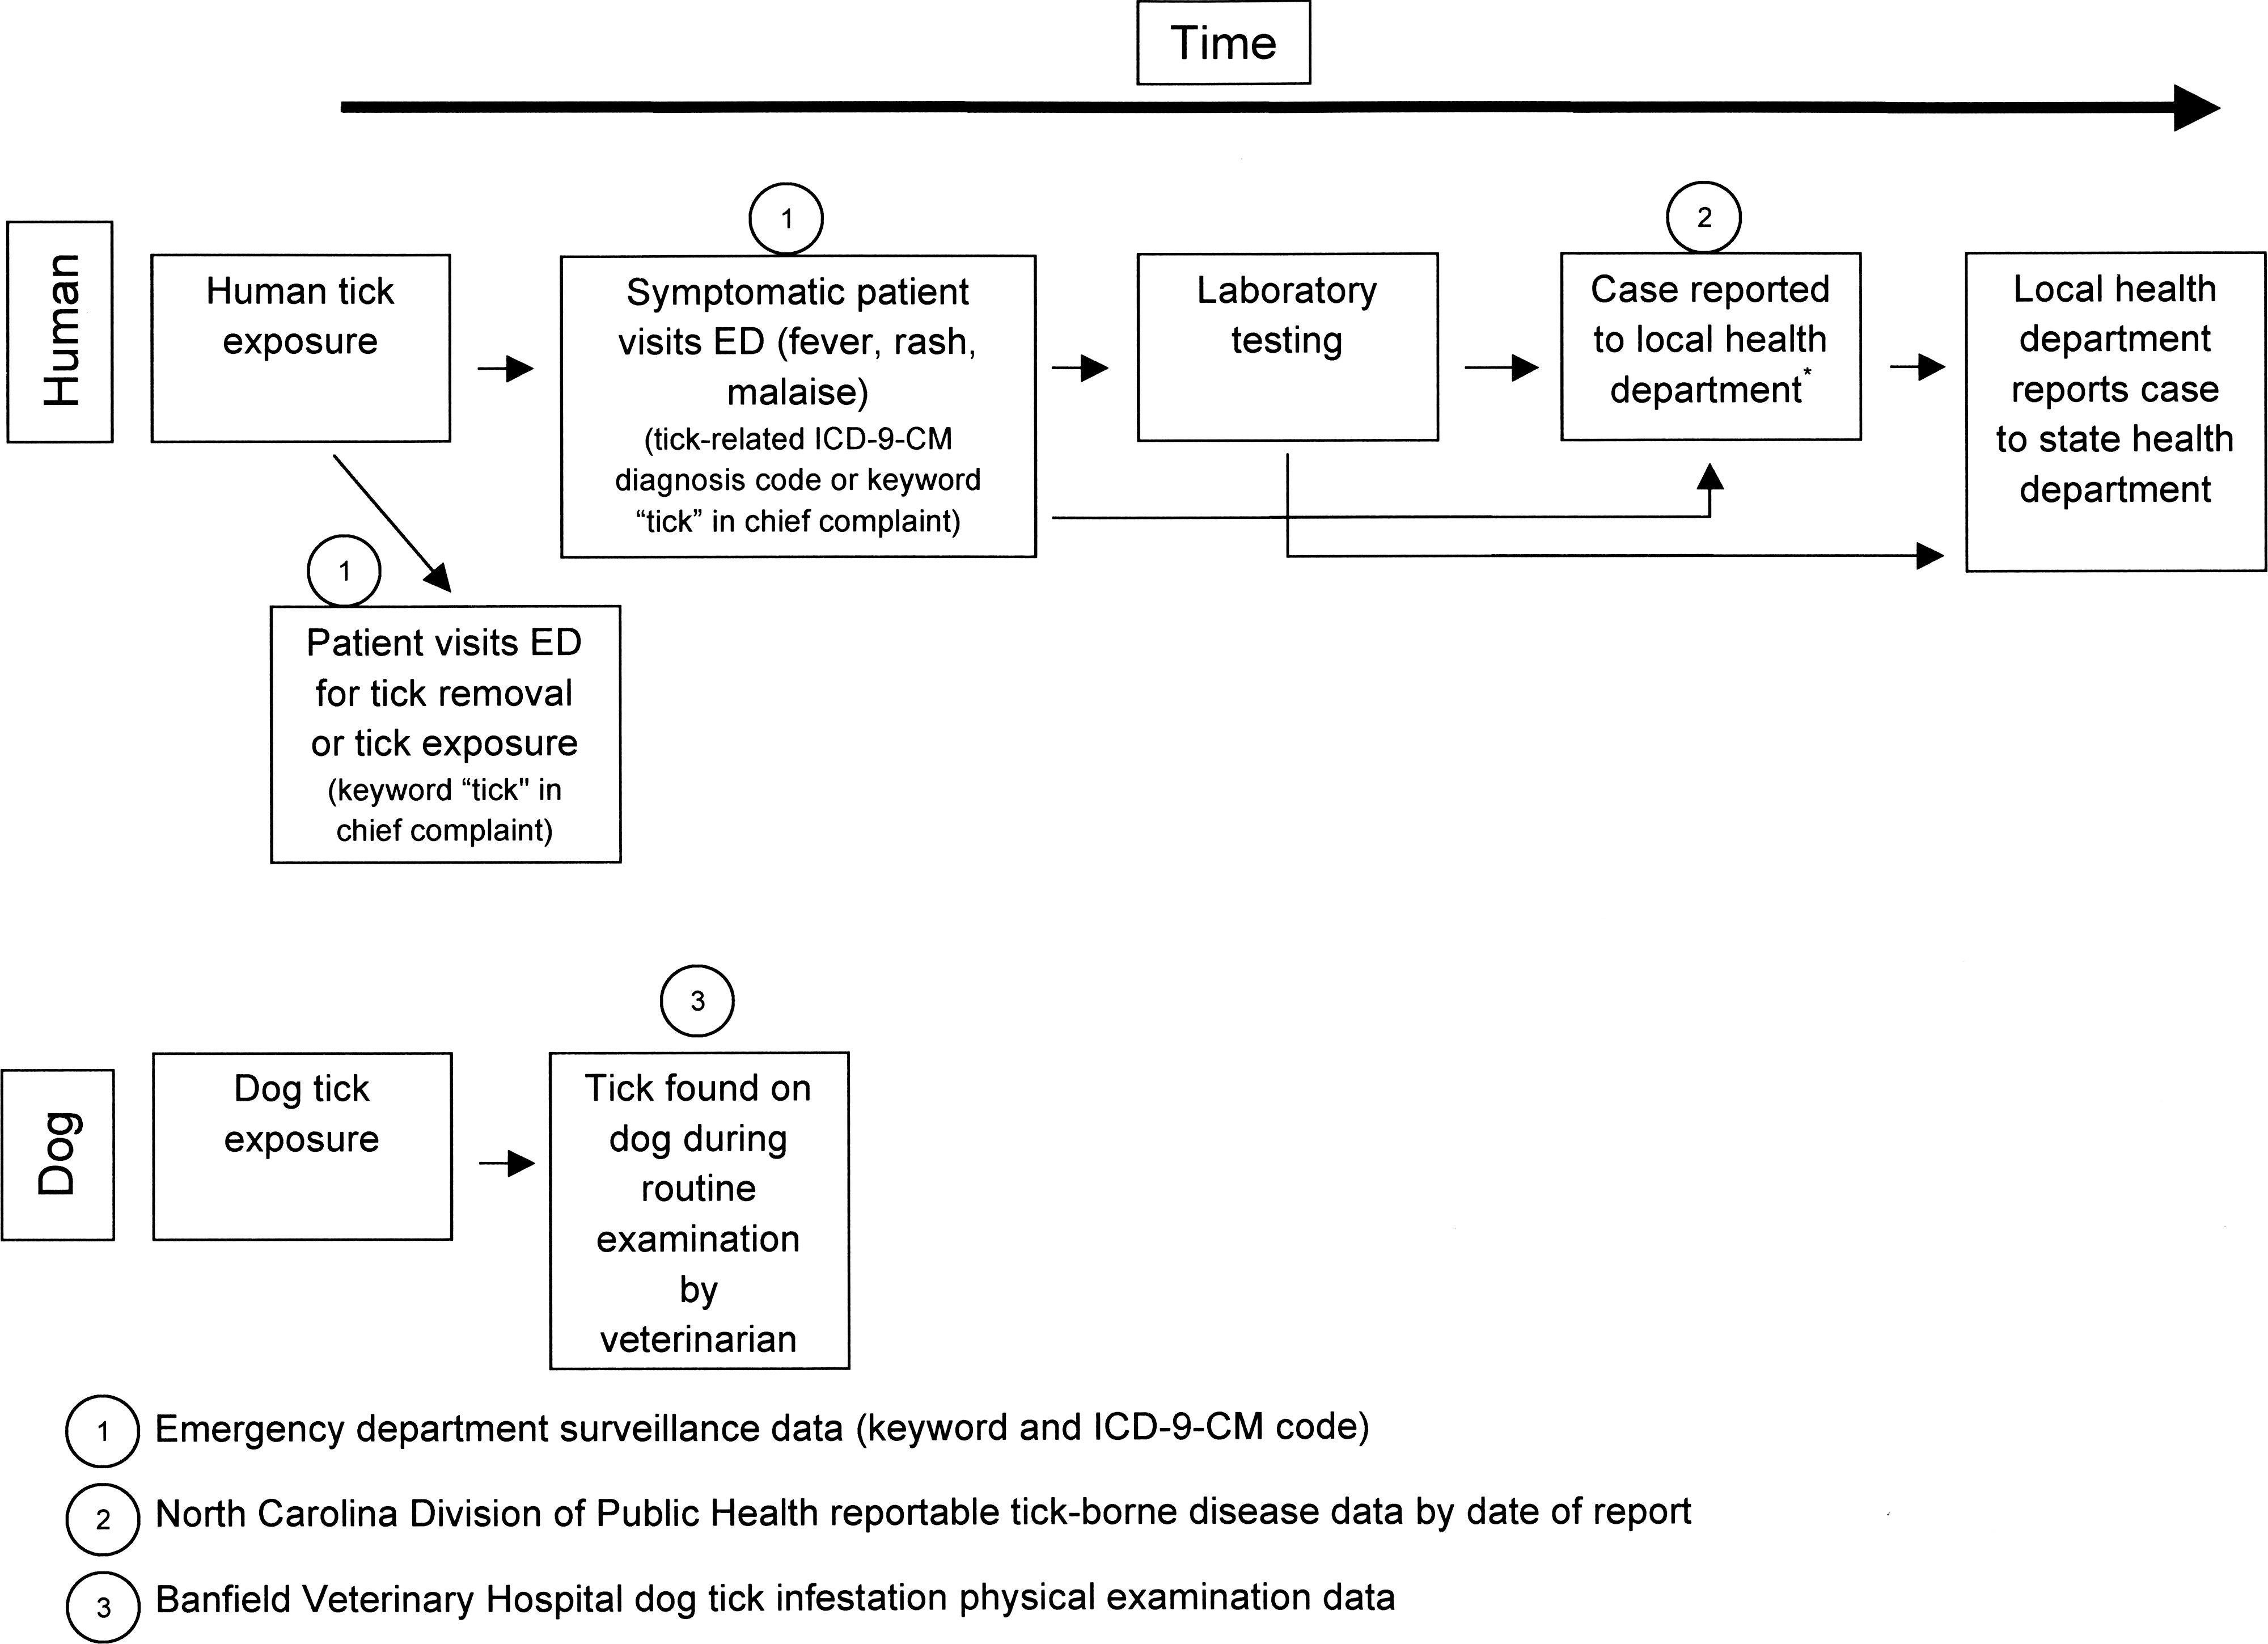
Schematic of tick surveillance data used in this study: NC DETECT ED visits with keyword “tick” in the chief complaint or with tick-related ICD-9-CM diagnosis code, cases of tick-borne disease (Lyme disease, Rocky Mountain spotted fever, and ehrlichiosis) reported to the NC DPH by date of report, and Banfield veterinary hospital dog tick infestation visits. Schematic does not include tick-borne disease cases in humans seen by providers outside the ED. NC DETECT, North Carolina Disease Event Tracking and Epidemiologic Collection Tool; ED, emergency department; ICD-9-CM, International Classification of Diseases, 9th Revision, Clinical Modification; NC DPH, North Carolina Division of Public Health.
One source of human medical data was the North Carolina Disease Event Tracking and Epidemiologic Collection Tool (NC DETECT). NC DETECT is a statewide, Web-based, public health surveillance system developed by the Carolina Center for Health Informatics at the University of North Carolina at Chapel Hill in collaboration with the NC DPH (North Carolina Disease Event Tracking and Epidemiologic Collection Tool 2009). It currently utilizes daily electronic reports of patient visits from 115 of 116 EDs in North Carolina. In 2006 and 2007, NC DETECT received data on ∼2.9 and 3.8 million patient visits, respectively (∼92% of visits made to North Carolina EDs) (Hakenewerth et al. 2009).
ED patient visits made by North Carolina residents in the years 2006 and 2007 and included in NC DETECT data were eligible for inclusion; residency in the study was based on the patient's self-reported home county. A second data set for this study was obtained using a keyword text search to identify patient visits containing the word “tick” in either the chief complaint or the triage notes (Fig. 1) (Travers and Haas 2004). There were 1053 and 1592 such visits in 2006 and 2007, respectively.
A third data set consisted of NC DETECT ED visits made by North Carolina residents that had a tick-related ICD-9-CM diagnosis code in at least one of the first four diagnosis code fields. These included arthropod-borne hemorrhagic fever (065.0–065.3), other arthropod-borne viral diseases (066.1), tick-borne rickettsioses (082.0–082.4, 082.8, 082.9), other rickettsioses (083.0–083.2, 083.8, 083.9), relapsing fever (tick-bite fever NEC, African-087.1), other arthropod-borne diseases (088.0, 088.8, 088.9), and tick paralysis (989.5). The resulting data set contained 7585 and 7794 visits in 2006 and 2007, respectively.
The fourth and fifth data sets consisted of reports to the NC DPH Communicable Disease Branch in 2006 and 2007 of persons with RMSF, Lyme disease, or ehrlichiosis (human monocytic ehrlichiosis, human granulocytic ehrlichiosis, or undefined ehrlichiosis) (Fig. 1) (Centers for Disease Control and Prevention 2008a, 2009a, 2009b). The incubation periods for RMSF, Lyme disease, and ehrlichiosis are 3 to 14 days, 3 to 32 days (mean 7 to 10 days), and 7 to 14 days, respectively (Heymann 2004). The fourth data set was reported cases, which were listed by the date of onset of clinical signs or symptoms (date of disease onset). There were 734 and 663 such cases with date of onset information available in 2006 and 2007, respectively. The fifth data set was reported cases by date of report to the local health department (date of report). Cases reported to the local health department >90 days after the onset of disease (delayed reports) were excluded, leaving a total of 673 and 613 case reports in 2006 and 2007, respectively, in this fifth data set. In most uses, delayed reports were associated with the time required to obtain final laboratory results.
Geographic regions in North Carolina
North Carolina is divided into three geographic regions, namely, the Coastal, the Piedmont, and the Mountain regions. The Piedmont consists of 35 counties in central North Carolina and is the most populous region with ∼5.3 million people in 2007 (United States Census Bureau 2008). The frequency and distribution of tick-related visits in dogs and humans reflects this population distribution. For example, 27 (90%) of the 30 Banfield veterinary hospitals in North Carolina are located in the Piedmont region. Similarly, in 2006 and 2007, the majority of tick-related ED visits and reported cases of tick-borne disease made to NC DPH occurred in the Piedmont. There were 48 and 53 Piedmont EDs reporting to NC DETECT in 2006 and 2007, respectively. Subsequent analyses were conducted using data only from the Piedmont region.
Data analyses
Data were analyzed using the Centers for Disease Control and Prevention's Early Aberration Reporting System (EARS) software, which detects statistical aberrations with Microsoft Excel version 2 (Centers for Disease Control and Prevention 2006). EARS is a syndromic surveillance system that includes three aberration detection methods, C1-MILD, C2-MODERATE, and C3-ULTRA. These methods are similar to the cumulative sum (CUSUM) method for aberration detection and are so named because of their increasing sensitivity to detect an aberration in surveillance data (Fricker et al. 2008). Sensitivity is measured relative to a baseline period from which a moving sample average and sample standard deviation are derived (Hutwagner et al. 2005a, 2005b). C3, the least sensitive method for detecting an aberration, uses a 7 days' baseline and calculates the positive differences from the mean for the last 3 days. A C3 flag is produced when its current value is >2 standard deviations above the calculated baseline mean.
In the present study, algorithms from EARS were used to detect aberrations in the human and veterinary medical data that might indicate an increase in underlying tick activity. Years were analyzed consecutively. For each year and each data set, the week of the first C3-ULTRA aberration signal was determined. The first occurrence in a given year of a C3-ULTRA flag was considered to be the first aberration signal for that year. C3 was the chosen method because of its usefulness in flagging aberrations that increase steadily over relatively short periods of time, similar to the recognizable seasonal pattern of the incidence of tick-borne disease (Hutwagner 2005a).
NC DPH reportable tick-borne disease data by date of disease report were considered as the surveillance reference for estimating increases in tick activity. The first C3 aberration signal each year using the date of report data was compared to the date of EARS signals generated by the four other veterinary and human data sets. Data were analyzed by week. Real-time (prospective) surveillance using reportable disease data by date of disease onset is not possible, since date of onset is unknown until the time of case report. However, date of onset data can be used to determine the average delay between onset of clinical signs and the report of cases to the local health department.
The Institutional Review Board of the University of North Carolina determined that this study was exempt from full review due to the exclusive use of de-identified data.
Results
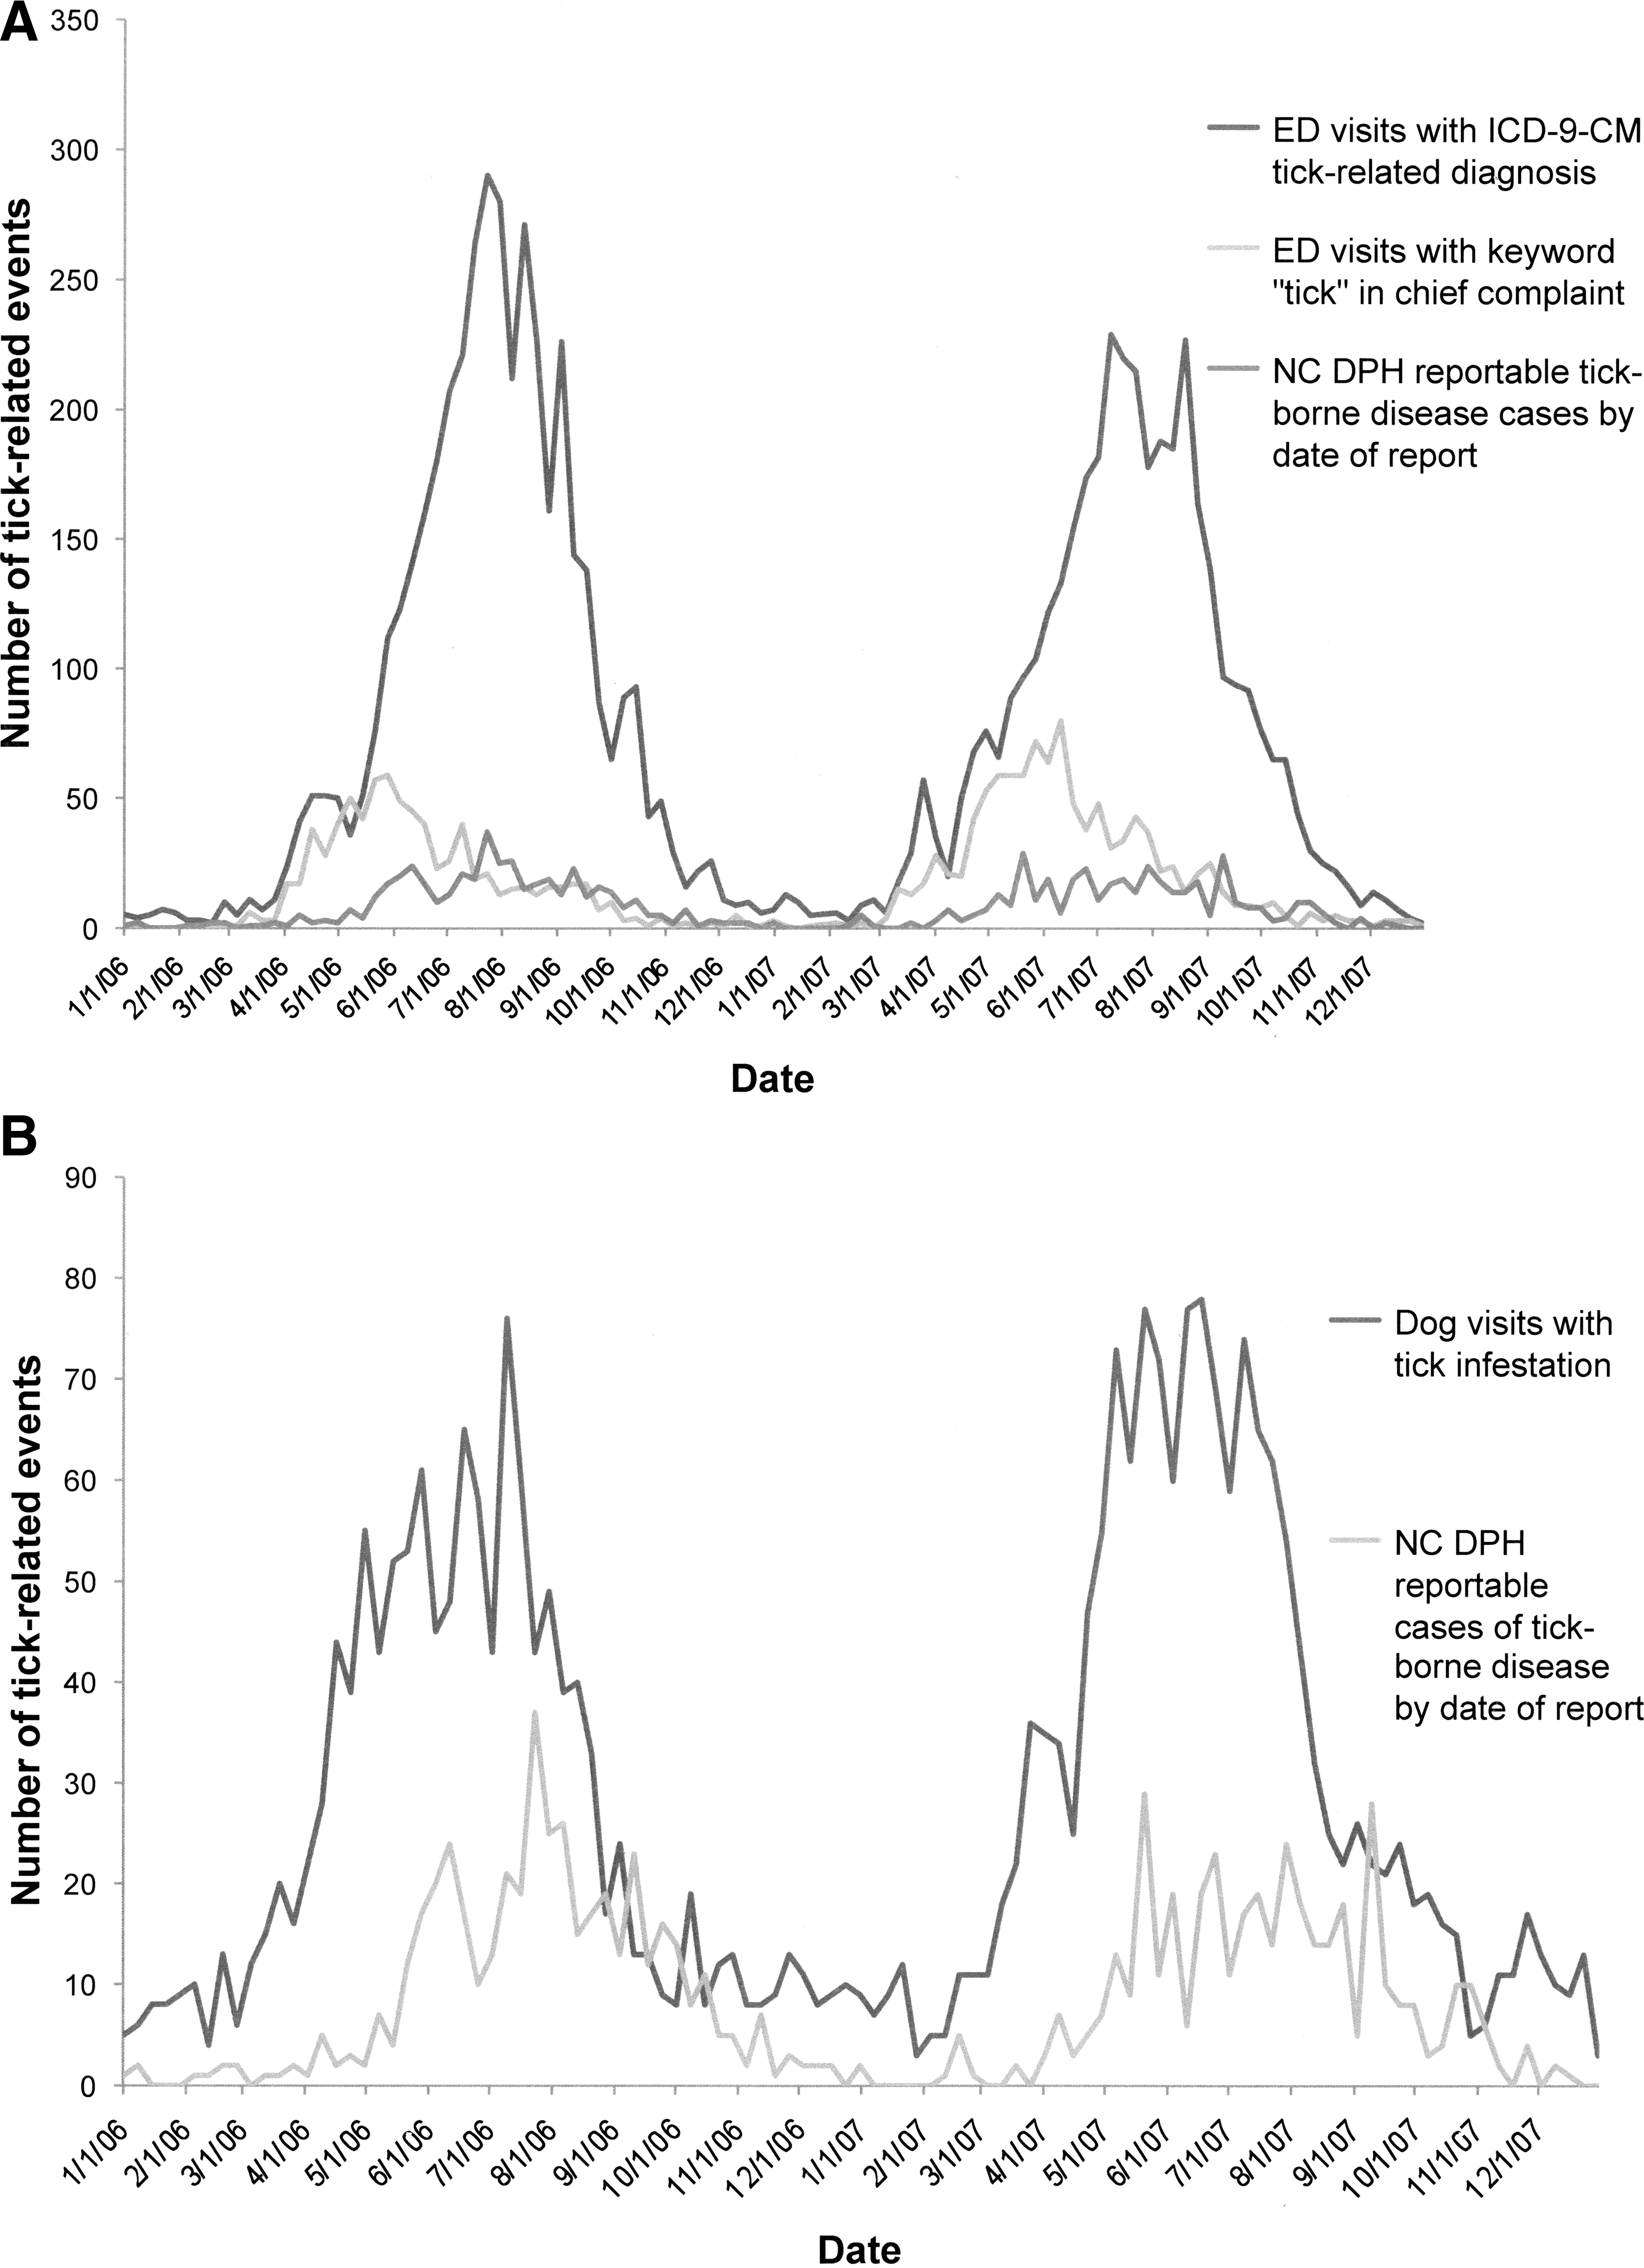
Epidemic curves of tick-related health events by week in central North Carolina for each of the five data sets demonstrated a similar pattern. The number of events increased in the spring, peaked in early to mid-summer, and decreased through the fall season (Fig. 2a, b). In 2006, the data sets that first reached their yearly maximums were ED keyword “tick” visits in humans and reported tick-borne diseases by date of disease onset in late May, followed by number of dog visits with tick infestation in early July and ICD-9-CM tick-related ED visits and reported tick-borne diseases by date of report in late July. In 2007, the highest number of reported human tick-borne diseases by date of report occurred with a first peak in late May, followed by yearly peaks of ED keyword “tick” visits, dog visits with tick infestation, and a first peak in reported cases of tick-borne disease by date of disease onset in early to mid June. The number of ICD-9-CM tick-related diagnoses peaked in 2007 in early July.
Comparison of tick-related health events: (
The first C3 EARS aberration signal in 2006 occurred the week of March 5 for ED visits with a tick-related chief complaint (one visit) (Table 1). The ED visits with an ICD-9-CM tick-related diagnosis (11 visits) and the tick infestation dog visit data (15 visits) generated an aberration signal next during the week of March 12, 2006. The NC DPH reportable tick-borne disease data by date of disease onset signaled on March 26, 2006 (five cases), whereas reportable disease data by date of report did not signal until April 9, 2006 (five cases). The following year the ED and dog data signaled the same week of March 11 (ED chief complaint: 15 visits; ED ICD-9-CM: 18 visits; dog tick infestations: 18 visits). The NC DPH reportable tick-borne disease data by date of disease onset signaled on March 25 (nine cases); however, reportable disease data by date of report did not signal until April 8, 2007 (seven cases).
Reported as the date of the Sunday of that week.
Early Aberration Reporting System, Centers for Disease Control and Prevention.
Cases meeting surveillance case definition for confirmed and probable cases of Lyme disease, Rocky Mountain Spotted Fever, and ehrlichiosis (human monocytic ehrlichiosis, human granulocytic ehrlichiosis, and other ehrlichiosis).
North Carolina Division of Public Health.
North Carolina Disease Event Tracking and Epidemiologic Collection Tool.
Emergency department.
International Classification of Diseases, 9th Revision, Clinical Modification.
Number of weeks before (−) EARS signal of the NC DPH reportable disease data by date of disease report.
NC DPH reportable disease data by date of disease report were considered as the reference, as it indicates the date of earliest possible disease detection using traditional surveillance methods. Therefore, this date was used to determine the number of weeks gained (−) or number of weeks preceding disease report in the case of onset data when using other sources of data for disease surveillance and calculation of the EARS signal.
EARS, Early Aberration Reporting System (Centers for Disease Control and Prevention); NC DPH, North Carolina Division of Public Health; NC DETECT, North Carolina Disease Event Tracking and Epidemiologic Collection Tool; ED, emergency department; ICD-9-CM, International Classification of Diseases, 9th Revision, Clinical Modification.
In 2006, human ED visit chief complaint data demonstrated an aberration signal 5 weeks before that of the reportable disease data by date of report, whereas ICD-9-CM tick-related diagnosis visits and dog tick infestation data signaled 4 weeks before the reportable disease data on April 9, 2006. The average delay from date of disease onset signal to date of report signal was 2 weeks. In 2007, an aberration signal was noted in the ED visit data and dog tick-infestation data 4 weeks before the April 8th signal noted in the reportable disease by date of report data, whereas the cases by date of disease onset signaled 2 weeks prior.
Discussion
The earliest possible detection of an increase in tick-borne diseases is an important indicator for public health agencies. Early signal detection informs public health education and awareness among veterinary and human healthcare providers. Recently, one public health official in Tennessee noted that “We have no way to measure the tick population. We're getting more reports from citizens saying they're seeing more ticks … but there is no real way to quantify those reports” (Young 2009). The present study addressed this concern by demonstrating the value of routinely monitoring veterinary and human health data collected in near real-time for indicators of tick activity. This approach is cost effective because all data used are already being collected in North Carolina and only merging existing data sets is required. Many states already use EARS to identify aberrations in human ED chief complaint data and ICD-9-CM diagnoses for syndromic surveillance of infectious diseases and possible acts of bioterrorism. Data on tick infestation of dogs may be useful in other geographic areas that have a sufficient number of Banfield veterinary hospitals. An advantage of using the data on tick infestation in dogs for surveillance is that it is not as likely to be influenced by media reporting of tick-borne illness as would human ED data. In addition, ticks could be routinely collected from dogs by veterinarians and submitted to a central laboratory for speciation and pathogen identification. A robust tick surveillance system may help facilitate provider awareness of the potential nonspecific presenting clinical signs and symptoms of tick-borne illnesses (e.g., fever, headache, and malaise), particularly in areas of the country where gaps in provider knowledge have been described (O'Reilly et al. 2003). This may lead to earlier patient diagnosis and treatment with improved patient outcomes, as early treatment of tick-borne diseases, especially RMSF, is critical to improved survival.
In this study, the seasonal pattern of tick-related events in all veterinary and human data sources was consistent over the 2 years studied. An increase in tick-related activity in the late spring followed by a peak in early to mid-summer and a decrease through the fall fits the well-recognized seasonal pattern of tick-borne disease (Centers for Disease Control and Prevention 2008b). In 2006 and 2007, the human ED and dog tick data signaled ∼4 weeks before the date of disease reports.
This use of regularly collected human and veterinary medical data for monitoring tick activity has several limitations. Due to the geographic distribution of Banfield hospitals in North Carolina and the population density distribution in the state, this study was focused on only the Piedmont region. However, variation in tick activity may exist in different geographic areas within a state due to differences in topography, tick habitat, animal reservoirs, and climate. Another limitation is that humans and dogs may have acquired a tick-related problem while traveling outside the area under study. Travel histories were not available for dogs or humans in this study. This could artificially increase the number of tick-related events causing EARS to signal inappropriately if large numbers of animals or humans came to the Piedmont region of North Carolina from areas with higher rates of tick infestations or tick-related diseases. However, a major impact of travel is unlikely.
Conclusions
This study evaluated the use of routinely collected veterinary hospital and human data from hospital EDs to monitor tick activity in North Carolina. It suggests that an increase in tick infestation in dogs and human tick-related ED visits may be detected several weeks before an increase in the onset and report of human tick-related disease to the NC DPH. Climate change affects tick biology and rates of disease transmission, and aberrations or peaks in data may not necessarily occur at the same time each year (Gray et al. 2009). Thus, earlier recognition of a change in frequency or pattern of tick activity in a geographic area would be beneficial in several ways. The public could be notified of an increased risk of tick-related infections and educated about ways to prevent exposure to ticks and tick attachment, and about the signs and symptoms of tick-borne diseases. Tick prevention behaviors include measures such as use of appropriate acaricides and appropriate clothing when outdoors. Alerts to human healthcare providers would increase their awareness of tick-related illness and encourage timely treatment with highly effective antibiotics such as doxycycline. Finally, veterinarians could be encouraged to educate pet owners about the risk of tick exposures and the value of topical tick preventives.
Footnotes
Acknowledgments
We thank the NC DPH for their support of this project. We also thank Charles Cairns, Frances Shofer, and David Weber, all from the University of North Carolina at Chapel Hill, for expert advice and review of the article.
Disclosure Statement
No competing financial interests exist.