




Abstract
Although raccoons are widely distributed throughout North America, the raccoon rabies virus variant is enzootic only in the eastern United States, based on current surveillance data. This variant of rabies virus is now responsible for >60% of all cases of animal rabies reported in the United States each year. Ongoing national efforts via an oral rabies vaccination (ORV) program are aimed at preventing the spread of raccoon rabies. However, from an epidemiologic perspective, the relative susceptibility of naïve geographic localities, adjacent to defined enzootic areas, to support an outbreak, is unknown. In the current study, we tested the ability of a spatial risk model to forecast raccoon rabies spread in presumably rabies-free and enzootic areas. Demographic, environmental, and geographical features of three adjacent states (Ohio, West Virginia, and Pennsylvania), which include distinct raccoon rabies free, as well as enzootic areas, were modeled by using a Poisson Regression Model, which had been developed from previous studies of enzootic raccoon rabies in New York State. We estimated susceptibility to raccoon rabies emergence at the census tract level and compared the results with historical surveillance data. Approximately 70% of the disease-free region had moderate to very high susceptibility, compared with 23% in the enzootic region. Areas of high susceptibility for raccoon rabies lie west of current ORV intervention areas, especially in southern Ohio and western West Virginia. Predicted high susceptibility areas matched historical surveillance data. We discuss model implications to the spatial dynamics and spread of raccoon rabies, and its application for designing more efficient disease control interventions.
Introduction
Westward spread of the raccoon rabies epizootic was observed (CDC 2000). To contain continued westward expansion of raccoon rabies, the U.S. Department of Agriculture–Wildlife Services (USDA-WS) developed a Cooperative Rabies Management Program, with the participation of affected states and the Centers for Disease Control and Prevention (CDC) as a primary federal partner. A national strategy for raccoon rabies control was developed, based partially on documented successes using of oral rabies vaccination (ORV) in gray foxes and coyotes (USDA-APHIS 2005). The ORV program uses a vaccinia-rabies glycoprotein (V-RG) recombinant virus vaccine that is administered in sachets coated or enclosed within a bait matrix, formulated to attract target animals, and released in the field by hand, helicopter, or fixed-wing aircraft, where consumption of the vaccine-laden bait by raccoons occurs (Linhart et al. 2002). Although the concept of using attenuated live rabies viruses for ORV was developed in the United States, application and success was first demonstrated with foxes in Europe, before later use of V-RG (Pastoret et al. 2004). The ORV program in the United States did not begin until the development of the second-generation recombinant vaccines (i.e., V-RG) and was based on successful vaccination of raccoons with V-RG vaccine in a laboratory setting followed by field trials on raccoons, coyotes, and gray foxes (Slate et al. 2005). As a result of the ORV program activities, an immune barrier was established in states along the western front of the raccoon rabies enzootic area. This strategy had been largely successful in suppressing further spread, although it is associated with a high economic cost (Kemere et al. 2000). The progress of the ORV program has been challenged by breaches of the immune barrier in Ohio and Massachusetts during 2004, requiring emergency contingency actions (German and Herrschaft, 2004, Slate et al. 2009). Reasons for those breaches may include insufficient vaccine coverage and translocation of rabid animals. Inadequate surveillance to determine the absence of the disease, rather than a specific breech of the barrier in Ohio, has also been suggested, in that the disease front may already be established in areas where insufficient surveillance is misclassifying disease presence as breaches (Henderson et al. 2008). Where variation of risk and susceptibility of a given locale for an epidemic is undefined, intervention may be “risk-blind” assuming that all areas are equally susceptible. These factors could lead to excessive intervention in less susceptible areas or under vaccination in areas with higher risks. Predicting variation in risk in any given space a priori would be useful for directing public health surveillance, and advising more cost-effective intervention.
Previous studies have applied different methods to forecast the risk and spread of raccoon rabies in the United States, as stochastic modeling of spread, mathematical modeling, and trend surface analysis (Childs et al. 2000, Lucey et al. 2002, Smith et al. 2002, Russell et al. 2004). In these studies, major roads, land use, human residence density, and rivers were recognized as factors influencing raccoon rabies spread. Although these factors were acknowledged to either facilitate or slow spread, they were typically not included in the analysis. Smith et al. (2002) adjusted for the effect of rivers and human population in a stochastic model. Rivers were considered by Lucey et al. (2002) for modeling transmission rate with trend surface analysis. Russell et al. (2004) examined the role of rivers in rabies epidemic expansion. In a recent study, the risk for raccoon rabies cases was modeled for the enzootic region of New York State (NYS), an environmentally diverse region with enzootic raccoon rabies. In the NYS model, environmental features, topography, and human population were considered and adjusted for the effect of geographical variation in a large region by including three “latent” variables: latitude, county, and ecoregion (Recuenco et al. 2008). The NYS model was developed as a statistical process using a Poisson regression, to test the effects of the environmental factors and evaluate the unknown effect of the latent variables. The NYS model was used as a unit of analysis to census-track years and included rabies data from NYS during 1997–2003. Further development and data were necessary for use of the NYS model for raccoon rabies prediction, and validate with rabies data from other states affected by raccoon rabies. The availability of data to model raccoon rabies in space has been recently improved by efforts in geocoding locations of raccoon rabies cases to geographical coordinates in many areas across the United States. In cooperation with USDA-WS and state agencies, CDC developed a geographical information system (GIS)-based surveillance system to monitor raccoon rabies (Blanton et al. 2006). In our current study, we tested the ability of the NYS raccoon rabies model to predict raccoon rabies susceptibility in Ohio, Pennsylvania, and West Virginia; evaluated the potential for spread; and compared model predictions with reported cases of raccoon rabies submitted through the GIS-based RabID rabies surveillance system (Blanton et al. 2006).
Methods
Study area
The study area consisted of three adjacent states: Ohio, Pennsylvania, and West Virginia; covering an area of 6536 census tracts (284,728 km2) over three distinct epidemiologic regions a western raccoon rabies-free zone: including most of Ohio and the western part of West Virginia; a central ORV region, 50–150 km wide, where oral vaccination is ongoing, along the Ohio-Pennsylvania borders and the central area of West Virginia; and an eastern region with an established raccoon rabies enzootic, including most of Pennsylvania and the eastern parts of West Virginia (Fig. 1). Susceptibility was predicted for all three epidemiological regions, and results from the latter two regions facilitated the comparison of forecast susceptibility with observed raccoon rabies spatial distribution for the evaluation of the model.

Epidemiological regions in the study area and land cover categories. (Color images available at
Data collection
Census-tract boundaries and human population data were obtained from the Census 2000 (US_Census_Bureau 1994). The human population density of each census tract was calculated using the area in square kilometers.
Land-use types were extracted from raster data elaborated by the U.S. Geological Survey (USGS) National Land Cover Data 2001, which is based on remote sensing images collected from 1982 to 2006 and processed to obtain a standardized land-use classification (Vogelmann et al. 2001). There were 20 categories of land-use types in the Ohio-Pennsylvania-West Virginia study area. The land-use types were reclassified into 10 categories (Fig. 1): agricultural land (including grasslands/herbaceous, shrub land, orchards/vineyards/other, pasture/hay, row crops, small grains, fallow, and urban/recreational grasses); barren (including bare rock/sand/clay, quarries/strip mines/gravel pits, and transitional); commercial/industrial/transportation; high-intensity residential; low-intensity residential; deciduous forest; evergreen forest; mixed forest; water; and wetlands (including woody wetlands, emergent herbaceous wetlands). This reclassification was necessary to reduce the number of factors being tested to those that are hypothesized to most affect the response variable and to present the land type categories in a way relevant for the study of raccoon rabies. All land types were grouped by similarity, ensuring the relationship with raccoon biology was preserved. Raccoons are often abundant at certain land types (e.g., residential areas) and are less likely to occur in other land types such as barren, industrial, commercial, and transportation land types (Prange et al. 2003, 2004, Recuenco et al. 2008). All land-use type categories resulting from the reclassification were included for the analysis. The total area of each land-use type in the study area was compared with the study area used to develop the NYS model.
Major roads were defined by using the two top categories from the Framework Classification Code (FCC) “codes for roads” as previously described (Recuenco et al. 2008). Geographical data for major roads and river/lakes and census-tract coordinates (latitude/longitude) were extracted from data based on the U.S. National Atlas and Census 2000 (USGS 2003).
We calculated mean elevation of census tracts, meters about sea level, by using National Elevation Data 30-m grid cell resolution, from USGS (USGS 2001).
Data from reported animal rabies cases (geo-referenced to geographical coordinates) were used for model validation. The geographical coordinates of the locations of mammals (nonbat) tested for rabies in Ohio, Pennsylvania, and West Virginia from 2002 to 2006 were extracted from the RabID electronic rabies surveillance system at CDC. Data from this 5-year period were chosen, because it was a data-rich time period. Using that time period was beneficial, because the surveillance system protocols were standardized across the study region, and hence, less likely to cause regional biases (Blanton et al. 2006, Slate et al. 2008). In addition, use of a 5-year period was likely to capture changes in case occurrence corresponding with enzootic waves observed in enzootic areas every 2–4 years (Recuenco et al. 2007). Records were classified as “raccoon rabies cases” and “non-rabid animals.” The data represented the epidemiological surveillance activity in the area and intensity of the epizootic reported over the past 5 years. Since rabies geographic coordinate data were not available for the eastern zone of our study area, in Pennsylvania, we used the data as reported at the county level.
Susceptibility modeling
For this study, raccoon rabies susceptibility was defined as the intensity of the risk, expressed in rabies cases, of a spatially delimited area (census tract), free of the disease, which could experience a raccoon rabies outbreak (one or more cases in animals). The intensity of the risk can be considered as a factor influencing the establishment of a detectable enzootic cycle (established circulation of the raccoon rabies virus variant in an area) after the introduction of the virus into that geographic space. Areas enzootic for raccoon rabies were also included in the study because model validation was a goal of our study. The variation of raccoon susceptibility for rabies, measured with the predicted number of raccoon rabies cases per square kilometer, was modeled with a modified equation from a Poisson regression, adjusted for over-dispersion and for large-scale geographic variation, as previously described (McCullagh and Nelder 1989). The model was developed considering disease dynamics in the natural state with no ORV intervention (Recuenco et al. 2008).
The experimental unit of analysis was the human census tract, which is designated by the U.S. Census Bureau as divisions of counties (US_Census_Bureau 1994). These spatial units are appropriate for structuring data in this analysis, because they are relatively stable geographical units over long periods of time. For our modeling, the outcome variable was the expected number of cases of raccoon rabies among nonvolant animals. Modeling included all such mammals from regions where only the raccoon rabies virus variant circulates, excluding other rabies virus variants. From the four states involved, skunk rabies virus variants were reported only in a few southern central counties of Ohio, all of which were excluded from analysis. In the enzootic areas in NYS (model data source), West Virginia, and Pennsylvania (source of data for validation), no other nonbat rabies virus variants were reported. The resolution of the original NYS model was at the level of geographical coordinates. The independent variables were the percentage of land-use types at the census tract level, human population density in the census tract (people/km2), presence of major roads within or along the boundaries of the census tract (yes/no), presence of river/lakes within or along the boundaries of the census tract (yes/no), mean land elevation (meters), and census tract centroid latitude. Selection and justification for model variables have been previously described (Recuenco et al. 2008). Succinctly, human population was included to adjust for reporting bias due to population concentrations, and also to account for the effect of human population densities in attracting raccoons (Atkinson and Molesworth 2000, Prange et al. 2003, 2004). Rivers, lakes, and major roads were included to account for the effect of topographic barriers that can limit raccoon populations and spread of rabies (Lucey et al. 2002, Smith et al. 2002, Prange et al. 2003). Elevation was included to reflect the limited range of elevation in which raccoon populations live (Owen 2003). Latitude was included to control for the geographical variation observed in large regional spatial analysis and to account for the north south gradient previously reported in the spread of raccoon rabies (Childs et al. 2001, Recuenco et al. 2007). The modifications to the original model introduced for this study were the inclusion of average land elevation instead of the elevation of the census-tract centroid, and the reclassification of the forested land-use type into three types of forest: deciduous forest, evergreen forest, and mixed forest. In the original NYS study, the forest was considered as the background land-use type, whereas in the current model, we consider the agricultural land-use type as the background, allowing inclusion of the forest classification to account for potential differences in raccoon habitat by type of forest. Variables such as county and ecoregion included in the original NYS model were excluded from our analysis, because they are not common to larger study areas, meaning that the county and ecoregion categories for NYS are not the same for the study area. All other variables and all land-use type categories were retained in the predictive model adjusted for this study, disregarding statistical significance because of its relevance to raccoon rabies ecology. The Poisson regression was re-fit to the NYS data using the selected variables to create a new model equation for our study. The equation used for our study was as follows:
logPred=logArea+7.0928−1.9424Water+1.2490LIR+2.4308HIR+0.7414CIT−0.4717DF+0.7129EF−0.9334MF+3.4941BR−11.7073WT−0.0039EL−0.2405L+0.3133Road+0.2635RL−0.003Pop Pred: expected number of cases Area: area of census tract in km2
Water: percentage of the area covered with water LIR: percentage of the area covered with low-intensity residential land type HIR: percentage of the area covered with high-intensity residential land type CIT: percentage of the area covered with commercial/industrial/transportation land types DF: percentage of the area covered with deciduous forest EF: percentage of the area covered with evergreen forest MF: percentage of the area covered with mixed forest BR: percentage of the area covered with barren land type WT: percentage of the area covered with wetlands EL: elevation above sea level in meters L: latitude in decimal degrees Road: presence of major roads (FCC) within or along census tract boundaries RL: presence of river and/or lakes within or along census tract boundaries Pop: Population per km2
The original NYS model excluded areas with ORV and adjusted for the exposure of census tracts adjacent to ORV areas. In developing the equation for this study, we included the exposure term (Yes=1, No=0) to re-analyze the original NYS data. However, when applying the equation to the study area, we considered all census tracts in the study area as “not exposed” to ORV; therefore, the ORV exposure term was dropped to ensure that the resulting susceptibility map represented more closely the naïve expected response of a census tract for a raccoon rabies virus infection. This procedure was used also to compare our modeled response as “naïve” with areas already characterized as enzootic and evaluate the ability of our model to predict the relative intensity of raccoon rabies in the current enzootic areas. The intensity can vary from low to very high, and we assumed that the differences in cases per area predicted reflect the variation in the conditions (covariates) for affecting outbreak intensity when raccoon rabies is introduced for the first time in a naïve area.
To build the susceptibility map, the census tracts in the study area were stratified by quartiles by using the expected number of raccoon rabies cases per square kilometer. Quartiles were used to categorize susceptibility rank by census tract within the studied region. Quartile classification was selected as the method to stratify the risk, because it is more systematic and grades the risk by its intensity. Such strata provide flexibility for comparison with future studies in other regions with potentially different range of values due to variation in the distribution of ecological variables included in the model. The susceptibility strata were named: low (Q1), moderate (Q2), high (Q3), and very high (Q4).
Model validation
We used two methods to validate the model, Kernel densities and a spatial scan statistic. Kernel density grids were created with the observed raccoon rabies cases for 2002–2006. Kernel density is a spatial method that calculates densities of events per area, smoothing the results and interpolating values to obtain the concentration variation across a grid surface (Silverman 1986). The Kernel density grids were created to identify areas of higher concentrations of reported rabid raccoons in the two enzootic study regions compared with the susceptibility predicted by our modeling to validate the model.
Rabies case data at geographical coordinate levels are not available for most of Pennsylvania, so we used the raccoon rabies cases aggregated cases by county from the national rabies surveillance system. We allowed the reduction in the precision of the analysis implied by aggregating data because of the lack of point data in Pennsylvania and to keep the large enzootic areas of Pennsylvania within the study area. Spatial analysis for Pennsylvania included all available nonbat rabies cases reported from 1990 to 2006 for all counties in the state. The raccoon rabies cases were assigned to the county centroid to create a Kernel density grid and to apply a spatial scan statistic to find statistically significant clusters using the county as the unit of analysis. The spatial scan statistic is a moving window that changes size across a region searching for statistically significant clusters in space, time, or a combination of both, calculating maximum likelihood ratios for each window and choosing the most likely cluster after performing Monte Carlo simulations, along with possible secondary clusters (Kulldorff 1997). The Poisson approach in SaTScan calculates clusters compared with a population. Due to the unavailability of raccoon and other animal population data, for our analysis we used the area of the census tract as a proxy. Given that the study area is large, a maximum window search size of 15% of the area was chosen, to limit detection to small- and medium-size clusters (Pfeiffer 2008). The spatial scan statistic was not applied to the entire study region, because Ohio is not enzootic and there are insufficient data available to aggregate by county.
Results
The most abundant land-use type for West Virginia and Pennsylvania was deciduous forest. The second most abundant was agricultural landuse, similar to the distribution to the NYS area, which was used as source for the model. In Ohio, the inverse was observed. The most abundant land-use type was agricultural land, followed by deciduous forest (Table 1). The variability of the proportion of land-use types across census tract was similar between Ohio and Pennsylvania, and somewhat similar to the NYS area. West Virginia's land-use type proportion for deciduous forest is the largest among all land-use types and states in the study, other than that the variability in West Virginia is similar to NYS (Fig. 2). Across epidemiological regions defined in the study, deciduous forest and low-intensity residential were the most dominant land types for the census tracts in the enzootic and ORV regions, whereas the rabies-free regions were agricultural and low-intensity residential (Table 2). Major roads were present in a majority of census tracts in all epidemiological regions, and somewhat less than half of the census tracts in all epidemiological regions contained parts of a river or lakes (Table 3).
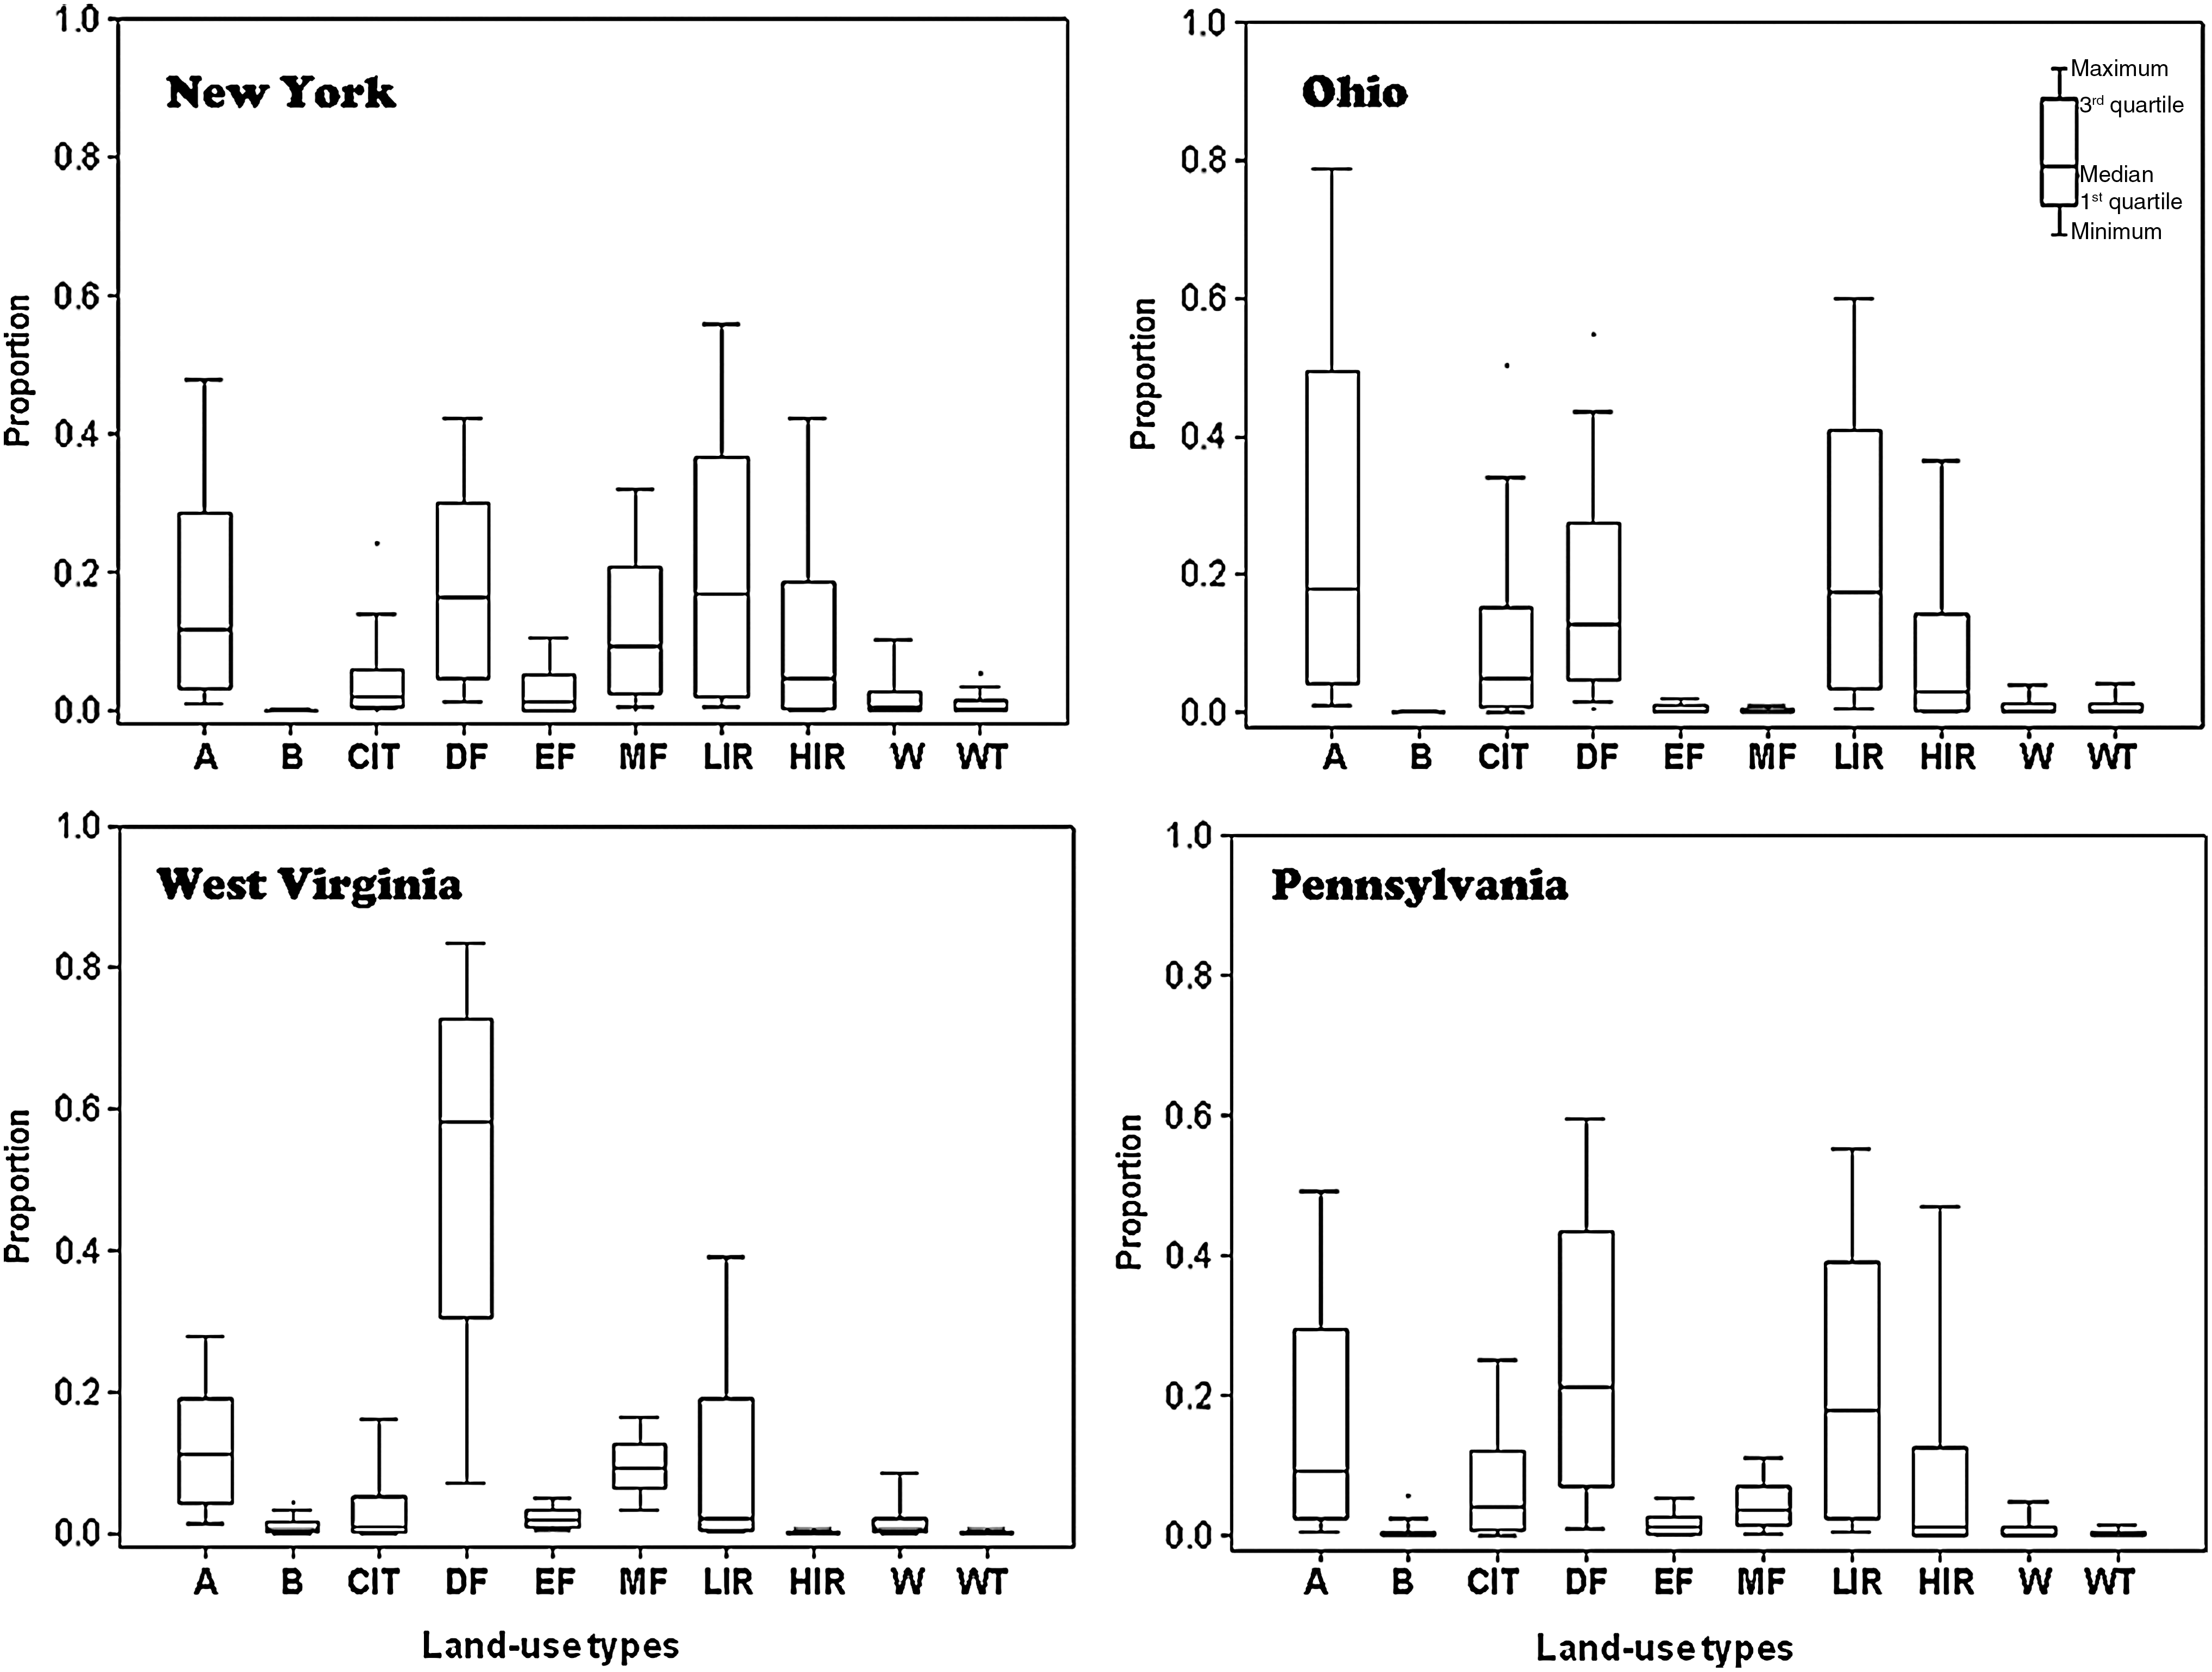
Variability in the proportion of land-use types across census tracts in New York, Ohio, Pennsylvania, and West Virginia. Land-use types: A, agricultural; B, barren; CIT, commercial-industrial-transportation; DF, deciduous forest; EF, evergreen forest; MF, mixed forest; LIR, low intensity residential; HIR, high intensity residential; W, water; WT, wetlands.
Includes only the area used to build the original model.
Values at county level were used due to lack of surveillance data at census-tract level in the Enzootic Zone at Pennsylvania.
n=census tracts.
n=54=counties, for the raccoon rabies cases and terrestrial animals tested.
ORV, oral rabies vaccination.
n, census tracts; ORV, oral rabies vaccination.
Of the study area, 60.7% (174,242 km2) was found to have low susceptibility to raccoon rabies; 30.6% (87,831 km2), moderate susceptibility; 7.1% (20,296 km2), high susceptibility; and 1.6% (4569 km2), very high susceptibility. In the raccoon rabies-free region, only 31% (35,882 km2) of the area was found with low susceptibility, opposite to that observed in the ORV (87.5%), and enzootic regions (76.4%). The rabies-free region contained about four times the proportion of moderate susceptibility compared with the enzootic region, and similar proportions for the combined high and very high susceptibility areas (Table 4).
n, number of census tracts.
The western raccoon rabies-free region of the study area contained large areas of moderate susceptibility for raccoon rabies, lying close to the current ORV intervention areas in West Virginia and continuing into southern Ohio and the western edge of the study region. Those areas of moderate susceptibility enclosed most areas of high and very high susceptibility with the exception of the concentrated high and very high-risk areas located in Cleveland, Ohio, in the northeast corner of the region. Approximately half of this high susceptibility region around Cleveland lies in the raccoon rabies-free zone, and the other half is included in the ORV-immune barrier area. The low susceptibility census tracts of the raccoon rabies-free zone were concentrated in the central and northeastern part of Ohio (Fig. 3).
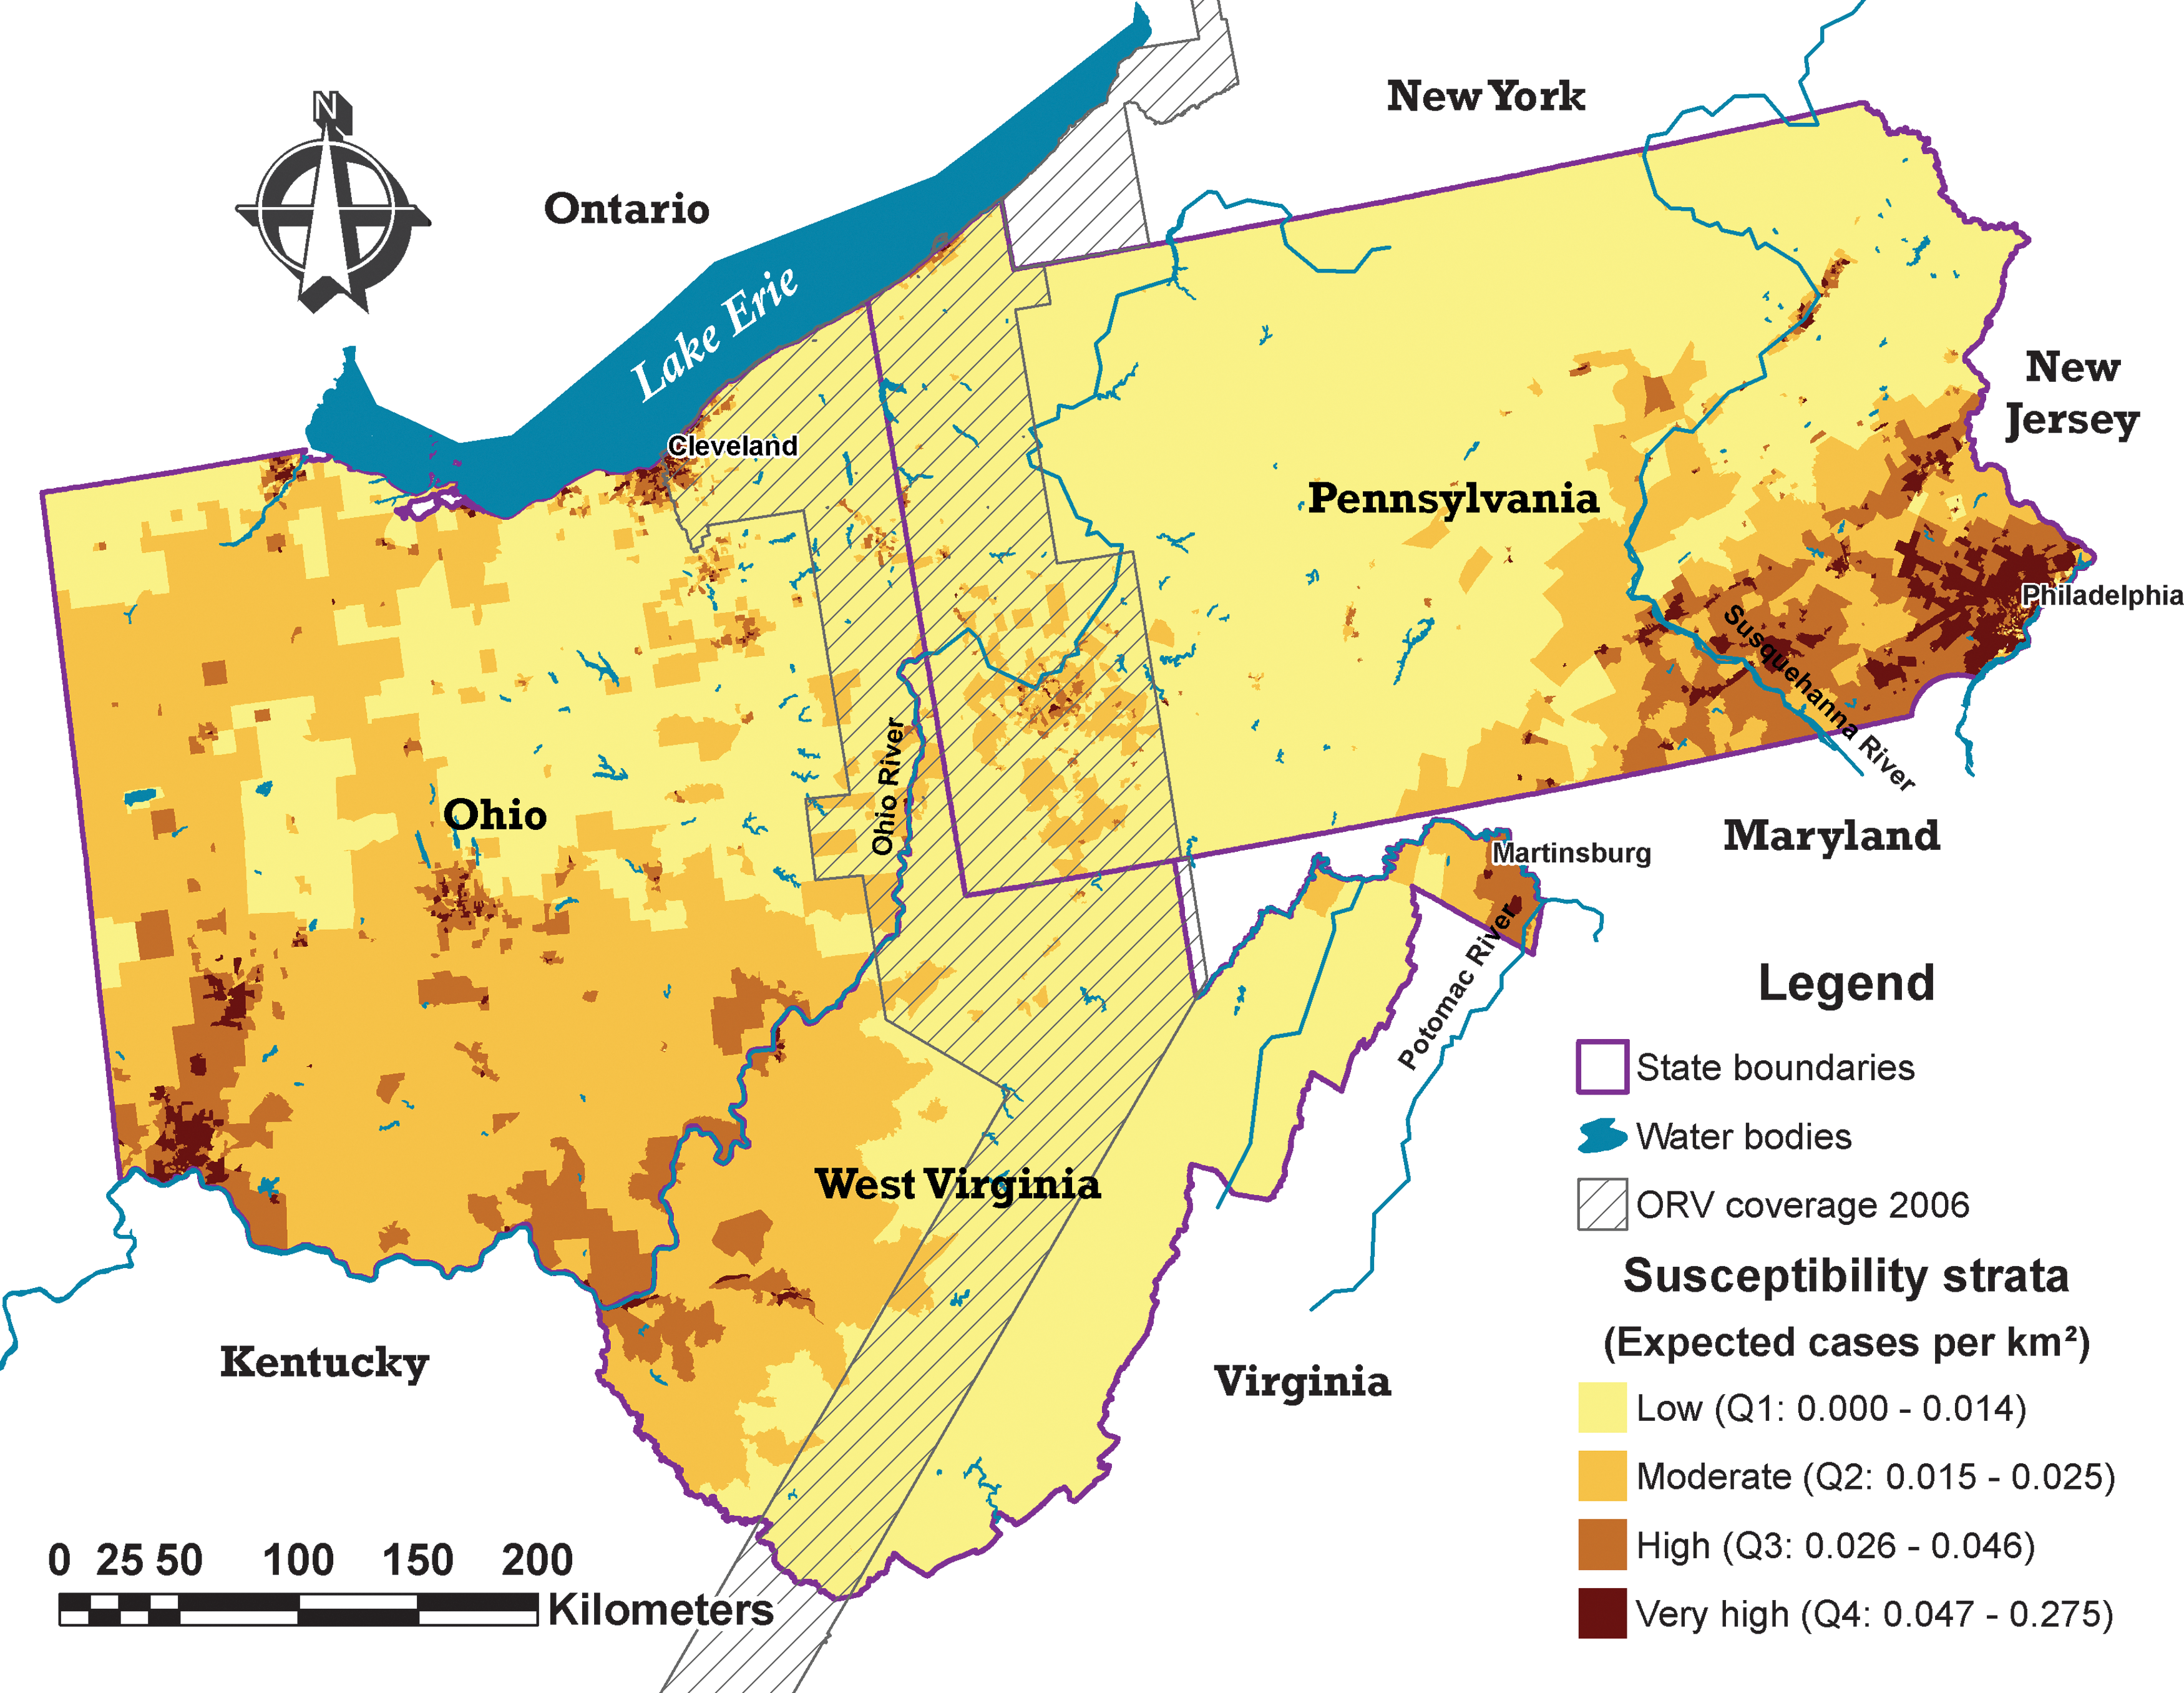
Susceptibility map for Ohio, Pennsylvania, and West Virginia, United States. Susceptibility strata based on the predicted number of cases/km2 grouped by quartiles. Q1, low susceptibility; Q2, moderate susceptibility; Q3, high susceptibility; Q4, very high susceptibility. (Color images available at
Most of the ORV-immune barrier area had census tracts with low rabies susceptibility. There were also some moderately and highly susceptible census tracts located in the southwest corner of Pennsylvania and along the Ohio River, and in the most northern section of West Virginia. Both zones lie at a similar latitude (Fig. 3).
Within the enzootic raccoon rabies zone in the study area, the high and very high susceptibility areas were concentrated in the southeastern corner of Pennsylvania continuing to the northeastern corner of West Virginia, surrounded by limited moderate susceptibility areas. A large continuous low susceptibility zone running vertically from Pennsylvania to West Virginia covers a large section of the raccoon rabies enzootic zone and the ORV zone separating the two largest areas of moderate to high susceptibility observed across the study region.
A significant number of census tracts located in the areas with high raccoon rabies susceptibility of the raccoon rabies-free region had no animals tested from 2002 to 2006; in Ohio, 24.4% (162/664) and in West Virginia, 60.5% (26/43) of census tracts had few or no animals tested for rabies. Census tracts with low concentration of animals tested in areas of high susceptibility and high concentration of animals tested in the largest cities were observed when reports of animals tested were overlaid on the susceptibility map (Fig. 4).
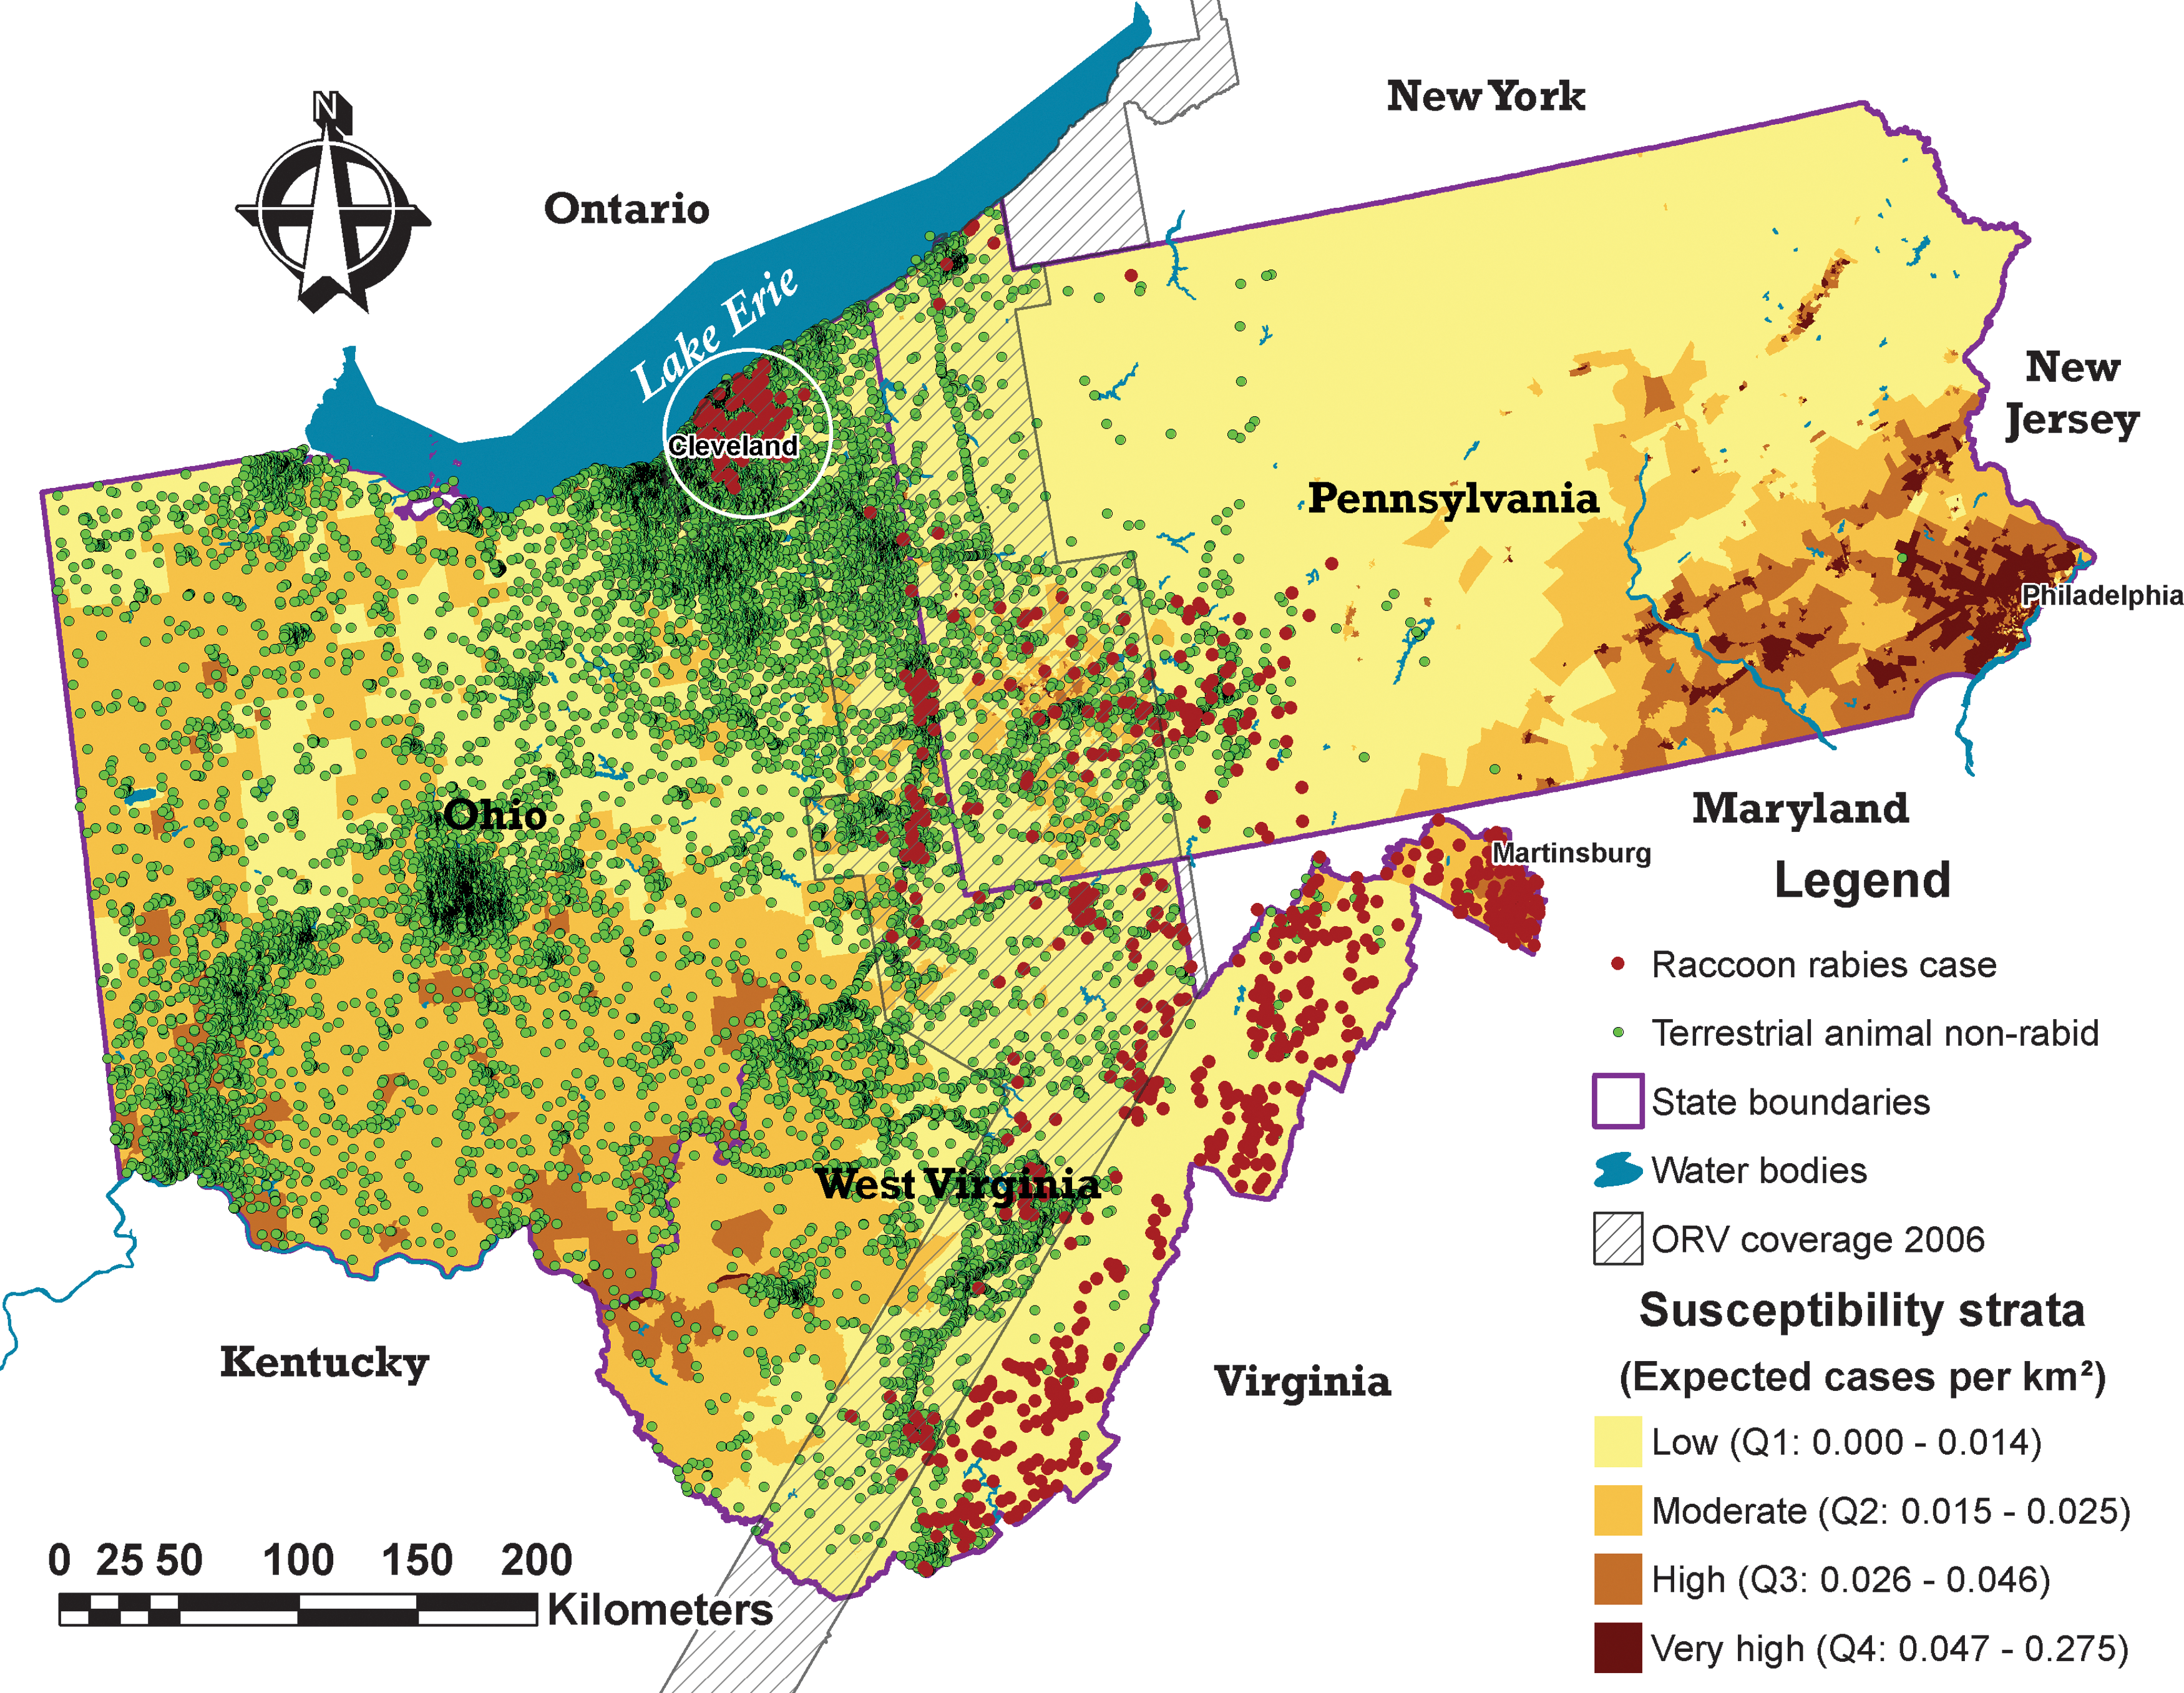
Distribution of relevant animals tested for rabies in the Ohio (OH)-West Virginia (WV)-Pennsylvania (PA) study area, 2002–2006. Data from RabID-CDC at the geographical coordinate level available only for OH, WV, and a part of PA. The circle in the Cleveland area represents the OH 2004 outbreak area. (Color images available at
Analysis of kernel densities found two high raccoon rabies risk clusters, one surrounding Cleveland, Ohio, and the other in Martinsburg, West Virginia (Fig. 5). In the case of Cleveland, the high-risk area was very close to the high and very high susceptibility census-tracts predicted by our model. In the case of Martinsburg, the susceptibility model coincided with the high-risk cluster found with Kernel density analysis (Fig. 5). Kernel densities applied to county level data from Pennsylvania found the highest risk area in Philadelphia (area C, Fig. 5). Cluster analysis with the spatial scan statistic found the most significant cluster in parts of Philadelphia together with an adjacent statistically significant secondary cluster that coincided with most of the predicted areas of moderate to very high susceptibility (Fig. 6).
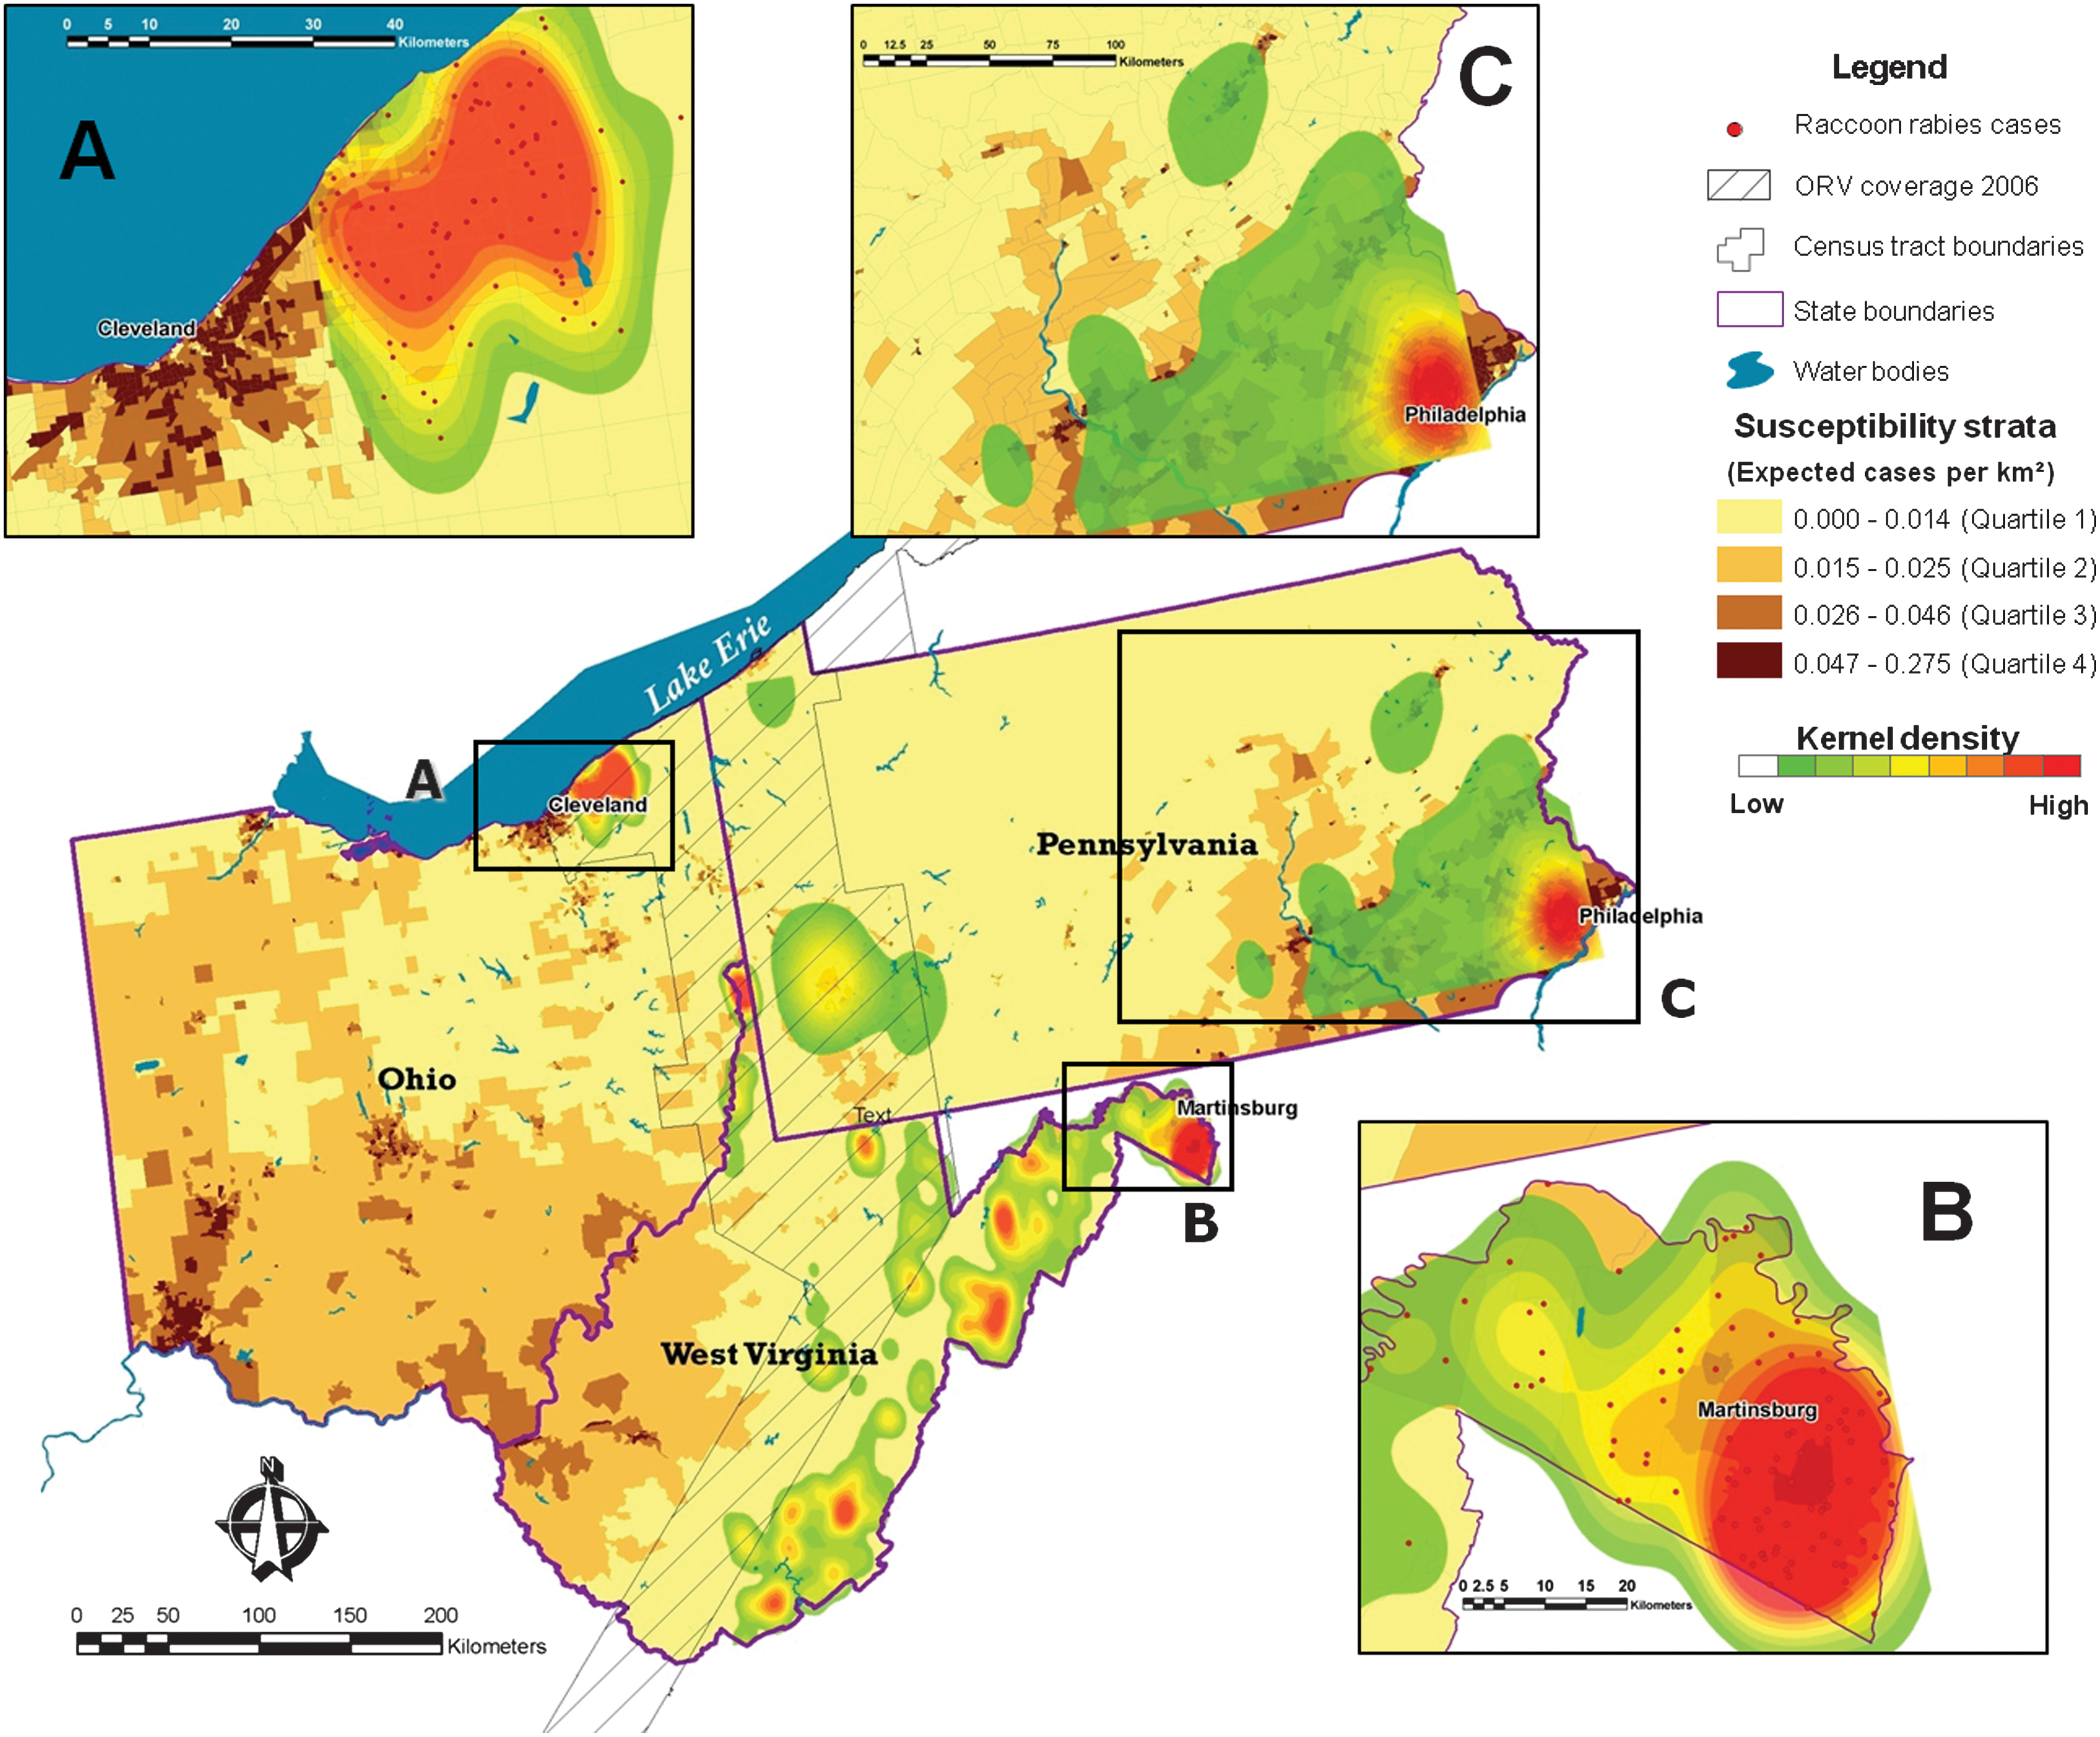
Kernel density analysis for raccoon rabies cases across the Ohio-West Virginia-Pennsylvania study area, 2002–2006, compared with predicted raccoon rabies susceptibility.
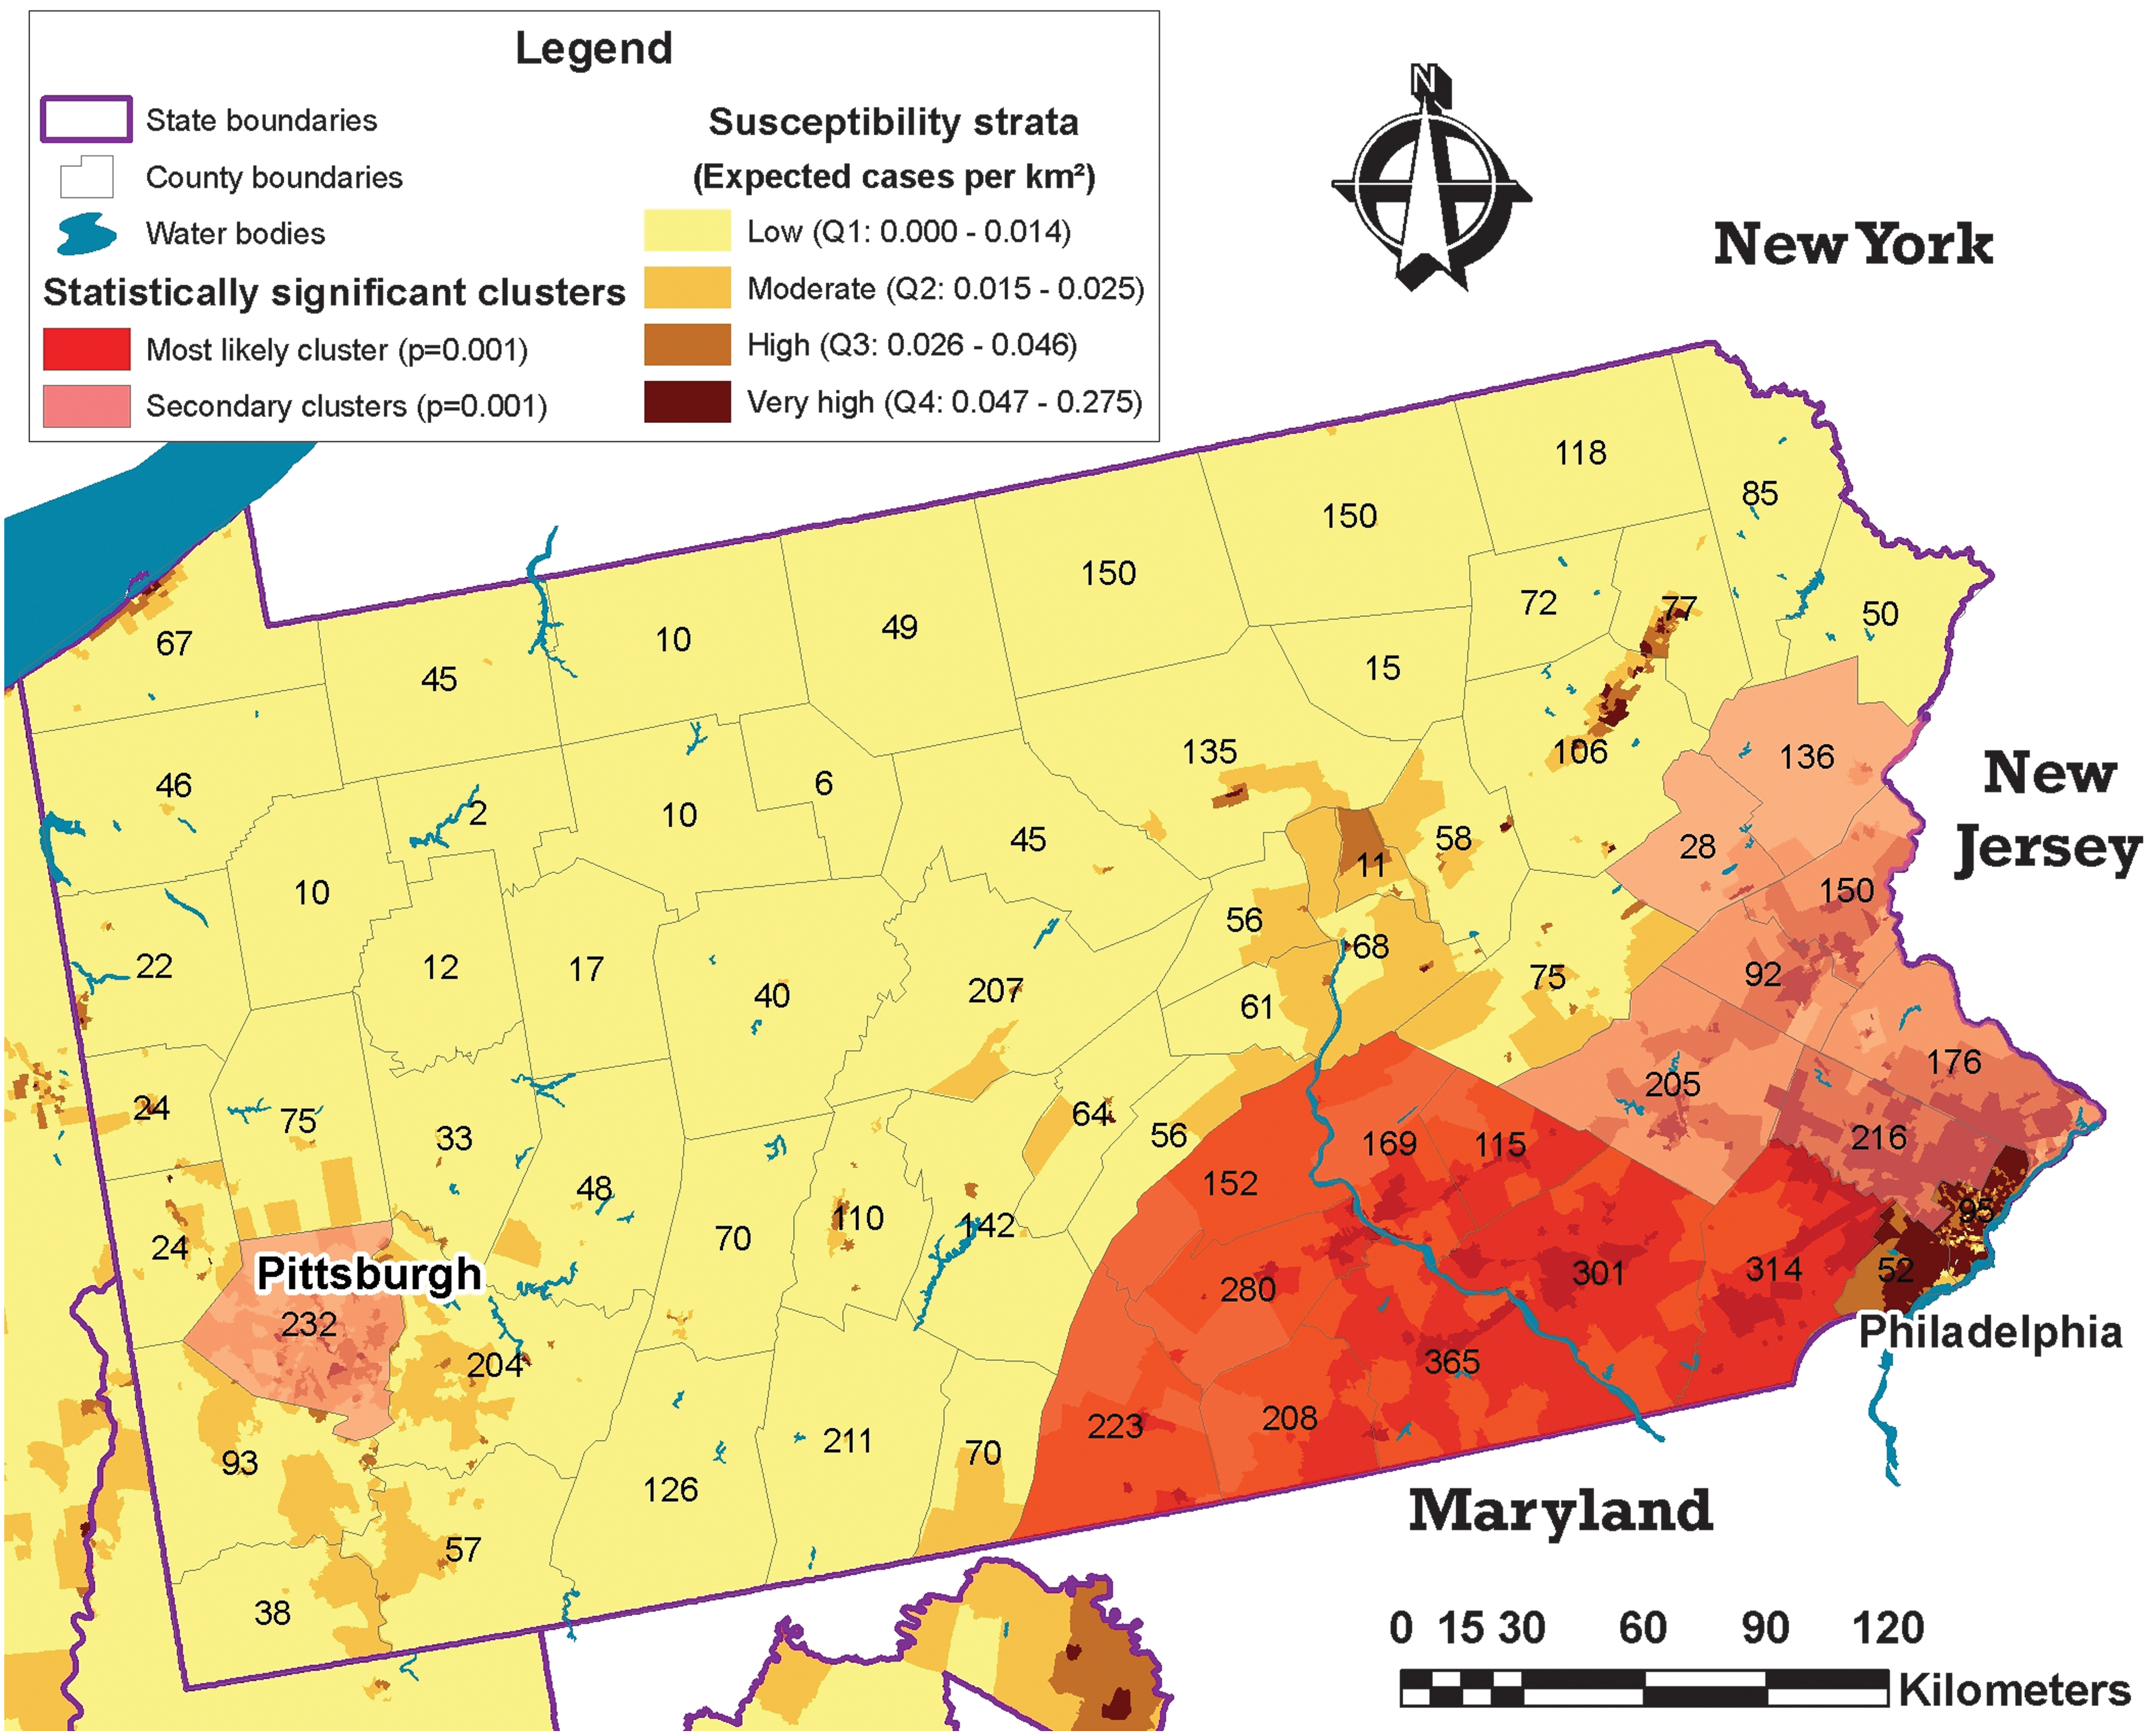
Cluster analysis of raccoon rabies cases at the county level, Pennsylvania, United States, 1990–2006, compared with raccoon rabies-predicted susceptibility. Analyses used aggregated data at the county level. The number of raccoon rabies cases is placed at the center of each county. (Color images available at
Discussion
The model tested in our study successfully predicted high raccoon rabies susceptibility for the enzootic regions studied, including part of West Virginia and all of Pennsylvania. Areas predicted to have the highest susceptibility matched areas with high rates of reported rabies recorded by national surveillance systems. Areas with a recent outbreak identified beyond the ORV-immune barrier in Ohio lie in an isolated area of high susceptibility, surrounded by low susceptibility areas that extend through the center of Ohio (USDA-APHIS 2008).
Our study included spatial methods for validating model results against rabies surveillance data from recent years. Using real events for the validation is an important strength of this study. Although any surveillance system does not capture all cases, the cases detected are assumed to represent the geographical variation of raccoon rabies dynamics across a broad region and are an acceptable source to compare how predicted spatial variation represents reality. Reporting bias due to population concentration may influence the data provided by a surveillance system on rabies dynamics, and adjustments for population concentration helps reduce such unwanted bias. Rabies data used to validate the model originated from surveillance reports from each state in the study. The application of standard rabies surveillance protocols in the states included in the study that comprise field activities, laboratory diagnosis, and reporting minimize biases which are expected from regular surveillance reporting.
The original Poisson regression model is based on NYS rabies spatial dynamics. Although variability in land-use proportion by census tracts has some similarities among the states studied, the configuration of landscape is heterogeneous, and land-use types are diverse across the area. The fact that the model predicted areas of high susceptibility in different states supports its validity and the robustness of the model to be applied to raccoon rabies-free regions. The results reflect that the risk of raccoon rabies spread in Ohio is lowest in its central region and highest in the northern and southern parts of the state. The lower susceptibility predicted by the model in most of Pennsylvania is also supported by the slow spread observed in the state throughout several years, compared with other areas in which the spread was faster (Biek et al. 2007). Another strength of the study is that the model predicted hot spots using two different methods, by kernel densities and also by application of a spatial scan statistic. The spatial scan statistic used in Pennsylvania revealed a non-random concentration of raccoon rabies cases, and at a higher geographic level of analysis for surveillance data. Regarding translocation, although such events are hard to predict, our model can assist in evaluating the expected impact of raccoon rabies translocation once the index case location is known. The presence of mountains also may play a role, as a less-than-ideal raccoon habitat at higher land elevation, and also by creating biological barriers and corridors for raccoon rabies containment. The study areas include the Appalachian Mountains running from southcentral West Virginia to the northeast of Pennsylvania, which are predicted to have a lower susceptibility to rabies. The model may be appropriate for predicting raccoon rabies susceptibility in adjacent areas to current raccoon rabies enzootic regions, including Kentucky, Tennessee, Mississippi, and parts of Alabama. Although the model includes variables to adjust for the geographical variation of landscape, and it had been initially developed from a state with very heterogeneous landscape, applying the model to areas of landscape and ecology very different to NYS may have some limitations. Potential biases may be introduced by landscape configurations that may have not been identified in NYS, such as land types not observed in that part of the country. Further testing with additional models developed with data from different regions will minimize such biases and improve the applicability of the model to other areas.
One of the limitations of the model is the use of census tract areas as a proxy for raccoon populations. This assumes that the density of raccoons correlates with the number of people living in a census tract. Several studies suggest higher raccoon population densities in urban and suburban areas (Prange et al. 2003, 2004). Raccoons may be abundant in other habitats such as those dominated by wetlands and agricultural land (Beasley and Rodes 2008). The model was successful in predicting high-density areas of raccoon rabies cases, but as additional raccoon population data become available, such values can be included for future validations.
After the 2004 raccoon rabies outbreak just described, the Ohio area has been of special interest. Though different in methodology, our results are not concordant with previous analyses. Another study of raccoon rabies in Ohio simulated the spread of a raccoon rabies from an entry point in the same area as the 2004 outbreak, using mathematical modeling methods (Russell et al. 2005). Although that study predicted a faster spread in the middle of Ohio and a delayed spread in the north and the center, our study, using a different methodology, implied the opposite situation, assuming spread would be slower in lower susceptibility regions and vice versa in high susceptibility regions. Several factors may explain the difference in the results. First, our study included more environmental covariates, whereas Russell et al. (2005) only adjusted for the presence of rivers. Second, in our study, the original model was built on point data scale aggregated to the census tract level, whereas the earlier study used township level data. Census data are preferable, because they correspond with the population size and this standard is used countrywide, whereas a township is a political division that is used only in a part of the country, and its size may be arbitrary (US_Census_Bureau 2002). Finally, our model predicts the susceptibility for each census tract independently of one another. Essentially, this means that modeling sections of a region or modeling the entire region will not change the result at the census tract scale, whereas the previously developed model will produce a simulation of the spread, depending on the adjacent spatial units, which vary according to the locality chosen as an entry point.
The Ohio 2004 outbreak was initially hypothesized to be a breach of the ORV barrier, with serious implications regarding the efficacy of the program (Slate et al. 2009). A more recent paper studied phylogenetics of raccoon rabies detected in the 2004 Ohio outbreak and concluded that the outbreak was probably not a breach, but rather suggested that raccoon rabies had been circulating undetected for a longer period of time in a restricted area with little or no spread to adjacent areas (Henderson et al. 2008). Such results are congruent with our model of the Cleveland area in Ohio, where the 2004 outbreak was detected. This region represented an isolated area of high susceptibility surrounded by the lowest susceptibility area predicted by the model used in our study. This factor may be an explanation for the restricted or very slow spread observed in that area as well as the lower probability of detecting a case relying solely on passive public health surveillance before the epizootic detection in 2004.
The results of our analysis suggest that ORV program activities are likely to be more cost efficient in their current location, because the ORV-immune barrier lies in an area of low susceptibility. Hence, lower ORV bait densities may be possible to halt rabies spread when the ORV barrier is located in low susceptibility areas compared with what would be needed if located in higher susceptibility areas. The current success of the ORV program is supported by our data.
Our results provide a method to assess raccoon rabies surveillance activities, identifying areas with moderate to high susceptibility, where fewer animals have been tested for rabies. In the absence of other means to forecast rabies risk in the event of a translocation of rabid animals into a raccoon rabies-free region, the maps produced in our study can assist local and state health departments to target rabies surveillance and more efficiently manage outbreaks and minimize spread. For example, regions with a high susceptibility for raccoon rabies might require less diagnostic testing of animals to detect a case than a region with low susceptibility.
The model presented can provide usable products to improve basic rabies surveillance and plan control programs. However, the model needs to be tested using raccoon population estimates in smaller areas to further confirm several assumptions. Unfortunately, these estimates are not widely available for large regions of the United States.
Predicting disease risk for wildlife is challenging, because accurate large-scale population data on different animal species are not readily available, and an ideal understanding of the biology, disease dynamics, and determinants of the reservoir species is necessary to achieve more usable results related to disease emergence, spread and perpetuation. Raccoon rabies research and surveillance in the last two decades have provided the foundation in which the model covariate selection was based. Adjusting the model to other rabies reservoirs will have limitations but merits the effort for places or countries in which rabies surveillance is poor or absent.
Footnotes
Acknowledgments
The authors acknowledge staff at the NYS Department of Health for data used in the model building, and staff at the Ohio Health Department, Pennsylvania Department of Health, West Virginia Department of Health and Human Resources, and the USDA-Wildlife Services for data contributed to the RabID surveillance web-based system used in this study.
Disclosure Statement
No competing financial interests exist. The findings and conclusions in this article are those of the authors and do not necessarily reflect the position of CDC.